Developing Co-current and Counter-current Spray Drying ...
159
Louisiana State University LSU Digital Commons LSU Doctoral Dissertations Graduate School 2015 Developing Co-current and Counter-current Spray Drying Computational Fluid Dynamics (CFD) Simulation Studies to Predict the Quality of Microencapsulated Fish Oil with Egg White Hydrolysates Powders Kevin Estuardo Mis Solval Louisiana State University and Agricultural and Mechanical College, [email protected] Follow this and additional works at: hps://digitalcommons.lsu.edu/gradschool_dissertations Part of the Engineering Science and Materials Commons is Dissertation is brought to you for free and open access by the Graduate School at LSU Digital Commons. It has been accepted for inclusion in LSU Doctoral Dissertations by an authorized graduate school editor of LSU Digital Commons. For more information, please contact[email protected]. Recommended Citation Mis Solval, Kevin Estuardo, "Developing Co-current and Counter-current Spray Drying Computational Fluid Dynamics (CFD) Simulation Studies to Predict the Quality of Microencapsulated Fish Oil with Egg White Hydrolysates Powders" (2015). LSU Doctoral Dissertations. 295. hps://digitalcommons.lsu.edu/gradschool_dissertations/295
Transcript of Developing Co-current and Counter-current Spray Drying ...
Louisiana State UniversityLSU Digital Commons
LSU Doctoral Dissertations Graduate School
2015
Developing Co-current and Counter-current SprayDrying Computational Fluid Dynamics (CFD)Simulation Studies to Predict the Quality ofMicroencapsulated Fish Oil with Egg WhiteHydrolysates PowdersKevin Estuardo Mis SolvalLouisiana State University and Agricultural and Mechanical College, [email protected]
Follow this and additional works at: https://digitalcommons.lsu.edu/gradschool_dissertations
Part of the Engineering Science and Materials Commons
This Dissertation is brought to you for free and open access by the Graduate School at LSU Digital Commons. It has been accepted for inclusion inLSU Doctoral Dissertations by an authorized graduate school editor of LSU Digital Commons. For more information, please [email protected].
Recommended CitationMis Solval, Kevin Estuardo, "Developing Co-current and Counter-current Spray Drying Computational Fluid Dynamics (CFD)Simulation Studies to Predict the Quality of Microencapsulated Fish Oil with Egg White Hydrolysates Powders" (2015). LSU DoctoralDissertations. 295.https://digitalcommons.lsu.edu/gradschool_dissertations/295
DEVELOPING CO-CURRENT AND COUNTER-CURRENT SPRAY DRYING
COMPUTATIONAL FLUID DYNAMICS (CFD) SIMULATION STUDIES TO
PREDICT THE QUALITY OF MICROENCAPSULATED FISH OIL WITH
EGG WHITE HYDROLYSATES POWDERS
A Dissertation
Submitted to the Graduate Faculty of the
Louisiana State University and
Agricultural and Mechanical College
in partial fulfillment of the
requirements for the degree of
Doctor of Philosophy
in
The Interdepartmental Program in
Engineering Science
by
Kevin Estuardo Mis Solval
B.S., Escuela Agrícola Panamerica, El Zamorano, 2008
M.S., Louisiana State University, 2011
May 2015

ii
Dedicated to
GOD
iii
ACKNOWLEDGEMENTS
My special and sincere gratitude goes to Dr. William B. Richardson, Chancellor of the
Louisiana State University (LSU) Agricultural Center (AgCenter) who financially supported my
education at LSU. Without his support, my time at LSU would not have been possible.
Also, I would like to express my deepest gratitude to my major professor and dear friend Dr.
Subramaniam Sathivel for his support and guidance in every little matter throughout the entire
time that I have been at LSU; his advice has helped to become a better person and professional.
I want to thank my committee members, Dr. Joan M. King, Dr. J. David Bankston, Dr.
Marybeth Lima, Dr. Louis J. Thibodeaux, and Dr. Kenneth Fasching-Varner for their valuable
time to serve on my committee, and for their unconditional help and advice on the conduction of
this project. Thank you so much! Special thanks go to the staff of the LSU-AgCenter
Biotechnology Lab for this help in the SDS-PAGE and amino acid analysis. My studies and
research at LSU would not have been the same, without the charm and joy of my Zamorano
friends: M. Moncada, F. Vaca, A. Soto-Vaca, J. Charal, J. Marenco, A. Castro, K. Carabante, D.
Torrico, L. Alfaro and lab mates in the Food Engineering group: A. Chotiko, J. Lee, J. Zhang, L.
Espinoza, A. Chouljenko, V. Reyes, F. Bonilla, C. Galindo, and C. Gurdian. Special thanks to
my wife Deborah Xavier-Mis for her unconditional love and support. Nothing would be
completed without showing my gratitude and love to those ones who brought me to this world,
my beloved parents Luis Mis Morales and Maria Solval; who altogether with my brother Alvaro
Luis and my sister Maria Jose have encouraged and supported me with their love during my life.
Especial thanks to all the people in the departments of Biological and Agricultural Engineering,
Food Science, and Engineering Science at LSU for their help and support. And those ones I did
not mention above, but who assisted in the countless hours spent in this project; thank you!
iv
TABLE OF CONTENTS
ACKNOWLEDGMENTS .....................................................................................................iii
LIST OF TABLES .................................................................................................................vii
LIST OF FIGURES ...............................................................................................................viii
ABSTRACT ...........................................................................................................................xi
CHAPTER 1 - LITERATURE REVIEW ..............................................................................01
1.1 Dietary protein ................................................................................................................01
1.1.1 Table eggs as a source of high quality protein ...........................................................02
1.1.2 Branched chain amino acids (BCAAs) ......................................................................03
1.1.3 Protein hydrolysates ...................................................................................................03
1.2 Sport supplements ...........................................................................................................09
1.3 Omega-3 fish oil and exercise.........................................................................................10
1.4 Omega-3 PUFA and cancer cachexia .............................................................................12
1.5 Omega-3 PUFA fortified eggs ........................................................................................12
1.6 Microencapsulation technology ......................................................................................13
1.7 Spray drying ....................................................................................................................15
1.7.1 Atomization of liquid feed .........................................................................................16
1.7.2 Feed droplets – drying air contact ..............................................................................16
1.7.3 Moisture evaporation .................................................................................................17
1.7.4 Separation of dried powders ......................................................................................18
1.7.5 Microencapsulation of fish oil by spray drying .........................................................18
1.7.6 Processing challenges in spray drying .......................................................................18
1.8 Computational fluid dynamics (CFD) ............................................................................19
1.8.1 Continuity or conservation of mass equation.............................................................20
1.8.2 Momentum equation ..................................................................................................20
1.8.3 Energy equation .........................................................................................................20
1.8.4 CFD analysis ..............................................................................................................21
1.8.5 Study of spray drying processing using computational fluid dynamics ....................22
1.8.6 References frames in CFD .........................................................................................23
1.8.7 Air flow patterns ........................................................................................................24
1.8.8 Turbulence models .....................................................................................................24
1.8.9 Particle histories .........................................................................................................25
1.8.10 Drying air-particle interaction....................................................................................25
1.8.11 Particle temperature ...................................................................................................28
1.8.12 Particle residence time distribution (RT) ...................................................................29
1.9 References .......................................................................................................................30
CHAPTER 2 - EFFECTS OF TEMPERAUTRE, pH, ENZYME-TO-SUBSTRATE RATIO,
AND REACTION TIME ON DEGREE OF HYDROLYSIS OF EGG WHITE
HYDROLYSATES ................................................................................................................38
2.1 Introduction ......................................................................................................................38
v
2.2 Materials and methods .....................................................................................................39
2.2.1 Materials ....................................................................................................................39
2.2.2 Proteolytic activity of proteases .................................................................................40
2.2.3 Preparation of egg white hydrolysates (EWH) ..........................................................40
2.2.4 Experimental design and optimization experiments ..................................................41
2.2.5 Degree of hydrolysis (DH).........................................................................................44
2.2.6 Proximate composition of DALK, DNEU, and DACI ..............................................45
2.2.7 Total amino acid and free amino acid analysis ..........................................................46
2.2.8 Computation of chemical score .................................................................................46
2.2.9 Protein efficiency ratio (PER) ....................................................................................47
2.2.10 SDS-PAGE ................................................................................................................47
2.2.11 Antioxidant activity ...................................................................................................47
2.2.12 Mineral analysis of DEW, DALK, DNEU, and DACI ..............................................48
2.2.13 Statistical analysis ......................................................................................................49
2.3 Results and discussion .....................................................................................................49
2.3.1 Optimization and hydrolysis parameters ...................................................................49
2.3.2 Analysis of the response surfaces ..............................................................................52
2.3.3 Proximate composition ..............................................................................................55
2.3.4 Total amino acid and free amino acid composition ...................................................59
2.3.5 Chemical score ...........................................................................................................60
2.3.6 Protein efficiency ratio (PER) ....................................................................................60
2.3.7 Antioxidant activity ...................................................................................................63
2.3.8 Electrophoresis ...........................................................................................................64
2.3.9 Mineral profile ...........................................................................................................65
2.4 Conclusions ......................................................................................................................67
2.5 References ........................................................................................................................68
CHAPTER 3 - GROWTH KINETICS AND LACTIC ACID PRODUCTION OF Lactobacillus
plantarum NRRL B-4496, L. acidophilus NRRL B-4495, and L. reuteri B-14171 IN MEDIA
CONTAINING EGG WHITE HYDROLYSATES ..............................................................71
3.1 Introduction ......................................................................................................................71
3.2 Materials and methods .....................................................................................................73
3.2.1 Materials ....................................................................................................................73
3.2.2 Preparation of food-grade white hydrolysates (EWH) ..............................................73
3.2.3 Microorganisms .........................................................................................................74
3.2.4 Media composition.....................................................................................................74
3.2.5 Analytical methods ....................................................................................................75
3.2.6 Statistical methods .....................................................................................................76
3.3 Results and discussion .....................................................................................................76
3.3.1 Growth curves ............................................................................................................76
3.3.2 pH ...............................................................................................................................79
3.3.3 Titratable acidity (TA) ...............................................................................................83
3.4 Conclusion .......................................................................................................................84
3.5 References ........................................................................................................................86
vi
CHAPTER 4 - CO-CURRENT AND COUNTER-CURRENT SPRAY DRYING
COMPUTATIONAL FLUID DYNAMICS (CFD) SIMULATION STUDIES TO PREDICT
THE QUALITY OF MICROENCAPSULATED FISH OIL WITH EGG WHITE
HYDROLYSATES POWDERS ............................................................................................88
4.1 Introduction ......................................................................................................................88
4.2 Materials and Methods .....................................................................................................91
4.2.1 Experimental procedure .............................................................................................91
4.2.2 Computational fluid dynamics (CFD) simulation methodology ...............................96
4.3 Results and discussion .....................................................................................................103
4.3.1 Case 1 .........................................................................................................................103
4.3.2 Case 2 .........................................................................................................................131
4.4 Conclusion .......................................................................................................................139
4.5 References ........................................................................................................................140
CHAPTER 5 - CONCLUSIONS ...........................................................................................144
VITA ......................................................................................................................................146
vii
LIST OF TABLES
Table 2.1 Actual and coded values of independent variables at their levels in the Central
Composite Design (CCD) ......................................................................................................44
Table 2.2 – Design and results for the CCD. .........................................................................51
Table 2.3 - Regression coefficients of the full RSM models to estimate DH in ALK, NEU, and
ACI .........................................................................................................................................52
Table 2.4 – ANOVA table of DH affected by temperature, pH, [E:S] ratio and reaction time
during optimization experiment .............................................................................................53
Table 2.5- Proximate composition of the egg white hydrolysates .........................................59
Table 2.6. Total and free amino acid content (mg AA/g Protein) of the egg white hydrolysates
powders ..................................................................................................................................61
Table 2.7. Chemical score of the EWH powders calculated based on the requirements given by
FAO/WHO (1990) .................................................................................................................62
Table 2.8. Protein efficiency ratio (PER) of DEW, DALK, DNEU and DACI ....................63
Table 2.9 Mineral profile of the egg white hydrolysates .......................................................67
Table 3.1. Composition of the fermentation media in the microbial essays ..........................75
Table 3.2. Values of the maximum specific growth (µmax) and maximum cell density (ODmax )
of L. plantarum NRRL B-4496, L. acidophilus NRRL B-4495 (B), and L. reuteri B-14171
cultured in different media .....................................................................................................81
Table 4.1 - Description of the spray-dried powders obtained at different
processing conditions .............................................................................................................93
Table 4.2 - Conditions for the CFD simulation –Case 1........................................................100
Table 4.3 - Conditions for the CFD simulation – Case 2.......................................................101
Table 4.4. Microencapsulation efficiency of spray-dried powders produced at different inlet air
temperatures, feed rates, and spray drying configurations ....................................................123
viii
LIST OF FIGURES
Fig. 1.1 - Schematic representation of a spray drying system ...............................................15
Fig. 1.2 - Spray drying configuration: a) co-current; b) counter-current condition ...............16
Fig. 1.3 - Schematic representation of the droplet temperature curve during spray drying ..17
Fig. 2.1 - Production of dried egg white hydrolysates powders by food-grade proteases .....43
Fig. 2.2 - Response surface (3D) and contour plots (2D) displaying the effect of two variables on
degree of degree of protein hydrolysis (DH) using proteases from Bacillus licheniformis to
produce ALK .........................................................................................................................56
Fig. 2.3 - Response surface (3D) and contour plots (2D) displaying the effect of two variables on
degree of degree of protein hydrolysis (DH) using proteases from Bacillus subtilis to produce
NEU .......................................................................................................................................57
Fig. 2.4 - Response surface (3D) and contour plots (2D) displaying the effect of two variables on
degree of degree of protein hydrolysis (DH) using proteases from Aspergillus oryzae to produce
ACI .........................................................................................................................................58
Fig. 2.5 - DPPH radical scavenging activity (%) (A) and reducing power (B) of the EWH
powders. .................................................................................................................................65
Fig. - 2.6. SDS – Page of EWH powders. See Table 2.5 for a brief explanation of DEW, DALK,
DNEU, and DALK.................................................................................................................66
Fig. 3.1 - Growth of L. plantarum NRRL B-4496 (A), L. acidophilus NRRL B-4495 (B), and L.
reuteri B-14171 (C) measured as optical density (OD600) using different fermentation media
................................................................................................................................................80
Fig. 3.2 - PH of fermentation media during the growth of L. plantarum NRRL B-4496 (A), L.
acidophilus NRRL B-4495 (B), and L. reuteri B-14171 (C) .................................................82
Fig. 3.3 -Titratable acidity of the fermentation media during the growth of L. plantarum NRRL
B-4496 (A), L. acidophilus NRRL B-4495 (B), and L. reuteri B-14171 (C) ........................85
Fig. 4.1 - Determination of drying air velocity and temperature using an anemometer to validate
CFD simulations ....................................................................................................................93
Fig. 4.2 - Three-dimensional pilot scale spray dryer model ..................................................97
Fig. 4.3 - Spray Dryer Chamber: (A) Co-current (CO) configuration, (B) Counter-current (CNT)
configuration, and (C) Computational domain and meshing. ................................................98
ix
Fig. 4.4 - Cyclone separator: (A) 3D model for CFD, (B) Computational domain and
Meshing..................................................................................................................................101
Fig. 4.5 – CFD simulation steps.............................................................................................102
Fig. 4.6 - Predicted and measured drying air velocities at 0.25 and 0.70 m from the ceiling of the
drying chamber of the spray dryer using inlet air temperatures of (A) 130, (B) 150 and (C) 170°C
................................................................................................................................................104
Fig. 4.7 - Predicted and measured drying air temperatures at 0.25 and 0.70 m from the ceiling of
the drying chamber of the spray dryer using inlet air temperatures of (A) 130, (B) 150 and (C)
170°C .....................................................................................................................................107
Fig. 4.8 - Time-temperature (A) and time-velocity (B) profiles of drying air inside of the drying
chamber during the spray drying of a emulsion at 0.50 Kg/h feeding rate and 130°C inlet
temperature under co-current and counter-current conditions ...............................................111
Fig. 4.9 - Time-temperature (A) and time-velocity (B) profiles of drying air inside of the drying
chamber during the spray drying of a emulsion at 0.50 Kg/h feeding rate and 150°C inlet
temperature under co-current and counter-current conditions ...............................................112
Fig. 4.10 - Time-temperature (A) and time-velocity (B) profiles of drying air inside of the drying
chamber during the spray drying of a emulsion at 0.50 Kg/h feeding rate and 170°C inlet
temperature under co-current and counter-current conditions ...............................................113
Fig. 4.11 - Predicted particle residence times inside the drying chamber during co-current and
counter-current spray drying (A) Minimum values, (B) Average values, and (C) Maximum
values .....................................................................................................................................115
Fig. 4.12 - Simulated particle trajectories based on their diameter (m) inside the drying chamber
in co-current and counter-current spray drying configurations at 130°C inlet air temperature.
................................................................................................................................................116
Fig. 4.13 - Time-temperature profiles of drying particles during the spray drying of an emulsion
at 0.50 Kg/h feeding rate and 130 (A), 150 (B) and 170°C (C) inlet air temperature under co-
current and counter-current conditions ..................................................................................118
Fig. 4.14 - Predicted and experimental moisture content of powders dried at different inlet air
temperatures in co-current and counter-current spray drying configurations. .......................120
Fig. 4.15 - Time-moisture fraction profiles of drying particles during the spray drying of an
emulsion at 0.50 Kg/h feeding rate and 130 (A), 150 (B) and 170°C (C) inlet air temperature
under co-current and counter-current conditions ...................................................................121
Fig. 4.16 - Experimental water activity (aw) of powders dried at different inlet air temperatures
in co-current and counter-current spray drying configurations .............................................122
x
Fig. 4.17 - Experimental peroxide value of powders dried at different inlet air temperatures in co-
current and counter-current spray drying configurations. ......................................................124
Fig. 4.18 - Experimental TBARS value of powders dried at different inlet air temperatures in co-
current and counter-current spray drying configurations. ......................................................127
Fig. 4.19 - Predicted and experimental particles sizes of powders dried at different inlet air
temperatures in co-current and counter-current spray drying configurations. .......................127
Fig. 4.20 - Scanning Electron Micrographs of microencapsulated powder dried at different inlet
air temperatures in co-current spray drying configurations ...................................................129
Fig. 4.21 - Scanning Electron Micrographs of microencapsulated powder dried at different inlet
air temperatures in counter-current spray drying configurations ...........................................130
Fig. 4.22 - Drying air flow patterns inside the spray dryer’s cyclone separator at different inlet air
temperatures ...........................................................................................................................132
Fig. 4.23 - Drying air velocity inside the spray dryer’s cyclone separator ............................134
Fig. 4.24 - Predicted pressure inside the spray dryer’s cyclone separator .............................136
Fig. 4.25 - Time - Particle size distribution profile inside the spray dryer’s cyclone ............138
xi
ABSTRACT
Eggs are an excellent source of high quality protein containing all essential amino acids
(EAA) including leucine. Food-grade protein hydrolysates can enhance the growth of lactic acid
bacteria (LAB). Thermal degradation of bioactives normally occurs during microencapsulation
by spray drying. Spray drying modeling using computational tools is essential to engineer new
food powders and to minimize and thermal degradation of bioactives.
The first chapter of this work discusses the optimization of an enzymatic process in terms of
reaction temperature, pH, enzyme:substrate ratio, and reaction time using a response surface
methodology (RSM) to produce food-grade protein hydrolysates from egg whites (EWH).
Resulting EWH produced with proteases from Aspergillus oryzae contained all EAA and showed
high antioxidant activity.
The EWH were evaluated as a nitrogen source in MRS media for the growth of L. plantarum,
L. acidophilus, and L. reuteri. MRS containing EWH had similar performance to that of
conventional MRS and produced higher cell yields and better quality of biomass than MRS
containing dried egg white proteins.
Three-dimensional computational fluid dynamics (CFD) simulations were performed to
study the effect of co-current and counter-current spray drying configurations on the quality of
microencapsulated fish oil with EWH powders in the last section of this work. Also, the
separation of powder particles from drying air at the spray dryer’s cyclone separator was
evaluated using CFD.
CFD models predicted the drying air flow pattern, particle histories including temperature,
residence times (RT), moisture content and particle size of the microencapsulated powders.
Predicted moisture content of powders was lower than measured values; however, the predicted
xii
mean particle sizes were similar to the measured values. Lower lipid oxidation and
microstructure degradation was observed in emulsions dried at 130°C inlet air temperature at
feeding rates of 1.0 Kg/h and under counter-current spray drying conditions. The 3D-CFD model
predicted lower RT (s) for emulsions dried in counter-current compared to co-current spray
drying configurations.
The study demonstrated that EWH can be enzymatically produced and can be used as an
effective nitrogen source in MRS media. Also, 3D-CFD spray drying modeling can be
effectively used to study the moisture evaporation and to predict the final quality of spray dried
powders.
1
CHAPTER 1- LITERATURE REVIEW
1.1 Dietary Protein
Dietary protein is needed for the survival of both humans and animals. The main proteins’
role is to supply adequate amounts of amino acids required by the human body. Moreover, the
nutritional quality of dietary proteins is given by their amino acid composition, ratios of essential
amino acids, susceptibility to hydrolysis during digestion, source and the effects of processing
(Friedman, 1996).
It has been recognized that dietary protein is highly important in athletes and a key
nutritional component in the athlete’s success. Intakes of high quality protein and amino acids is
essential (especially in resistance and team sport athletes) for adequate performance (Tipton &
Wolfe, 2004). According to Maughan, Depiesse and Geyer (2007), many athletes consume
protein supplements to improve muscle growth and to promote muscle recovery after exercise.
The recommended daily allowance (RDA) for protein in the USA is 0.8 to 0.9 g/kg body
weight/day; however, strength athletes may have a 50 – 100% higher RDA protein intake
(Tarnopolsky, 2000).
Usually, conventional foods with a high protein content also contain high amounts of fat
which can create an unbalanced diet for elite athletes (Maughan, Depiesse & Geyer, 2007).
Hence, protein supplements may offer the advantage of providing the protein needs to athletes
without altering their dietary fat intakes and without major changes in their diet.
Most of the protein supplements available on the market are derived from milk proteins
including whey and casein powder, whey protein concentrate and isolate. The protein content of
these products range from 11 to more than 90%, with a lactose content ranging from 0.5 to more
than 75%, and milk fat content ranging from 0.5 to 10% (Hoffman & Falvo, 2004). Products
2
containing proteins extracted from milk may not be suitable for lactose-intolerant individuals due
to their significant lactose content. Eggs are another source of high quality protein. Proteins from
egg white may be better than whey proteins because egg proteins contain all of the EAA and
most importantly it is a lactose-free high quality protein source. Proteins derived from soy may
contain anti-nutritional factors such as trypsin inhibitors, lecithins, and tannins (Salgado,
Montagne, Freire, Ferreira, Teixeira, Bento et al., 2002).
1.1.1 Table eggs as a source of high quality protein
Table eggs are an excellent source of high-quality protein, vitamins and minerals. An average
large egg provides around 6.25 g of high-quality protein, 5 g of fat and 200 mg of cholesterol,
which is mainly located in the yolk (Weggemans, Zock & Katan, 2001). Moreover, table eggs
contain all nine essential amino acids (EAA) including histidine, isoleucine, leucine, lysine,
methionine, phenylalanine, threonine, tryptophan and valine. Usually, the egg protein pattern is
used as a standard of comparison for measuring the protein quality of other foods because it is
very similar to the pattern needed by the human body (AEB, 1999). According to Surai and
Sparks (2001), no other single food in the World is consumed by so many people in such a
variety of ways. Due to their unique nutritional properties, eggs have been used as leavening,
thickening, binding, and emulsifying agents in many foods (Surai & Sparks, 2001).
Egg white is composed mainly of water and proteins, being ovalbumin, ovotransferrin,
ovomucoid, lysozyme and ovoinhibitor the most abundant (Stevens, 1991). Many of the egg
white proteins are globular glycoproteins and have a specific binding site for vitamins and
minerals. Lysozyme is the only egg white protein with catalytic activity; meanwhile, ovomucoid
and ovoinhibitor have a protease inhibitory activity. Ovotransferrin is normally bonded with Iron
and ovalbumin may be a source of amino acids for the egg (Stevens, 1991). Additionally, eggs
3
are excellent source of leucine. Despite all of the nutritional benefits of eggs; there is a
significant barrier to increasing egg consumption in western countries due to their association
with blood cholesterol levels (Surai & Sparks, 2001).
1.1.2 Branched chain amino acids (BCAAs)
Due to their molecular structure, leucine, isoleucine and valine are identified as branched
chain amino acids (BCAAs). Several studies have indicated that BCAAs function as nutritional
signaling molecules that control skeletal muscle anabolism; being leucine unique in this regard
(Anthony, Anthony, Kimball & Jefferson, 2001; Anthony, Anthony, Kimball, Vary & Jefferson,
2000). Moreover, it has been reported that leucine contributes to muscles’ ability to use energy
and aids in post-exercise muscle recovery. Also, a diet rich in leucine could be advantageous to
men and women undergoing resistance exercise due to the complementary effect between
leucine and glucose utilization by muscles (Layman & Rodriguez, 2009). Anthony, Anthony,
Kimball, Vary and Jefferson (2000) have reported that higher concentrations of plasma insulin
and leucine have increased skeletal protein synthesis in food-deprived rats. Intake of
carbohydrates results in an increased skeletal muscle glycogen synthesis after exercise; these
responses increase plasma insulin (Anthony, Anthony & Layman, 1999). Hence, diets containing
carbohydrates and leucine can promote higher rates of skeletal muscle synthesis after exercise
(Anthony, Anthony, Kimball & Jefferson, 2001). A detailed signaling mechanisms in the
stimulation of protein synthesis initiated by leucine is described by Anthony, Anthony, Kimball
and Jefferson (2001).
1.1.3 Protein hydrolysates
Recently, modification of food proteins by enzymatic means has become popular (Pokora,
Eckert, Zambrowicz, Bobak, Szołtysik, Dąbrowska et al., 2013). Enzymatic hydrolysis of food
4
proteins are carried out under mild conditions of pH (6-8) and temperature (40 – 60 °C) which
minimize side reactions. Functionality improvements have been observed in enzymatic-modified
proteins such as solubility, gelling, fat- and water holding capacity, emulsion stability and
foaming capacity (Panyam & Kilara, 1996). Uses of protein hydrolysates include geriatric
products, high-energy supplements, weight-control and therapeutic or enteric diets (Clemente,
2000). The use of protein hydrolysates in post-exercise food supplements have been one the
main reasons of the popularity of food protein hydrolysates in the last years.
According to Clemente (2000), protein hydrolysates can be also produced by acid and
alkaline hydrolysis; however, these methods are more difficult to control and yield products with
reduced nutritional characteristics because chemicals can destroy L-form amino acids, produce
D-form amino acids and can induce the formation of toxic substances like lysino-alanine.
The most popular commercial hydrolysates are derived of cow’s milk protein are due to their
large availability and moderate cost. Some individuals may show allergic reactions to cow’s milk
proteins. Commercial protein hydrolysates from cow’s milk protein may not be suitable for
lactose-intolerant consumers because they may contain high amounts of lactose (Hoffman &
Falvo, 2004). These are two of the main drawbacks of using cow’s milk proteins to produce
protein hydrolysates. Production of plant-base protein hydrolysates have also been reported
(Clemente, 2000); however, these hydrolysates contain low levels of EAA.
Bitterness associated with protein hydrolysates is one of major drawbacks of the use of these
types of products in food. Clemente (2000) have reported that the bitter flavor of some peptides
is attributed to their hydrophobic amino acid content. Several post-hydrolysis processes have
been successfully incorporated in the production of protein hydrolysates; these processes focus
on reducing bitterness of the hydrolysates by controlling the molecular size of the peptides
5
(Clemente, 2000). In this context, ultrafiltration technology has been an efficient process to
remove residual high-molecular weight peptides and proteins (Clemente & Chambers, 2000).
According to Manninen (2009), protein hydrolysates containing di- and tripeptides are better
than whole proteins and free amino acids on skeletal muscle anabolism . Furthermore, protein
hydrolysates containing di- and tripeptides from whey, egg, and casein are more rapidly
absorbed than those protein hydrolysates containing longer peptides (Grimble, Guilera Sarda,
Sessay, Marrett, Kapadia, Bowling et al., 1994; Grimble, Rees, Keohane, Cartwright,
Desreumaux & Silk, 1987; Raimundo, Grimble, Rees, Hunjan & Silk, 1988).
In a clinical study carried out by van Loon, Saris, Verhagen and Wagenmakers (2000), the
effect of protein hydrolysates from whey, pea and wheat proteins combined with carbohydrates
on plasma insulin was investigated. They reported that protein hydrolysates produced higher
plasma amino acid response compared to intact protein after 2-h of ingestion; this is a result of a
better insulin secretion. Moreover, wheat protein hydrolysates showed better results than the
other types of protein hydrolysates tested. The researchers also found that protein hydrolysates
are better than intact proteins because they show higher solubility in water.
One of the most complete studies to evaluate the efficacy of protein hydrolysates has been
reported by Koopman, Crombach, Gijsen, Walrand, Fauquant, Kies et al. (2009); they reported
that a 35 g dose of rapidly absorbed casein hydrolysates is about 30% more effective in
stimulating skeletal muscle protein synthesis than intact casein when measured over a 6-h period.
Supplements containing protein hydrolysates, insulin and carbohydrates increase insulin
secretion compared to supplements containing only carbohydrates. Therefore, a higher
deposition of post-exercise muscle mass may occur (Manninen, 2009).
6
Certain egg white-derived peptides also play a role in controlling the development of
hypertension and also have shown antioxidant properties (Davalos, Miguel, Bartolome & Lopez-
Fandino, 2004; Miguel, López-Fandiño, Ramos & Aleixandre, 2005; Miguel, Recio, Gómez-
Ruiz, Ramos & López-Fandiño, 2004). According to Park, Jung, Nam, Shahidi and Kim (2001),
the use of protein hydrolysates with antioxidant activities may be advantageous in functional
foods because they also provide other desired functional properties.
Nevertheless, there is no scientific evidence either on the efficacy of egg white protein
hydrolysates on skeletal muscle protein synthesis following exercise or their efficiency as wall
material in microencapsulation of bioactives. Up to date, commercial protein hydrolysates
products from egg white proteins have not been identified.
1.1.3.1 Protein hydrolysates in culture media for lactic acid fermentation
Lactic Acid Bacteria (LAB) are an economically important group of bacteria that has a long
and safe history of applications in the production of food and beverages (Zhang, Ren, Zhao,
Zhao, Xu & Zhao, 2011). LAB produces an acidification of the raw material due to the
production of lactic acid (mainly); even more, this changes result in an enhancement of the shelf
life, texture, and sensory attributes of the product (Ummadi & Curic-Bawden, 2010). The use of
LAB in food products have increased in recent years due to the positive effects of LAB in
maintaining a healthy human microbial gastrointestinal balance; which may be beneficial for the
overall human health (Gomes, Malcata & Klaver, 1998). Among the most important genus of
LAB are the lactococci, lactobacilli, streptococci, and pediococci. Each species of LAB has its
own nutritional requirements (energy, carbon and nitrogen sources) which must be optimized to
produce active and vigorous LAB starter cultures (Ummadi & Curic-Bawden, 2010). So, the
7
selection of the right raw ingredients and the design of the optimum fermentation media is
unquestionably the most important step in the production of concentrated LAB starter cultures.
The source and type of amino acids in the fermentation media is a key factor for the viability of
LAB (Zhang, Ren, Zhao, Zhao, Xu & Zhao, 2011). Normally, industrial fermentations utilize a
broad spectrum of raw materials and unidentified additives such as peptones, protein
hydrolysates, yeasts extracts, growth factor; etc. Hence, it is important to study the effect of
identified protein hydrolysates on the growth of lactic acid cultures (Zhang, Ren, Zhao, Zhao, Xu
& Zhao, 2011).
1.1.3.1.1 Starter cultures
According to Ummadi and Curic-Bawden (2010), commercial starter cultures contain a
single or multiple strains which are commonly commercialized as frozen or free dried cultures.
Commercial productions of starter cultures are not only optimized to obtain high biomass
quantity (cell yield) but also high biomass quality. Cell wall composition of LAB is one of the
most important factors to determine biomass quality; this factor determines the survival rate of
cell during downstream processing. Moreover, cell wall composition is species-dependent and
greatly affected by the fermentation media, growth conditions, and physiological status of cells
at the time of harvesting. So, production process of LAB must be optimized for each LAB strain
based on the organism, growth requirements and final application of the culture.
1.1.3.1.2 Fermentation media
In accordance with Meli, Lazzi, Neviani and Gatti (2014), fermentation media for LAB have
to provide the nutritional requirements of each LAB species/strain such as essential amino acids;
peptides; vitamins, mineral; nucleic acid bases and growth factors. Furthermore, fermentation
media should be formulated with readily available, inexpensive, and reproducible quality raw
8
materials. Most of the fermentation media are formulated to contain sugars as a source of energy
and carbon; proteins as a nitrogen source; vitamins and minerals (Ummadi & Curic-Bawden,
2010).
1.1.3.1.3 Energy and carbon sources
It is been reported that LAB are homofermentative organisms that are unable to utilize a
functional tricarboxylic (TCA) cycle to generate energy; instead, LAB generates energy via the
glycolytic (Embden-Meyerhoff-Parnas-EMP) pathway; where two moles of ATP are produced
per mole of hexose consumed (Konings, Poolman, Driessen & Maloney, 1989). LAB does not
produce any energy storage compound like glycogen, polyphosphate, and poly-β-
hydroxybutyrate; hence, fermentation media must supply enough energy to support anabolic
process and cell growth (Ummadi & Curic-Bawden, 2010). Lactose and glucose are the preferred
energy and carbon sources for industrial LAB fermentations; nevertheless, if the cell wall
components (teichoic acid and peptidglycans) and RNA precursos (purine and pyrimidine bases)
are not provided in the fermentation medium in enough amounts; a small fraction of sugars will
be used for these purposes; so, it is important to supply adequate amounts of nitrogen and growth
factors.
1.1.3.1.4 Nitrogen requirements
According to Meli, Lazzi, Neviani and Gatti (2014), nitrogen is essential for growth of
starter LAB cultures. Normally, amino acids provide the nitrogen require for bacteria growth.
The capability to synthesize amino acids is limited in LAB; therefore, exogenous sources of
amino acids and peptides are critical for their growth (Ummadi & Curic-Bawden, 2010).
Bacteria cells have to translocate available proteins, peptides and/or free amino acids from the
fermentation media as building blocks for production of new proteins and enzymes. Furthermore,
9
protein hydrolysis is a necessary step that the bacteria cell needs to carry out in order to handle
large proteins and peptides by the uptake system. Some LAB are equipped with uptake systems
that can secrete extracellular proteases; which can break down proteins into peptides and amino
acids; making them available for translocation; however, this is an energy consuming process for
the cell (Juillard, Guillot, Le Bars & Gripon, 1998).
1.1.3.1.5 Protein hydrolysates as a nitrogen source and growth factors
Fermentation media containing protein hydrolysates is a more economical option in terms of
cell energy expenditure. Protein hydrolysates are predigested proteins and their size and amino
acid composition greatly affect the growth rate and biomass yield of the organism (Castro &
Sato, 2014). Several studies have reported the use of protein hydrolysates on the growth of LAB
(Castro & Sato, 2014; Gomes, Malcata & Klaver, 1998; Zhang, Ren, Zhao, Zhao, Xu & Zhao,
2011). Moreover, biological activities have been attributed to protein hydrolysates that have an
effect on the growth stimulation of probiotic bacteria. According to Liu, Kong, Xiong and Xia
(2010), these biological properties in protein hydrolysates are due to (1) a reduction of the
molecular weight of the protein and to (2) an increase in the concentration of free amino and
carboxyl groups, which enhances their solubility in water.
1.2 Sport Supplements
The performance and health of athletes are tremendously impacted by their diet. It has been
reported that balance diets help athletes to make the most of their potential by providing the right
amounts of energy and nutrients (Maughan, Depiesse & Geyer, 2007). Nevertheless, elite
athletes require huge amounts of readily available nutrients and energy which are not easily
supplied by conventional foods. So, balance diets often require the use of food supplements and
10
conventional foods to meet energy and nutrients requirements of athletes (Terjung, Clarkson,
Eichner, Greenhaff, Hespel, Israel et al., 2000).
According to the Dietary Supplement Health and Education Act reported in Young and Bass
(1995), a dietary supplement is a product taken orally that contains a “dietary ingredient”
intended to supplement the diet. Vitamins, minerals, herbs, amino acids, enzymes, organ tissues,
glandular and metabolites are considered “dietary ingredients”. Sport supplements are food
supplements that are consumed by individuals involved in any kind of sport activity.
Froiland, Koszewski, Hingst and Kopecky (2004) have reported that eighty-nine percent of
college athletes consume at least one type of nutritional supplements. Energy drinks, vitamins,
and proteins are among the most popular nutritional supplements among college athletes.
Furthermore, it has been reported that around 48.3% of college athletes consume protein
supplements. Protein powders (combination of several types of proteins) are the most popular
supplement (21.7%) followed by whey proteins (12.6%), especial combination of amino acids
(11.6%), and weight gainers (10.6%). Meanwhile 6.3% of college athletes consume soy proteins.
1.3 Omega-3 fish oil and exercise
According to Simopoulos (2007), excessive radical formation in the form of superoxide
radical (O2-) in the lipid bilayers of muscle mitochondria and trauma during high-intensity
exercise produces an inflammatory state that is aggravated by a high ratio of ω-6 to ω-3
polyunsaturated fatty acids (PUFA) which ranges from 10:1 to 20:1 in Western diets. Positive
effects on human health have been attributed to the consumption of ω-3 PUFA (Riediger,
Othman, Suh & Moghadasian, 2009). Alpha linolenic acid (ALA) (C18:3), eicosapentaenoic acid
(EPA) (C20:5) and docosahexaenoic acid (DHA) (C22:6) are the main ω-3 PUFA (Clandinin,
Jumpsen & Suh, 1994). Omega-3 fatty acids (EPA and DHA in particular) may reduce
11
proinflammatory cytokines while raising anti-inflammatory markers (Ferrucci, Cherubini,
Bandinelli, Bartali, Corsi, Lauretani et al., 2006). Moreover, ω-3 PUFA prevent hyperglycemia
and increases oxygen delivery to the heart muscle due to a decrease in blood viscosity
(Simopoulos, 2007). Furthermore, ω-3 PUFA have shown neuroprotective mechanisms in
athletes and soldiers (Lewis & Bailes, 2011). In a study conducted in rats by Peoples and
McLennan (2010), it was reported that dietary fish oil reduces skeletal muscle oxygen
consumption, provides fatigue resistance and improves contractile recovery in the animals’ hind
limb.
Despite this potentially beneficial modulation of the inflammation process, relatively few
studies have examined the efficacy of dietary ω-3 PUFA on delayed onset muscle soreness and
its recovery. Phillips, Childs, Dreon, Phinney and Leeuwenburgh (2003) provided a supplement
containing DHA along with flavonoids, quercetin, and tocopherol to subjects after performing 30
eccentric elbow flexions at 80% effort to elicit muscle damage and inflammation. On the third
day following exercise, plasma concentrations of IL-6 and CRP were reduced. However, no
attempt was made to assess the effect of this apparent reduction in inflammation response on
muscle function recovery. In addition it was not possible to attribute the effects to any one of the
ingredients of the supplement. Lenn et al. (Lenn, Uhl, Mattacola, Boissonneault, Yates, Ibrahim
et al., 2002) hypothesized that 1.8 g/day of dietary ω-3 in the form of fish oil would reduce
muscle damage after eccentric elbow flexion exercise and promote faster recovery of muscle
strength after the exercise. They found no significant effect of the fish oil on markers of damage
(rise in CPK) or in recovery of muscle strength for 7 days after the exercise. Type 2 error is,
however, possible as there were only 5 subjects in the fish oil group and muscle strength was
12
only slightly impaired by the exercise protocol, leaving open the possibility that the magnitude of
damage and inflammatory response were insufficient to detect a possible effect of the fish oil.
1.4 Omega-3 PUFA and cancer cachexia
Preston, Fearon, Robertson, East and Calman (1987) describe cancer cachexia as a condition
of selective depletion of skeletal muscle protein reserves (muscle mass). Dietary
eicosapentaenoic acid (EPA) has significantly reduced the loss of body weight and suppressed
protein catabolism in soleus muscles in mice with cancer cachexia condition (Whitehouse,
Smith, Drake & Tisdale, 2001). Moreover, the rate of weight loss in pancreatic cancer patients
has been reduced by dietary EPA (Wigmore, Ross, Stuart Falconer, Plester, Tisdale, Carter et al.,
1996). According to Barber, Ross, Voss, Tisdale and Fearon (1999) pancreatic cancer patients
under a diet of EPA combined with a nutritional supplement have shown a significant weight
gain (2.5 kg after 7 weeks). These results may indicate that a diet rich in EPA may be useful for
patients with cancer cachexia. Furthermore, (Colomer, Moreno-Nogueira, García-Luna, García-
Peris, García-de-Lorenzo, Zarazaga et al., 2007) have suggested that dietary ω-3 PUFA (EPA
and DHA) in a doses higher than 1.5 g/day for an extended period of time to patients with
advanced cancer may be associated with an improvement in their clinical, biological (including
cachexia) and quality of life parameters.
1.5 Omega-3 PUFA fortified eggs
Due to the high nutritional value of eggs and ω-3 PUFA’s benefits; attempts to combine both
products in a single form has been reported. For example, Ferrier, Caston, Leeson, Squires,
Weaver and Holub (1995) produced a ω-3 PUFA fortified eggs through the manipulation of the
hens’ diets. As a result, ω-3 PUFA fortified eggs contain up to three times the amount of ω-3
PUFA present in conventional eggs. However, a conventional egg is not a rich source of ω-3
13
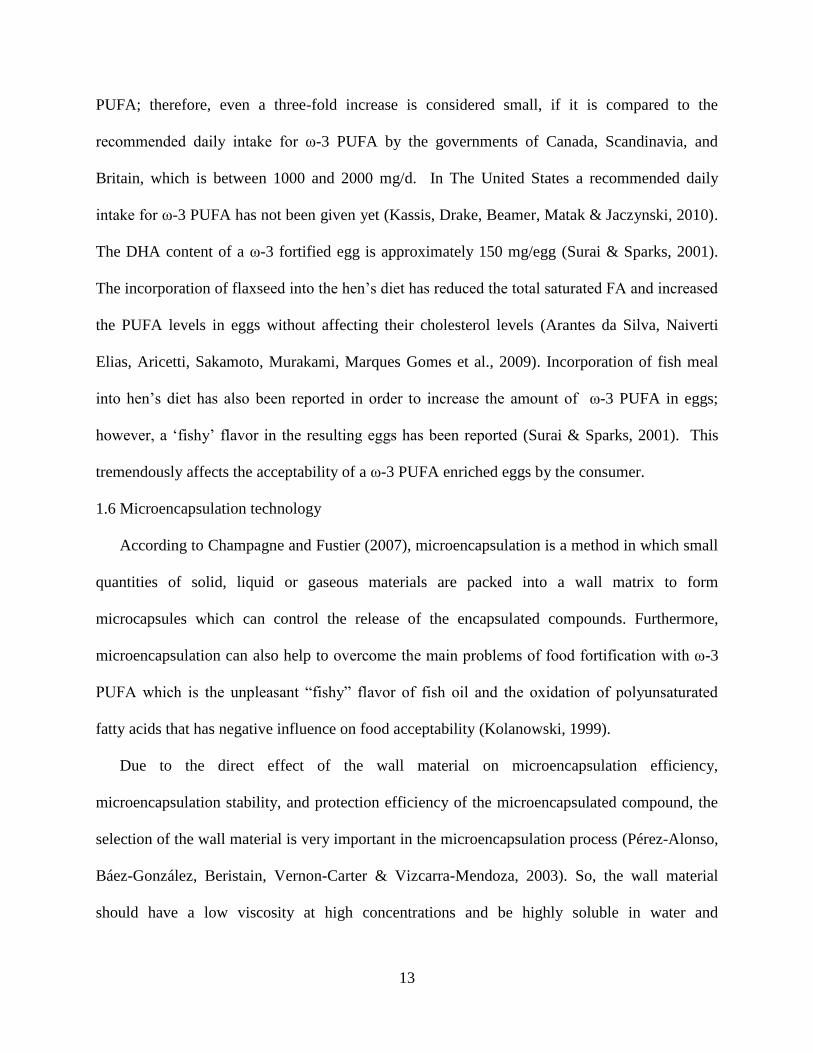
PUFA; therefore, even a three-fold increase is considered small, if it is compared to the
recommended daily intake for ω-3 PUFA by the governments of Canada, Scandinavia, and
Britain, which is between 1000 and 2000 mg/d. In The United States a recommended daily
intake for ω-3 PUFA has not been given yet (Kassis, Drake, Beamer, Matak & Jaczynski, 2010).
The DHA content of a ω-3 fortified egg is approximately 150 mg/egg (Surai & Sparks, 2001).
The incorporation of flaxseed into the hen’s diet has reduced the total saturated FA and increased
the PUFA levels in eggs without affecting their cholesterol levels (Arantes da Silva, Naiverti
Elias, Aricetti, Sakamoto, Murakami, Marques Gomes et al., 2009). Incorporation of fish meal
into hen’s diet has also been reported in order to increase the amount of ω-3 PUFA in eggs;
however, a ‘fishy’ flavor in the resulting eggs has been reported (Surai & Sparks, 2001). This
tremendously affects the acceptability of a ω-3 PUFA enriched eggs by the consumer.
1.6 Microencapsulation technology
According to Champagne and Fustier (2007), microencapsulation is a method in which small
quantities of solid, liquid or gaseous materials are packed into a wall matrix to form
microcapsules which can control the release of the encapsulated compounds. Furthermore,
microencapsulation can also help to overcome the main problems of food fortification with ω-3
PUFA which is the unpleasant “fishy” flavor of fish oil and the oxidation of polyunsaturated
fatty acids that has negative influence on food acceptability (Kolanowski, 1999).
Due to the direct effect of the wall material on microencapsulation efficiency,
microencapsulation stability, and protection efficiency of the microencapsulated compound, the
selection of the wall material is very important in the microencapsulation process (Pérez-Alonso,
Báez-González, Beristain, Vernon-Carter & Vizcarra-Mendoza, 2003). So, the wall material
should have a low viscosity at high concentrations and be highly soluble in water and
14
(Reineccius, 1988). Carbohydrates, especially glucose and sucrose and polysaccharides like
starch, maltodextrins, pectin, alginate and chitosan have been successfully used as wall materials
(Risch, 1995). However, carbohydrates cannot be used in wall systems without the presence of a
surface-active constituent because they generally have no emulsifying properties (Bangs &
Reineccius, 1988). The incorporation of carbohydrates in a wall matrix has been shown to
improve the drying properties of the wall by enhancing the formation of a dry crust around the
droplets of the microencapsulated compound. However, high concentrations of low molecular
weight sugars may not be suitable for spray drying due to caramelization and the formation of
sticky powders (Bayram, Bayram & Tekin, 2005).
On the other hand, proteins have the ability to assemble at interfaces because of their
amphiphilic nature. It has been proven that proteins are good wall materials for flavor
compounds because of their high binding activity with flavors (Landy, Druaux & Voilley, 1995).
Whey proteins have been reported to be an effective wall material for microencapsulation of
anhydrous milkfat or volatiles. The combination of whey protein with lactose significantly limits
the diffusion of core material through the wall thereby leading to high microencapsulation
efficiency (Moreau & Rosenberg, 1993). Sodium caseinate is also an effective wall material for
microencapsulation of oils. It has strong amphiphilic characteristics and high diffusivity, which
provides a better distribution around the enclosed oil surface (Hogan, McNamee, O’Riordan &
O’Sullivan, 2001). Maltodextrin, and highly branched cyclic dextrin (HBCD) in combination
with sodium caseinate and whey protein isolate have been used as wall materials for the
microencapsulation of fish oil. The combination of maltodextrin or HBCD with sodium caseinate
have improved the oxidative stability of encapsulated fish oil (Kagami, Sugimura, Fujishima,
Matsuda, Kometani & Matsumura, 2003). Microencapsulation by spray drying has significantly
15
reduced the bitterness and hygroscopicity of casein hydrolysates (Favaro-Trindade, Santana,
Monterrey-Quintero, Trindade & Netto, 2010; Mendanha, Molina Ortiz, Favaro-Trindade,
Mauri, Monterrey-Quintero & Thomazini, 2009). Currently, there is a lack of scientific literature
regarding lipid compounds microencapsulated in wall systems containing egg proteins/ egg
protein hydrolysates; however, it is believed that egg proteins may be good encapsulating agents
due to their emulsifying properties (Mine, 1995).
1.7 Spray drying
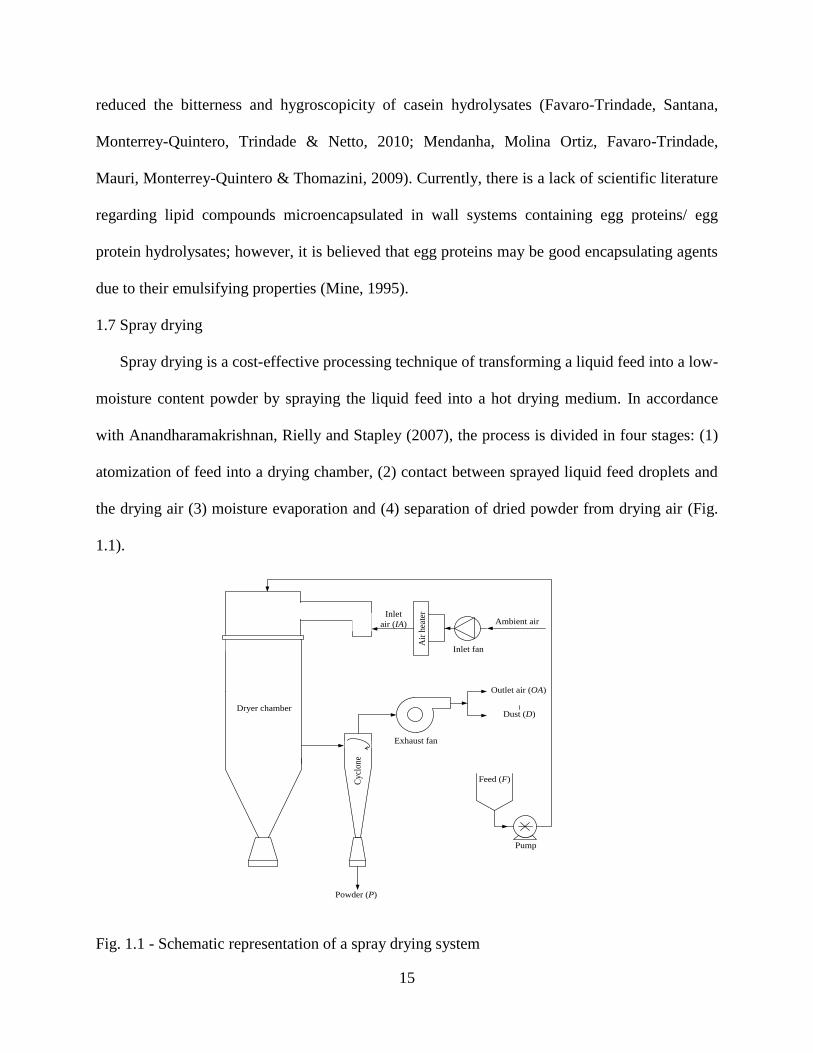
Spray drying is a cost-effective processing technique of transforming a liquid feed into a low-
moisture content powder by spraying the liquid feed into a hot drying medium. In accordance
with Anandharamakrishnan, Rielly and Stapley (2007), the process is divided in four stages: (1)
atomization of feed into a drying chamber, (2) contact between sprayed liquid feed droplets and
the drying air (3) moisture evaporation and (4) separation of dried powder from drying air (Fig.
1.1).
Inlet fan
Cycl
one
Powder (P)
Exhaust fan
Dryer chamber
Pump
Feed (F)
Air
hea
ter
Ambient airInlet
air (IA)
Outlet air (OA)
Dust (D)
Fig. 1.1 - Schematic representation of a spray drying system
16
``
Feed Flow Drying air flow
Product
Cooled air +
dust
Feed Flow
Drying air flow
Product
Cooled air +
dust
a) b)
1.7.1 Atomization of liquid feed
It is a procedure to transform the liquid feed material into a large number of small droplets;
this process is critical in spray drying because it increases the surface area of the liquid feed and
defines the particle size of the final product. The most common atomizers are: (1) pressure
nozzles, (2) two-fluid nozzles, and (3) centrifugal nozzles (Gharsallaoui, Roudaut, Chambin,
Voilley & Saurel, 2007).
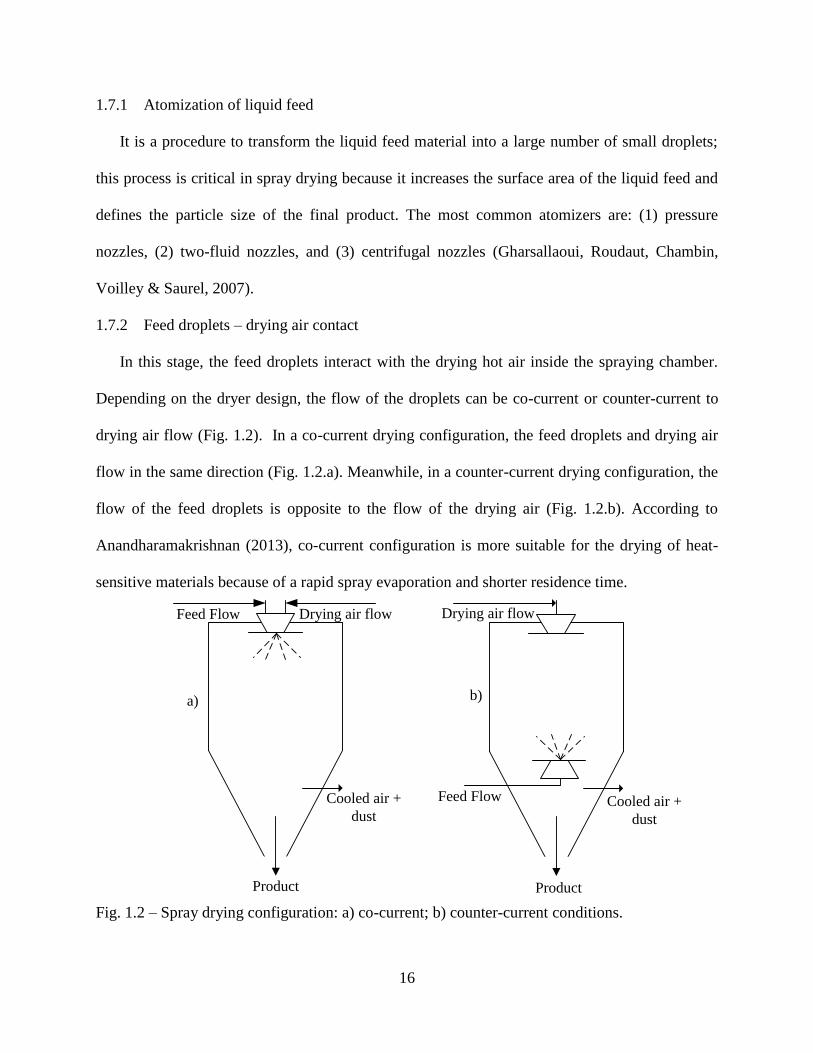
1.7.2 Feed droplets – drying air contact
In this stage, the feed droplets interact with the drying hot air inside the spraying chamber.
Depending on the dryer design, the flow of the droplets can be co-current or counter-current to
drying air flow (Fig. 1.2). In a co-current drying configuration, the feed droplets and drying air
flow in the same direction (Fig. 1.2.a). Meanwhile, in a counter-current drying configuration, the
flow of the feed droplets is opposite to the flow of the drying air (Fig. 1.2.b). According to
Anandharamakrishnan (2013), co-current configuration is more suitable for the drying of heat-
sensitive materials because of a rapid spray evaporation and shorter residence time.
Fig. 1.2 – Spray drying configuration: a) co-current; b) counter-current conditions.
17
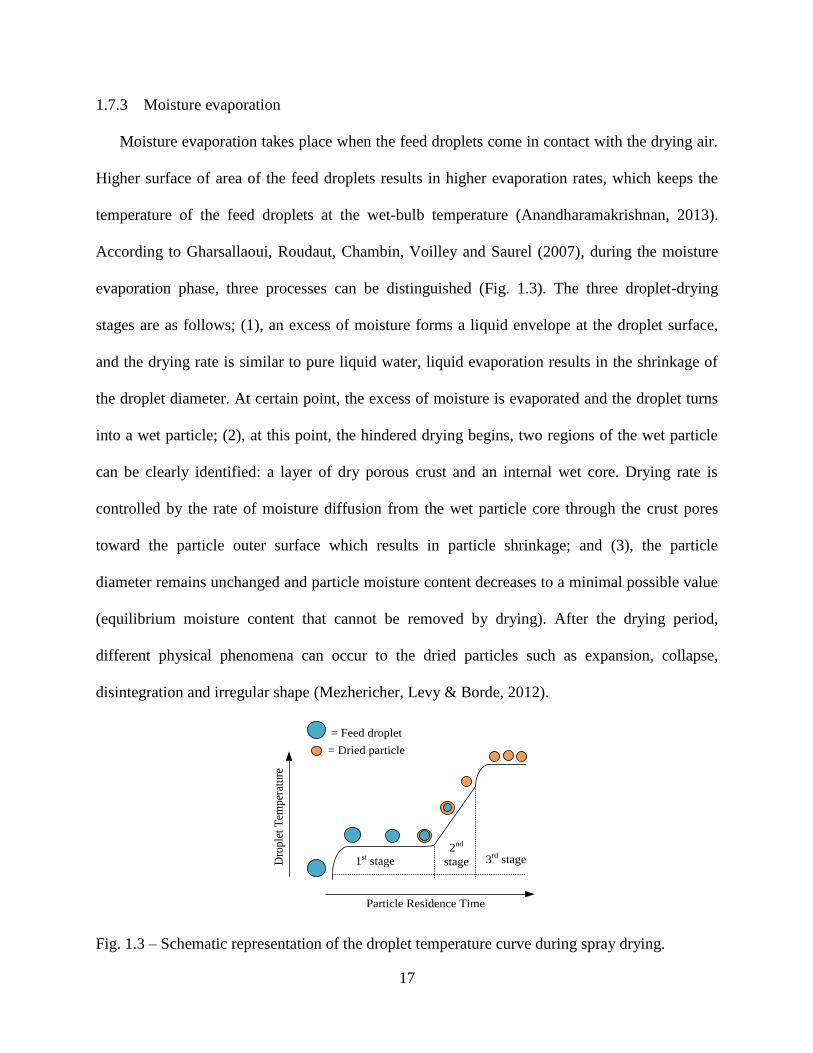
1.7.3 Moisture evaporation
Moisture evaporation takes place when the feed droplets come in contact with the drying air.
Higher surface of area of the feed droplets results in higher evaporation rates, which keeps the
temperature of the feed droplets at the wet-bulb temperature (Anandharamakrishnan, 2013).
According to Gharsallaoui, Roudaut, Chambin, Voilley and Saurel (2007), during the moisture
evaporation phase, three processes can be distinguished (Fig. 1.3). The three droplet-drying
stages are as follows; (1), an excess of moisture forms a liquid envelope at the droplet surface,
and the drying rate is similar to pure liquid water, liquid evaporation results in the shrinkage of
the droplet diameter. At certain point, the excess of moisture is evaporated and the droplet turns
into a wet particle; (2), at this point, the hindered drying begins, two regions of the wet particle
can be clearly identified: a layer of dry porous crust and an internal wet core. Drying rate is
controlled by the rate of moisture diffusion from the wet particle core through the crust pores
toward the particle outer surface which results in particle shrinkage; and (3), the particle
diameter remains unchanged and particle moisture content decreases to a minimal possible value
(equilibrium moisture content that cannot be removed by drying). After the drying period,
different physical phenomena can occur to the dried particles such as expansion, collapse,
disintegration and irregular shape (Mezhericher, Levy & Borde, 2012).
Dro
ple
t T
emper
ature
Particle Residence Time
= Feed droplet
= Dried particle
1st stage
2nd
stage 3rd stage
Fig. 1.3 – Schematic representation of the droplet temperature curve during spray drying.
18
1.7.4 Separation of dried powders
The dried feed powder is normally separated from the drying air by different means such as
screw conveyors, pneumatic systems with a cyclone separator, bag filters and electrostatic
precipitators (Fellows, 2009). Cyclones are often used in stage since they reduce product losses
to the atmosphere. According to Schuck (2002), thermal effectiveness and residence time can be
increased by using multi-stage spray-dryers which can minimize thermal degradation of heat
sensitive materials.
1.7.5 Microencapsulation of fish oil by spray drying
According to Kolanowski (1999), microencapsulation is a process that transforms fish oil
into powder by surrounded the tiny fish oil droplets with a wall material resulting in small
granules that have powder like flow characteristics. This process delays the oxidation of ω-3 fish
oil that results in the unpleasant “fishy” flavor. One of the most common and low-cost
microencapsulation processing technologies is spray drying which can be 30 to 50 times cheaper
than freeze-drying (Desobry, Netto & Labuza, 1997).
1.7.6 Processing challenges in spray drying
Prediction of the quality of the final product is extremely difficult and usually one of the
drawbacks associated with spray drying (Kieviet, 1997). Parameters like moisture content,
thermal degradation of bioactives, aroma retention, stickiness, shape and size of the particles are
normally associated with product quality. Product quality is highly linked with the spray drying
processing conditions (temperature, humidity, etc.). (Kieviet & Kerkhof, 1995; Paris, Ross Jr,
Dastur & Morris, 1971). Furthermore, many biological products like protein, enzymes,
antioxidants, vitamins and bacteria are prone to thermal degradation during spray drying
processing due to their exposure to high drying temperatures (Kuriakose &
19
Anandharamakrishnan, 2010). Thermal degradation of heat sensitive materials can be minimized
by reducing particle residence time at higher temperatures (Bimbenet, Bonazzi & Dumoulin,
2002). Several approaches to predict the final quality of spray dried powders have been reported
in the literature (Birchal, Huang, Mujumdar & Passos, 2006); however, most of these attempts
are based on experimental calculations of drying kinetics of discrete droplets immersed into a
current of hot air. Predicting the quality of spray dried powders is a challenging task due to the
complexity of the process.
Computational methods like computational fluid dynamics (CFD) have allowed the
improvement on device design and somehow predict the final quality of the spray dried powders;
nevertheless, predicting the quality of spray dried powders by using only computational means is
complicated due to the number of parameters that intervene during the process such as droplet
evaporation, collision, breakups, agglomeration, heat and mass exchange between the droplets
and drying medium and so on (Gharsallaoui, Roudaut, Chambin, Voilley & Saurel, 2007).
Therefore, the combination of computational approaches with lab experiments is a more feasible
and practical approach for predicting the final quality of spray dried food powders.
1.8 Computational fluid dynamics (CFD)
According to Kuriakose and Anandharamakrishnan (2010), computational fluid dynamics
(CFD) is a powerful computational simulation tool that has been utilized in basic and applied
research and has attracted the interest of the food processing sector in recent years. CFD is a
numerical technique for solving governing equations of fluid flow inside a geometry. CFD uses
powerful computers combined with applied mathematics to model fluid flow processes (Scott &
Richardson, 1997). Fluid flow can be defined using the Navier-Stokes transport equations which
are derived by considering mass, momentum and energy balances in an element of fluid that
20
results in a set of partial differential equations (Bird, Stewart & Lightfoot, 2007). A detailed
explanation of the theory of CFD modeling is given by Anandharamakrishnan (2013).
1.8.1 Continuity or conservation of mass equation
The conservation of mass equation describes the rate of change of density at a fixed point
resulting from the divergence in the mass velocity vector ρv. The continuity or conservation of
mass equation is the unsteady, three-dimensional and simplified case of a constant density fluid
(incompressible fluid) is described by Equation 1.1.
∇. 𝑣 = 0 (1.1)
Where, ∇ has the dimension of reciprocal length given by Equation 1.2.
∇=𝜕
𝜕𝑥𝑖 +
𝜕
𝜕𝑦𝑗 +
𝜕
𝜕𝑧𝑘 (1.2)
1.8.2 Momentum equation
The principles of the conservation of momentum is an application of Newton’s second law of
motion (F=m a) to an element of fluid. The equation states that a small volume of element
moving with the fluid is accelerated due to the force acting upon it (Equation 1.3).
𝜌𝑔𝐷𝑣
𝐷𝑡= −∇𝑝 + ∇. 𝜏 + 𝜌𝑔𝑔 (1.3)
Convection terms are described on the left size of Equation 1.3, meanwhile on the right hand
side are the pressure gradient (p), density of drying air (𝜌𝑔), source terms of gravitational force
(𝑔) and stress tensor (𝜏) which is responsible for diffusion of momentum.
1.8.3 Energy equation
The energy equation applies the first law of thermodynamics that states that energy is
conserved. The energy equation is solved in CFD solver ANSYS FLUENT® as follows
(Equation 1.4):
21
𝜕
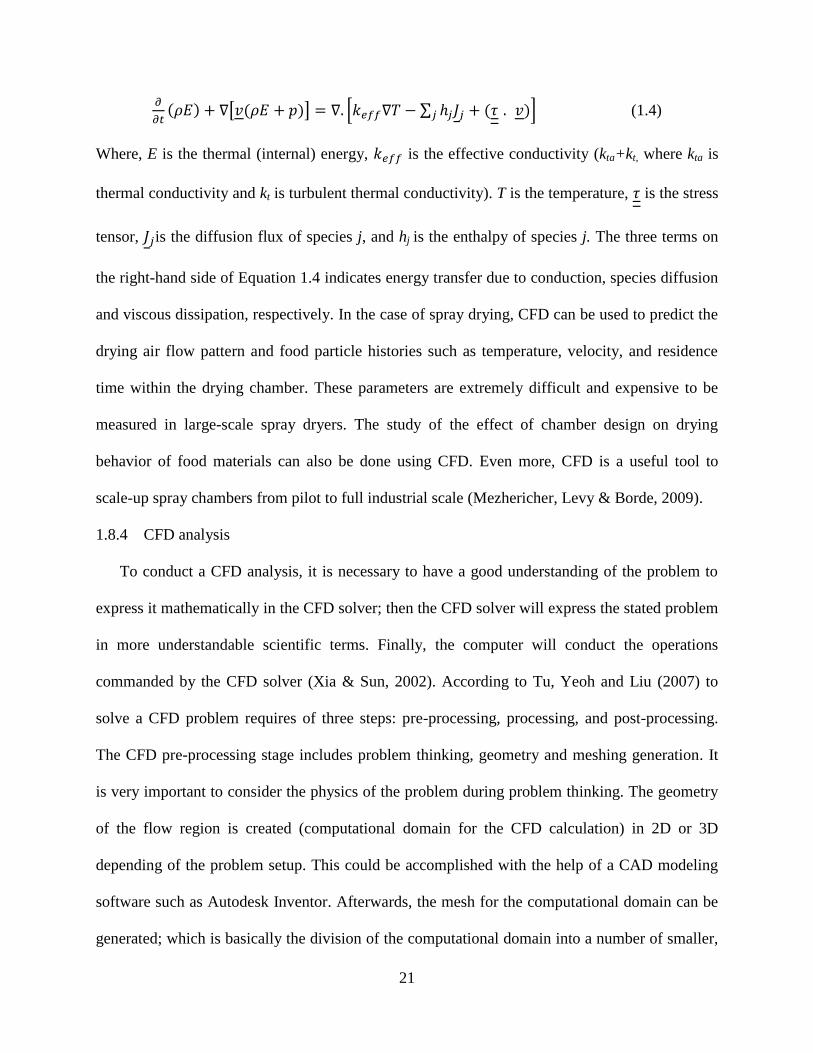
𝜕𝑡(𝜌𝐸) + ∇[𝑣(𝜌𝐸 + 𝑝)] = ∇. [𝑘𝑒𝑓𝑓∇𝑇 − ∑ ℎ𝑗𝐽𝑗 + (𝜏𝑗 . 𝑣)] (1.4)
Where, E is the thermal (internal) energy, 𝑘𝑒𝑓𝑓 is the effective conductivity (kta+kt, where kta is
thermal conductivity and kt is turbulent thermal conductivity). T is the temperature, 𝜏 is the stress
tensor, 𝐽𝑗is the diffusion flux of species j, and hj is the enthalpy of species j. The three terms on
the right-hand side of Equation 1.4 indicates energy transfer due to conduction, species diffusion
and viscous dissipation, respectively. In the case of spray drying, CFD can be used to predict the
drying air flow pattern and food particle histories such as temperature, velocity, and residence
time within the drying chamber. These parameters are extremely difficult and expensive to be
measured in large-scale spray dryers. The study of the effect of chamber design on drying
behavior of food materials can also be done using CFD. Even more, CFD is a useful tool to
scale-up spray chambers from pilot to full industrial scale (Mezhericher, Levy & Borde, 2009).
1.8.4 CFD analysis
To conduct a CFD analysis, it is necessary to have a good understanding of the problem to
express it mathematically in the CFD solver; then the CFD solver will express the stated problem
in more understandable scientific terms. Finally, the computer will conduct the operations
commanded by the CFD solver (Xia & Sun, 2002). According to Tu, Yeoh and Liu (2007) to
solve a CFD problem requires of three steps: pre-processing, processing, and post-processing.
The CFD pre-processing stage includes problem thinking, geometry and meshing generation. It
is very important to consider the physics of the problem during problem thinking. The geometry
of the flow region is created (computational domain for the CFD calculation) in 2D or 3D
depending of the problem setup. This could be accomplished with the help of a CAD modeling
software such as Autodesk Inventor. Afterwards, the mesh for the computational domain can be
generated; which is basically the division of the computational domain into a number of smaller,
22
non-overlapping subdomains in order to solve the flow physics of the CFD problem. The set of
these new cells are called mesh and each of these cells contains the equations for the
conservation of mass, momentum and energy which are solved numerically to describe the flow
properties such as velocity, pressure, and temperature and other variables of the fluid being
study. Once the mesh has been generated, the fluid properties of fluid are defined. Then, the
specific boundary conditions can be set according to the CFD problem (Xia & Sun, 2002).
Processing is the second step in solving a CFD problem which involves the use of a CFD solver
to get a numerical solution. Several commercial CFD solvers are available including ANSYS
FLUENT®, ANSYS CFX ®, COMSOL, FLOW3D, etc. However, ANSYS FLUENT®, and
ANSYS CFX® are the most popular CFD solvers (Tu, Yeoh & Liu, 2007). Setting a CFD solver
for a computational solution requires the following steps: Initiation, solution control, monitoring
solution, CFD calculation and checking for convergence. This is a very intensive process that
requires powerful computers to solve many thousands of equations; therefore, it can be a time-
consuming procedure (Xia & Sun, 2002). Post-processing is used to evaluate the results
generated by the CFD solver. This step is basically how the generated results are presented and
visualized. Generally, the results of the solved problem can be analyzed both numerically and
graphically (Xia & Sun, 2002). Post-processing tools of CFD software are invaluable design
instruments to effectively report the computational results. In general, the computational results
can be presented in 2D graphs or 3D representations using x-y plots, vector plots, contour plots,
streamlines, and animations (Anandharamakrishnan, 2013).
1.8.5 Study of spray drying processing using computational fluid dynamics
Several approaches to predict the final quality of spray dried powders have been reported in
the literature (Birchal, Huang, Mujumdar & Passos, 2006); however, most of these attempts are
23
based on experimental calculations of drying kinetics of discrete droplets immersed into a
current of hot air. Moreover, simple mass transport phenomena assumptions that occur in the
drying chamber are applied and the physical phenomena that takes place at the cyclone is
normally neglected. This may result in inaccurate predictions of the spray drying process because
thermal degradation of the dried product may also occur at the cyclone. Furthermore,
experimental spray drying studies involve difficulties due to the complexity in measuring and
describing the flow, heat, and mass transfer mechanism within the drying chamber (Birchal,
Huang, Mujumdar & Passos, 2006).
1.8.6 Reference frames in CFD
Reference frame is a coordinate system used to characterize and determine the position and
orientation of an object at different times. In fluid mechanics, several reference frames are
utilized (Aris, 1990). Commonly, the Eulerian-Eulerian and Eulerian-Lagrangian modelling
frames are used in spray drying modelling by CFD. In the case of Eulerian-Eulerian frame, two
continuous phases are assuming (one for the droplets and one for the drying air). So, each
computational cell has a fraction for the drying air and the droplets phases. Also, it contains the
all of the CFD equations are written in such a way that the fractions of drying air and droplets
sum to unity (Kuriakose & Anandharamakrishnan, 2010). According to Jakobsen, Sannæs,
Grevskott and Svendsen (1997), this method requires less computational demands and a set of
equations to model turbulence is fairly simple. This approach is more suitable to model the
drying of droplets with a narrow range of particle sizes.
On the other hand, the Eulerian-Lagrangian frame models the drying air phase using the
standard Eulerian approach; meanwhile the droplets are represented by a number of discrete
computational “particles”. This methodology requires less computational needs than the
24
Eulerian-Eulerian methods for a large range of particle sizes (Nijdam, Guo, Fletcher & Langrish,
2006). Also, the Eulerian-Lagrangian approach provides more details about the behavior and
particle residence times; therefore, approximates mass and heat transfer more accurately. For
spray drying modeling a Eulerian-Lagrangian reference frame is more suitable (Kuriakose &
Anandharamakrishnan, 2010).
1.8.7 Air flow patterns
In accordance with Kuriakose and Anandharamakrishnan (2010), particle behavior in spray
drying operations depends on the drying air flow pattern. Additionally, the presence of air flow
instabilities needs to be considered to study the drying behavior of droplets inside the spray
chamber; therefore, the effect of turbulence inside the drying chamber must be taken into
account.
1.8.8 Turbulence models
Southwell and Langrish (2000) have reported the presence of significant flow instabilities
inside a pilot-scale spray dryer. These instabilities are large scale drifting of droplets if the inlet
flow is not swirled or regular precession if there is inlet swirl. Therefore, it is important to carry
out three-dimensional spray drying simulations to account for all of the drying air flow
instabilities inside the dryer chamber (Fletcher, Guo, Harvie, Langrish, Nijdam & Williams,
2006).
Several turbulence models have been proposed to describe the air flow patter inside a spray
dryer; however, the standard k- ɛ (k – turbulence kinetic energy and ɛ - turbulence dissipation
rate) is the widely used because it can be applied over a range of turbulent flows due to its
robustness and reasonable accuracy (Kuriakose & Anandharamakrishnan, 2010). The
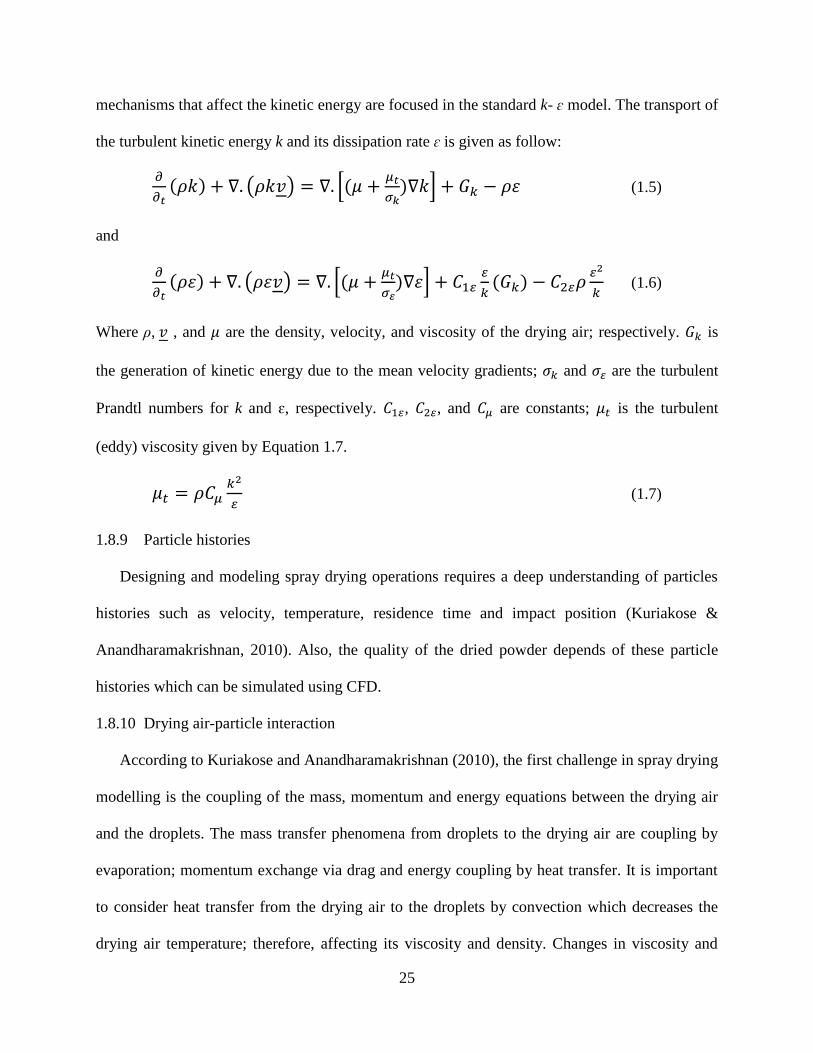
25
mechanisms that affect the kinetic energy are focused in the standard k- ɛ model. The transport of
the turbulent kinetic energy k and its dissipation rate ɛ is given as follow:
𝜕
𝜕𝑡(𝜌𝑘) + ∇. (𝜌𝑘𝑣) = ∇. [(𝜇 +
𝜇𝑡
𝜎𝑘)∇𝑘] + 𝐺𝑘 − 𝜌𝜀 (1.5)
and
𝜕
𝜕𝑡(𝜌𝜀) + ∇. (𝜌𝜀𝑣) = ∇. [(𝜇 +
𝜇𝑡
𝜎𝜀)∇𝜀] + 𝐶1𝜀
𝜀
𝑘(𝐺𝑘) − 𝐶2𝜀𝜌
𝜀2
𝑘 (1.6)
Where ρ, 𝑣 , and 𝜇 are the density, velocity, and viscosity of the drying air; respectively. 𝐺𝑘 is
the generation of kinetic energy due to the mean velocity gradients; 𝜎𝑘 and 𝜎𝜀 are the turbulent
Prandtl numbers for k and ɛ, respectively. 𝐶1𝜀, 𝐶2𝜀, and 𝐶𝜇 are constants; 𝜇𝑡 is the turbulent
(eddy) viscosity given by Equation 1.7.
𝜇𝑡 = 𝜌𝐶𝜇𝑘2
𝜀 (1.7)
1.8.9 Particle histories
Designing and modeling spray drying operations requires a deep understanding of particles
histories such as velocity, temperature, residence time and impact position (Kuriakose &
Anandharamakrishnan, 2010). Also, the quality of the dried powder depends of these particle
histories which can be simulated using CFD.
1.8.10 Drying air-particle interaction
According to Kuriakose and Anandharamakrishnan (2010), the first challenge in spray drying
modelling is the coupling of the mass, momentum and energy equations between the drying air
and the droplets. The mass transfer phenomena from droplets to the drying air are coupling by
evaporation; momentum exchange via drag and energy coupling by heat transfer. It is important
to consider heat transfer from the drying air to the droplets by convection which decreases the
drying air temperature; therefore, affecting its viscosity and density. Changes in viscosity and
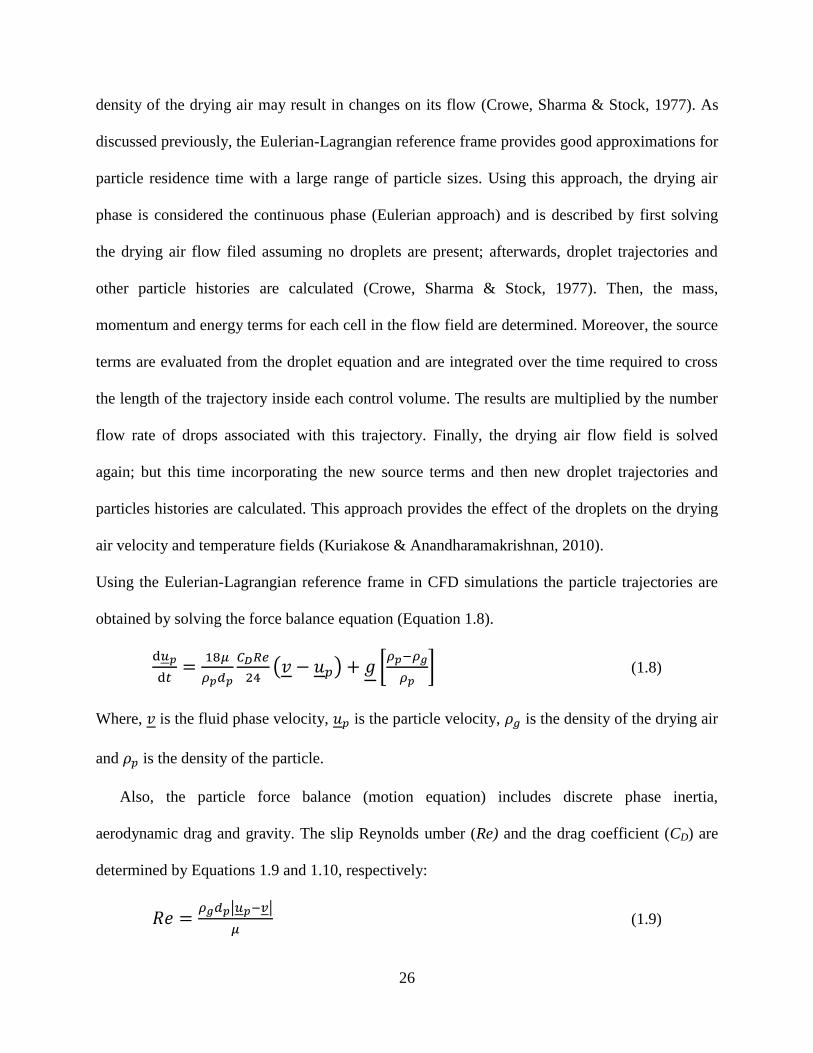
26
density of the drying air may result in changes on its flow (Crowe, Sharma & Stock, 1977). As
discussed previously, the Eulerian-Lagrangian reference frame provides good approximations for
particle residence time with a large range of particle sizes. Using this approach, the drying air
phase is considered the continuous phase (Eulerian approach) and is described by first solving
the drying air flow filed assuming no droplets are present; afterwards, droplet trajectories and
other particle histories are calculated (Crowe, Sharma & Stock, 1977). Then, the mass,
momentum and energy terms for each cell in the flow field are determined. Moreover, the source
terms are evaluated from the droplet equation and are integrated over the time required to cross
the length of the trajectory inside each control volume. The results are multiplied by the number
flow rate of drops associated with this trajectory. Finally, the drying air flow field is solved
again; but this time incorporating the new source terms and then new droplet trajectories and
particles histories are calculated. This approach provides the effect of the droplets on the drying
air velocity and temperature fields (Kuriakose & Anandharamakrishnan, 2010).
Using the Eulerian-Lagrangian reference frame in CFD simulations the particle trajectories are
obtained by solving the force balance equation (Equation 1.8).
d𝑢𝑝
d𝑡=
18𝜇
𝜌𝑝𝑑𝑝
𝐶𝐷𝑅𝑒
24(𝑣 − 𝑢𝑝) + 𝑔 [
𝜌𝑝−𝜌𝑔
𝜌𝑝] (1.8)
Where, 𝑣 is the fluid phase velocity, 𝑢𝑝 is the particle velocity, 𝜌𝑔 is the density of the drying air
and 𝜌𝑝 is the density of the particle.
Also, the particle force balance (motion equation) includes discrete phase inertia,
aerodynamic drag and gravity. The slip Reynolds umber (Re) and the drag coefficient (CD) are
determined by Equations 1.9 and 1.10, respectively:
𝑅𝑒 =𝜌𝑔𝑑𝑝|𝑢𝑝−𝑣|
𝜇 (1.9)
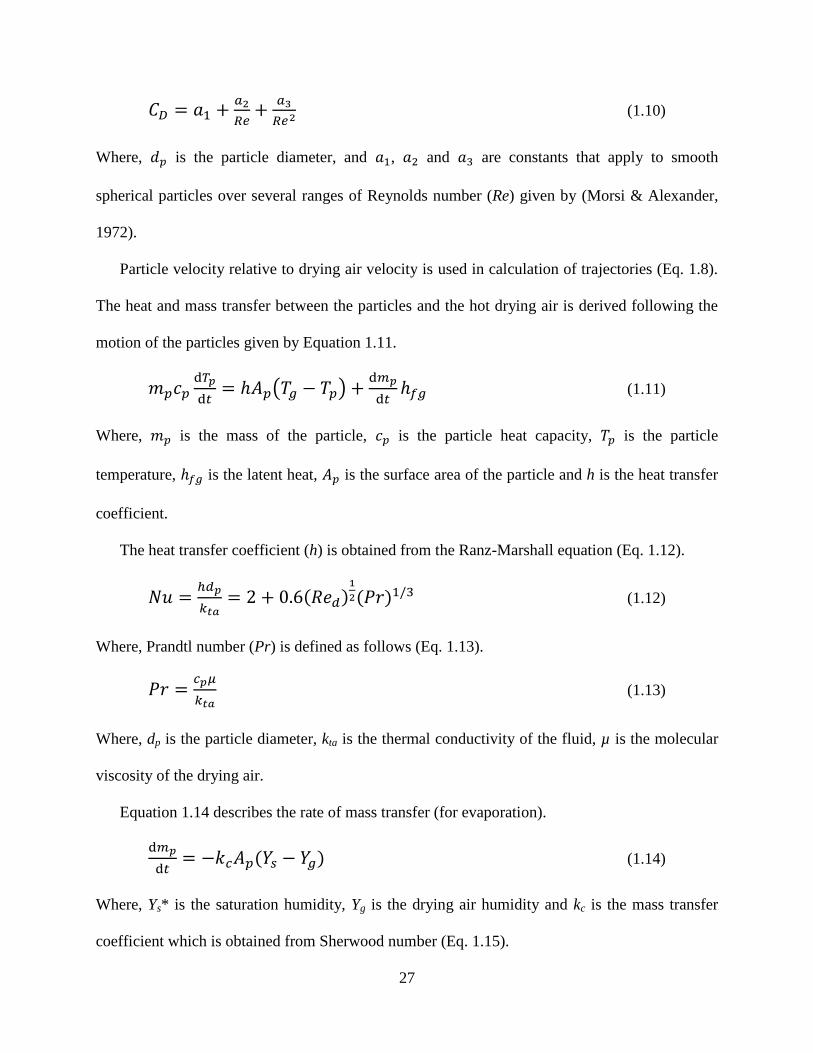
27
𝐶𝐷 = 𝑎1 +𝑎2
𝑅𝑒+
𝑎3
𝑅𝑒2 (1.10)
Where, 𝑑𝑝 is the particle diameter, and 𝑎1, 𝑎2 and 𝑎3 are constants that apply to smooth
spherical particles over several ranges of Reynolds number (Re) given by (Morsi & Alexander,
1972).
Particle velocity relative to drying air velocity is used in calculation of trajectories (Eq. 1.8).
The heat and mass transfer between the particles and the hot drying air is derived following the
motion of the particles given by Equation 1.11.
𝑚𝑝𝑐𝑝d𝑇𝑝
d𝑡= ℎ𝐴𝑝(𝑇𝑔 − 𝑇𝑝) +
d𝑚𝑝
d𝑡ℎ𝑓𝑔 (1.11)
Where, 𝑚𝑝 is the mass of the particle, 𝑐𝑝 is the particle heat capacity, 𝑇𝑝 is the particle
temperature, ℎ𝑓𝑔 is the latent heat, 𝐴𝑝 is the surface area of the particle and h is the heat transfer
coefficient.
The heat transfer coefficient (h) is obtained from the Ranz-Marshall equation (Eq. 1.12).
𝑁𝑢 =ℎ𝑑𝑝
𝑘𝑡𝑎= 2 + 0.6(𝑅𝑒𝑑)
1
2(𝑃𝑟)1/3 (1.12)
Where, Prandtl number (Pr) is defined as follows (Eq. 1.13).
𝑃𝑟 =𝑐𝑝𝜇
𝑘𝑡𝑎 (1.13)
Where, dp is the particle diameter, kta is the thermal conductivity of the fluid, µ is the molecular
viscosity of the drying air.
Equation 1.14 describes the rate of mass transfer (for evaporation).
d𝑚𝑝
d𝑡= −𝑘𝑐𝐴𝑝(𝑌𝑠 − 𝑌𝑔) (1.14)
Where, Ys* is the saturation humidity, Yg is the drying air humidity and kc is the mass transfer
coefficient which is obtained from Sherwood number (Eq. 1.15).
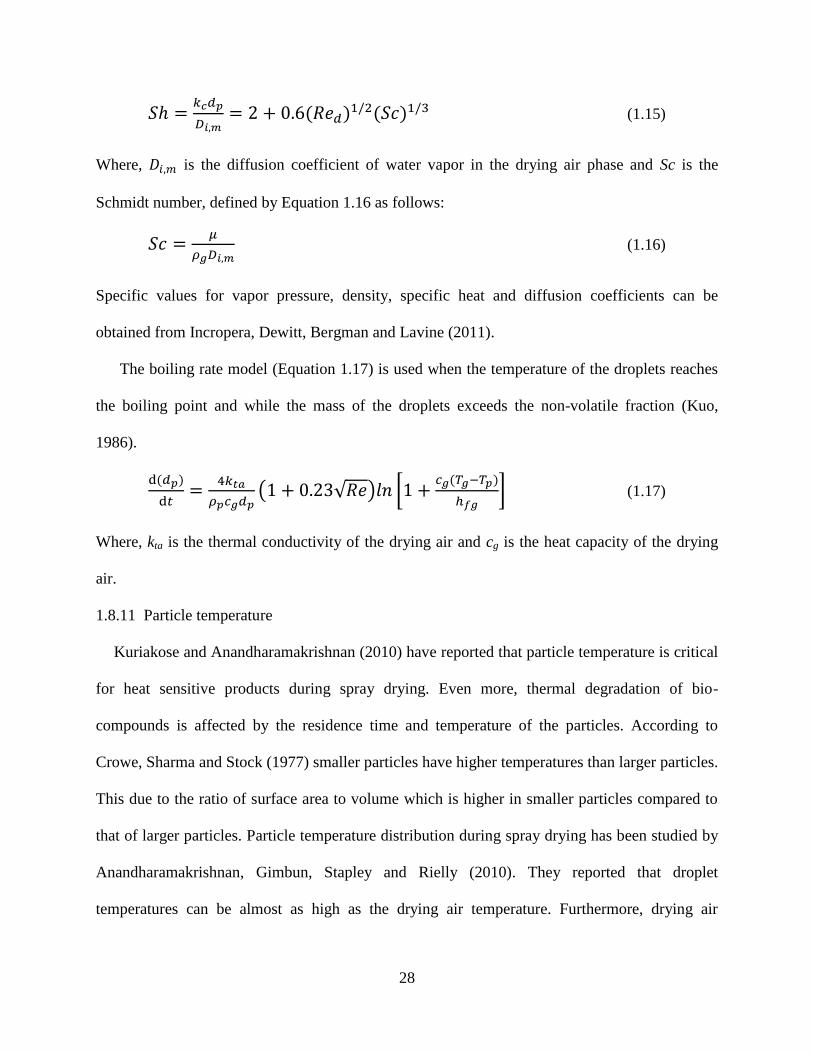
28
𝑆ℎ =𝑘𝑐𝑑𝑝
𝐷𝑖,𝑚= 2 + 0.6(𝑅𝑒𝑑)1/2(𝑆𝑐)1/3 (1.15)
Where, 𝐷𝑖,𝑚 is the diffusion coefficient of water vapor in the drying air phase and Sc is the
Schmidt number, defined by Equation 1.16 as follows:
𝑆𝑐 =𝜇
𝜌𝑔𝐷𝑖,𝑚 (1.16)
Specific values for vapor pressure, density, specific heat and diffusion coefficients can be
obtained from Incropera, Dewitt, Bergman and Lavine (2011).
The boiling rate model (Equation 1.17) is used when the temperature of the droplets reaches
the boiling point and while the mass of the droplets exceeds the non-volatile fraction (Kuo,
1986).
d(𝑑𝑝)
d𝑡=
4𝑘𝑡𝑎
𝜌𝑝𝑐𝑔𝑑𝑝(1 + 0.23√𝑅𝑒)𝑙𝑛 [1 +
𝑐𝑔(𝑇𝑔−𝑇𝑝)
ℎ𝑓𝑔] (1.17)
Where, kta is the thermal conductivity of the drying air and cg is the heat capacity of the drying
air.
1.8.11 Particle temperature
Kuriakose and Anandharamakrishnan (2010) have reported that particle temperature is critical
for heat sensitive products during spray drying. Even more, thermal degradation of bio-
compounds is affected by the residence time and temperature of the particles. According to
Crowe, Sharma and Stock (1977) smaller particles have higher temperatures than larger particles.
This due to the ratio of surface area to volume which is higher in smaller particles compared to
that of larger particles. Particle temperature distribution during spray drying has been studied by
Anandharamakrishnan, Gimbun, Stapley and Rielly (2010). They reported that droplet
temperatures can be almost as high as the drying air temperature. Furthermore, drying air
29
temperatures at the core of the drying chamber are lower than those at the region close to the
dryer chamber wall due to the cooling effect of evaporation.
1.8.12 Particle residence time distribution (RT)
Particle residence time (RT) during spray dying is another parameter that has a tremendous
effect on the final quality of the spray dried powders. In accordance with Kuriakose and
Anandharamakrishnan (2010), solubility and bulk density of the spray dried powders are affected
by their RT. Conventionally, RT is divided in primary and secondary residence times. The
primary RT account for the time taken by the feed droplets from leaving the nozzle to impact on
the wall or leave at the outlet. Meanwhile, secondary RT is the time taken for a particle to slide
along the wall from the impact position to the exit. Kieviet (1997) have reported that larger
particles have longer RT’s compared to smaller particles during spray drying of maltodextrin
solution in a co-current spray drying configuration. Measuring the RT during spray drying is
extremely challenging and a complicated task; therefore, CFD simulation methods have been
effectively used to predict the RT of spray dried particles (Ducept, Sionneau & Vasseur, 2002).
Moreover, different particle trajectories has been observed during spray drying (Huang, Kumar
& Mujumdar, 2003). Anandharamakrishnan, Gimbun, Stapley and Rielly (2010) have observed
that a bent outlet pipe inside the drying chamber can increase the drying air and particle
recirculation; this will increase the RT of the dried powders which leads to higher protein
denaturation rates. However, this work did not include the suction effect given by an outlet fan
that may prevent drying air recirculation inside the drying chamber.
Up to date, scientific literature about the production and the effect of food grade egg white
protein hydrolysates on the growth of LAB is limited. Scientific information about the
production of microencapsulated ω-3 fish oil with food grade egg white protein hydrolysates is
30
also limited. Moreover, the use of computational tools to predict the performance of a spray
dryer and the quality of spray dried food powders is also partial because these methods are
relatively new to the food industry; therefore, leaving a great opportunity to explore this field.
1.9 References
AEB. (1999). Eggcyclopedia - The incredible edible egg. Park Ridge, IL: American Egg Board.
Anandharamakrishnan, C. (2013). Computational Fluid Dynamics Applications in Food
Processing: Springer.
Anandharamakrishnan, C., Gimbun, J., Stapley, A., & Rielly, C. D. (2010). A study of particle
histories during spray drying using computational fluid dynamic simulations. Drying
Technology, 28(5), 566-576.
Anandharamakrishnan, C., Rielly, C., & Stapley, A. (2007). Effects of process variables on the
denaturation of whey proteins during spray drying. Drying Technology, 25(5), 799-807.
Anthony, J. C., Anthony, T. G., Kimball, S. R., & Jefferson, L. S. (2001). Signaling pathways
involved in translational control of protein synthesis in skeletal muscle by leucine. The
Journal of nutrition, 131(3), 856S-860S.
Anthony, J. C., Anthony, T. G., Kimball, S. R., Vary, T. C., & Jefferson, L. S. (2000). Orally
administered leucine stimulates protein synthesis in skeletal muscle of postabsorptive rats in
association with increased eIF4F formation. The Journal of nutrition, 130(2), 139-145.
Anthony, J. C., Anthony, T. G., & Layman, D. K. (1999). Leucine supplementation enhances
skeletal muscle recovery in rats following exercise. The Journal of nutrition, 129(6), 1102-
1106.
Arantes da Silva, W., Naiverti Elias, A. H., Aricetti, J. A., Sakamoto, M. I., Murakami, A. E.,
Marques Gomes, S. T., Visentainer, J. V., Evelázio de Souza, N., & Matsushita, M. (2009).
Quail egg yolk (Coturnix coturnix japonica) enriched with omega-3 fatty acids. LWT-Food
Science and Technology, 42(2), 660-663.
Aris, R. (1990). Vectors, Tensors and the Basic Equations of Fluid Mechanics: Dover
Publications.
Bangs, W. E., & Reineccius, G. A. (1988). Corn starch derivatives: possible wall materials for
spray-dried flavor manufacture. In Risch, S., & Reineccius, G. Flavor encapsulation. ACS
Symposium Series pp. 12-28): ACS Publications.
Barber, M., Ross, J., Voss, A., Tisdale, M., & Fearon, K. (1999). The effect of an oral nutritional
supplement enriched with fish oil on weight-loss in patients with pancreatic cancer. British
Journal of Cancer, 81(1), 80.
31
Bayram, Ö. A., Bayram, M., & Tekin, A. R. (2005). Spray drying of sumac flavour using sodium
chloride, sucrose, glucose and starch as carriers. Journal of food engineering, 69(2), 253-260.
Bimbenet, J., Bonazzi, C., & Dumoulin, E. (2002). Drying of foodstuffs. Drying 2002, 64-80.
Birchal, V., Huang, L., Mujumdar, A., & Passos, M. (2006). Spray dryers: modeling and
simulation. Drying Technology, 24(3), 359-371.
Bird, R. B., Stewart, W. E., & Lightfoot, E. N. (2007). Transport phenomena: John Wiley &
Sons.
Castro, R. J. S. d., & Sato, H. H. (2014). Functional properties and growth promotion of
bifidobacteria and lactic acid bacteria strains by protein hydrolysates using a statistical
mixture design. Food Bioscience.
Champagne, C. P., & Fustier, P. (2007). Microencapsulation for the improved delivery of
bioactive compounds into foods. Current opinion in biotechnology, 18(2), 184-190.
Clandinin, M. T., Jumpsen, J., & Suh, M. (1994). Relationship between fatty acid accretion,
membrane composition, and biologic functions. The Journal of Pediatrics, 125(5, Part 2),
S25-S32.
Clemente, A. (2000). Enzymatic protein hydrolysates in human nutrition. Trends in Food
Science & Technology, 11(7), 254-262.
Clemente, A., & Chambers, S. J. (2000). Development and Production of Hypoallergenic Protein
Hydrolysates for Use in Infant Formulas. Food Allergy and Intolerance pp. 175 - 190).
Colomer, R., Moreno-Nogueira, J. M., García-Luna, P. P., García-Peris, P., García-de-Lorenzo,
A., Zarazaga, A., Quecedo, L., del Llano, J., Usán, L., & Casimiro, C. (2007). N-3 fatty
acids, cancer and cachexia: a systematic review of the literature. British Journal of Nutrition,
97(05), 823-831.
Crowe, C. T., Sharma, M., & Stock, D. E. (1977). The particle-source-in cell (PSI-CELL) model
for gas-droplet flows. Journal of Fluids Engineering, 99(2), 325-332.
Davalos, A., Miguel, M., Bartolome, B., & Lopez-Fandino, R. (2004). Antioxidant activity of
peptides derived from egg white proteins by enzymatic hydrolysis. Journal of Food
Protection®, 67(9), 1939-1944.
Desobry, S. A., Netto, F. M., & Labuza, T. P. (1997). Comparison of Spray‐drying, Drum‐drying
and Freeze‐drying for β‐Carotene Encapsulation and Preservation. Journal of Food Science,
62(6), 1158-1162.
Ducept, F., Sionneau, M., & Vasseur, J. (2002). Superheated steam dryer: simulations and
experiments on product drying. Chemical Engineering Journal, 86(1), 75-83.
32
Favaro-Trindade, C. S., Santana, A. S., Monterrey-Quintero, E. S., Trindade, M. A., & Netto, F.
M. (2010). The use of spray drying technology to reduce bitter taste of casein hydrolysate.
Food Hydrocolloids, 24(4), 336-340.
Fellows, P. J. (2009). Food processing technology: principles and practice: Elsevier.
Ferrier, L. K., Caston, L. J., Leeson, S., Squires, J., Weaver, B. J., & Holub, B. J. (1995). alpha-
Linolenic acid-and docosahexaenoic acid-enriched eggs from hens fed flaxseed: influence on
blood lipids and platelet phospholipid fatty acids in humans. The American journal of clinical
nutrition, 62(1), 81-86.
Ferrucci, L., Cherubini, A., Bandinelli, S., Bartali, B., Corsi, A., Lauretani, F., Martin, A.,
Andres-Lacueva, C., Senin, U., & Guralnik, J. M. (2006). Relationship of Plasma
Polyunsaturated Fatty Acids to Circulating Inflammatory Markers. Journal of Clinical
Endocrinology & Metabolism, 91(2), 439-446.
Fletcher, D., Guo, B., Harvie, D., Langrish, T., Nijdam, J., & Williams, J. (2006). What is
important in the simulation of spray dryer performance and how do current CFD models
perform? Applied mathematical modelling, 30(11), 1281-1292.
Friedman, M. (1996). Nutritional value of proteins from different food sources. A review.
Journal of Agricultural and Food Chemistry, 44(1), 6-29.
Froiland, K., Koszewski, W., Hingst, J., & Kopecky, L. (2004). Nutritional supplement use
among college athletes and their sources of information. International journal of sport
nutrition and exercise metabolism, 14, 104-120.
Gharsallaoui, A., Roudaut, G., Chambin, O., Voilley, A., & Saurel, R. (2007). Applications of
spray-drying in microencapsulation of food ingredients: An overview. Food Research
International, 40(9), 1107-1121.
Gomes, A. M., Malcata, F. X., & Klaver, F. A. (1998). Growth Enhancement of Bifidobacterium
lactis Bo and Lactobacillus acidophilus Ki by Milk Hydrolyzates. Journal of Dairy Science,
81(11), 2817-2825.
Grimble, G., Guilera Sarda, M., Sessay, H., Marrett, A., Kapadia, S., Bowling, T., & Silk, D.
(1994). The influence of whey hydrolysate peptide chain length on nitrogen and carbohydrate
absorption in the perfused human jejunum. Clinical Nutrition, 13, 46.
Grimble, G., Rees, R., Keohane, P., Cartwright, T., Desreumaux, M., & Silk, D. (1987). Effect of
peptide chain length on absorption of egg protein hydrolysates in the normal human jejunum.
Gastroenterology, 92(1), 136-142.
Hoffman, J. R., & Falvo, M. J. (2004). Protein - Which is best? Journal of Sports Science and
Medicine, 3, 118-130.
33
Hogan, S. A., McNamee, B. F., O’Riordan, E. D., & O’Sullivan, M. (2001). Emulsification and
microencapsulation properties of sodium caseinate/carbohydrate blends. International Dairy
Journal, 11(3), 137-144.
Huang, L., Kumar, K., & Mujumdar, A. (2003). Use of computational fluid dynamics to evaluate
alternative spray dryer chamber configurations. Drying Technology, 21(3), 385-412.
Incropera, F. P., Dewitt, D. P., Bergman, T. L., & Lavine, A. S. (2011). Fundamentals of heat
and mass transfer: John Wiley & Sons.
Jakobsen, H. A., Sannæs, B. H., Grevskott, S., & Svendsen, H. F. (1997). Modeling of vertical
bubble-driven flows. Industrial & engineering chemistry research, 36(10), 4052-4074.
Juillard, V., Guillot, A., Le Bars, D., & Gripon, J.-C. (1998). Specificity of Milk Peptide
Utilization byLactococcus lactis. Applied and environmental microbiology, 64(4), 1230-
1236.
Kagami, Y., Sugimura, S., Fujishima, N., Matsuda, K., Kometani, T., & Matsumura, Y. (2003).
Oxidative stability, structure, and physical characteristics of microcapsules formed by spray
drying of fish oil with protein and dextrin wall materials. Journal of Food Science, 68(7),
2248-2255.
Kassis, N., Drake, S. R., Beamer, S. K., Matak, K. E., & Jaczynski, J. (2010). Development of
nutraceutical egg products with omega-3-rich oils. LWT-Food Science and Technology,
43(5), 777-783.
Kieviet, F., & Kerkhof, P. J. (1995). Measurements of particle residence time distributions in a
co-current spray dryer. Drying Technology, 13(5-7), 1241-1248.
Kieviet, F. G. (1997). Modelling quality in spray drying: Laboratory of Separation Processes and
Transport Phenomena, Department of Chemical Engineering, Eindhoven University of
Technology.
Kolanowski, W. (1999). Possibilities of fish oil application for food products enrichment with
omega-3 PUFA. International journal of food sciences and nutrition, 50(1), 39-49.
Konings, W., Poolman, B., Driessen, A., & Maloney, P. C. (1989). Bioenergetics and solute
transport in lactococci. Critical reviews in microbiology, 16(6), 419-476.
Koopman, R., Crombach, N., Gijsen, A. P., Walrand, S., Fauquant, J., Kies, A. K., Lemosquet,
S., Saris, W. H., Boirie, Y., & van Loon, L. J. (2009). Ingestion of a protein hydrolysate is
accompanied by an accelerated in vivo digestion and absorption rate when compared with its
intact protein. The American journal of clinical nutrition, 90(1), 106-115.
Kuo, K. K. (1986). Principles of combustion. John Willey & Sons, New York.
34
Kuriakose, R., & Anandharamakrishnan, C. (2010). Computational fluid dynamics (CFD)
applications in spray drying of food products. Trends in Food Science & Technology, 21(8),
383-398.
Landy, P., Druaux, C., & Voilley, A. (1995). Retention of aroma compounds by proteins in
aqueous solution. Food Chemistry, 54(4), 387-392.
Layman, D. K., & Rodriguez, N. R. (2009). Egg Protein as a Source of Power, Strength, and
Energy. Nutrition Today, 44(1), 43-48.
Lenn, J., Uhl, T., Mattacola, C., Boissonneault, G., Yates, J., Ibrahim, W., & Bruckner, G.
(2002). The effects of fish oil and isoflavones on delayed onset muscle soreness. Medicine &
Science in Sports & Exercise, 34(10), 1605-1613.
Lewis, M. D., & Bailes, J. (2011). Neuroprotection for the warrior: dietary supplementation with
omega-3 fatty acids. Military medicine, 176(10), 1120-1127.
Liu, Q., Kong, B., Xiong, Y. L., & Xia, X. (2010). Antioxidant activity and functional properties
of porcine plasma protein hydrolysate as influenced by the degree of hydrolysis. Food
Chemistry, 118(2), 403-410.
Manninen, A. H. (2009). Protein hydrolysates in sports nutrition. Nutr Metab (Lond), 6, 38.
Maughan, R. J., Depiesse, F., & Geyer, H. (2007). The use of dietary supplements by athletes.
Journal of Sports Sciences, 25(S1), S103-S113.
Meli, F., Lazzi, C., Neviani, E., & Gatti, M. (2014). Effect of Protein Hydrolysates on Growth
Kinetics and Aminopeptidase Activities of Lactobacillus. Current microbiology, 68(1), 82-
87.
Mendanha, D. V., Molina Ortiz, S. E., Favaro-Trindade, C. S., Mauri, A., Monterrey-Quintero,
E. S., & Thomazini, M. (2009). Microencapsulation of casein hydrolysate by complex
coacervation with SPI/pectin. Food Research International, 42(8), 1099-1104.
Mezhericher, M., Levy, A., & Borde, I. (2009). Modeling of droplet drying in spray chambers
using 2D and 3D computational fluid dynamics. Drying Technology, 27(3), 359-370.
Mezhericher, M., Levy, A., & Borde, I. (2012). Three-dimensional spray-drying model based on
comprehensive formulation of drying kinetics. Drying Technology, 30(11-12), 1256-1273.
Miguel, M., López-Fandiño, R., Ramos, M., & Aleixandre, A. (2005). Short-term effect of egg-
white hydrolysate products on the arterial blood pressure of hypertensive rats. British Journal
of Nutrition, 94(05), 731-737.
35
Miguel, M., Recio, I., Gómez-Ruiz, J., Ramos, M., & López-Fandiño, R. (2004). Angiotensin I-
converting enzyme inhibitory activity of peptides derived from egg white proteins by
enzymatic hydrolysis. Journal of Food Protection®, 67(9), 1914-1920.
Mine, Y. (1995). Recent advances in the understanding of egg white protein functionality.
Trends in Food Science & Technology, 6(7), 225-232.
Moreau, D., & Rosenberg, M. (1993). Microstructure and fat extractability in microcapsules
based on whey proteins or mixtures of whey proteins and lactose. Food structure, 12(4), 457-
468.
Morsi, S., & Alexander, A. (1972). An investigation of particle trajectories in two-phase flow
systems. Journal of Fluid Mechanics, 55(02), 193-208.
Nijdam, J. J., Guo, B., Fletcher, D. F., & Langrish, T. A. (2006). Lagrangian and Eulerian
models for simulating turbulent dispersion and coalescence of droplets within a spray.
Applied mathematical modelling, 30(11), 1196-1211.
Panyam, D., & Kilara, A. (1996). Enhancing the functionality of food proteins by enzymatic
modification. Trends in Food Science & Technology, 7(4), 120-125.
Paris, J. R., Ross Jr, P. N., Dastur, S. P., & Morris, R. L. (1971). Modeling of the air flow pattern
in a countercurrent spray-drying tower. Industrial & Engineering Chemistry Process Design
and Development, 10(2), 157-164.
Park, P.-J., Jung, W.-K., Nam, K.-S., Shahidi, F., & Kim, S.-K. (2001). Purification and
characterization of antioxidative peptides from protein hydrolysate of lecithin-free egg yolk.
Journal of the American Oil Chemists' Society, 78(6), 651-656.
Peoples, G. E., & McLennan, P. L. (2010). Dietary fish oil reduces skeletal muscle oxygen
consumption, provides fatigue resistance and improves contractile recovery in the rat in vivo
hindlimb. British Journal of Nutrition, 104(12), 1771-1779.
Pérez-Alonso, C., Báez-González, J., Beristain, C., Vernon-Carter, E., & Vizcarra-Mendoza, M.
(2003). Estimation of the activation energy of carbohydrate polymers blends as selection
criteria for their use as wall material for spray-dried microcapsules. Carbohydrate polymers,
53(2), 197-203.
Phillips, T., Childs, A. C., Dreon, D. M., Phinney, S., & Leeuwenburgh, C. (2003). A Dietary
Supplement Attenuates IL-6 and CRP after Eccentric Exercise in Untrained Males. Medicine
& Science in Sports & Exercise, 35(12), 2032-2037.
Pokora, M., Eckert, E., Zambrowicz, A., Bobak, Ł., Szołtysik, M., Dąbrowska, A.,
Chrzanowska, J., Polanowski, A., & Trziszka, T. (2013). Biological and functional properties
of proteolytic enzyme‐modified egg protein by‐products. Food Science & Nutrition, 1(2),
184-195.
36
Preston, T., Fearon, K. C. H., Robertson, I., East, B. W., & Calman, K. C. (1987). Tissue loss
during severe wasting in lung cancer patients. In Ellis, K. J., Yasumura , S., & Morgan, W. P.
In Vivo Body Composition Studies. Proceedings of an International Symposium held at
Brookhaven National Laboratory, New York on September 28-October 1, 1986 pp. 60 - 69):
Institute of Physical Sciences in Medicine.
Raimundo, A., Grimble, G., Rees, R., Hunjan, M., & Silk, D. (1988). The influence of fat and
carbohydrate on absorption of partial enzymatic hydrolysates of casein in normal human
jejenum. GASTROENTEROLOGY, 94, A988.
Reineccius, G. A. (1988). Spray-drying of food flavors. In Reineccius, G. A., & Risch, S. J.
Flavor encapsulation. Washington, D.C: ACS Publications.
Riediger, N. D., Othman, R. A., Suh, M., & Moghadasian, M. H. (2009). A Systemic Review of
the Roles of n-3 Fatty Acids in Health and Disease. Journal of the American Dietetic
Association, 109(4), 668-679.
Risch, S. J. (1995). Review of patents for encapsulation and controlled release of food
ingredients. ACS Symposium Series pp. 196-202): ACS Publications.
Salgado, P., Montagne, L., Freire, J. P. B., Ferreira, R. B., Teixeira, A., Bento, O., Abreu, M. C.,
Toullec, R., & Lallès, J.-P. (2002). Legume Grains Enhance Ileal Losses of Specific
Endogenous Serine-Protease Proteins in Weaned Pigs. The Journal of Nutrition, 132(7),
1913-1920.
Schuck, P. (2002). Spray drying of dairy products: state of the art. Le Lait, 82(4), 375-382.
Scott, G., & Richardson, P. (1997). The application of computational fluid dynamics in the food
industry. Trends in Food Science & Technology, 8(4), 119-124.
Simopoulos, A. P. (2007). Omega-3 fatty acids and athletics. Current Sports Medicine Reports,
6(4), 230-236.
Southwell, D., & Langrish, T. (2000). Observations of flow patterns in a spray dryer. Drying
Technology, 18(3), 661-685.
Stevens, L. (1991). Egg white proteins. Comparative Biochemistry and Physiology Part B:
Comparative Biochemistry, 100(1), 1-9.
Surai, P., & Sparks, N. (2001). Designer eggs: from improvement of egg composition to
functional food. Trends in Food Science & Technology, 12(1), 7-16.
Tarnopolsky, M. (2000). Protein and amino acid needs for training and bulking up. Burke, L.
Deakin, V.(eds) Clinical Sports Nutrition, 90-123.
37
Terjung, R. L., Clarkson, P., Eichner, E., Greenhaff, P. L., Hespel, P. J., Israel, R., Kraemer, W.,
Meyer, R., Spriet, L., & Tarnopolsky, M. (2000). American College of Sports Medicine
roundtable. The physiological and health effects of oral creatine supplementation. Medicine
and science in sports and exercise, 32(3), 706-717.
Tipton, K. D., & Wolfe, R. R. (2004). Protein and amino acids for athletes. Journal of Sports
Sciences, 22(1), 65-79.
Tu, J., Yeoh, G. H., & Liu, C. (2007). Computational Fluid Dynamics: A Practical Approach:
Elsevier Science.
Ummadi, M. S., & Curic-Bawden, M. (2010). Use of protein hydrolysates in industrial starter
culture fermentations. Protein Hydrolysates in Biotechnology pp. 91-114): Springer.
van Loon, L. J., Saris, W. H., Verhagen, H., & Wagenmakers, A. J. (2000). Plasma insulin
responses after ingestion of different amino acid or protein mixtures with carbohydrate. The
American journal of clinical nutrition, 72(1), 96-105.
Weggemans, R. M., Zock, P. L., & Katan, M. B. (2001). Dietary cholesterol from eggs increases
the ratio of total cholesterol to high-density lipoprotein cholesterol in humans: a meta-
analysis. The American journal of clinical nutrition, 73(5), 885-891.
Whitehouse, A. S., Smith, H. J., Drake, J. L., & Tisdale, M. J. (2001). Mechanism of attenuation
of skeletal muscle protein catabolism in cancer cachexia by eicosapentaenoic acid. Cancer
research, 61(9), 3604-3609.
Wigmore, S. J., Ross, J. A., Stuart Falconer, J., Plester, C. E., Tisdale, M. J., Carter, D. C., & Ch
Fearon, K. (1996). The effect of polyunsaturated fatty acids on the progress of cachexia in
patients with pancreatic cancer. Nutrition, 12(1), S27-S30.
Xia, B., & Sun, D.-W. (2002). Applications of computational fluid dynamics (CFD) in the food
industry: a review. Computers and electronics in agriculture, 34(1), 5-24.
Young, A. L., & Bass, I. S. (1995). Dietary Supplement Health and Education Act, The. Food &
Drug LJ, 50, 285.
Zhang, Q., Ren, J., Zhao, H., Zhao, M., Xu, J., & Zhao, Q. (2011). Influence of casein
hydrolysates on the growth and lactic acid production of Lactobacillus delbrueckii subsp.
bulgaricus and Streptococcus thermophilus. International Journal of Food Science &
Technology, 46(5), 1014-1020.
38
CHAPTER 2 - EFFECTS OF TEMPERAUTRE, pH, ENZYME-TO-SUBSTRATE
RATIO, AND REACTION TIME ON DEGREE OF HYDROLYSIS OF EGG WHITE
HYDROLYSATES
2.1 Introduction
Table eggs contain all nine essential amino acids (EAA) including histidine, isoleucine,
leucine, lysine, methionine, phenylalanine, threonine, tryptophan and valine (Weggemans, Zock
& Katan, 2001). Food proteins have been modified by enzymes for many years (Liu & Chiang,
2008). Enzymatic hydrolysis is a biological process that modifies the molecular conformation of
native proteins to produce peptides with functional properties that can be used as additives in
beverages, infant formulas, food texture enhancement and pharmaceutical ingredients (Pokora,
Eckert, Zambrowicz, Bobak, Szołtysik, Dąbrowska et al., 2013). According to O’Donnell and
Dornblaser (2002), amino acids and peptides (especially from soy and milk proteins) are gaining
popularity in energy drinks and in other food applications due to their advantageous properties.
Certain egg white derived peptides may also play a role in controlling the development of
hypertension and also have shown antioxidant properties (Davalos, Miguel, Bartolome & Lopez-
Fandino, 2004; Miguel, López-Fandiño, Ramos & Aleixandre, 2005; Miguel, Recio, Gómez-
Ruiz, Ramos & López-Fandiño, 2004). According to Park, Jung, Nam, Shahidi and Kim (2001),
the use of protein hydrolysates with antioxidant activities may be advantageous in functional
foods because they also provide other desired properties such as fat-and water-holding capacity,
and emulsion capacity and stability.
Degree of protein hydrolysis (DH) is a key parameter for producing food protein
hydrolysates because it defines the properties of the final product (Pokora, et al., 2013). A slight
hydrolysis of proteins resulting in protein hydrolysates with DH values lower than 10% can
modify the functionality of proteins (solubility, gelling, fat- and water-holding capacity,
emulsion capacity and stability, and foaming capacity and stability) (Panyam & Kilara, 1996);
39
while, higher DH are desired for protein hydrolysates that are being used as protein supplements
or in hypoallergenic foods in special medical diets (Pokora, et al., 2013).
According to Zheng, Shen, Bu and Luo (2008), response surface methodology (RSM) is an
effective statistical method to optimize numerous process parameters. Several enzymatic
hydrolysis processes has been successfully optimized by RSM (Fang, Zhao & Song, 2010;
Ferreira, Duarte, Ribeiro, Queiroz & Domingues, 2009).
Egg white hydrolysates (EWH) have been produced using non-food grade enzymes and the
process has been focused in producing hydrolysates with high antioxidant activity (Lin, Guo,
You, Yin & Liu, 2012; Pokora, et al., 2013). So, the resulting hydrolysate may not be suitable for
human consumption. Therefore, there is a lack of scientific literature regarding to the production
of food-grade EWH which are a lactose-free source of high quality amino acids.
In the present study, egg whites were hydrolyzed using several food-grade proteases derived
from Bacillus licheniformis, Bacillus subtilis, and Aspergillus oryzae. These food-grade
proteases have a maximum activity at alkaline, neutral and acidic conditions, respectively.
Therefore, the objectives of this study were to: (1) produce food-grade EWH powders using
food-grade proteases, (2) determine the effect of reaction temperature, pH, enzyme-to-substrate
ratio and reaction time on DH of EWH, (3) use a Central Composite Design (CCD) for RSM to
obtain EWH with a maximum DH, and (4) determine the nutritional and physiochemical
properties of EWH powders.
2.2 Materials and methods
2.2.1 Materials
Fresh, large, grade AA hen eggs were purchased from a local chain grocery store, in Baton
Rouge, Louisiana. The eggs were stored at 4°C, and the storage time did not exceed three days.
40
Three commercial food-grade proteases from Bacillus licheniformis, Bacillus subtilis, and
Aspergillus oryzae were obtained from Enzyme Development Corporation (New York, NY). All
other analytical grade reagents were obtained from Sigma Aldrich (St. Louis, MO).
2.2.2 Proteolytic activity of proteases
The proteolytic activity of the food-grade proteases was determined following the method
described by Merheb, Cabral, Gomes and Da-Silva (2007). A mixture of 5 mL of 0.65 (g/100g)
casein solution and 5 mL (0.2 M) of sodium acetate buffer at pH 7.5 was prepared; then 50 mg of
a food–grade enzyme powder were added. The reaction was carried out at 37°C for 10 min and
stopped by the addition of a 5 mL of 110 mM trichloroactic acid (TCA) solution. Afterwards, 1
mL of distilled water was added and the solution was incubated at 37°C for another 10 min.
After the second incubation time, the solution was filtered and 2 mL were mixed with 1 mL of
Folin’s reagent. The solution was heated again at 37°C for 30 min.; and the absorbance of final
solution was then measured at 660 nm. Enzyme activity was determined from a standard curve
prepared with a 1.1 mM tyrosine solution. The results were reported as Units/mg enzyme. One
unit of enzyme activity (U) was defined as the amount in micromoles of tyrosine equivalents
released from casein per minute.
2.2.3 Preparation of egg white hydrolysates (EWH)
Fresh egg whites (EW) were manually separated from egg yolks. Then, the moisture content
of the EW was determined according to the official AOAC method 930.15 (AOAC, 1999). A
10±0.5 (g solids/100g) mixture containing 80g liquid egg white and 20g distilled water was
prepared and homogenized using an ultra-shearing processor (OMNI, Ultrashear M, Omni
International, Kennesaw, GA) for 5 min at 20,000 rpm, and then heated to 65°C in a water bath
for 5 min to denature EW proteins. After heating, the mixture was cooled to room temperature.
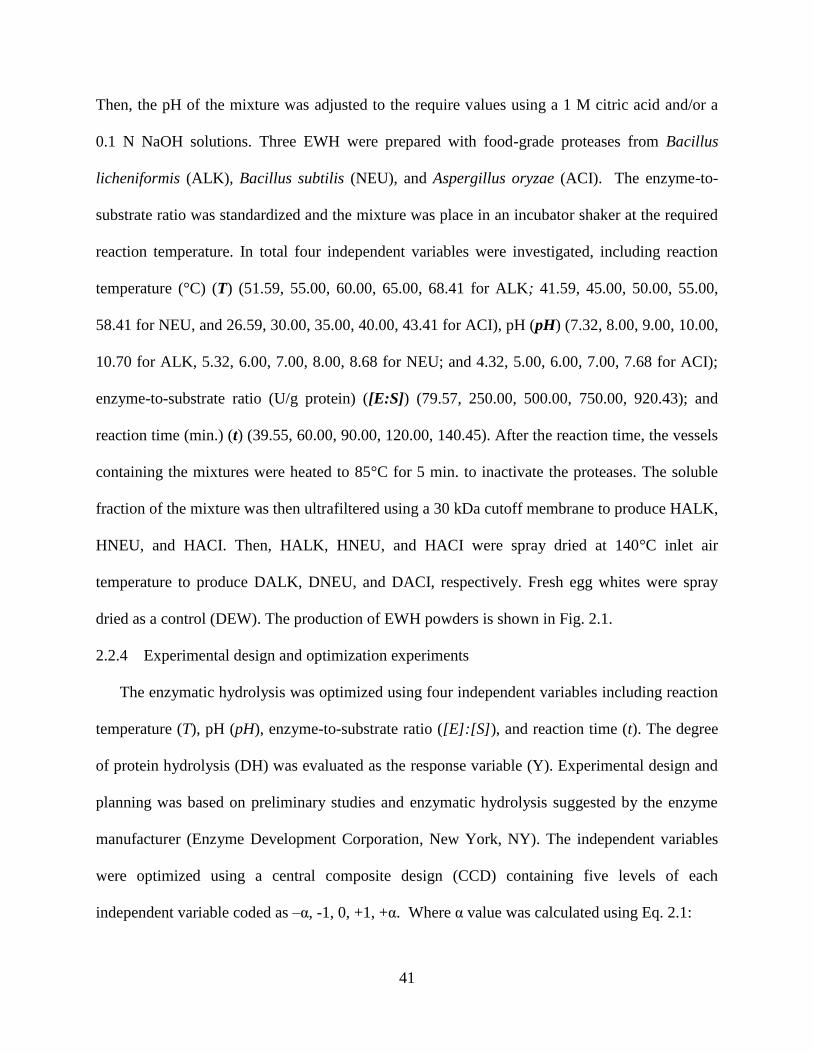
41
Then, the pH of the mixture was adjusted to the require values using a 1 M citric acid and/or a
0.1 N NaOH solutions. Three EWH were prepared with food-grade proteases from Bacillus
licheniformis (ALK), Bacillus subtilis (NEU), and Aspergillus oryzae (ACI). The enzyme-to-
substrate ratio was standardized and the mixture was place in an incubator shaker at the required
reaction temperature. In total four independent variables were investigated, including reaction
temperature (°C) (T) (51.59, 55.00, 60.00, 65.00, 68.41 for ALK; 41.59, 45.00, 50.00, 55.00,
58.41 for NEU, and 26.59, 30.00, 35.00, 40.00, 43.41 for ACI), pH (pH) (7.32, 8.00, 9.00, 10.00,
10.70 for ALK, 5.32, 6.00, 7.00, 8.00, 8.68 for NEU; and 4.32, 5.00, 6.00, 7.00, 7.68 for ACI);
enzyme-to-substrate ratio (U/g protein) ([E:S]) (79.57, 250.00, 500.00, 750.00, 920.43); and
reaction time (min.) (t) (39.55, 60.00, 90.00, 120.00, 140.45). After the reaction time, the vessels
containing the mixtures were heated to 85°C for 5 min. to inactivate the proteases. The soluble
fraction of the mixture was then ultrafiltered using a 30 kDa cutoff membrane to produce HALK,
HNEU, and HACI. Then, HALK, HNEU, and HACI were spray dried at 140°C inlet air
temperature to produce DALK, DNEU, and DACI, respectively. Fresh egg whites were spray
dried as a control (DEW). The production of EWH powders is shown in Fig. 2.1.
2.2.4 Experimental design and optimization experiments
The enzymatic hydrolysis was optimized using four independent variables including reaction
temperature (T), pH (pH), enzyme-to-substrate ratio ([E]:[S]), and reaction time (t). The degree
of protein hydrolysis (DH) was evaluated as the response variable (Y). Experimental design and
planning was based on preliminary studies and enzymatic hydrolysis suggested by the enzyme
manufacturer (Enzyme Development Corporation, New York, NY). The independent variables
were optimized using a central composite design (CCD) containing five levels of each
independent variable coded as –α, -1, 0, +1, +α. Where α value was calculated using Eq. 2.1:
42
∝= 𝐹1/4 (2.1)
Where, F= number of axial points (8). So, α=1.68
Correspondence among coded values and actual values of independent variables are
summarized in Table 2.1 The five-level-four-variable CCD required 30 experiments, consisting
of 16 factorial points, 8 axial points and 6 central points. The total number of experiments was
determined by using Eq. 2.2.
𝑁 = 2𝑘 + 2𝑘 + 𝑛0 (2.2)
Where, N = number of required experiments, k=number of independent variables,
𝑛0=number of central point experiments.
The central point experiments were chosen to verify any change in the estimation procedure,
as a measure of precision property. Each enzymatic experiment was run in triplicate.
Experimental data was statistically analyzed using SAS software version 9.2 (SAS Institute Inc.,
Cary, NC, USA). The optimization data were fitted to a second-order polynomial equation (Eq.
2.3):
𝑌 = 𝛽𝑘𝑂 + ∑ 𝛽𝑘𝑖𝑋𝑖 + ∑ 𝛽𝑘𝑖𝑖𝑋𝑖2 + ∑ ∑ 𝛽𝑘𝑖𝑗𝑋𝑖𝑋𝑗
4𝑗=𝑖+1
4𝑖=1
4𝑖=1
4𝑖=1 (2.3)
Where, Y = degree of protein hydrolysis (DH); 𝛽𝑘𝑂, 𝛽𝑘𝑖, 𝛽𝑘𝑖𝑖, 𝛽𝑘𝑖𝑗are the regression coefficients
for the intercept, linear, quadratic, and interaction terms respectively. 𝑋𝑖 and 𝑋𝑗 are the
independent variables.
Three-dimensional (3D) and contour plots were obtained by using the fitted model that
establishes the relationship between the independent and response variables. The plots were built
using the response value along with two independent variables, while the rest of the variables
were fixed at their 0 level (center values of the testing ranges).
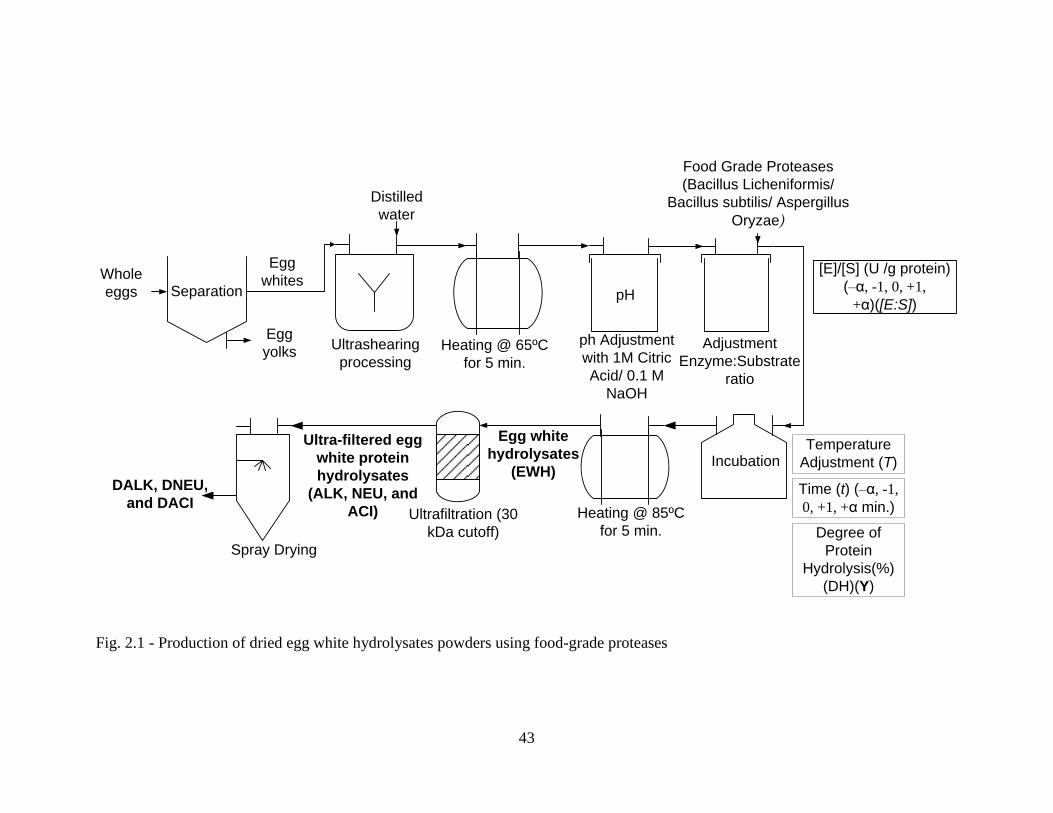
43
Heating @ 65ºC
for 5 min.
Ultrashearing
processing
Adjustment
Enzyme:Substrate
ratio
Temperature
Adjustment (T)
Time (t) (–α, -1,
0, +1, +α min.)
Egg white
hydrolysates
(EWH)
Ultrafiltration (30
kDa cutoff)
Ultra-filtered egg
white protein
hydrolysates
(ALK, NEU, and
ACI) Heating @ 85ºC
for 5 min.
Egg
whitesWhole
eggs
Egg
yolks
Distilled
water
Food Grade Proteases
(Bacillus Licheniformis/
Bacillus subtilis/ Aspergillus
Oryzae)
Separation
Incubation
ph Adjustment
with 1M Citric
Acid/ 0.1 M
NaOH
Degree of
Protein
Hydrolysis(%)
(DH)(Y)
[E]/[S] (U /g protein)
(–α, -1, 0, +1,
+α)([E:S])pH
Spray Drying
DALK, DNEU,
and DACI
Fig. 2.1 - Production of dried egg white hydrolysates powders using food-grade proteases
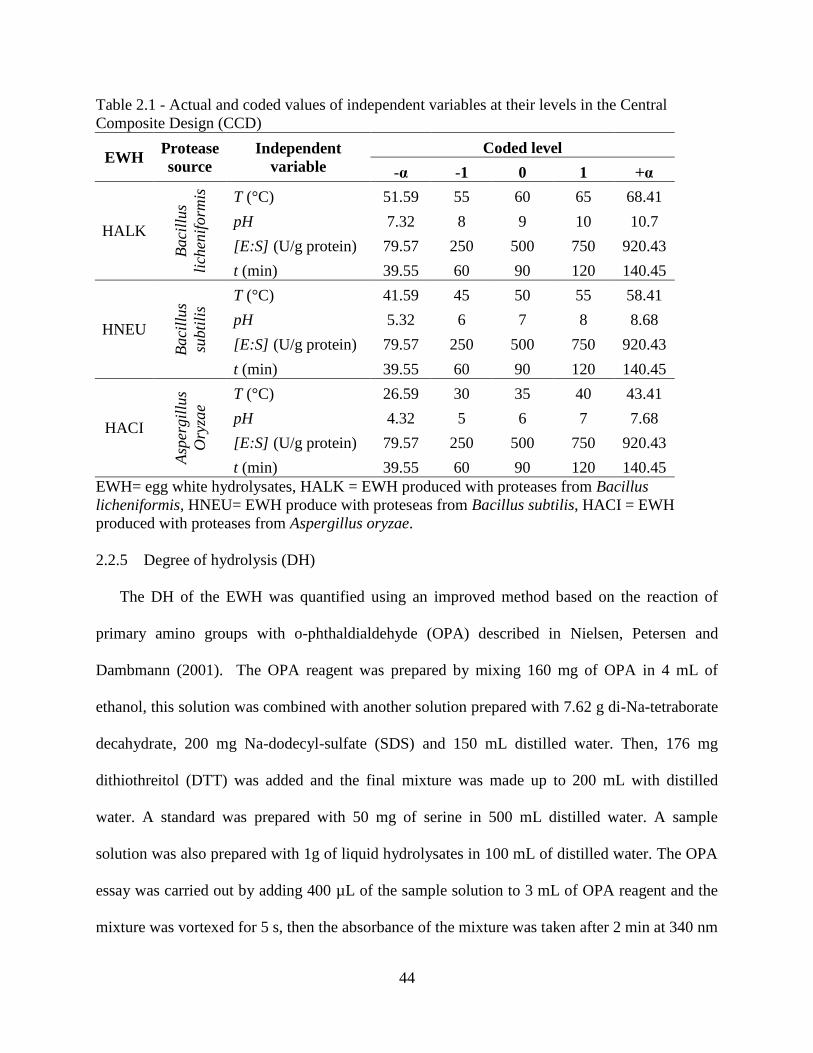
44
Table 2.1 - Actual and coded values of independent variables at their levels in the Central
Composite Design (CCD)
EWH Protease
source
Independent
variable
Coded level
-α -1 0 1 +α
HALK
Baci
llus
lich
enif
orm
is
T (°C) 51.59 55 60 65 68.41
pH 7.32 8 9 10 10.7
[E:S] (U/g protein) 79.57 250 500 750 920.43
t (min) 39.55 60 90 120 140.45
HNEU
Baci
llus
subti
lis
T (°C) 41.59 45 50 55 58.41
pH 5.32 6 7 8 8.68
[E:S] (U/g protein) 79.57 250 500 750 920.43
t (min) 39.55 60 90 120 140.45
HACI
Asp
ergil
lus
Ory
zae
T (°C) 26.59 30 35 40 43.41
pH 4.32 5 6 7 7.68
[E:S] (U/g protein) 79.57 250 500 750 920.43
t (min) 39.55 60 90 120 140.45
EWH= egg white hydrolysates, HALK = EWH produced with proteases from Bacillus
licheniformis, HNEU= EWH produce with proteseas from Bacillus subtilis, HACI = EWH
produced with proteases from Aspergillus oryzae.
2.2.5 Degree of hydrolysis (DH)
The DH of the EWH was quantified using an improved method based on the reaction of
primary amino groups with o-phthaldialdehyde (OPA) described in Nielsen, Petersen and
Dambmann (2001). The OPA reagent was prepared by mixing 160 mg of OPA in 4 mL of
ethanol, this solution was combined with another solution prepared with 7.62 g di-Na-tetraborate
decahydrate, 200 mg Na-dodecyl-sulfate (SDS) and 150 mL distilled water. Then, 176 mg
dithiothreitol (DTT) was added and the final mixture was made up to 200 mL with distilled
water. A standard was prepared with 50 mg of serine in 500 mL distilled water. A sample
solution was also prepared with 1g of liquid hydrolysates in 100 mL of distilled water. The OPA
essay was carried out by adding 400 µL of the sample solution to 3 mL of OPA reagent and the
mixture was vortexed for 5 s, then the absorbance of the mixture was taken after 2 min at 340 nm
45
using a spectrophotometer. Additionally, absorbance was recorded for solutions prepared with
400 µL standard serine solution and 3 mL of OPA. Blank measurements were carried out with
distilled water. The degree of protein hydrolysis (DH) was calculated using Eq. 2.4
100*toth
hDH (2.4)
Where, ℎ𝑡𝑜𝑡 is the total number of peptide bonds per protein equivalent (8); and h is the number
of hydrolyzed bonds calculated using Eq. 2.5
protein g / meqv )( 2
NHserineh (2.5)
Where, α and β are constants for which the values are 1 and 0.4, respectively (Nielsen, Petersen
& Dambmann, 2001). Serine-NH2 (meqv serine NH2/ g protein) was determined using Eq. 2.6
PL
meqv
ODOD
ODODNHSerine
blankdards
blanksample*1*100*1.0*
9516.0*
tan
2
(2.6)
Where, P is the protein content (g/100g) in the sample.
2.2.6 Proximate composition of DALK, DNEU and DACI
Moisture content, total lipids, crude protein and ash were determined for DEW, DALK,
DNEU and DACI. Moisture content was measured according to the AOAC official method
930.15 (AOAC, 1999). Lipids were quantified according to the official AOAC method (AOAC,
2000). A 10 g sample was dissolved in 500 mL of 2:1 chloroform:methanol solution and filtered.
The filtrate was mixed with 100 mL of a 0.66% sodium chloride solution and subsequently
centrifuged. The chloroform layer containing the lipids was evaporated under vacuum using a
rotary evaporator at 40ºC. Crude protein content was determined according to AOAC official
method 992.15 (AOAC, 2006) using a Perkin Elmer Nitrogen Analyzer (Model 2410, Perkin
Elmer Instruments, Norwalk, CT). The crude protein (g/100g) was reported as 6.25 times the
46
nitrogen content (g/100g). Ash content was determined according to the AOAC official method
942.05 (AOAC, 1999). All of the determinations were carried out in triplicate.
2.2.7 Total amino acid and free amino acid analysis
The amino acid analysis of DEW, DALK, DNEU and DACI was conducted at the Louisiana
State University - Agricultural Center (LSU AgCenter) Biotechnology Lab (Baton Rouge, LA).
For total amino acid determination, hydrolysis of the samples were carried out by adding 1 mL
of 6 N HCL to a 2 mg of powder; the hydrolysis was performed for 17 h at 110°C. Afterwards,
20 uL of this sample was mixed with 40 uL of 0.2 mM Nle (norleucine) solution and 940 uL of
sodium azide. Total amino acids were quantified using a Dionex AAA-ICS300 Chromatography
System configured for AAA-Direct equipped with an ED50 electrochemical detector with AAA-
Certified disposable gold working electrode and combination pH/Ag/AgCl reference electrode in
the pH mode. A microbore anion exchange column (AminoPac PA10 2x250 mm) with a ternary
gradient of deionized water, 0.25 M sodium hydroxide and 1.0 M sodium acetate was used as
separation device. The flow rate of the eluents was set at 0.25 mL/min. Free amino acids in the
samples were quantified as described above; however, the hydrolysis step was skipped.
2.2.8 Computation of chemical score
To determine the nutritional value of DEW, DALK, DNEU and DACI powders; it is
necessary to estimate their chemical score; which is the ratio of the amount of an essential amino
acid present in sample to the amount of the essential amino acid present in the standard protein
as described by Ovissipour, Kenari, Motamedzadegan and Nazari (2012). So, the chemical score
was estimated using Eq. 2.7 as follows:
g) (g/100protein standardin EAA
g) (g/100 samplein EAA score Chemical (2.7)
Where, EAA is the essential amino acid.
47
2.2.9 Protein efficiency ratio (PER)
The protein efficiency ratio (PER) indicates the nutritional value of proteins. In this study,
PER values were estimated by using Eq. 2.8; 2.9, and 2.10 as described in Šližytė, Daukšas,
Falch, Storrø and Rustad (2005) and Lee, Elliott, Rickansrud and Hagberg (1978) as follows:
𝑃𝐸𝑅 = −0.468 + 0.45[𝐿𝐸𝑈] − 0.105[𝑇𝑌𝑅] (2.8)
𝑃𝐸𝑅 = −1.816 + 0.435[𝑀𝐸𝑇] + 0.78[𝐿𝐸𝑈] + 0.211[𝐻𝐼𝑆] − 0.944[𝑇𝑌𝑅] (2.9)
𝑃𝐸𝑅 = 0.08084[∑ 𝐴𝐴7] − 0.1094 (2.10)
Where, ∑AA7=threonine + valine + methionine + isoleucine + leucine + phenylalanine + lysine
And the amount of amino acids is expressed as g AA/100g protein.
2.2.10 SDS-PAGE
Samples were prepared by adding 20 µL tracking dye solution (Bio-Rad Tricine sample
buffer with β-mercaptoethanol) to 20 µL liquid sample (previously prepared by dissolving 1g of
sample in 10 mL distilled water) and heated to 100°C for 5 min.
The samples were then centrifuged for 1 min. at 10,000 x g. SDS-PAGE was performed by
loading 20 µL of the prepared sample on 4 – 20% gradient polyacrylamide precise protein gels
(Thermo scientific, Rockford IL). Gels were stained overnight in 0.1% Coomassie Brillian Blue
G-250 with 50% distilled water, 40% methanol, 10% acetic acid and de-stained in distilled
water.
2.2.11 Antioxidant activity
2.2.11.1 Ability to scavenge 2,2-diphenyl-1-picryhydrazyl (DPPH) free radicals
To determine the DPPH radical-scavenging activity of the EWH powders, the methods
described in Klompong, Benjakul, Kantachote and Shahidi (2007) and Pokora, et al. (2013) were
followed.
48
EWH powders were dissolved in distilled water to obtain a concentration of 40 mg
protein/mL. Then, 4 mL of sample solution was mixed with 1.0 mL of 0.2 mM DPPH and
incubated for 30 min at room temperature. Absorbance of the mixture was taken at 517 nm using
a spectrophotometer. Also, absorbance of a control solution (non-containing EWH powders) was
recorded in the same manner. DPPH radical-scavenging activity was calculated according to the
Eq. 2.11.
100*-1 (%)activity scavenging - radical DPPH517
517
controlA
sampleA (2.11)
2.2.11.2 Reducing power
Reducing power of the EWH powders were determined by following the method described in
Klompong, Benjakul, Kantachote and Shahidi (2007). A sample solution containing 40 mg
protein/mL was again prepared and 0.5 mL of the this solution was mixed with 2.5 mL of 0.2 M
phosphate buffer (pH 6.6) and 2.5 mL of 1 (g/100g) potassium ferricyanide. The mixture was
incubated at 50°C for 20min and 2.5 mL of 10(g/100g) of trichloroacetic acid was added after
the incubation time.
Then, the mixture was centrifuged at 956 x g for 10 min. Finally, 2.5 mL of the upper layer
of solution was mixed with 2.5 mL of distilled water and 2.5 mL of 0.1 (g/100g) ferric chloride
and the absorbance was recorded at 700nm. Higher absorbance values mean higher reducing
power of the EWH powders.
2.2.12 Mineral analysis of DEW, DALK, DNEU and DACI
The mineral profile analysis was determined by the acid digestion method involving
microwave technology (CEM microwave, MDS-2000, CEM Corp., Matthews, N.C., U.S.A.).
Approximately 0.2 g of sample was placed in a vessel and 6 mL HNO3 were added. Then, the
sealed vessel was heated until digestion was completed. The samples were cooled for 10 min.
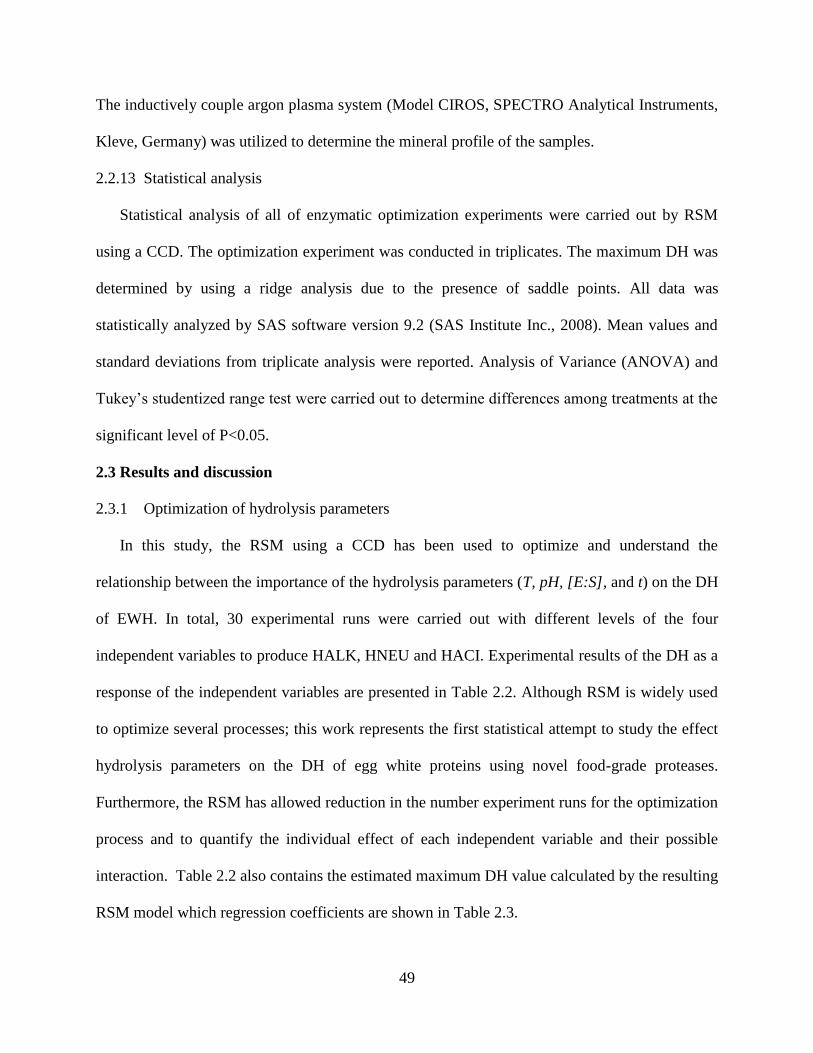
49
The inductively couple argon plasma system (Model CIROS, SPECTRO Analytical Instruments,
Kleve, Germany) was utilized to determine the mineral profile of the samples.
2.2.13 Statistical analysis
Statistical analysis of all of enzymatic optimization experiments were carried out by RSM
using a CCD. The optimization experiment was conducted in triplicates. The maximum DH was
determined by using a ridge analysis due to the presence of saddle points. All data was
statistically analyzed by SAS software version 9.2 (SAS Institute Inc., 2008). Mean values and
standard deviations from triplicate analysis were reported. Analysis of Variance (ANOVA) and
Tukey’s studentized range test were carried out to determine differences among treatments at the
significant level of P<0.05.
2.3 Results and discussion
2.3.1 Optimization of hydrolysis parameters
In this study, the RSM using a CCD has been used to optimize and understand the
relationship between the importance of the hydrolysis parameters (T, pH, [E:S], and t) on the DH
of EWH. In total, 30 experimental runs were carried out with different levels of the four
independent variables to produce HALK, HNEU and HACI. Experimental results of the DH as a
response of the independent variables are presented in Table 2.2. Although RSM is widely used
to optimize several processes; this work represents the first statistical attempt to study the effect
hydrolysis parameters on the DH of egg white proteins using novel food-grade proteases.
Furthermore, the RSM has allowed reduction in the number experiment runs for the optimization
process and to quantify the individual effect of each independent variable and their possible
interaction. Table 2.2 also contains the estimated maximum DH value calculated by the resulting
RSM model which regression coefficients are shown in Table 2.3.
50
A quadratic polynomial equation was proposed to describe the mathematical relationship
between the response and the independent variables. The fit of the model was evaluated by the
determination of the R2 coefficient.
According to the ANOVA table (Table 2.4), linear, quadratic and the interaction of the
regression coefficients were highly significant (P<0.05). Therefore, all of the RSM regression
models for HALK, HNEU, and HACI were also highly significant (P<0.05). Highly significant
RSM models are statistically valid (Fang, Zhao & Song, 2010). RSM models had an R2 of
0.9348, 0.9209, and 0.8449 for HALK, HNEU, and HACI, respectively. Hence, more than the
84% of the variation could be explained by the RSM models. The results also indicated that a
lack of fit tests, which indicates the fitness of the RSM models, were not significant; therefore,
RSM models were sufficiently accurate to predict the DH for any combination of experimental
independent variables within the ranges studied.
High correlation of experimental results with those predicted by RSM models for enzymatic
hydrolysis have been previously reported (Bhaskar, Benila, Radha & Lalitha, 2008; Ovissipour,
Kenari, Motamedzadegan & Nazari, 2012). According to the results, the T, pH, and [E:S] had a
significantly (p<0.05) effect on the DH of HALK, HNEU, and HACI (Table 2.4). Meanwhile the
t had a significantly (P<0.05) effect only in HALK and HACI. According Guerard, Guimas and
Binet (2002), a reduction in DH is observed (in some hydrolysis cases) by increasing reaction
time (after certain level) which may be the result of the formation of reaction products at high
DH that may limit protease activity, reduce of the number of peptide bonds available for
hydrolysis, and produce enzyme inhibition and deactivation. Higher values of the optimal levels
of T, pH, and [E:S] results in a decrease in DH due to denaturation of enzymes and reduction of
their biological activity (Ovissipour, Kenari, Motamedzadegan & Nazari, 2012).
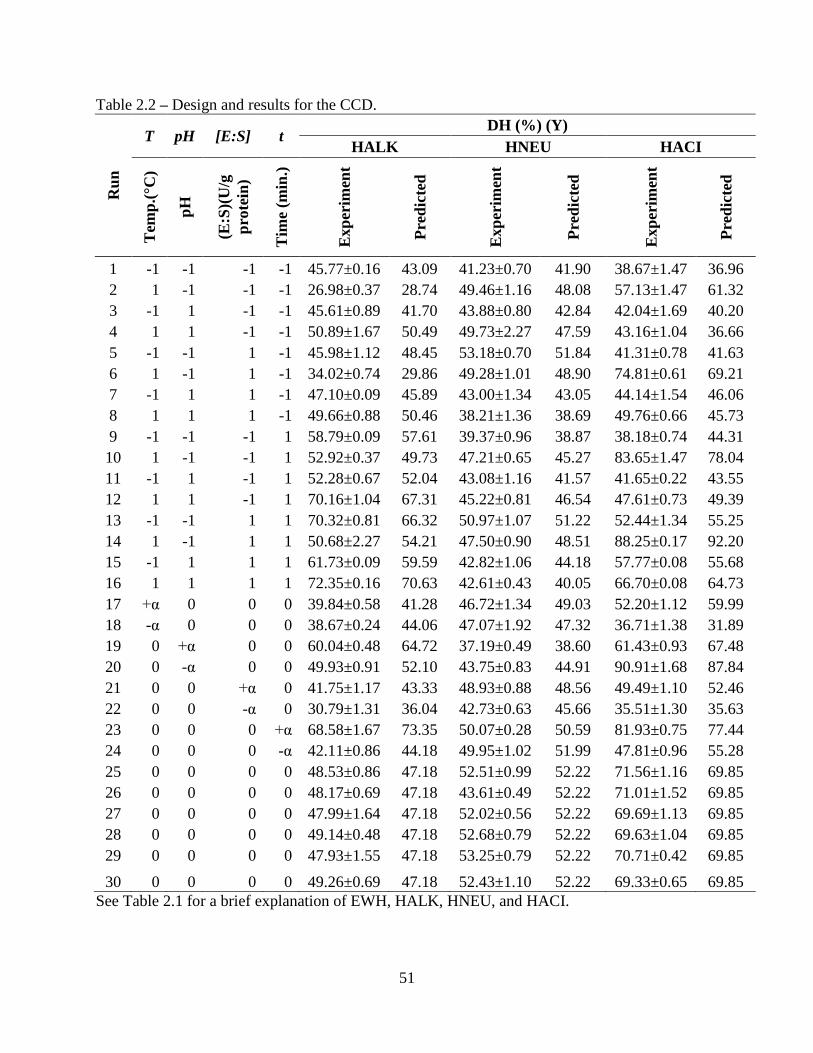
51
Table 2.2 – Design and results for the CCD. R
un
T pH [E:S] t DH (%) (Y)
HALK HNEU HACI T
emp
.(°C
)
pH
(E:S
)(U
/g
pro
tein
)
Tim
e (m
in.)
Exp
erim
ent
Pre
dic
ted
Exp
erim
ent
Pre
dic
ted
Exp
erim
ent
Pre
dic
ted
1 -1 -1 -1 -1 45.77±0.16 43.09 41.23±0.70 41.90 38.67±1.47 36.96
2 1 -1 -1 -1 26.98±0.37 28.74 49.46±1.16 48.08 57.13±1.47 61.32
3 -1 1 -1 -1 45.61±0.89 41.70 43.88±0.80 42.84 42.04±1.69 40.20
4 1 1 -1 -1 50.89±1.67 50.49 49.73±2.27 47.59 43.16±1.04 36.66
5 -1 -1 1 -1 45.98±1.12 48.45 53.18±0.70 51.84 41.31±0.78 41.63
6 1 -1 1 -1 34.02±0.74 29.86 49.28±1.01 48.90 74.81±0.61 69.21
7 -1 1 1 -1 47.10±0.09 45.89 43.00±1.34 43.05 44.14±1.54 46.06
8 1 1 1 -1 49.66±0.88 50.46 38.21±1.36 38.69 49.76±0.66 45.73
9 -1 -1 -1 1 58.79±0.09 57.61 39.37±0.96 38.87 38.18±0.74 44.31
10 1 -1 -1 1 52.92±0.37 49.73 47.21±0.65 45.27 83.65±1.47 78.04
11 -1 1 -1 1 52.28±0.67 52.04 43.08±1.16 41.57 41.65±0.22 43.55
12 1 1 -1 1 70.16±1.04 67.31 45.22±0.81 46.54 47.61±0.73 49.39
13 -1 -1 1 1 70.32±0.81 66.32 50.97±1.07 51.22 52.44±1.34 55.25
14 1 -1 1 1 50.68±2.27 54.21 47.50±0.90 48.51 88.25±0.17 92.20
15 -1 1 1 1 61.73±0.09 59.59 42.82±1.06 44.18 57.77±0.08 55.68
16 1 1 1 1 72.35±0.16 70.63 42.61±0.43 40.05 66.70±0.08 64.73
17 +α 0 0 0 39.84±0.58 41.28 46.72±1.34 49.03 52.20±1.12 59.99
18 -α 0 0 0 38.67±0.24 44.06 47.07±1.92 47.32 36.71±1.38 31.89
19 0 +α 0 0 60.04±0.48 64.72 37.19±0.49 38.60 61.43±0.93 67.48
20 0 -α 0 0 49.93±0.91 52.10 43.75±0.83 44.91 90.91±1.68 87.84
21 0 0 +α 0 41.75±1.17 43.33 48.93±0.88 48.56 49.49±1.10 52.46
22 0 0 -α 0 30.79±1.31 36.04 42.73±0.63 45.66 35.51±1.30 35.63
23 0 0 0 +α 68.58±1.67 73.35 50.07±0.28 50.59 81.93±0.75 77.44
24 0 0 0 -α 42.11±0.86 44.18 49.95±1.02 51.99 47.81±0.96 55.28
25 0 0 0 0 48.53±0.86 47.18 52.51±0.99 52.22 71.56±1.16 69.85
26 0 0 0 0 48.17±0.69 47.18 43.61±0.49 52.22 71.01±1.52 69.85
27 0 0 0 0 47.99±1.64 47.18 52.02±0.56 52.22 69.69±1.13 69.85
28 0 0 0 0 49.14±0.48 47.18 52.68±0.79 52.22 69.63±1.04 69.85
29 0 0 0 0 47.93±1.55 47.18 53.25±0.79 52.22 70.71±0.42 69.85
30 0 0 0 0 49.26±0.69 47.18 52.43±1.10 52.22 69.33±0.65 69.85
See Table 2.1 for a brief explanation of EWH, HALK, HNEU, and HACI.
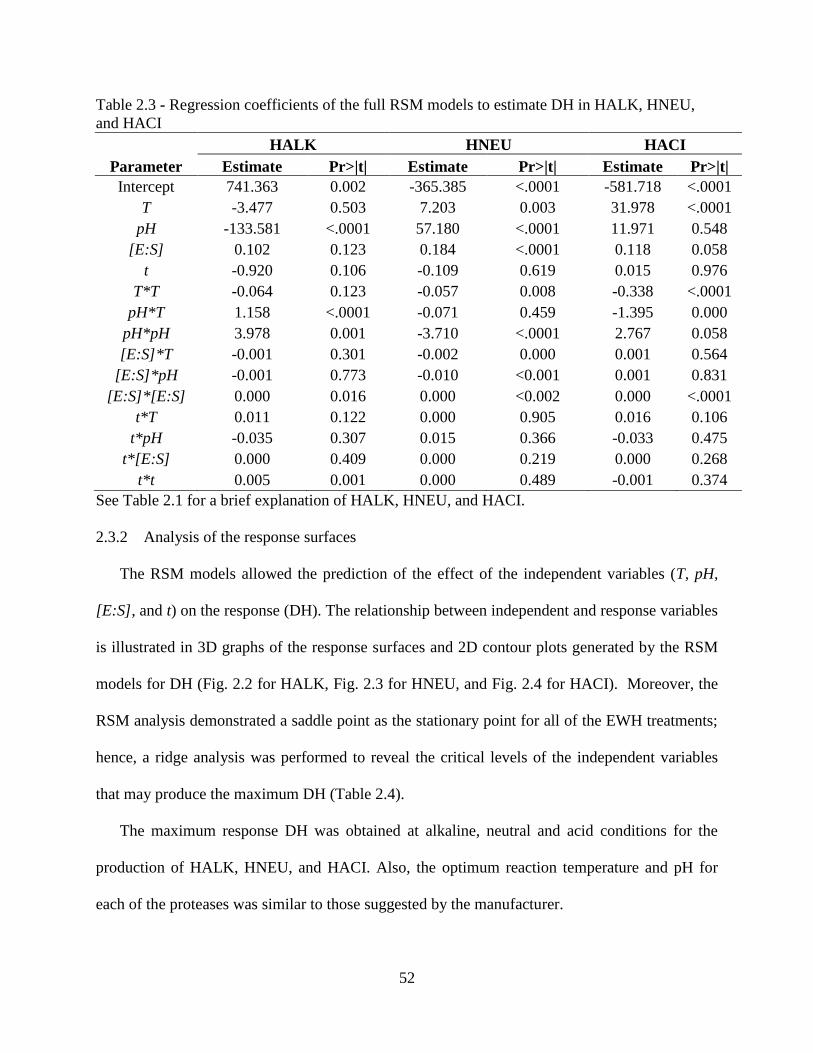
52
Table 2.3 - Regression coefficients of the full RSM models to estimate DH in HALK, HNEU,
and HACI
Parameter
HALK HNEU HACI
Estimate Pr>|t| Estimate Pr>|t| Estimate Pr>|t|
Intercept 741.363 0.002 -365.385 <.0001 -581.718 <.0001
T -3.477 0.503 7.203 0.003 31.978 <.0001
pH -133.581 <.0001 57.180 <.0001 11.971 0.548
[E:S] 0.102 0.123 0.184 <.0001 0.118 0.058
t -0.920 0.106 -0.109 0.619 0.015 0.976
T*T -0.064 0.123 -0.057 0.008 -0.338 <.0001
pH*T 1.158 <.0001 -0.071 0.459 -1.395 0.000
pH*pH 3.978 0.001 -3.710 <.0001 2.767 0.058
[E:S]*T -0.001 0.301 -0.002 0.000 0.001 0.564
[E:S]*pH -0.001 0.773 -0.010 <0.001 0.001 0.831
[E:S]*[E:S] 0.000 0.016 0.000 <0.002 0.000 <.0001
t*T 0.011 0.122 0.000 0.905 0.016 0.106
t*pH -0.035 0.307 0.015 0.366 -0.033 0.475
t*[E:S] 0.000 0.409 0.000 0.219 0.000 0.268
t*t 0.005 0.001 0.000 0.489 -0.001 0.374
See Table 2.1 for a brief explanation of HALK, HNEU, and HACI.
2.3.2 Analysis of the response surfaces
The RSM models allowed the prediction of the effect of the independent variables (T, pH,
[E:S], and t) on the response (DH). The relationship between independent and response variables
is illustrated in 3D graphs of the response surfaces and 2D contour plots generated by the RSM
models for DH (Fig. 2.2 for HALK, Fig. 2.3 for HNEU, and Fig. 2.4 for HACI). Moreover, the
RSM analysis demonstrated a saddle point as the stationary point for all of the EWH treatments;
hence, a ridge analysis was performed to reveal the critical levels of the independent variables
that may produce the maximum DH (Table 2.4).
The maximum response DH was obtained at alkaline, neutral and acid conditions for the
production of HALK, HNEU, and HACI. Also, the optimum reaction temperature and pH for
each of the proteases was similar to those suggested by the manufacturer.
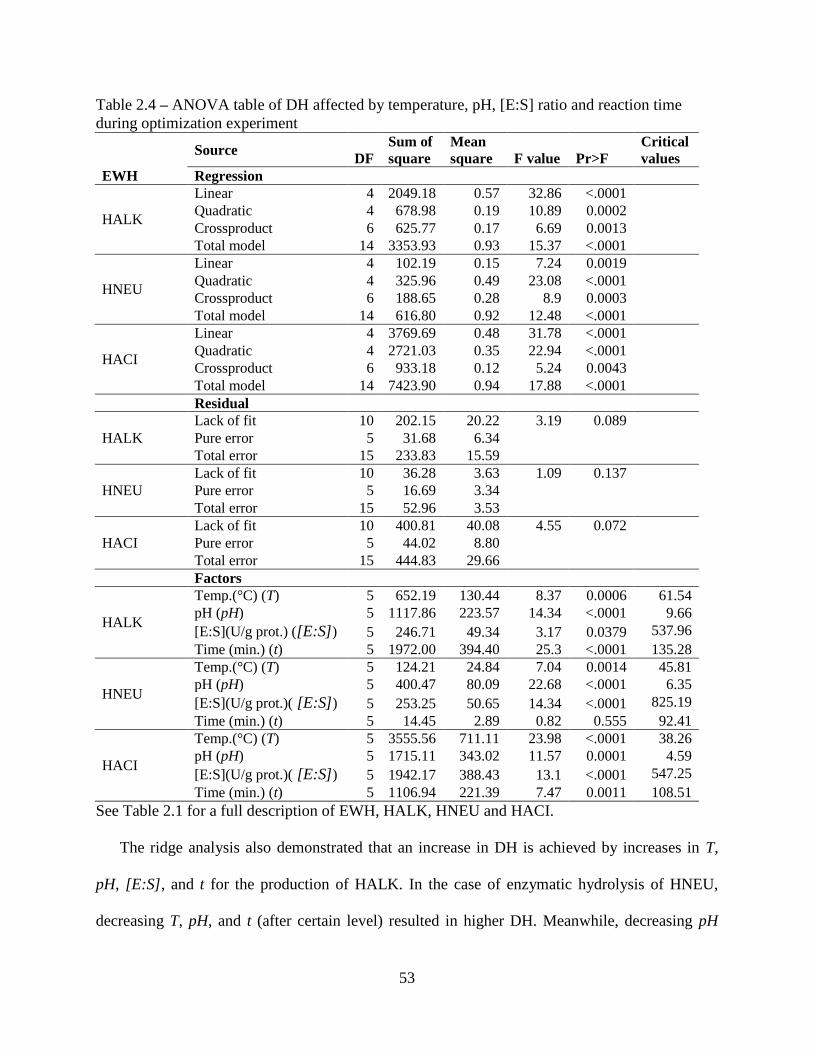
53
Table 2.4 – ANOVA table of DH affected by temperature, pH, [E:S] ratio and reaction time
during optimization experiment
EWH
Source DF
Sum of
square
Mean
square F value Pr>F
Critical
values
Regression
HALK
Linear 4 2049.18 0.57 32.86 <.0001
Quadratic 4 678.98 0.19 10.89 0.0002
Crossproduct 6 625.77 0.17 6.69 0.0013
Total model 14 3353.93 0.93 15.37 <.0001
HNEU
Linear 4 102.19 0.15 7.24 0.0019
Quadratic 4 325.96 0.49 23.08 <.0001
Crossproduct 6 188.65 0.28 8.9 0.0003
Total model 14 616.80 0.92 12.48 <.0001
HACI
Linear 4 3769.69 0.48 31.78 <.0001
Quadratic 4 2721.03 0.35 22.94 <.0001
Crossproduct 6 933.18 0.12 5.24 0.0043
Total model 14 7423.90 0.94 17.88 <.0001
Residual
HALK
Lack of fit 10 202.15 20.22 3.19 0.089
Pure error 5 31.68 6.34
Total error 15 233.83 15.59
HNEU
Lack of fit 10 36.28 3.63 1.09 0.137
Pure error 5 16.69 3.34
Total error 15 52.96 3.53
HACI
Lack of fit 10 400.81 40.08 4.55 0.072
Pure error 5 44.02 8.80
Total error 15 444.83 29.66
Factors
HALK
Temp.(°C) (T) 5 652.19 130.44 8.37 0.0006 61.54
pH (pH) 5 1117.86 223.57 14.34 <.0001 9.66
[E:S](U/g prot.) ([E:S]) 5 246.71 49.34 3.17 0.0379 537.96
Time (min.) (t) 5 1972.00 394.40 25.3 <.0001 135.28
HNEU
Temp.(°C) (T) 5 124.21 24.84 7.04 0.0014 45.81
pH (pH) 5 400.47 80.09 22.68 <.0001 6.35
[E:S](U/g prot.)( [E:S]) 5 253.25 50.65 14.34 <.0001 825.19
Time (min.) (t) 5 14.45 2.89 0.82 0.555 92.41
HACI
Temp.(°C) (T) 5 3555.56 711.11 23.98 <.0001 38.26
pH (pH) 5 1715.11 343.02 11.57 0.0001 4.59
[E:S](U/g prot.)( [E:S]) 5 1942.17 388.43 13.1 <.0001 547.25
Time (min.) (t) 5 1106.94 221.39 7.47 0.0011 108.51
See Table 2.1 for a full description of EWH, HALK, HNEU and HACI.
The ridge analysis also demonstrated that an increase in DH is achieved by increases in T,
pH, [E:S], and t for the production of HALK. In the case of enzymatic hydrolysis of HNEU,
decreasing T, pH, and t (after certain level) resulted in higher DH. Meanwhile, decreasing pH
54
and increasing T, [E:S], and t (after certain level) resulted in an increase in DH for the enzymatic
hydrolysis of HACI. A strong dependence on reaction temperature, pH, enzyme activity, and
reaction time for enzymatic hydrolysis of food proteins has been reported by Bhaskar, Benila,
Radha and Lalitha (2008).
To create the 3D graphs, two independent variables were kept constant at a fixed value
(coded value of 0); since only two independent variables could be plotted against the response
variable (DH). For HALK, it was observed that the variables pH, [E:S], and t had a clear
quadratic effect on the response; meanwhile, the variable T showed a more linear effect on the
response (Fig. 2.2). The ridge analysis revealed that the maximum predicted value of DH was
around 74.63%. HALK produced using the critical values of the hydrolysis parameters (obtained
by the RSM) had a DH of 69.18%. In the case of hydrolysis for HNEU, the independent
variables T, pH, and [E:S] presented a quadratic effect; while the independent variable t had a
more linear effect over the response (Fig. 2.3). The maximum predicted value of DH is around
52.88% obtained by the ridge analysis; meanwhile, experimental value of DH at optimum
conditions for NEU was 49.78%. The effect of the independent variables for HACI is presented
in Fig. 2.4. It was observed that the variables T and [E:S] had a quadratic effect; meanwhile, pH
and t showed a linear effect over the response. The ridge analysis demonstrated that the
maximum predicted value of DH in HACI was around 98.25%; however, experimental results
showed that HACI had a DH of 92.28 % at optimum conditions obtained by RSM.
Zheng, Shen, Bu and Luo (2008) has reported a maximum DH of 32% in whey protein
hydrolysates using alcalase from Bacillus licheniformis. However, the scope of their study was to
obtain hydrolysates with the maximum antigenicity properties. In another study conducted by
Pokora, et al. (2013), a DH of 20.9% is reported in protein hydrolysates using egg white by-
55
products left after the extraction of lysozyme and cystatin (from egg white) and a non-food grade
protease from Bacillus amyloliquefaciens (highest activity at neutral pH conditions). Other
authors have reported DH of egg white hydrolysates of 95.8, 95.3, and 79.9% using non-food
grade trypsin, chymotrypsin, and elastase, respectively (Graszkiewicz, Zelazko & Trziszka,
2010). Previous studies were aimed at producing peptides with high antioxidant activity. Van der
Plancken, Van Remoortere, Indrawati, Van Loey and Hendrickx (2003) reported a DH of 6.65%
in egg white hydrolysates after 10 min. using a non-food grade mixture of trypsin and α-
chymotrypsin. They also found that a heat-induced denaturation of egg white proteins enhances
the DH. High DH (>10%) is important in protein hydrolysates which intended used are in protein
supplements, hypoallergenic food and/or special medical diets (Pokora, et al., 2013).
2.3.3 Proximate composition
Proximate composition of EWH powders is shown in Table 2.5. EWH powders had similar
moisture content. Also, all of the EWH powders had a high crude protein content (> 79 g/100
powder); however, DEW showed a significantly higher (p<0.05) protein content than the rest of
the powders. This may be due to amino acid degradation during hydrolysis. In contrast, DNEU
and DACI had a significantly (p<0.05) higher ash content compared to those of DEW and
DALK. This may be the result of the addition of proteases, citric acid and/or NaOH to adjust the
pH during hydrolysis. Meanwhile, fat content remained constant in all of the EWH powders. The
results are similar to those reported by (AEB, 1999). The fat content in all of the EWH powders
was around 2.35 – 2.66 (g/100 g powder). According to Friedman (1996), proteins are essential
in the human’s diet and their basic function is to supply adequate amounts of amino acids. The
recommended daily allowance (RDA) for protein in the USA is 0.8 to 0.9 g/kg body weight/day;
however, protein requirements for athletes can be 50 to 100% higher (Tarnopolsky, 2000).
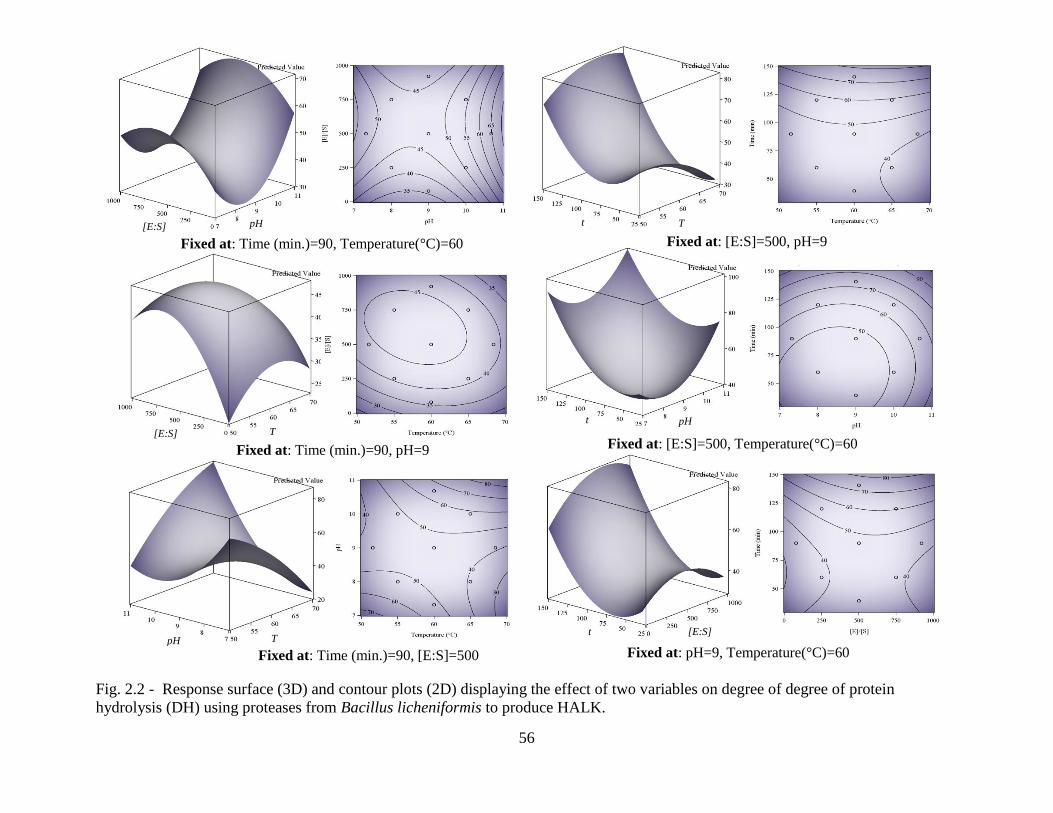
56
Fixed at: [E:S]=500, Temperature(°C)=60
(°C)=60
Fixed at: Time (min.)=90, Temperature(°C)=60
Fixed at: Time (min.)=90, [E:S]=500
Fig. 2.2 - Response surface (3D) and contour plots (2D) displaying the effect of two variables on degree of degree of protein
hydrolysis (DH) using proteases from Bacillus licheniformis to produce HALK.
Fixed at: pH=9, Temperature(°C)=60
Fixed at: [E:S]=500, pH=9
Fixed at: Time (min.)=90, pH=9
T
T
T t
t
t pH
pH
pH
[E:S]
[E:S]
[E:S]
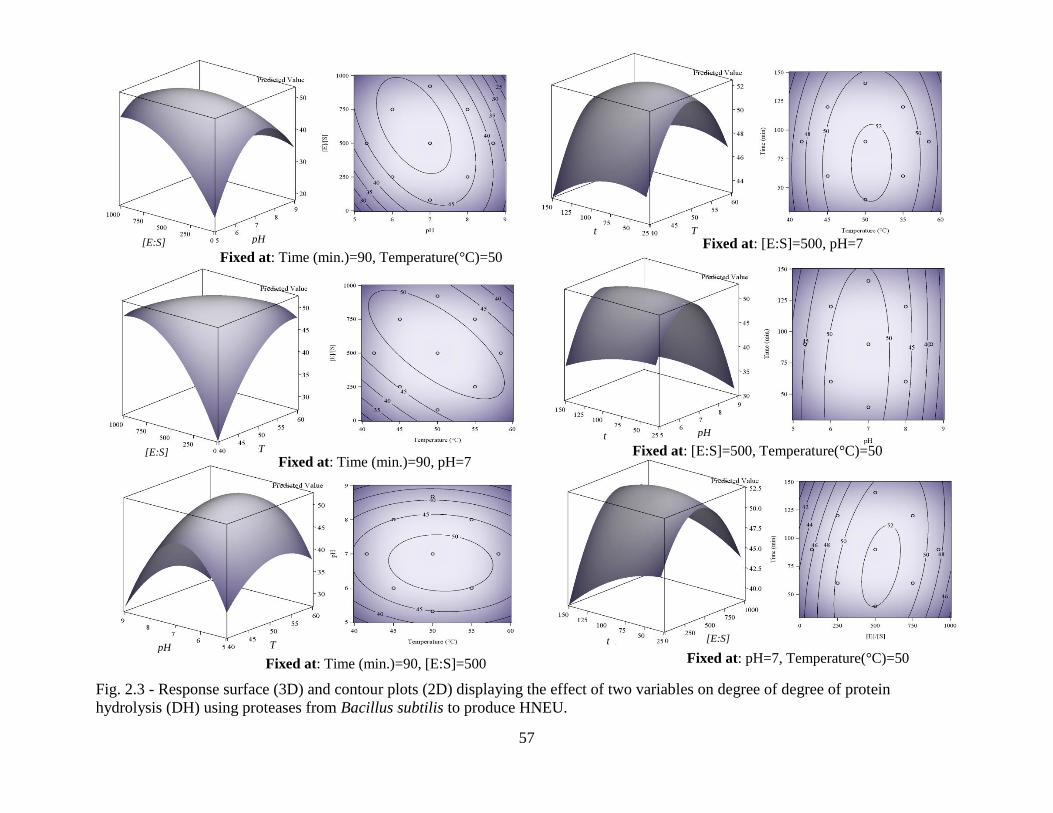
57
Fixed at: Time (min.)=90, [E:S]=500
Fig. 2.3 - Response surface (3D) and contour plots (2D) displaying the effect of two variables on degree of degree of protein
hydrolysis (DH) using proteases from Bacillus subtilis to produce HNEU.
Fixed at: [E:S]=500, Temperature(°C)=50 Fixed at: Time (min.)=90, pH=7
Fixed at: Time (min.)=90, Temperature(°C)=50
Fixed at: pH=7, Temperature(°C)=50
Fixed at: [E:S]=500, pH=7
T
T
T
pH
pH
pH
[E:S]
[E:S]
[E:S] t
t
t
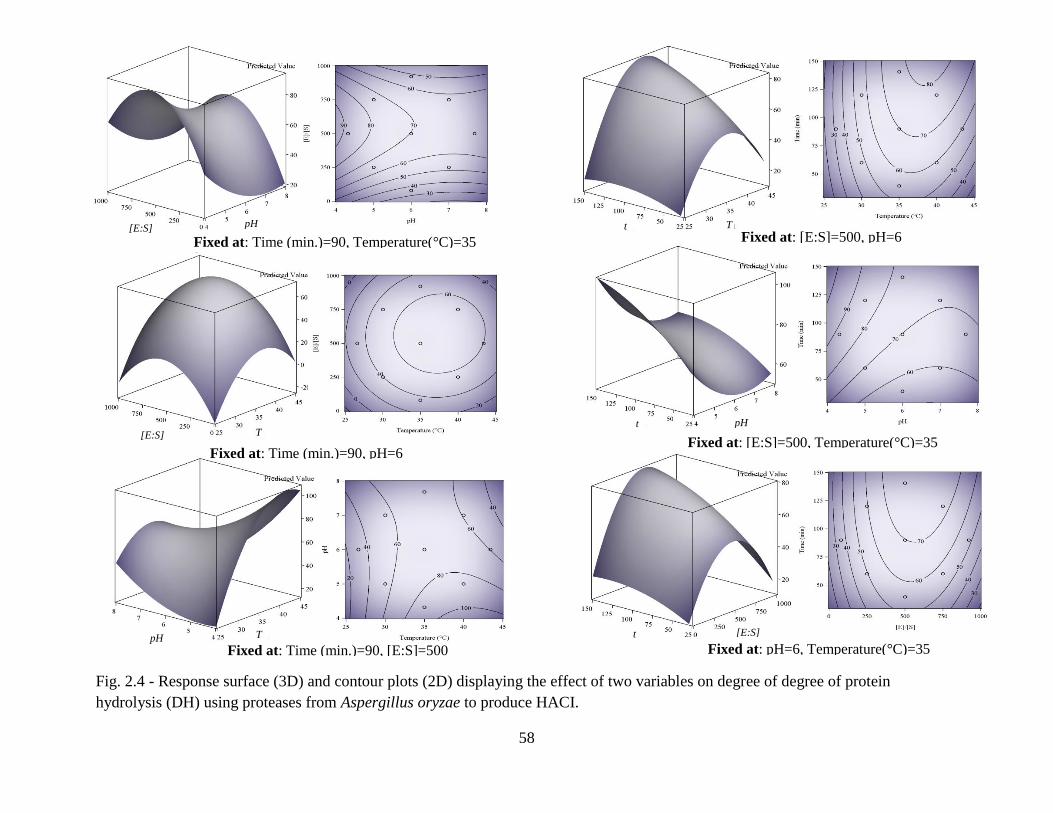
58
Fig. 2.4 - Response surface (3D) and contour plots (2D) displaying the effect of two variables on degree of degree of protein
hydrolysis (DH) using proteases from Aspergillus oryzae to produce HACI.
Fixed at: Time (min.)=90, Temperature(°C)=35
Fixed at: Time (min.)=90, pH=6
Fixed at: Time (min.)=90, [E:S]=500 Fixed at: pH=6, Temperature(°C)=35
Fixed at: [E:S]=500, Temperature(°C)=35
Fixed at: [E:S]=500, pH=6
T
T
T pH
pH
pH [E:S]
[E:S]
[E:S] t
t
t
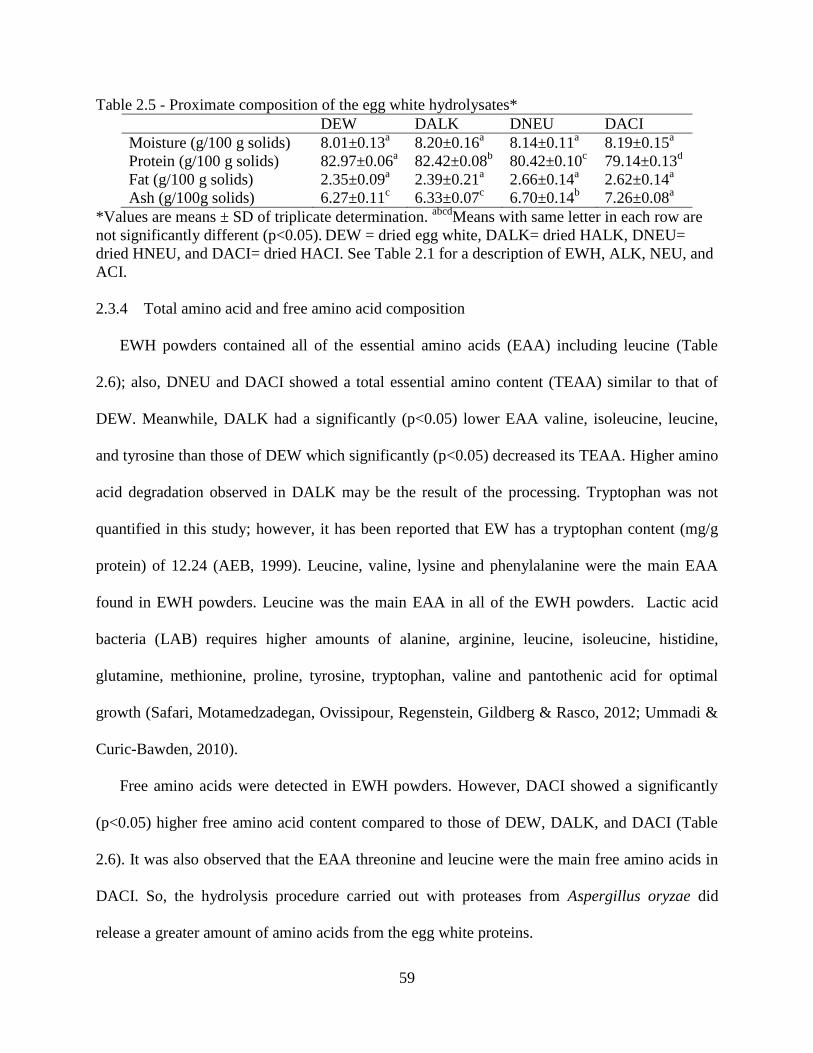
59
Table 2.5 - Proximate composition of the egg white hydrolysates*
DEW DALK DNEU DACI
Moisture (g/100 g solids) 8.01±0.13a 8.20±0.16
a 8.14±0.11
a 8.19±0.15
a
Protein (g/100 g solids) 82.97±0.06a 82.42±0.08
b 80.42±0.10
c 79.14±0.13
d
Fat (g/100 g solids) 2.35±0.09a 2.39±0.21
a 2.66±0.14
a 2.62±0.14
a
Ash (g/100g solids) 6.27±0.11c 6.33±0.07
c 6.70±0.14
b 7.26±0.08
a
*Values are means ± SD of triplicate determination. abcd
Means with same letter in each row are
not significantly different (p<0.05). DEW = dried egg white, DALK= dried HALK, DNEU=
dried HNEU, and DACI= dried HACI. See Table 2.1 for a description of EWH, ALK, NEU, and
ACI.
2.3.4 Total amino acid and free amino acid composition
EWH powders contained all of the essential amino acids (EAA) including leucine (Table
2.6); also, DNEU and DACI showed a total essential amino content (TEAA) similar to that of
DEW. Meanwhile, DALK had a significantly (p<0.05) lower EAA valine, isoleucine, leucine,
and tyrosine than those of DEW which significantly (p<0.05) decreased its TEAA. Higher amino
acid degradation observed in DALK may be the result of the processing. Tryptophan was not
quantified in this study; however, it has been reported that EW has a tryptophan content (mg/g
protein) of 12.24 (AEB, 1999). Leucine, valine, lysine and phenylalanine were the main EAA
found in EWH powders. Leucine was the main EAA in all of the EWH powders. Lactic acid
bacteria (LAB) requires higher amounts of alanine, arginine, leucine, isoleucine, histidine,
glutamine, methionine, proline, tyrosine, tryptophan, valine and pantothenic acid for optimal
growth (Safari, Motamedzadegan, Ovissipour, Regenstein, Gildberg & Rasco, 2012; Ummadi &
Curic-Bawden, 2010).
Free amino acids were detected in EWH powders. However, DACI showed a significantly
(p<0.05) higher free amino acid content compared to those of DEW, DALK, and DACI (Table
2.6). It was also observed that the EAA threonine and leucine were the main free amino acids in
DACI. So, the hydrolysis procedure carried out with proteases from Aspergillus oryzae did
release a greater amount of amino acids from the egg white proteins.
60
2.3.5 Chemical score
According to Ovissipour, Kenari, Motamedzadegan and Nazari (2012), the chemical score is
a parameter that compares the levels of EAA between the evaluated and the standard proteins. In
this study, the standard protein of FAO/WHO (1990) for adults was used as the reference protein
of comparison. It was observed that all of the EWH powders provide all EAA in higher amounts
compared with the suggested amino acid pattern recommended by FAO/WHO for adult humans
(Table 2.7). EWH powders contained more than four times the levels of valine and threonine and
more than three times the levels of leucine than in the reference protein. The EAA content in all
of the EWH powders was significantly higher than in the standard protein of FAO/WHO (1990).
According to Friedman (1996), proteins or hydrolysates with high biological value or quality are
those containing amino acids with high chemical scores. DALK had a significantly (p<0.05)
lower chemical score values of valine and isoleucine. Chemical score is also a good parameter to
quantified amino acid degradation due to processing (Friedman, 1996). These results are
comparable with the total amino acid results previously presented for EWH powders.
2.3.6 Protein efficiency ratio (PER)
The protein efficiency ratio (PER) indicates the nutritional value of proteins. PER measures
the quality of proteins by feeding rats for a given period of time with a diet containing 10% of
the test protein and measuring their weight gain. Due to the high cost and time required for these
kind of experiments; some mathematical equations have been developed to predict the PER of
proteins. PER values of EWH powders were from 2.95 to 3.33 (Table 2.8). According to
Friedman (1996), food proteins with PER values below 1.5 describes a protein of low or poor
quality; values between 1.5 and 2.0 are for intermediate quality proteins, and values above 2.0
are for good to high quality proteins.
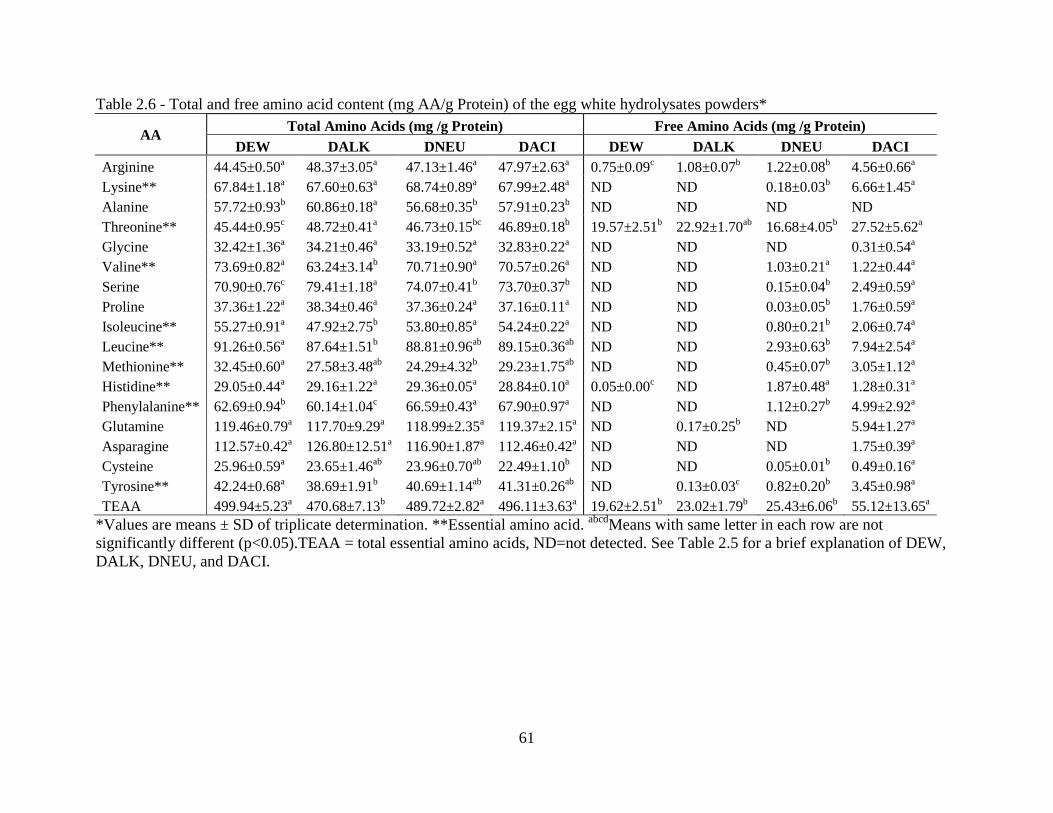
61
Table 2.6 - Total and free amino acid content (mg AA/g Protein) of the egg white hydrolysates powders*
AA Total Amino Acids (mg /g Protein) Free Amino Acids (mg /g Protein)
DEW DALK DNEU DACI DEW DALK DNEU DACI
Arginine 44.45±0.50a 48.37±3.05
a 47.13±1.46
a 47.97±2.63
a 0.75±0.09
c 1.08±0.07
b 1.22±0.08
b 4.56±0.66
a
Lysine** 67.84±1.18a 67.60±0.63
a 68.74±0.89
a 67.99±2.48
a ND ND 0.18±0.03
b 6.66±1.45
a
Alanine 57.72±0.93b 60.86±0.18
a 56.68±0.35
b 57.91±0.23
b ND ND ND ND
Threonine** 45.44±0.95c 48.72±0.41
a 46.73±0.15
bc 46.89±0.18
b 19.57±2.51
b 22.92±1.70
ab 16.68±4.05
b 27.52±5.62
a
Glycine 32.42±1.36a 34.21±0.46
a 33.19±0.52
a 32.83±0.22
a ND ND ND 0.31±0.54
a
Valine** 73.69±0.82a 63.24±3.14
b 70.71±0.90
a 70.57±0.26
a ND ND 1.03±0.21
a 1.22±0.44
a
Serine 70.90±0.76c 79.41±1.18
a 74.07±0.41
b 73.70±0.37
b ND ND 0.15±0.04
b 2.49±0.59
a
Proline 37.36±1.22a 38.34±0.46
a 37.36±0.24
a 37.16±0.11
a ND ND 0.03±0.05
b 1.76±0.59
a
Isoleucine** 55.27±0.91a 47.92±2.75
b 53.80±0.85
a 54.24±0.22
a ND ND 0.80±0.21
b 2.06±0.74
a
Leucine** 91.26±0.56a 87.64±1.51
b 88.81±0.96
ab 89.15±0.36
ab ND ND 2.93±0.63
b 7.94±2.54
a
Methionine** 32.45±0.60a 27.58±3.48
ab 24.29±4.32
b 29.23±1.75
ab ND ND 0.45±0.07
b 3.05±1.12
a
Histidine** 29.05±0.44a 29.16±1.22
a 29.36±0.05
a 28.84±0.10
a 0.05±0.00
c ND 1.87±0.48
a 1.28±0.31
a
Phenylalanine** 62.69±0.94b 60.14±1.04
c 66.59±0.43
a 67.90±0.97
a ND ND 1.12±0.27
b 4.99±2.92
a
Glutamine 119.46±0.79a 117.70±9.29
a 118.99±2.35
a 119.37±2.15
a ND 0.17±0.25
b ND 5.94±1.27
a
Asparagine 112.57±0.42a 126.80±12.51
a 116.90±1.87
a 112.46±0.42
a ND ND ND 1.75±0.39
a
Cysteine 25.96±0.59a 23.65±1.46
ab 23.96±0.70
ab 22.49±1.10
b ND ND 0.05±0.01
b 0.49±0.16
a
Tyrosine** 42.24±0.68a 38.69±1.91
b 40.69±1.14
ab 41.31±0.26
ab ND 0.13±0.03
c 0.82±0.20
b 3.45±0.98
a
TEAA 499.94±5.23a 470.68±7.13
b 489.72±2.82
a 496.11±3.63
a 19.62±2.51
b 23.02±1.79
b 25.43±6.06
b 55.12±13.65
a
*Values are means ± SD of triplicate determination. **Essential amino acid. abcd
Means with same letter in each row are not
significantly different (p<0.05).TEAA = total essential amino acids, ND=not detected. See Table 2.5 for a brief explanation of DEW,
DALK, DNEU, and DACI.
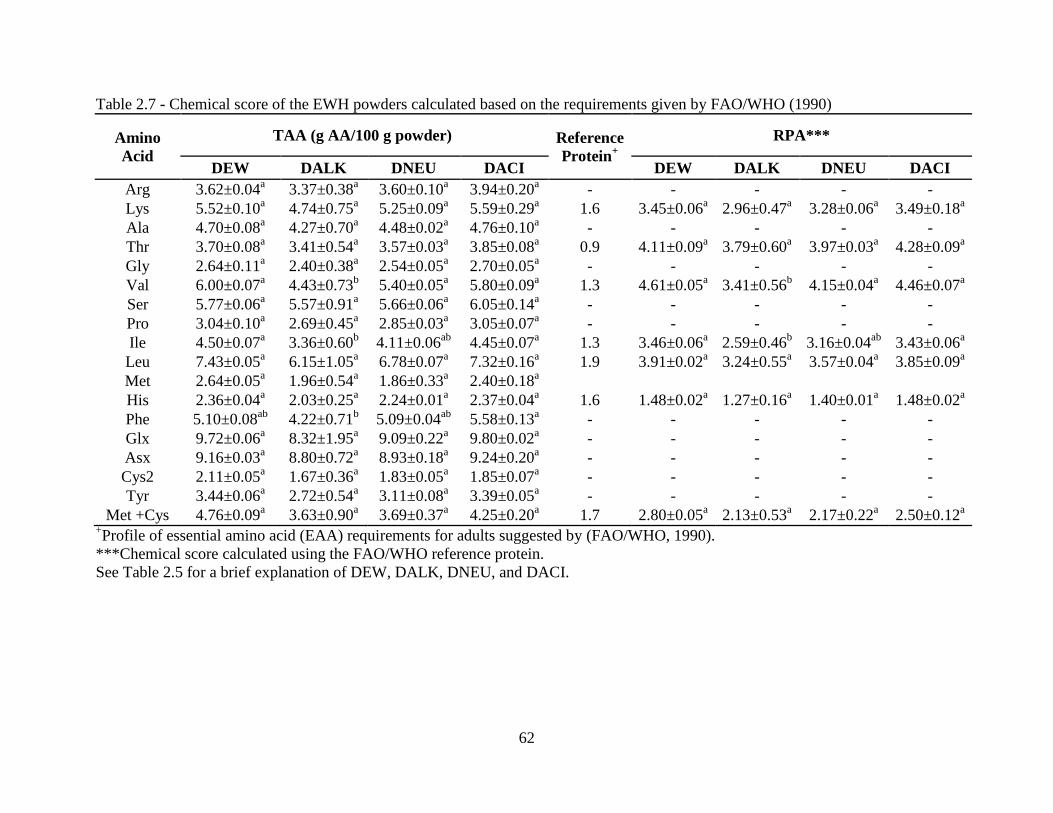
62
Table 2.7 - Chemical score of the EWH powders calculated based on the requirements given by FAO/WHO (1990)
Amino
Acid
TAA (g AA/100 g powder) Reference
Protein+
RPA***
DEW DALK DNEU DACI DEW DALK DNEU DACI
Arg 3.62±0.04a
3.37±0.38a
3.60±0.10a
3.94±0.20a
- - - - -
Lys 5.52±0.10a 4.74±0.75
a 5.25±0.09
a 5.59±0.29
a 1.6 3.45±0.06
a 2.96±0.47
a 3.28±0.06
a 3.49±0.18
a
Ala 4.70±0.08a 4.27±0.70
a 4.48±0.02
a 4.76±0.10
a - - - - -
Thr 3.70±0.08a 3.41±0.54
a 3.57±0.03
a 3.85±0.08
a 0.9 4.11±0.09
a 3.79±0.60
a 3.97±0.03
a 4.28±0.09
a
Gly 2.64±0.11a 2.40±0.38
a 2.54±0.05
a 2.70±0.05
a - - - - -
Val 6.00±0.07a 4.43±0.73
b 5.40±0.05
a 5.80±0.09
a 1.3 4.61±0.05
a 3.41±0.56
b 4.15±0.04
a 4.46±0.07
a
Ser 5.77±0.06a 5.57±0.91
a 5.66±0.06
a 6.05±0.14
a - - - - -
Pro 3.04±0.10a 2.69±0.45
a 2.85±0.03
a 3.05±0.07
a - - - - -
Ile 4.50±0.07a 3.36±0.60
b 4.11±0.06
ab 4.45±0.07
a 1.3 3.46±0.06
a 2.59±0.46
b 3.16±0.04
ab 3.43±0.06
a
Leu 7.43±0.05a 6.15±1.05
a 6.78±0.07
a 7.32±0.16
a 1.9 3.91±0.02
a 3.24±0.55
a 3.57±0.04
a 3.85±0.09
a
Met 2.64±0.05a 1.96±0.54
a 1.86±0.33
a 2.40±0.18
a
His 2.36±0.04a 2.03±0.25
a 2.24±0.01
a 2.37±0.04
a 1.6 1.48±0.02
a 1.27±0.16
a 1.40±0.01
a 1.48±0.02
a
Phe 5.10±0.08ab
4.22±0.71b 5.09±0.04
ab 5.58±0.13
a - - - - -
Glx 9.72±0.06a 8.32±1.95
a 9.09±0.22
a 9.80±0.02
a - - - - -
Asx 9.16±0.03a 8.80±0.72
a 8.93±0.18
a 9.24±0.20
a - - - - -
Cys2 2.11±0.05a 1.67±0.36
a 1.83±0.05
a 1.85±0.07
a - - - - -
Tyr 3.44±0.06a 2.72±0.54
a 3.11±0.08
a 3.39±0.05
a - - - - -
Met +Cys 4.76±0.09a 3.63±0.90
a 3.69±0.37
a 4.25±0.20
a 1.7 2.80±0.05
a 2.13±0.53
a 2.17±0.22
a 2.50±0.12
a
+Profile of essential amino acid (EAA) requirements for adults suggested by (FAO/WHO, 1990).
***Chemical score calculated using the FAO/WHO reference protein.
See Table 2.5 for a brief explanation of DEW, DALK, DNEU, and DACI.
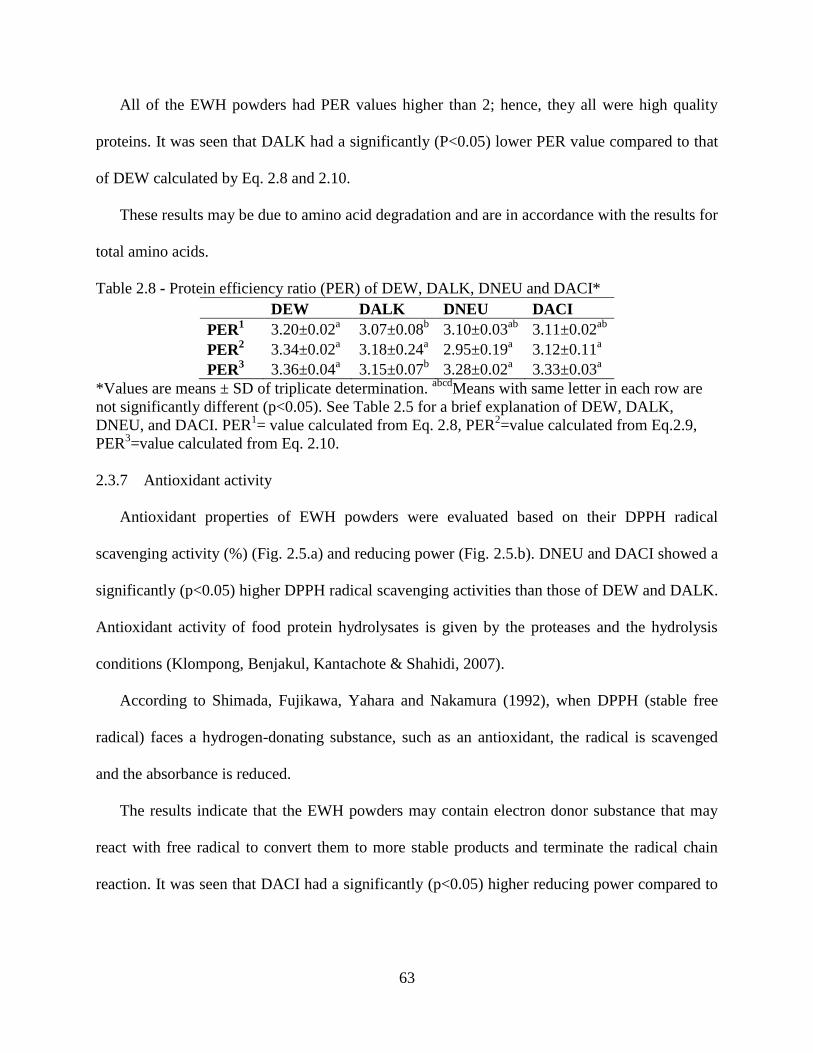
63
All of the EWH powders had PER values higher than 2; hence, they all were high quality
proteins. It was seen that DALK had a significantly (P<0.05) lower PER value compared to that
of DEW calculated by Eq. 2.8 and 2.10.
These results may be due to amino acid degradation and are in accordance with the results for
total amino acids.
Table 2.8 - Protein efficiency ratio (PER) of DEW, DALK, DNEU and DACI*
DEW DALK DNEU DACI
PER1 3.20±0.02
a 3.07±0.08
b 3.10±0.03
ab 3.11±0.02
ab
PER2 3.34±0.02
a 3.18±0.24
a 2.95±0.19
a 3.12±0.11
a
PER3 3.36±0.04
a 3.15±0.07
b 3.28±0.02
a 3.33±0.03
a
*Values are means ± SD of triplicate determination. abcd
Means with same letter in each row are
not significantly different (p<0.05). See Table 2.5 for a brief explanation of DEW, DALK,
DNEU, and DACI. PER1= value calculated from Eq. 2.8, PER
2=value calculated from Eq.2.9,
PER3=value calculated from Eq. 2.10.
2.3.7 Antioxidant activity
Antioxidant properties of EWH powders were evaluated based on their DPPH radical
scavenging activity (%) (Fig. 2.5.a) and reducing power (Fig. 2.5.b). DNEU and DACI showed a
significantly (p<0.05) higher DPPH radical scavenging activities than those of DEW and DALK.
Antioxidant activity of food protein hydrolysates is given by the proteases and the hydrolysis
conditions (Klompong, Benjakul, Kantachote & Shahidi, 2007).
According to Shimada, Fujikawa, Yahara and Nakamura (1992), when DPPH (stable free
radical) faces a hydrogen-donating substance, such as an antioxidant, the radical is scavenged
and the absorbance is reduced.
The results indicate that the EWH powders may contain electron donor substance that may
react with free radical to convert them to more stable products and terminate the radical chain
reaction. It was seen that DACI had a significantly (p<0.05) higher reducing power compared to
64
the rest of the powders. Egg white hydrolysates with antioxidant properties have been previously
reported (Lin, Guo, You, Yin & Liu, 2012; Pokora, et al., 2013).
According to Xia, Bamdad, Gänzle and Chen (2012), protein peptides containing the free
amino acids histidine, proline, and tyrosine show a strong antioxidant activity. The results
obtained in this study indicate that DACI contained greater amounts of the free amino acids
histidine, proline and tyrosine than the rest of the powders (Table 2.6). Hence, the presence of
these amino acids in a free form may have been a factor that enhanced the antioxidant activity of
the EWH powders.
2.3.8 Electrophoresis
DEW, DALK, DNEU, and DACI had discrete protein bands with molecular weight smaller
than 37,000 Da (Fig. 2.6). These patterns are consistent with soluble proteins. It was observed
that the ultrafiltration procedure using a membrane with a cut-off of 30000 Da was not efficient
in removing peptides of molecular weights higher than 30,000 Da.
According to Stevens (1991), the main proteins in egg white are ovalbumin (45 kDa),
ovotransferrin (76.6 kDa), ovomucoid (28 kDa), lyzosyme (14.3 kDa), ovoinhibitor (49 kDa),
ovoglobulin G2 (47 kDa), and ovoglobulin G3(50 kDa).
In this study, egg white proteins were hydrolyzed and the molecular weight profile of the
resulting peptides was given by the protease and hydrolysis procedure.
Also, DALK, DNEU and DACI had peptides with molecular weights below 10 kDa; these
results may be related with the DH of egg white hydrolysates.
Furthermore, two main peptides with molecular weights of ~35 kDa and ~24kDa were
identified in the all of the EWH powders; these peptides may have been a section of a bigger
protein that was not hydrolyzed by the food-grade proteases
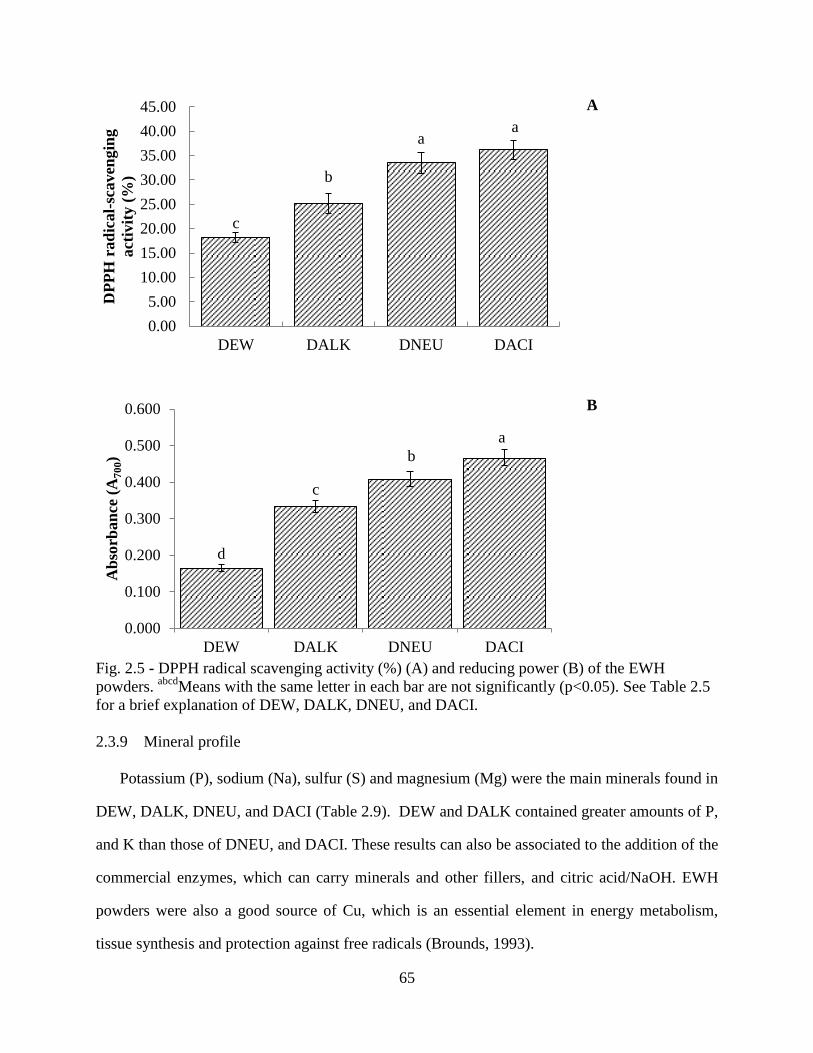
65
A
B
Fig. 2.5 - DPPH radical scavenging activity (%) (A) and reducing power (B) of the EWH
powders. abcd
Means with the same letter in each bar are not significantly (p<0.05). See Table 2.5
for a brief explanation of DEW, DALK, DNEU, and DACI.
2.3.9 Mineral profile
Potassium (P), sodium (Na), sulfur (S) and magnesium (Mg) were the main minerals found in
DEW, DALK, DNEU, and DACI (Table 2.9). DEW and DALK contained greater amounts of P,
and K than those of DNEU, and DACI. These results can also be associated to the addition of the
commercial enzymes, which can carry minerals and other fillers, and citric acid/NaOH. EWH
powders were also a good source of Cu, which is an essential element in energy metabolism,
tissue synthesis and protection against free radicals (Brounds, 1993).
c
b
a a
0.00
5.00
10.00
15.00
20.00
25.00
30.00
35.00
40.00
45.00
DEW DALK DNEU DACI
DP
PH
rad
ical-
scaven
gin
g
act
ivit
y (
%)
d
c
b
a
0.000
0.100
0.200
0.300
0.400
0.500
0.600
DEW DALK DNEU DACI
Ab
sorb
an
ce (
A7
00)
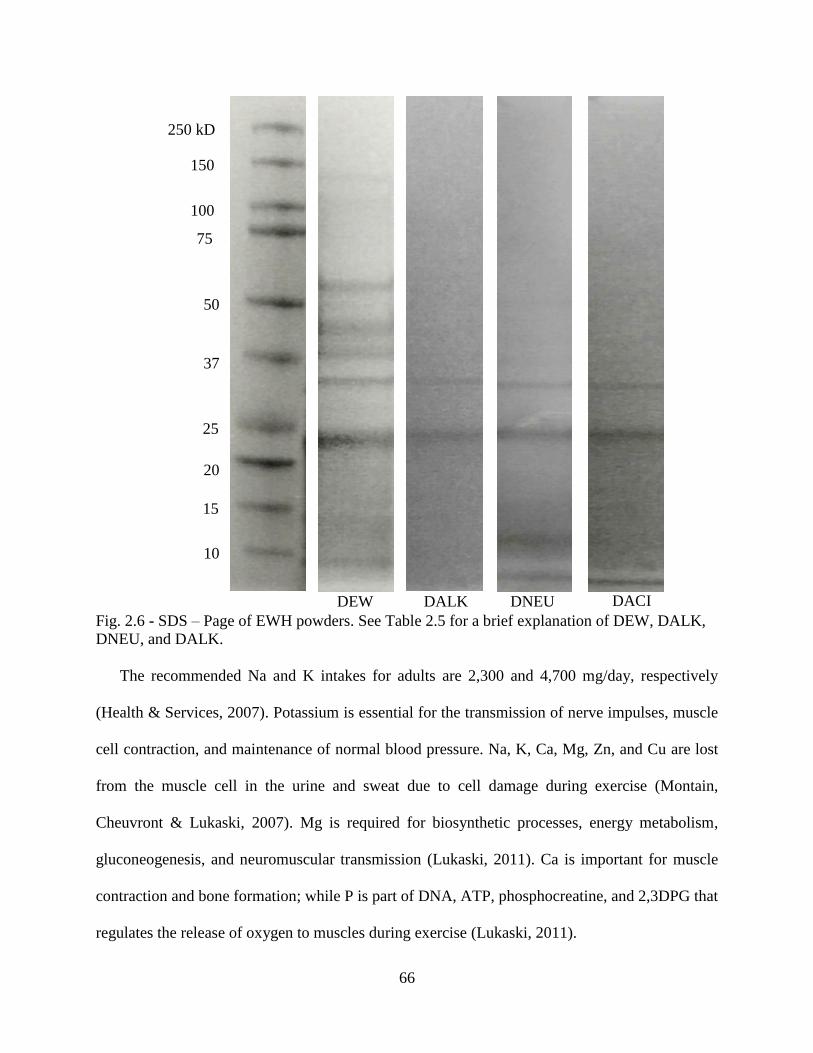
66
Fig. 2.6 - SDS – Page of EWH powders. See Table 2.5 for a brief explanation of DEW, DALK,
DNEU, and DALK.
The recommended Na and K intakes for adults are 2,300 and 4,700 mg/day, respectively
(Health & Services, 2007). Potassium is essential for the transmission of nerve impulses, muscle
cell contraction, and maintenance of normal blood pressure. Na, K, Ca, Mg, Zn, and Cu are lost
from the muscle cell in the urine and sweat due to cell damage during exercise (Montain,
Cheuvront & Lukaski, 2007). Mg is required for biosynthetic processes, energy metabolism,
gluconeogenesis, and neuromuscular transmission (Lukaski, 2011). Ca is important for muscle
contraction and bone formation; while P is part of DNA, ATP, phosphocreatine, and 2,3DPG that
regulates the release of oxygen to muscles during exercise (Lukaski, 2011).
10
15
20
37
50
75
100
150
250 kD
25
DEW DALK DNEU DACI
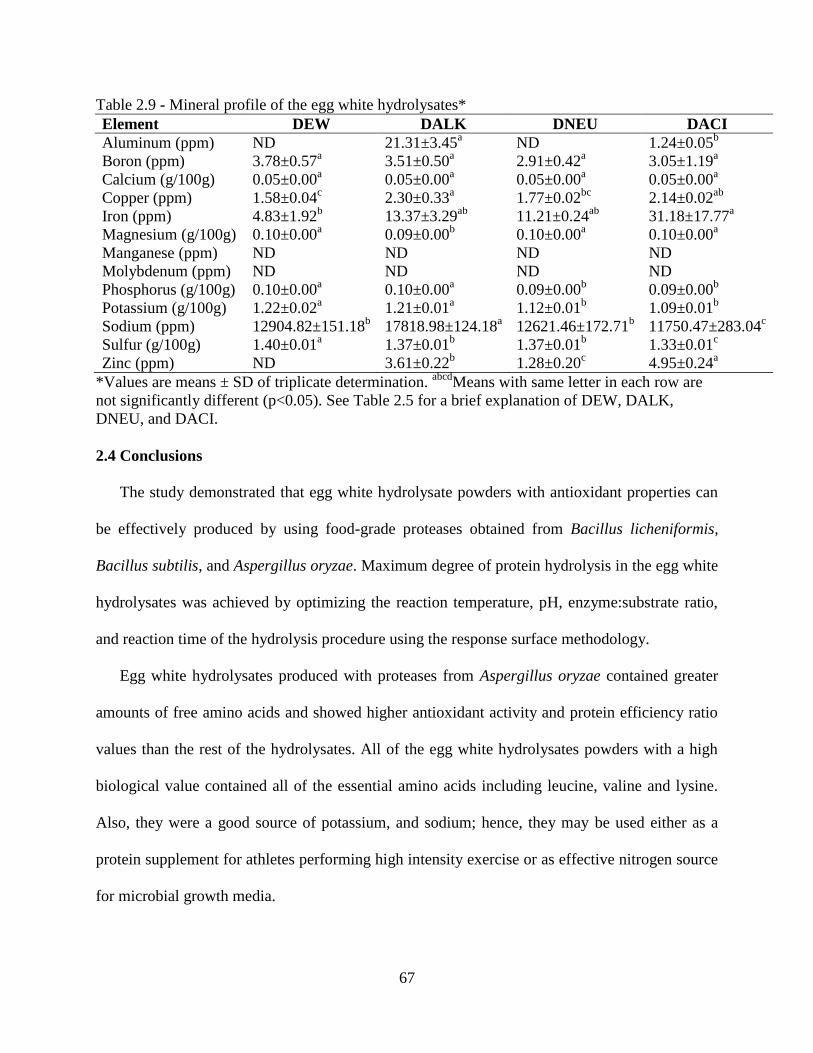
67
Table 2.9 - Mineral profile of the egg white hydrolysates*
Element DEW DALK DNEU DACI
Aluminum (ppm) ND 21.31±3.45a ND 1.24±0.05
b
Boron (ppm) 3.78±0.57a 3.51±0.50
a 2.91±0.42
a 3.05±1.19
a
Calcium (g/100g) 0.05±0.00a 0.05±0.00
a 0.05±0.00
a 0.05±0.00
a
Copper (ppm) 1.58±0.04c 2.30±0.33
a 1.77±0.02
bc 2.14±0.02
ab
Iron (ppm) 4.83±1.92b 13.37±3.29
ab 11.21±0.24
ab 31.18±17.77
a
Magnesium (g/100g) 0.10±0.00a 0.09±0.00
b 0.10±0.00
a 0.10±0.00
a
Manganese (ppm) ND ND ND ND
Molybdenum (ppm) ND ND ND ND
Phosphorus (g/100g) 0.10±0.00a 0.10±0.00
a 0.09±0.00
b 0.09±0.00
b
Potassium (g/100g) 1.22±0.02a 1.21±0.01
a 1.12±0.01
b 1.09±0.01
b
Sodium (ppm) 12904.82±151.18b 17818.98±124.18
a 12621.46±172.71
b 11750.47±283.04
c
Sulfur (g/100g) 1.40±0.01a 1.37±0.01
b 1.37±0.01
b 1.33±0.01
c
Zinc (ppm) ND 3.61±0.22b 1.28±0.20
c 4.95±0.24
a
*Values are means ± SD of triplicate determination. abcd
Means with same letter in each row are
not significantly different (p<0.05). See Table 2.5 for a brief explanation of DEW, DALK,
DNEU, and DACI.
2.4 Conclusions
The study demonstrated that egg white hydrolysate powders with antioxidant properties can
be effectively produced by using food-grade proteases obtained from Bacillus licheniformis,
Bacillus subtilis, and Aspergillus oryzae. Maximum degree of protein hydrolysis in the egg white
hydrolysates was achieved by optimizing the reaction temperature, pH, enzyme:substrate ratio,
and reaction time of the hydrolysis procedure using the response surface methodology.
Egg white hydrolysates produced with proteases from Aspergillus oryzae contained greater
amounts of free amino acids and showed higher antioxidant activity and protein efficiency ratio
values than the rest of the hydrolysates. All of the egg white hydrolysates powders with a high
biological value contained all of the essential amino acids including leucine, valine and lysine.
Also, they were a good source of potassium, and sodium; hence, they may be used either as a
protein supplement for athletes performing high intensity exercise or as effective nitrogen source
for microbial growth media.
68
2.5 References
AEB. (1999). Eggcyclopedia - The incredible edible egg. Park Ridge, IL: American Egg Board.
AOAC. (1999). Official method of analysis.Ass.of Official Analytical Chemists, Arlington, VA
AOAC. (2000). Official method of analysis.Ass.of Official Analytical Chemists, Arlington, VA
AOAC. (2006). Official method of analysis.Ass.of Official Analytical Chemists, Arlington, VA
Bhaskar, N., Benila, T., Radha, C., & Lalitha, R. G. (2008). Optimization of enzymatic
hydrolysis of visceral waste proteins of Catla (Catla catla) for preparing protein hydrolysate
using a commercial protease. Bioresource technology, 99(2), 335-343.
Davalos, A., Miguel, M., Bartolome, B., & Lopez-Fandino, R. (2004). Antioxidant activity of
peptides derived from egg white proteins by enzymatic hydrolysis. Journal of Food
Protection®, 67(9), 1939-1944.
Fang, H., Zhao, C., & Song, X.-Y. (2010). Optimization of enzymatic hydrolysis of steam-
exploded corn stover by two approaches: Response surface methodology or using cellulase
from mixed cultures of Trichoderma reesei RUT-C30 and Aspergillus niger NL02.
Bioresource technology, 101(11), 4111-4119.
FAO/WHO. (1990). Energy and Protein Requirements. Report of joint FAO/WHO/ONU Expert
Consultation Technical Report. FAO/WHO and United Nations University, Geneva, Series
No. 724. 166 -129.
Ferreira, S., Duarte, A. P., Ribeiro, M. H., Queiroz, J. A., & Domingues, F. C. (2009). Response
surface optimization of enzymatic hydrolysis of Cistus ladanifer and Cytisus striatus for
bioethanol production. Biochemical Engineering Journal, 45(3), 192-200.
Friedman, M. (1996). Nutritional value of proteins from different food sources. A review.
Journal of Agricultural and Food Chemistry, 44(1), 6-29.
Graszkiewicz, A., Zelazko, M., & Trziszka, T. (2010). Application of pancreatic enzymes in
hydrolysis of egg-white proteins. Polish Journal of Food and Nutrition Sciences, 60(1).
Guerard, F., Guimas, L., & Binet, A. (2002). Production of tuna waste hydrolysates by a
commercial neutral protease preparation. Journal of Molecular Catalysis B: Enzymatic, 19,
489-498.
Health, U. D. o., & Services, H. (2007). US Department of Agriculture (2005) Dietary
Guidelines for Americans, 2005. Washington, DC: US Government Printing Office.
69
Klompong, V, Benjakul, S, Kantachote, D, & Shahidi, F. (2007). Antioxidative activity and
functional properties of protein hydrolysate of yellow stripe trevally (Selaroides leptolepis)
as influenced by the degree of hydrolysis and enzyme type. Food Chemistry, 102(4),1317-27.
Lee, Y. B., Elliott, J. G., Rickansrud, D. A., & Hagberg, E. Y. C. (1978). Predicting protein
efficiency ratio by the chemical determination of connective tissue content in meat. Journal
of Food Science, 43(5), 1359-1362.
Lin, S., Guo, Y., You, Q., Yin, Y., & Liu, J. (2012). Preparation of antioxidant peptide from egg
white protein and improvement of its activities assisted by high‐intensity pulsed electric
field. Journal of the Science of Food and Agriculture, 92(7), 1554-1561.
Liu, B.-L., & Chiang, P.-S. (2008). Production of hydrolysate with antioxidative activity and
functional properties by enzymatic hydrolysis of defatted sesame (Sesamum indicum L.).
International Journal of Applied Science and Engineering, 6(2), 73-83.
Lukaski, H. C. (2011). Vitamins and Minerals. In Campell, B. I., & Spano, M. NSCA's Guide to
Sport and Exercise Nutrition: Human Kinetics.
Merheb, C. W., Cabral, H., Gomes, E., & Da-Silva, R. (2007). Partial characterization of
protease from a thermophilic fungus, Thermoascus aurantiacus, and its hydrolytic activity on
bovine casein. Food Chemistry, 104(1), 127-131.
Miguel, M., López-Fandiño, R., Ramos, M., & Aleixandre, A. (2005). Short-term effect of egg-
white hydrolysate products on the arterial blood pressure of hypertensive rats. British Journal
of Nutrition, 94(05), 731-737.
Miguel, M., Recio, I., Gómez-Ruiz, J., Ramos, M., & López-Fandiño, R. (2004). Angiotensin I-
converting enzyme inhibitory activity of peptides derived from egg white proteins by
enzymatic hydrolysis. Journal of Food Protection®, 67(9), 1914-1920.
Montain, S. J., Cheuvront, S. N., & Lukaski, H. C. (2007). Sweat mineral-element responses
during 7 h of exercise-heat stress. International Journal of Sport Nutrition and Exercise
Metabolism, 17(6), 574-582.
Nielsen, P. M., Petersen, D., & Dambmann, C. (2001). Improved Method for Determining Food
Protein Degree of Hydrolysis. Journal of Food Science, 66(5), 642-646.
O’Donnell, C., & Dornblaser, L. (2002). Amino acids/peptides. Prepared Foods, 117, 72-73.
Ovissipour, M., Kenari, A. A., Motamedzadegan, A., & Nazari, R. M. (2012). Optimization of
enzymatic hydrolysis of visceral waste proteins of yellowfin tuna (Thunnus albacares). Food
and Bioprocess Technology, 5(2), 696-705.
Panyam, D., & Kilara, A. (1996). Enhancing the functionality of food proteins by enzymatic
modification. Trends in Food Science & Technology, 7(4), 120-125.
70
Park, P.-J., Jung, W.-K., Nam, K.-S., Shahidi, F., & Kim, S.-K. (2001). Purification and
characterization of antioxidative peptides from protein hydrolysate of lecithin-free egg yolk.
Journal of the American Oil Chemists' Society, 78(6), 651-656.
Pokora, M., Eckert, E., Zambrowicz, A., Bobak, Ł., Szołtysik, M., Dąbrowska, A.,
Chrzanowska, J., Polanowski, A., & Trziszka, T. (2013). Biological and functional properties
of proteolytic enzyme‐modified egg protein by‐products. Food Science & Nutrition, 1(2),
184-195.
Safari, R., Motamedzadegan, A., Ovissipour, M., Regenstein, J. M., Gildberg, A., & Rasco, B.
(2012). Use of hydrolysates from yellowfin tuna (Thunnus albacares) heads as a complex
nitrogen source for lactic acid bacteria. Food and Bioprocess Technology, 5(1), 73-79.
Shimada, K., Fujikawa, K., Yahara, K., & Nakamura, T. (1992). Antioxidative properties of
xanthan on the autoxidation of soybean oil in cyclodextrin emulsion. Journal of Agricultural
and Food Chemistry, 40(6), 945-948.
Šližytė, R., Daukšas, E., Falch, E., Storrø, I., & Rustad, T. (2005). Characteristics of protein
fractions generated from hydrolysed cod (Gadus morhua) by-products. Process Biochemistry,
40(6), 2021-2033.
Stevens, L. (1991). Egg white proteins. Comparative Biochemistry and Physiology Part B:
Comparative Biochemistry, 100(1), 1-9.
Tarnopolsky, M. (2000). Protein and amino acid needs for training and bulking up. Burke, L.
Deakin, V.(eds) Clinical Sports Nutrition, 90-123.
Ummadi, M. S., & Curic-Bawden, M. (2010). Use of protein hydrolysates in industrial starter
culture fermentations. Protein Hydrolysates in Biotechnology pp. 91-114): Springer.
Van der Plancken, I., Van Remoortere, M., Indrawati, Van Loey, A., & Hendrickx, M. E. (2003).
Heat-induced changes in the susceptibility of egg white proteins to enzymatic hydrolysis: a
kinetic study. Journal of Agricultural and Food Chemistry, 51(13), 3819-3823.
Weggemans, R. M., Zock, P. L., & Katan, M. B. (2001). Dietary cholesterol from eggs increases
the ratio of total cholesterol to high-density lipoprotein cholesterol in humans: a meta-
analysis. The American journal of clinical nutrition, 73(5), 885-891.
Xia, Y., Bamdad, F., Gänzle, M., & Chen, L. (2012). Fractionation and characterization of
antioxidant peptides derived from barley glutelin by enzymatic hydrolysis. Food Chemistry,
134(3), 1509-1518.
Zheng, H., Shen, X., Bu, G., & Luo, Y. (2008). Effects of pH, temperature and enzyme-to-
substrate ratio on the antigenicity of whey protein hydrolysates prepared by Alcalase.
International Dairy Journal, 18(10), 1028-1033.
71
CHAPTER 3 - GROWTH KINETICS AND LACTIC ACID PRODUCTION OF
Lactobacillus plantarum NRRL B-4496, L. acidophilus NRRL B-4495, and L. reuteri B-
14171 IN MEDIA CONTAINING EGG WHITE HYDROLYSATES
3.1 Introduction
Lactic acid bacteria (LAB) are used as starter cultures for producing many fermented foods
including yogurt, cheese, fermented sausages, fish, fermented beverages, sauerkraut, etc.
According to Fioramonti, Theodorou and Bueno (2003), probiotic LAB show beneficial
interactions with the human gastrointestinal tract and its microflora and provide health benefits
to the host when they are consumed in adequate amounts (Safari, Motamedzadegan, Ovissipour,
Regenstein, Gildberg & Rasco, 2012). Some of the health benefits attributed to the consumption
of probiotic LAB include improving the health of the intestinal tract and immune system,
increasing the bioavailability of nutrients, and decreasing the risk of certain cancer (Kopp-
Hoolihan, 2001). Among the LAB are the genus Lactobacillus, which are one of the most
economically important bacteria groups for the food industry (Ummadi & Curic-Bawden, 2010).
Lactobacillus spp. require a growth media that must contains a carbon source, amino acids,
peptides, fatty acids, vitamins, and nucleic acids. This media is available as a standard laboratory
medium known as Man Rogosa Sharpe (MRS) (Meli, Lazzi, Neviani & Gatti, 2014). MRS is
used to promote the growth of Lactobacillus spp. for laboratory studies; and contains beef, yeast
extracts and peptone as its main nitrogen sources. According to Ummadi and Curic-Bawden
(2010), every species of Lactobacillus spp. has its distinctive growth requirements for essential
energy, carbon and nitrogen sources. The selection of the right raw ingredients and the
formulation of the optimum fermentation media is the most important step in the production of
concentrated LAB starter cultures. Different nutritional requirements are observed for several
species of LAB including those of the genus Lactobacillus spp.; moreover, the type of carbon
72
and nitrogen source in the fermentation media has a tremendous effect on the growth of the
Lactobacillus spp. (Ummadi & Curic-Bawden, 2010). Some LAB have a limited capacity to
synthesize amino acids; therefore, they depend on exogenous sources of amino acids and
peptides (Foucaud, Hemme & Desmazeaud, 2001).
Due to the high prices of ingredients that are used as nitrogen sources in MRS, the
commercial application of MRS is limited (Martone, Borla & Sánchez, 2005); even more, the
presence of ingredients from bovine or porcine origin restricts its application in halal and kosher
products (Safari, Motamedzadegan, Ovissipour, Regenstein, Gildberg & Rasco, 2012). It is
suggested that the use of MRS may be avoided due to risks related to the occurrence of bovine
spongiform encephalopathy (Aspmo, Horn & Eijsink, 2005). According to Castro and Sato
(2014), the production of protein hydrolysates containing bioactive peptides from animal and
plant sources using enzymatic hydrolysis has attracted attention in recent years due to their
positive effects on the growth stimulation of probiotic bacteria. The growth stimulation of LAB
provided by protein hydrolysates may be due to their ability to provide free amino acids, low
molecular weight peptides, and growth factors (Ummadi & Curic-Bawden, 2010). Hence, the use
of protein hydrolysates may be an alternative for the growth of probiotic LAB compared to the
use of whole proteins; this may result in a higher growth rate and biomass yield of LAB (Juillard,
Guillot, Le Bars & Gripon, 1998).
Ummadi and Curic-Bawden (2010) have reported that the amino acid composition, the form
of the amino acids (only L-stereoisomers or L-amino acids can be incorporated into the cell
biomass), and the form of the peptide (oligopeptide, di- and tri-peptides, or as free amino acids)
determine the biological value of a particular protein hydrolysate as a nitrogen source in a
fermentation media for LAB growth. The effect of using protein hydrolysates on the growth of
73
certain strains of Lactobacillus spp. has been previously reported (Juillard, Guillot, Le Bars &
Gripon, 1998; Ravula & Shah, 1998; Ummadi & Curic-Bawden, 2010). Nevertheless, most of
these studies on growth kinetics of LAB have conducted using protein hydrolysates from dairy
proteins. According to Kassis, Drake, Beamer, Matak and Jaczynski (2010), eggs are one of the
best and low cost sources of high quality protein because they contain high amounts of proline,
arginine, and glutamine which are essential amino acids for the growth of Lactobacillus
spp.(Ummadi & Curic-Bawden, 2010). The effect of fermentation media containing food-grade
egg white hydrolysates on the growth and lactic acid production of L. plantarum B-4496, L.
acidophilus B-4495, and L. reuteri B-14171 has not been reported in the scientific literature.
Hence, the aim of this study was to evaluate the performance of fermentation media containing
food-grade egg white hydrolysates and/or dried egg white with MRS on the growth of LAB.
3.2 Materials and Methods
3.2.1 Materials
Fresh, large, grade AA hen eggs were purchased from a local chain grocery store, in Baton
Rouge, Louisiana. The eggs were stored at 4°C, and the storage time did not exceed three days.
A food-grade protease from Aspergillus oryzae was obtained from Enzyme Development
Corporation (New York, NY). The MRS media was obtained from Neogen Corporation
(Lansing, MI). All other chemicals were analytical grade and were obtained from Sigma Aldrich
(St. Louis, MO).
3.2.2 Preparation of food-grade egg white hydrolysates (EWH)
Fresh egg whites (EW) were manually separated from egg yolks. Then, the moisture content
of the EW was determined according to the official AOAC method 930.15 (AOAC, 1999). A
mixture containing 80 g EW and 20 g distilled water was prepared and homogenized using an
74
ultra-shearing processor (OMNI, Ultrashear M, Omni International, Kennesaw, GA) for 5 min at
20,000 rpm, and then heated to 65°C in a water bath for 5 min to denature some of the proteins.
After heating, the mixture was cooled down to room temperature. Then, the pH of the mixture
was adjusted to 4.60 using a 1 M citric acid solution. The enzymatic hydrolysis was carried using
a food-grade protease obtained from Aspergillus oryzae. The enzyme-to-substrate ratio [E:S] was
standardized to 550 (U enzyme/g protein) and the fermentation vessel was place in an incubator
shaker at 38 °C for 110 min. After the reaction time, the fermentation vessel containing the
mixtures was heated to 85°C for 5 min to inactivate the enzymes. The degree of protein
hydrolysis (DH) was determined by following the method descried in Chapter 2. Then, the
resulting mixture containing the hydrolysates were homogenized using an ultra-shearing
processor and spray dried using a Pilot-Scale spray dryer (FT80 Tall Form Spray Dryer Armfield
Inc., Ringwood, UK) under co-current drying conditions at 140°C inlet air temperature.
3.2.3 Microorganisms
Lyophilized culture of L. plantarum NRRL B-4496, L. acidophilus B-4495 and L. reuteri B-
14171 were provided by ARS Culture Collection (Washington, DC, US). The strains were
maintained as cultures stocks in 20% glycerol (w/v) at -30°C. One mL of the culture stock was
activated in 9 mL of MRS fermentation media and incubated at 37°C for 24 h. Afterwards, 15
mL of MRS fermentation media was added to the fermentation vessel and was kept at 37°C for
another 8 h. and the resulting twenty five mL of every strain was subsequently inoculated into
500 mL of a fermentation media.
3.2.4 Media composition
The composition of each of the fermentation media is summarized in Table 3.1. In total, four
fermentation media were evaluated including the standard MRS media, the MRS with no
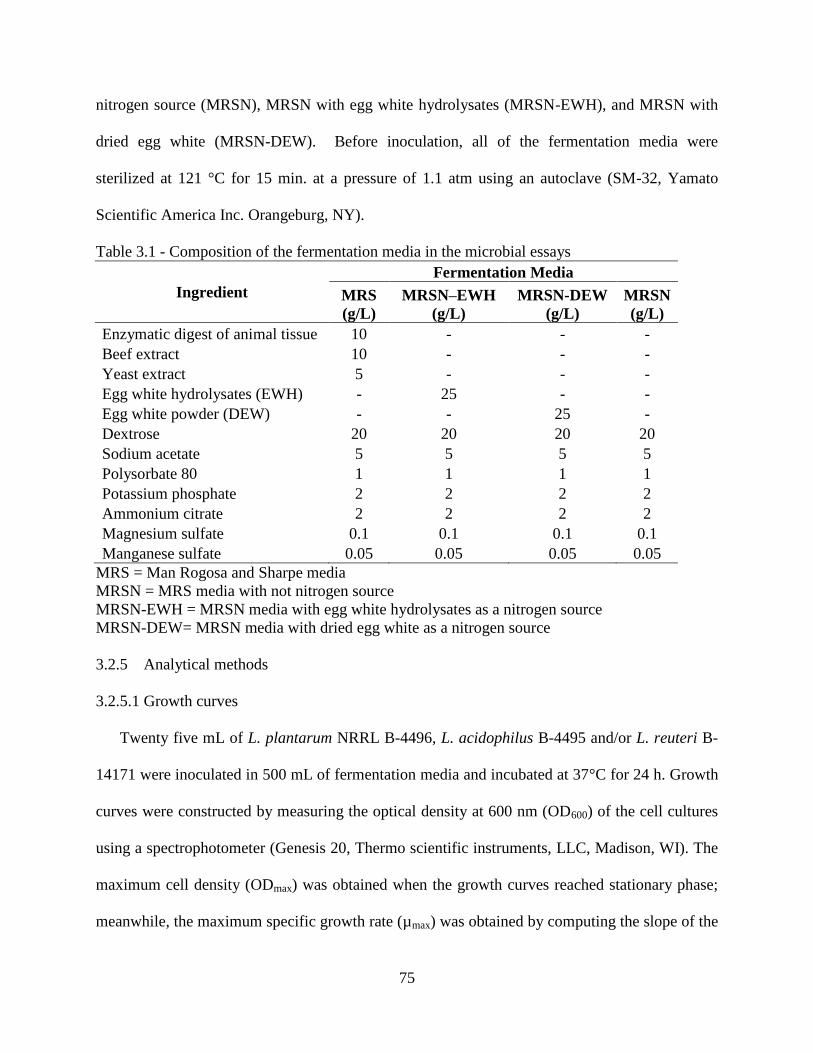
75
nitrogen source (MRSN), MRSN with egg white hydrolysates (MRSN-EWH), and MRSN with
dried egg white (MRSN-DEW). Before inoculation, all of the fermentation media were
sterilized at 121 °C for 15 min. at a pressure of 1.1 atm using an autoclave (SM-32, Yamato
Scientific America Inc. Orangeburg, NY).
Table 3.1 - Composition of the fermentation media in the microbial essays
Ingredient
Fermentation Media
MRS
(g/L)
MRSN–EWH
(g/L)
MRSN-DEW
(g/L)
MRSN
(g/L)
Enzymatic digest of animal tissue 10 - - -
Beef extract 10 - - -
Yeast extract 5 - - -
Egg white hydrolysates (EWH) - 25 - -
Egg white powder (DEW) - - 25 -
Dextrose 20 20 20 20
Sodium acetate 5 5 5 5
Polysorbate 80 1 1 1 1
Potassium phosphate 2 2 2 2
Ammonium citrate 2 2 2 2
Magnesium sulfate 0.1 0.1 0.1 0.1
Manganese sulfate 0.05 0.05 0.05 0.05
MRS = Man Rogosa and Sharpe media
MRSN = MRS media with not nitrogen source
MRSN-EWH = MRSN media with egg white hydrolysates as a nitrogen source
MRSN-DEW= MRSN media with dried egg white as a nitrogen source
3.2.5 Analytical methods
3.2.5.1 Growth curves
Twenty five mL of L. plantarum NRRL B-4496, L. acidophilus B-4495 and/or L. reuteri B-
14171 were inoculated in 500 mL of fermentation media and incubated at 37°C for 24 h. Growth
curves were constructed by measuring the optical density at 600 nm (OD600) of the cell cultures
using a spectrophotometer (Genesis 20, Thermo scientific instruments, LLC, Madison, WI). The
maximum cell density (ODmax) was obtained when the growth curves reached stationary phase;
meanwhile, the maximum specific growth rate (µmax) was obtained by computing the slope of the
76
exponential growth phase (µmax = Δln(OD600)/ Δt) as described by Horn, Aspmo and Eijsink
(2005). The doubling time (Td) was calculated by using Eq. 3.1
max
dμ
2Ln T Eq. (3.1)
3.2.5.2 pH and titratable acidity
The pH of the samples was measured using a Thermo Scientific Orion 4 Star Benchtop pH
meter (Thermo Fisher Scientific Inc.). Titratable acidity (TA) was determined by following the
method described in Xie, Ye, Liu and Ying (2011) with some modifications. A 10 mL aliquot of
fermented broth was mixed with 10 mL of distilled water in a 50 mL beaker. Then, the mixture
was neutralized using a 0.1 N sodium hydroxide (NaOH) solution. The end point was set at pH
8.2. The TA was calculated using Eq. 3.2.
sample) of (10)(mL
acid) lactic of t Wt.(Equivalen sol.) NaOH of (Normality NaOH) (mLmL) (g/100TA (Eq. 3.2)
Where, the equivalent wt. of lactic acid is 90.08.
The results are expressed in terms of (g/mL) of lactic acid.
3.2.6 Statistical methods
All of the resulting data was statistically analyzed by SAS statistical software version 9.2
(SAS Institute Inc., 2008). Means and standard deviations from triplicate analysis were reported.
Analysis of Variance (ANOVA) and Tukey’s studentized range test were carried out to
determine differences among treatments at the significant level of P<0.05.
3.3 Results and discussion
3.3.1 Growth curves
Three strains of the Lactobacillus spp. were grown on four different media: MRS, MRSN-
EWH, MRSN-DEW, and MRSN. Their growth was monitored during 24 h. It was observed that
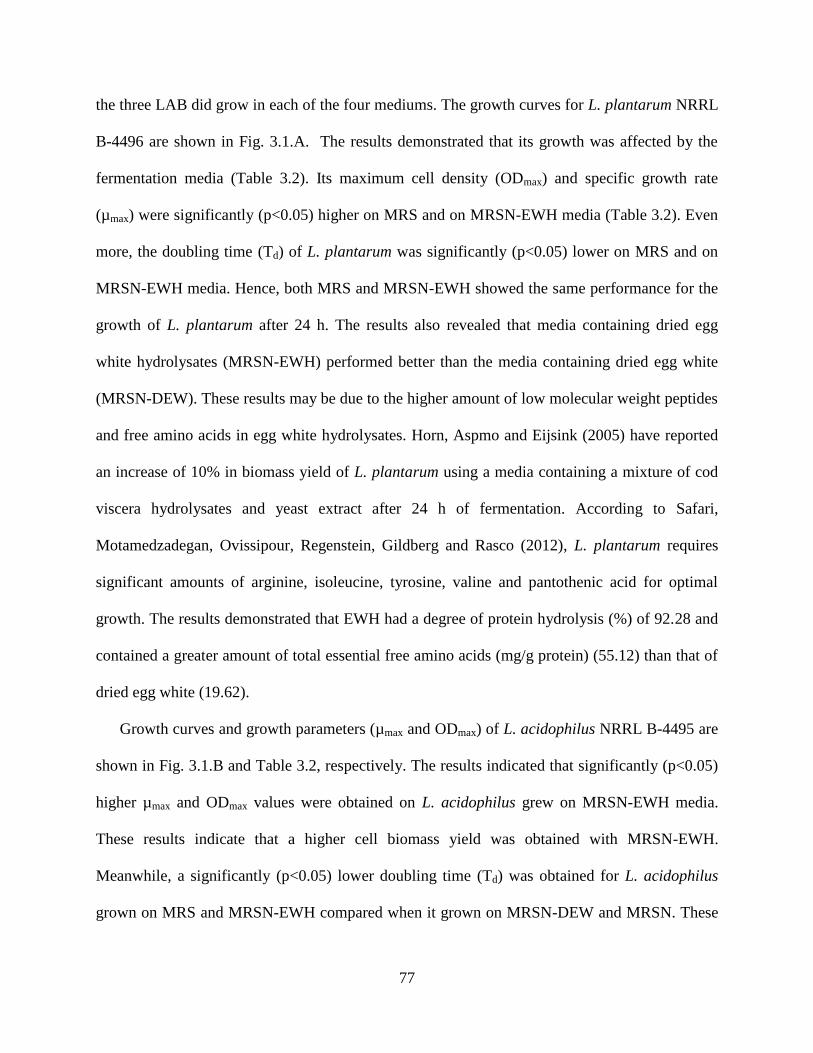
77
the three LAB did grow in each of the four mediums. The growth curves for L. plantarum NRRL
B-4496 are shown in Fig. 3.1.A. The results demonstrated that its growth was affected by the
fermentation media (Table 3.2). Its maximum cell density (ODmax) and specific growth rate
(µmax) were significantly (p<0.05) higher on MRS and on MRSN-EWH media (Table 3.2). Even
more, the doubling time (Td) of L. plantarum was significantly (p<0.05) lower on MRS and on
MRSN-EWH media. Hence, both MRS and MRSN-EWH showed the same performance for the
growth of L. plantarum after 24 h. The results also revealed that media containing dried egg
white hydrolysates (MRSN-EWH) performed better than the media containing dried egg white
(MRSN-DEW). These results may be due to the higher amount of low molecular weight peptides
and free amino acids in egg white hydrolysates. Horn, Aspmo and Eijsink (2005) have reported
an increase of 10% in biomass yield of L. plantarum using a media containing a mixture of cod
viscera hydrolysates and yeast extract after 24 h of fermentation. According to Safari,
Motamedzadegan, Ovissipour, Regenstein, Gildberg and Rasco (2012), L. plantarum requires
significant amounts of arginine, isoleucine, tyrosine, valine and pantothenic acid for optimal
growth. The results demonstrated that EWH had a degree of protein hydrolysis (%) of 92.28 and
contained a greater amount of total essential free amino acids (mg/g protein) (55.12) than that of
dried egg white (19.62).
Growth curves and growth parameters (µmax and ODmax) of L. acidophilus NRRL B-4495 are
shown in Fig. 3.1.B and Table 3.2, respectively. The results indicated that significantly (p<0.05)
higher µmax and ODmax values were obtained on L. acidophilus grew on MRSN-EWH media.
These results indicate that a higher cell biomass yield was obtained with MRSN-EWH.
Meanwhile, a significantly (p<0.05) lower doubling time (Td) was obtained for L. acidophilus
grown on MRS and MRSN-EWH compared when it grown on MRSN-DEW and MRSN. These
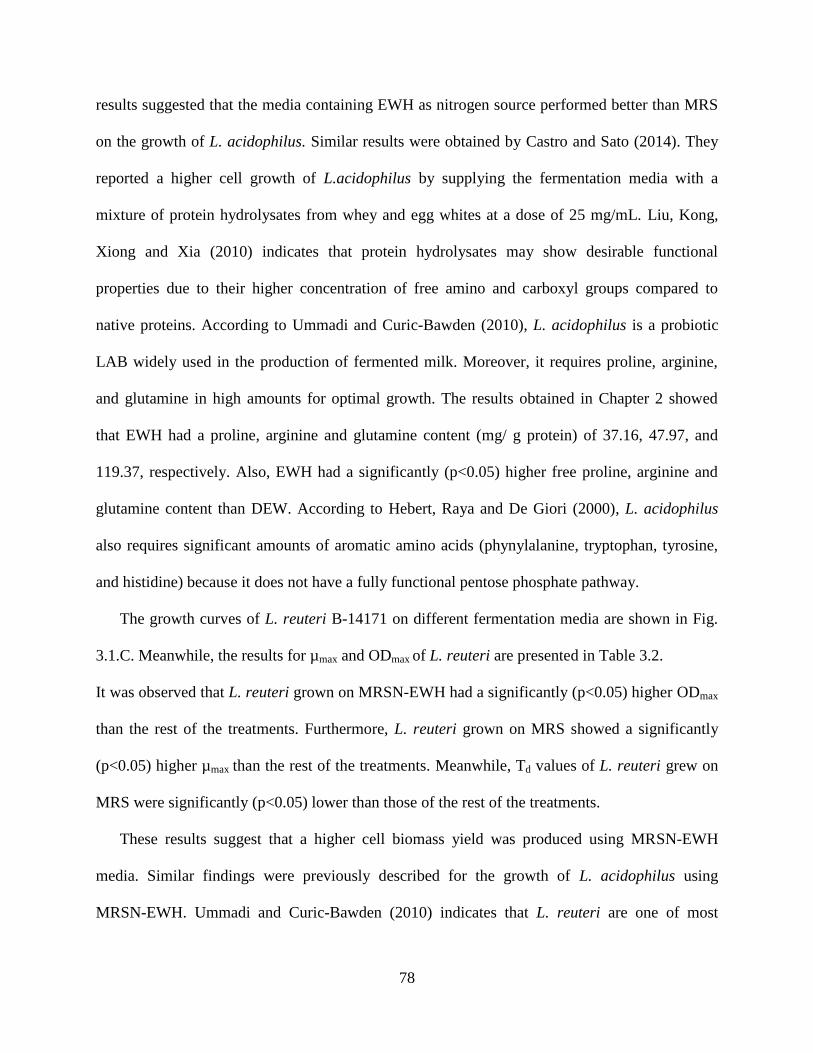
78
results suggested that the media containing EWH as nitrogen source performed better than MRS
on the growth of L. acidophilus. Similar results were obtained by Castro and Sato (2014). They
reported a higher cell growth of L.acidophilus by supplying the fermentation media with a
mixture of protein hydrolysates from whey and egg whites at a dose of 25 mg/mL. Liu, Kong,
Xiong and Xia (2010) indicates that protein hydrolysates may show desirable functional
properties due to their higher concentration of free amino and carboxyl groups compared to
native proteins. According to Ummadi and Curic-Bawden (2010), L. acidophilus is a probiotic
LAB widely used in the production of fermented milk. Moreover, it requires proline, arginine,
and glutamine in high amounts for optimal growth. The results obtained in Chapter 2 showed
that EWH had a proline, arginine and glutamine content (mg/ g protein) of 37.16, 47.97, and
119.37, respectively. Also, EWH had a significantly (p<0.05) higher free proline, arginine and
glutamine content than DEW. According to Hebert, Raya and De Giori (2000), L. acidophilus
also requires significant amounts of aromatic amino acids (phynylalanine, tryptophan, tyrosine,
and histidine) because it does not have a fully functional pentose phosphate pathway.
The growth curves of L. reuteri B-14171 on different fermentation media are shown in Fig.
3.1.C. Meanwhile, the results for µmax and ODmax of L. reuteri are presented in Table 3.2.
It was observed that L. reuteri grown on MRSN-EWH had a significantly (p<0.05) higher ODmax
than the rest of the treatments. Furthermore, L. reuteri grown on MRS showed a significantly
(p<0.05) higher µmax than the rest of the treatments. Meanwhile, Td values of L. reuteri grew on
MRS were significantly (p<0.05) lower than those of the rest of the treatments.
These results suggest that a higher cell biomass yield was produced using MRSN-EWH
media. Similar findings were previously described for the growth of L. acidophilus using
MRSN-EWH. Ummadi and Curic-Bawden (2010) indicates that L. reuteri are one of most
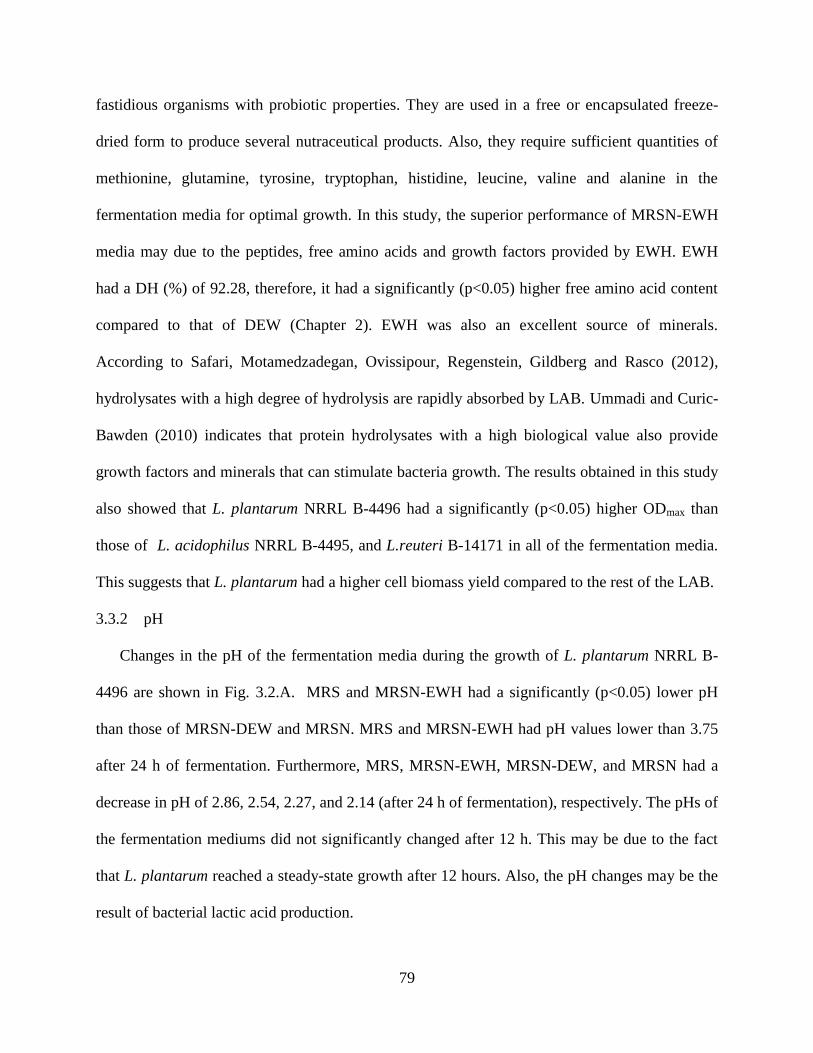
79
fastidious organisms with probiotic properties. They are used in a free or encapsulated freeze-
dried form to produce several nutraceutical products. Also, they require sufficient quantities of
methionine, glutamine, tyrosine, tryptophan, histidine, leucine, valine and alanine in the
fermentation media for optimal growth. In this study, the superior performance of MRSN-EWH
media may due to the peptides, free amino acids and growth factors provided by EWH. EWH
had a DH (%) of 92.28, therefore, it had a significantly (p<0.05) higher free amino acid content
compared to that of DEW (Chapter 2). EWH was also an excellent source of minerals.
According to Safari, Motamedzadegan, Ovissipour, Regenstein, Gildberg and Rasco (2012),
hydrolysates with a high degree of hydrolysis are rapidly absorbed by LAB. Ummadi and Curic-
Bawden (2010) indicates that protein hydrolysates with a high biological value also provide
growth factors and minerals that can stimulate bacteria growth. The results obtained in this study
also showed that L. plantarum NRRL B-4496 had a significantly (p<0.05) higher ODmax than
those of L. acidophilus NRRL B-4495, and L.reuteri B-14171 in all of the fermentation media.
This suggests that L. plantarum had a higher cell biomass yield compared to the rest of the LAB.
3.3.2 pH
Changes in the pH of the fermentation media during the growth of L. plantarum NRRL B-
4496 are shown in Fig. 3.2.A. MRS and MRSN-EWH had a significantly (p<0.05) lower pH
than those of MRSN-DEW and MRSN. MRS and MRSN-EWH had pH values lower than 3.75
after 24 h of fermentation. Furthermore, MRS, MRSN-EWH, MRSN-DEW, and MRSN had a
decrease in pH of 2.86, 2.54, 2.27, and 2.14 (after 24 h of fermentation), respectively. The pHs of
the fermentation mediums did not significantly changed after 12 h. This may be due to the fact
that L. plantarum reached a steady-state growth after 12 hours. Also, the pH changes may be the
result of bacterial lactic acid production.
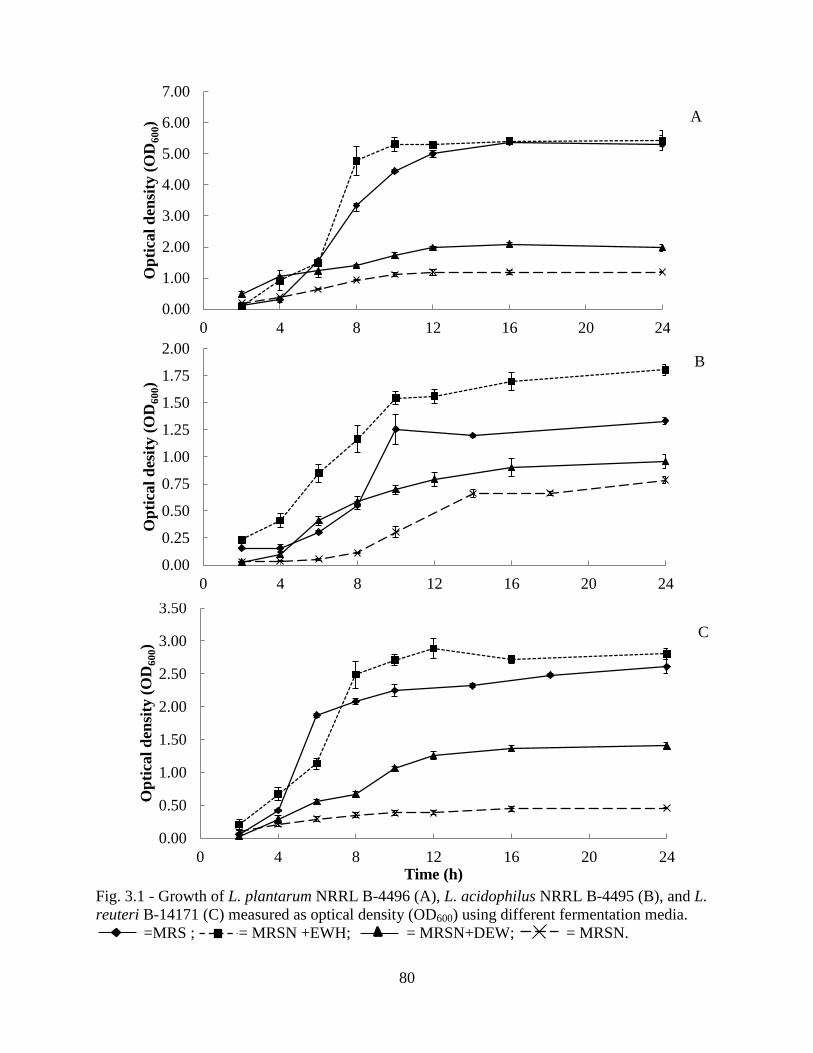
80
Fig. 3.1 - Growth of L. plantarum NRRL B-4496 (A), L. acidophilus NRRL B-4495 (B), and L.
reuteri B-14171 (C) measured as optical density (OD600) using different fermentation media.
=MRS ; = MRSN +EWH; = MRSN+DEW; = MRSN.
0.00
1.00
2.00
3.00
4.00
5.00
6.00
7.00
0 4 8 12 16 20 24
Op
tica
l d
ensi
ty (
OD
60
0)
0.00
0.50
1.00
1.50
2.00
2.50
3.00
3.50
0 4 8 12 16 20 24
Op
tica
l d
ensi
ty (
OD
60
0)
Time (h)
0.00
0.25
0.50
0.75
1.00
1.25
1.50
1.75
2.00
0 4 8 12 16 20 24
Op
tica
l d
esit
y (
OD
60
0)
A
B
C
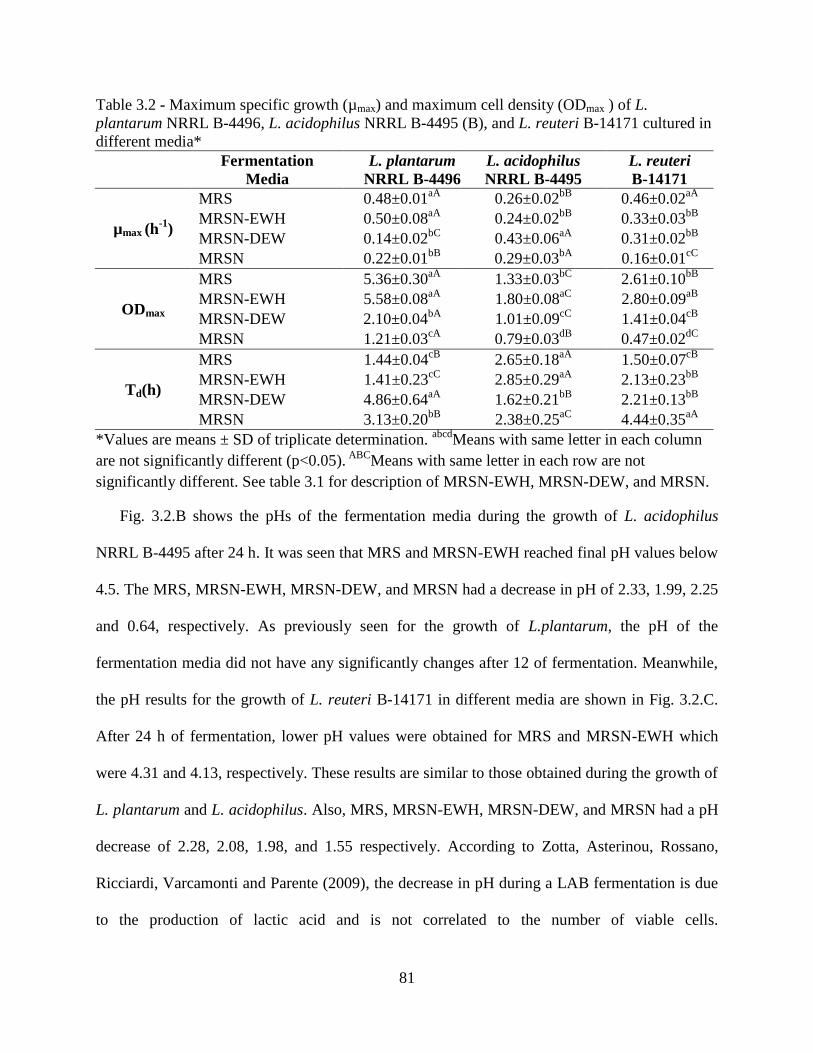
81
Table 3.2 - Maximum specific growth (µmax) and maximum cell density (ODmax ) of L.
plantarum NRRL B-4496, L. acidophilus NRRL B-4495 (B), and L. reuteri B-14171 cultured in
different media*
Fermentation
Media
L. plantarum
NRRL B-4496
L. acidophilus
NRRL B-4495
L. reuteri
B-14171
µmax (h-1
)
MRS 0.48±0.01aA
0.26±0.02bB
0.46±0.02aA
MRSN-EWH 0.50±0.08aA
0.24±0.02bB
0.33±0.03bB
MRSN-DEW 0.14±0.02bC
0.43±0.06aA
0.31±0.02bB
MRSN 0.22±0.01bB
0.29±0.03bA
0.16±0.01cC
ODmax
MRS 5.36±0.30aA
1.33±0.03bC
2.61±0.10bB
MRSN-EWH 5.58±0.08aA
1.80±0.08aC
2.80±0.09aB
MRSN-DEW 2.10±0.04bA
1.01±0.09cC
1.41±0.04cB
MRSN 1.21±0.03cA
0.79±0.03dB
0.47±0.02dC
Td(h)
MRS 1.44±0.04cB
2.65±0.18aA
1.50±0.07cB
MRSN-EWH 1.41±0.23cC
2.85±0.29aA
2.13±0.23bB
MRSN-DEW 4.86±0.64aA
1.62±0.21bB
2.21±0.13bB
MRSN 3.13±0.20bB
2.38±0.25aC
4.44±0.35aA
*Values are means ± SD of triplicate determination. abcd
Means with same letter in each column
are not significantly different (p<0.05). ABC
Means with same letter in each row are not
significantly different. See table 3.1 for description of MRSN-EWH, MRSN-DEW, and MRSN.
Fig. 3.2.B shows the pHs of the fermentation media during the growth of L. acidophilus
NRRL B-4495 after 24 h. It was seen that MRS and MRSN-EWH reached final pH values below
4.5. The MRS, MRSN-EWH, MRSN-DEW, and MRSN had a decrease in pH of 2.33, 1.99, 2.25
and 0.64, respectively. As previously seen for the growth of L.plantarum, the pH of the
fermentation media did not have any significantly changes after 12 of fermentation. Meanwhile,
the pH results for the growth of L. reuteri B-14171 in different media are shown in Fig. 3.2.C.
After 24 h of fermentation, lower pH values were obtained for MRS and MRSN-EWH which
were 4.31 and 4.13, respectively. These results are similar to those obtained during the growth of
L. plantarum and L. acidophilus. Also, MRS, MRSN-EWH, MRSN-DEW, and MRSN had a pH
decrease of 2.28, 2.08, 1.98, and 1.55 respectively. According to Zotta, Asterinou, Rossano,
Ricciardi, Varcamonti and Parente (2009), the decrease in pH during a LAB fermentation is due
to the production of lactic acid and is not correlated to the number of viable cells.
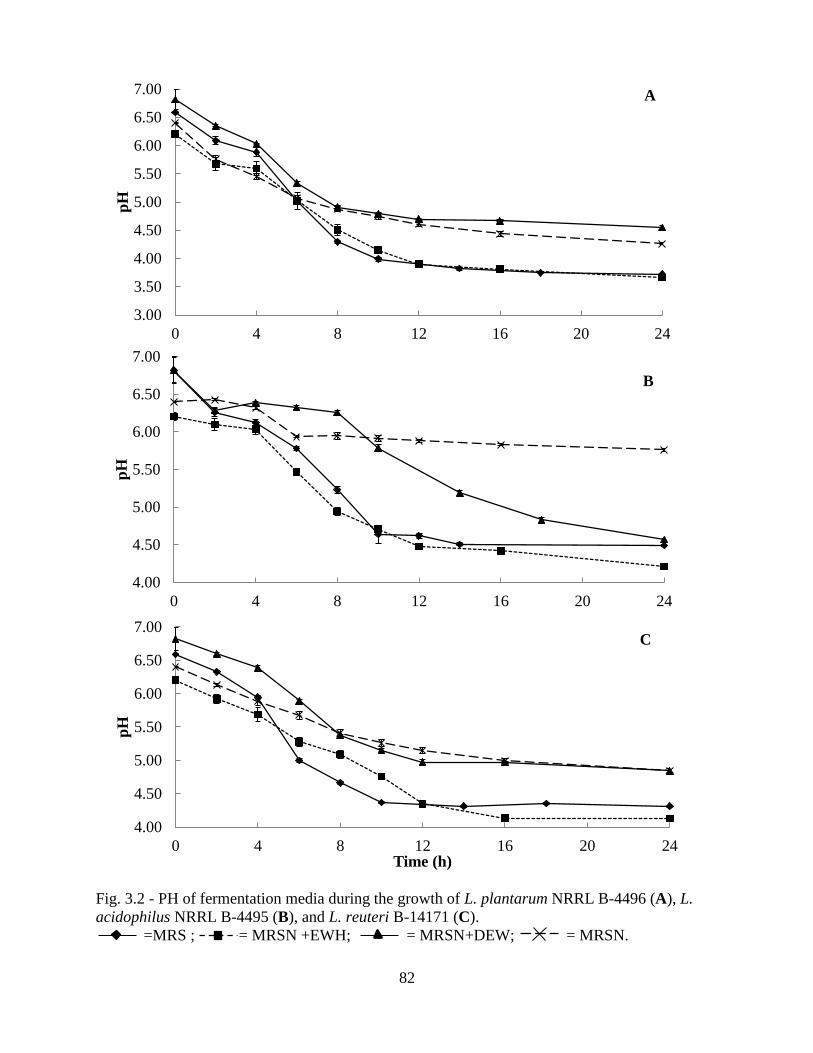
82
Fig. 3.2 - PH of fermentation media during the growth of L. plantarum NRRL B-4496 (A), L.
acidophilus NRRL B-4495 (B), and L. reuteri B-14171 (C).
=MRS ; = MRSN +EWH; = MRSN+DEW; = MRSN.
3.00
3.50
4.00
4.50
5.00
5.50
6.00
6.50
7.00
0 4 8 12 16 20 24
pH
A
4.00
4.50
5.00
5.50
6.00
6.50
7.00
0 4 8 12 16 20 24
pH
B
4.00
4.50
5.00
5.50
6.00
6.50
7.00
0 4 8 12 16 20 24
pH
Time (h)
C
83
The results indicated that a greater decrease in pH was observed in LAB grown on MRSN-
EWH than on MRSN-DEW.
3.3.3 Titratable acidity (TA)
Titratable acidity was quantified in terms of equivalent weight of lactic acid. According to
Ummadi and Curic-Bawden (2010) LAB can transform the available source of carbohydrates in
the media into acid (mainly lactic acid); this process results in a decrease in the pH and
organoleptic changes in the fermentation media. The amount of lactic acid produced is a LAB
strain-specific characteristic which can be enhanced (up to a certain limit) by improving the
cultivation conditions (Petrov, Urshev & Petrova, 2008). The influence of the fermentation
media on the titratable acidity for L. plantarum NRRL B-4496 is shown in Fig. 3.3.A. A
significantly (p<0.05) higher titratable acidity (g/100 mL) was obtained with MRS (1.73)
followed by MRSN-EWH (1.61) after 24 h. Therefore, L. plantarum produced 7% more
titratable acidity when growing in MRN than in MRSN-EWH. Also, the production of TA
reached its maximum value after 20 h of fermentation; meanwhile, the pH of the fermentation
media reached its minimum value after 12 h. According to Boulton (1980), pH is the logarithmic
of the concentration of the free protons or free hydrogen ions in the media; meanwhile, TA is the
number of protons recuperated during a titration with a base and both parameters are not
proportionally correlated. Also, it was seen that L. acidophilus NRRL B-4495 grown on MRSN-
EWH had a significantly (p<0.05) higher TA (g/100 mL) (0.71) compared to those of MRS
(0.66), MRSN-DEW (0.59), and MRSN (0.55), respectively (Fig. 3.3.B). This implies that L.
acidophilus secreted 7% more TA when it was grown on MRSN-EWH than in MRS. The results
for TA during the growth of L. reuteri B-14171 are presented in Fig. 3.3.C. It was observed that
after 24 h of fermentation, the titratable acidity (g/100 mL) of L. reuteri grown on MRS, MRSN-
84
EWH, MRSN-DEW, and MRSN was 1.05, 1.12, 0.57, and 0.39, respectively. In this case, L.
reuteri grown on MRSN-EWH produced a significantly (p<0.05) higher titratable acidity than on
the rest of the treatments. The growth of L. reuteri generates 6.25% more titratable acidity on
MRSN-EWH than on MRS after 24 h of fermentation. An enhancement in lactic acid production
by LAB using casein hydrolysates in the fermentation media have been previously reported by
Zhang, Ren, Zhao, Zhao, Xu and Zhao (2011). The authors attributed the results to the
supplementation of the hydrolysates containing small peptides (<3000 Da). Also, Gomes,
Malcata and Klaver (1998) have reported an increase in lactic acid production from
Bifidobacterium lactis by adding milk hydrolysates during the fermentation of skim milk.
However, the authors did not observe the same effect using L. acidophilus; which can be
attributed to its slow growth. The use of egg white protein hydrolysates as a nitrogen source in a
LAB fermentation media improved the production of lactic acid during a fermentation using L.
acidophilus and L. reuteri. Also, egg white hydrolysates (containing small peptides and large
amount of amino acids) were better nitrogen sources than dried egg white for the growth of L.
plantarum NRRL B-4496, L. acidophilus NRRL B-4495, and L. reuteri B-14171.
3.4 Conclusion
It was demonstrated that dried egg white hydrolysates can be effectively used as a nitrogen
source for media that supports the growth of L. plantarum NRRL B-4496, L. acidophilus NRRL
B-4495, and L. reuteri B-14171. Also, higher yields of cell biomass and production of titratable
acidity was observed in L. acidophilus NRRL B-4495 and L. reuteri B-14171when they grew in
a media containing dried egg white hydrolysates which suggested that dried egg white
hydrolysates with higher free amino acid contents are a better nitrogen source than dried egg
white; this may enable the LAB cultures to survive further processing; therefore, prolonging their
shelf life at room temperature.
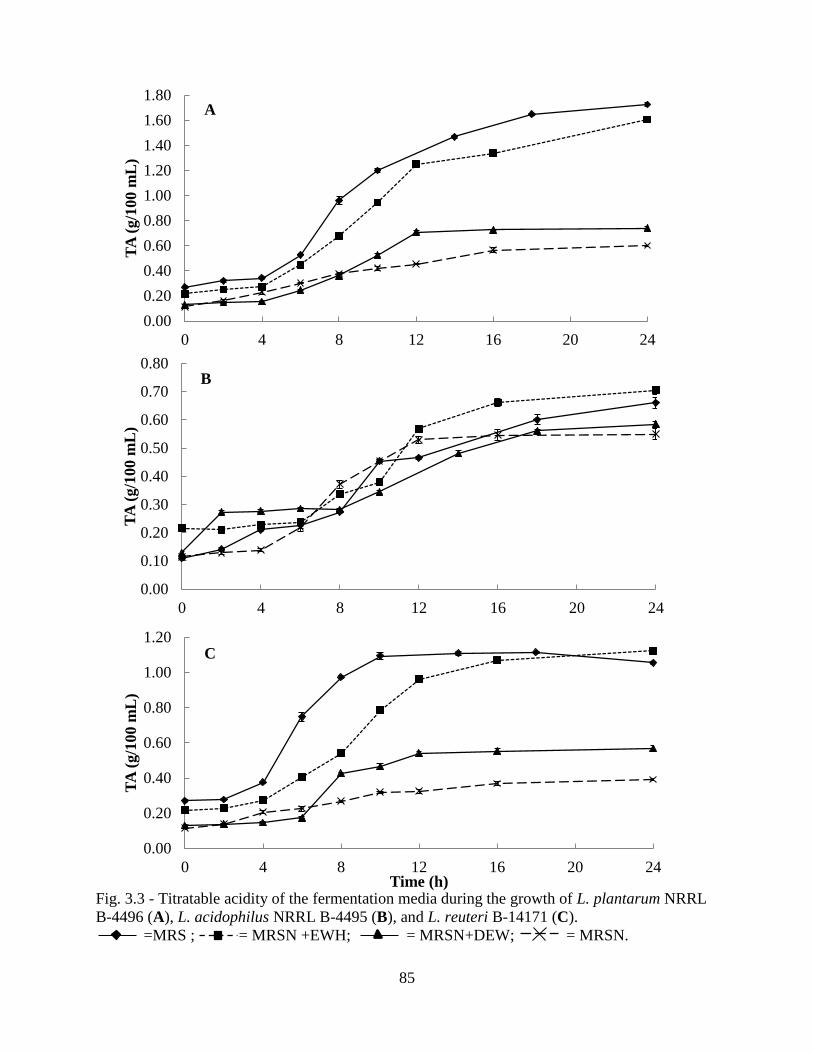
85
Fig. 3.3 - Titratable acidity of the fermentation media during the growth of L. plantarum NRRL
B-4496 (A), L. acidophilus NRRL B-4495 (B), and L. reuteri B-14171 (C).
=MRS ; = MRSN +EWH; = MRSN+DEW; = MRSN.
0.00
0.20
0.40
0.60
0.80
1.00
1.20
1.40
1.60
1.80
0 4 8 12 16 20 24
TA
(g/1
00 m
L)
A
0.00
0.10
0.20
0.30
0.40
0.50
0.60
0.70
0.80
0 4 8 12 16 20 24
TA
(g/1
00 m
L)
B
0.00
0.20
0.40
0.60
0.80
1.00
1.20
0 4 8 12 16 20 24
TA
(g/1
00 m
L)
Time (h)
C
86
3.5 References
AOAC. (1999). Official methods of analysis. Arlington, VA: Association of Official Analytical
Chemists.
Aspmo, S. I., Horn, S. J., & Eijsink, V. G. (2005). Hydrolysates from Atlantic cod (Gadus
morhua L.) viscera as components of microbial growth media. Process Biochemistry, 40(12),
3714-3722.
Boulton, R. (1980). The Relationships between Total Acidity, Titratable Acidity and pH in Wine.
American Journal of Enology and Viticulture, 31(1), 76-80.
Castro, R. J. S. d., & Sato, H. H. (2014). Functional properties and growth promotion of
bifidobacteria and lactic acid bacteria strains by protein hydrolysates using a statistical
mixture design. Food Bioscience.
Fioramonti, J., Theodorou, V., & Bueno, L. (2003). Probiotics: what are they? What are their
effects on gut physiology? Best Practice & Research Clinical Gastroenterology, 17(5), 711-
724.
Foucaud, C., Hemme, D., & Desmazeaud, M. (2001). Peptide utilization by Lactococcus lactis
and Leuconostoc mesenteroides. Letters in Applied Microbiology, 32(1), 20-25.
Gomes, A. M., Malcata, F. X., & Klaver, F. A. (1998). Growth Enhancement of Bifidobacterium
lactis Bo and Lactobacillus acidophilus Ki by Milk Hydrolyzates. Journal of Dairy Science,
81(11), 2817-2825.
Hebert, E. M., Raya, R. R., & De Giori, G. S. (2000). Nutritional requirements and nitrogen-
dependent regulation of proteinase activity of Lactobacillus helveticus CRL 1062. Applied
and environmental microbiology, 66(12), 5316-5321.
Horn, S., Aspmo, S., & Eijsink, V. (2005). Growth of Lactobacillus plantarum in media
containing hydrolysates of fish viscera. Journal of Applied Microbiology, 99(5), 1082-1089.
Juillard, V., Guillot, A., Le Bars, D., & Gripon, J.-C. (1998). Specificity of Milk Peptide
Utilization byLactococcus lactis. Applied and environmental microbiology, 64(4), 1230-
1236.
Kassis, N., Drake, S. R., Beamer, S. K., Matak, K. E., & Jaczynski, J. (2010). Development of
nutraceutical egg products with omega-3-rich oils. LWT-Food Science and Technology,
43(5), 777-783.
Kopp-Hoolihan, L. (2001). Prophylactic and Therapeutic Uses of Probiotics: A review. Journal
of the American Dietetic Association, 101(2), 229-241.
87
Liu, Q., Kong, B., Xiong, Y. L., & Xia, X. (2010). Antioxidant activity and functional properties
of porcine plasma protein hydrolysate as influenced by the degree of hydrolysis. Food
Chemistry, 118(2), 403-410.
Martone, C. B., Borla, O. P., & Sánchez, J. J. (2005). Fishery by-product as a nutrient source for
bacteria and archaea growth media. Bioresource technology, 96(3), 383-387.
Meli, F., Lazzi, C., Neviani, E., & Gatti, M. (2014). Effect of Protein Hydrolysates on Growth
Kinetics and Aminopeptidase Activities of Lactobacillus. Current microbiology, 68(1), 82-
87.
Petrov, K., Urshev, Z., & Petrova, P. (2008). l (+)-Lactic acid production from starch by a novel
amylolytic Lactococcus lactis subsp.lactis B84. Food microbiology, 25(4), 550-557.
Ravula, R., & Shah, N. (1998). Effect of acid casein hydrolysate and cysteine on the viability of
yogurt and probiotic bacteria in fermented frozen dairy desserts. Australian Journal of Dairy
Technology, 53(3), 175-179.
Safari, R., Motamedzadegan, A., Ovissipour, M., Regenstein, J. M., Gildberg, A., & Rasco, B.
(2012). Use of hydrolysates from yellowfin tuna (Thunnus albacares) heads as a complex
nitrogen source for lactic acid bacteria. Food and Bioprocess Technology, 5(1), 73-79.
Ummadi, M. S., & Curic-Bawden, M. (2010). Use of protein hydrolysates in industrial starter
culture fermentations. Protein Hydrolysates in Biotechnology pp. 91-114): Springer.
Xie, L., Ye, X., Liu, D., & Ying, Y. (2011). Prediction of titratable acidity, malic acid, and citric
acid in bayberry fruit by near-infrared spectroscopy. Food Research International, 44(7),
2198-2204.
Zhang, Q., Ren, J., Zhao, H., Zhao, M., Xu, J., & Zhao, Q. (2011). Influence of casein
hydrolysates on the growth and lactic acid production of Lactobacillus delbrueckii subsp.
bulgaricus and Streptococcus thermophilus. International Journal of Food Science &
Technology, 46(5), 1014-1020.
Zotta, T., Asterinou, K., Rossano, R., Ricciardi, A., Varcamonti, M., & Parente, E. (2009). Effect
of inactivation of stress response regulators on the growth and survival of Streptococcus
thermophilus Sfi39. International journal of food microbiology, 129(3), 211-220.
88
CHAPTER 4 - CO-CURRENT AND COUNTER-CURRENT SPRAY DRYING
COMPUTATIONAL FLUID DYNAMICS (CFD) SIMULATION STUDIES TO PREDICT
THE QUALITY OF MICROENCAPSULATED FISH OIL WITH EGG WHITE
HYDROLYSATES POWDERS
4.1 Introduction
Spray drying is a processing technique of transforming a liquid feed into a low-moisture
content powder and is widely used in several industries including food manufacturing (Fletcher,
Guo, Harvie, Langrish, Nijdam & Williams, 2006). Several attempts have been proposed to
model the physical phenomena that govern the spray drying process; however, these models are
inadequately correlated with final quality of the spray-dried powders (Kuriakose &
Anandharamakrishnan, 2010). Also, basic mass transport assumptions that occur in the drying
chamber are applied and the physical phenomena that takes place at other important parts of the
spray dryer like the cyclone separator is normally neglected (Kuriakose &
Anandharamakrishnan, 2010; Mezhericher, Levy & Borde, 2009). Therefore, more accurate
spray drying models need to be built to understand and predict thermal degradation of bioactives
during spray drying. To experimentally study the spray drying process is challenging and
difficult due to the complexity in measuring and describing the drying air flow, heat, and mass
transfer mechanisms within the spray dryer (Birchal, Huang, Mujumdar & Passos, 2006).
According to Kieviet (1997), prediction of the final quality of spray-dried products is
extremely difficult because parameters like moisture content, thermal degradation of bioactives,
aroma retention, stickiness, particle structure and size are normally associated with product
quality. In addition, quality of spray-dried powders is highly linked with the spray drying
processing conditions (temperature, humidity, etc.) (Kieviet & Kerkhof, 1995; Paris, Ross Jr,
Dastur & Morris, 1971). Due to the complexity of experimentally predicting the final quality of
spray-dried powders, several models of the spray drying process have been reported in the
89
literature using a computational fluid dynamics approach (CFD) (Birchal, Huang, Mujumdar &
Passos, 2006); however, most of these attempts are based on experimental calculations of drying
kinetics of discrete droplets immersed into a current of hot air (Mezhericher, Levy & Borde,
2012).
CFD is as a powerful simulation tool that has been utilized in basic and applied research and
has attracted the interest of the food processing sector in recent years (Kuriakose &
Anandharamakrishnan, 2010). CFD uses powerful computers and applied mathematics to model
fluid flow processes. This simulation tool requires solving equations for the conservation of
mass, momentum and energy using numerical methods to predict velocity, temperature and
pressure inside of a spray dryer (Scott & Richardson, 1997).In the case of spray drying, CFD can
be used to predict the drying air flow pattern and food particle histories such as temperature,
velocity, and residence times. These parameters are extremely difficult and expensive to be
measured in large and/or pilot-scale spray dryers. Also, CFD can be successfully employed to
study the effect of chamber design on drying behavior of food materials. Therefore, CFD is a
useful tool to scale-up spray drying chambers from pilot to full industrial scale (Mezhericher,
Levy & Borde, 2009).
Microencapsulation of fish oil by spray drying has been used to reduce lipid oxidation during
storage. However, lipid oxidation of the microencapsulated oil can happen during the spray
drying process due to the high drying air temperatures. Tonon, Grosso and Hubinger (2011) have
reported that increasing drying air temperatures produces greater lipid oxidation in
microencapsulated flaxseed oil. Furthermore, longer particle residence time (RT) at high drying
air temperatures during spray drying increases thermal degradation and oxidation of lipids
(Bimbenet, Bonazzi & Dumoulin, 2002).
90
Measuring the particle residence time (RT) during spray drying is extremely challenging
because it involves several parameters such as spray drying configuration, drying air velocity and
temperature, emulsion flow rate, and feed atomization conditions; therefore, CFD simulations
have been effectively used to predict the RT of spray dried particles (Ducept, Sionneau &
Vasseur, 2002). According to Huang, Kumar and Mujumdar (2003a) most of the CFD spray
drying simulations are carry out using co-current spray drying configurations. So, there is a lack
of scientific information about CFD spray drying simulations in counter-current conditions. CFD
simulations have allowed the improvement on device design and somehow predict the final
quality of powders; nevertheless, predicting the quality of powders using only the computational
tool is complicated due to the number of parameters that intervene during the process such as
droplet evaporation, collision, breakups, agglomeration, heat and mass exchange between the
droplets and drying medium and so on (Gharsallaoui, Roudaut, Chambin, Voilley & Saurel,
2007). Therefore, combining CFD simulations with experimental tools is a more feasible and
practical approach for predicting the final quality of spray-dried food powders.
There is a lack of scientific literature regarding the use CFD simulations with experimental
methods to study the final quality of microencapsulated fish oil with egg white hydrolysates by
spray drying. Also, comparison studies between the performance of co-current and counter-
current spray drying configurations on the quality of the powder are needed. So, the objectives of
this study were: (1) to produce microencapsulated fish oil with egg white hydrolysates powders
by spray drying; (2) to develop 3D-CFD models to study the drying air flow pattern and particle
histories during spray drying of microencapsulated fish oil powders; and (3) to study the effects
of inlet air temperature, emulsion flow rate, and spray drying configuration on the quality of the
microencapsulated fish oil powders using CFD simulations and experimental tools.
91
4.2 Materials and Methods
4.2.1 Experimental procedure
Microencapsulated fish oil powders were physically produced by spray drying in order to
generate experimental data that can be compared with the predicted results obtained with the 3D-
CFD simulations.
4.2.1.1 Materials
Fresh, large, grade AA hen eggs were purchased from a local chain grocery store, in Baton
Rouge, Louisiana. The eggs were stored at 4°C, and the storage time did not exceed three days.
A commercial food-grade protease from Bacillus subtilis was obtained from Enzyme
Development Corporation (New York, NY). Menhaden fish oil (MO) was obtained from a
commercial vendor (VooDoo Offshore, Pleasant, S.C.). All other analytical grade reagents were
obtained from Sigma Aldrich (St. Louis, MO).
4.2.1.2 Preparation of liquid egg white hydrolysates (LEWH)
Fresh egg whites (EW) were manually separated from egg yolks. Then, the moisture content
of the EW was determined according to the official AOAC method 930.15 (AOAC, 1999). A
10±0.5 (g solids/100g) mixture containing 80g liquid egg white and 20 g distilled water was
prepared and homogenized using an ultra-shearing processor (OMNI, Ultrashear M, Omni
International, Kennesaw, GA) for 5 min. at 20,000 rpm, and then heated to 65°C in a water bath
for 5 min. Afterwards, the mixture was cooled down to room temperature and its PH was
adjusted to 4.60 using a 1 M citric acid solution. The enzymatic hydrolysis was carried out at 38
°C for 110 min using food-grade protease obtained from Aspergillus oryzae with the enzyme-to-
substrate ratio [E:S] standardized at 550 (U enzyme/g protein). To stop the enzymatic activity,
92
the fermentation vessel (containing LEWH) was heated to 85°C for 5 min. and homogenized at
room temperature.
4.2.1.3 Emulsion preparation
Oil-in-water emulsions containing MO and LEWH were prepared to produce
microencapsulated menhaden oil with egg white hydrolysates. Based on our preliminary studies
from our lab reported by Yin, Pu, Wan, Xiang, Bechtel and Sathivel (2010), stable emulsions (E-
MO-LEWH) were obtained with 3 (g/100g) MO, and 97 (g/100g) LEWH. LEWH had a solid
content of approximately 12g/100 mL; therefore, E-MO-LEWH contained 15 (g/100g) solids.
The emulsion preparation conditions were selected following the procedure reported by Yin, Pu,
Wan, Xiang, Bechtel and Sathivel (2010). The emulsions were homogenized for 5 min using an
ultrasonic processor (500 Watt Model CPX 500, Cole-Parmer Instrument Co. Vernon Hill, IL)
fitted with a 22 mm tip diameter at 82% amplitude with 2x1 pulses (with 1 s delay between
pulses) and then using an ultra-shearing processor for 5 min. at 20,000 rpm. Samples were held
in an ice bath at 4°C during the procedure.
4.2.1.4 Spray drying of E-MO-LEWH
E-MO-LEWH was dried using a pilot-scale spray dryer (FT80 Tall Form Spray Dryer
Armfield Inc., Ringwood, UK) under co-current (CO) and counter-current (CNT) conditions at a
flow rate (Kg/h) of 0.5, 0.75 and/or 1. Inlet air temperature was set to 130, 150 and/or 170°C.
Details of the CO and CNT conditions are described in section 4.2.2.1.1. Inlet air velocities and
temperatures were measured inside the drying chamber in order to validate the results of the 3D-
CFD simulations. Air temperature and velocity inside the drying chamber of the spray dryer was
measured using an anemometer (Kanomax 6162 Anemomaster, Japan) as shown in Fig. 4.1. The
data was collected once the drying air reached steady state conditions. The resulting spray-dried
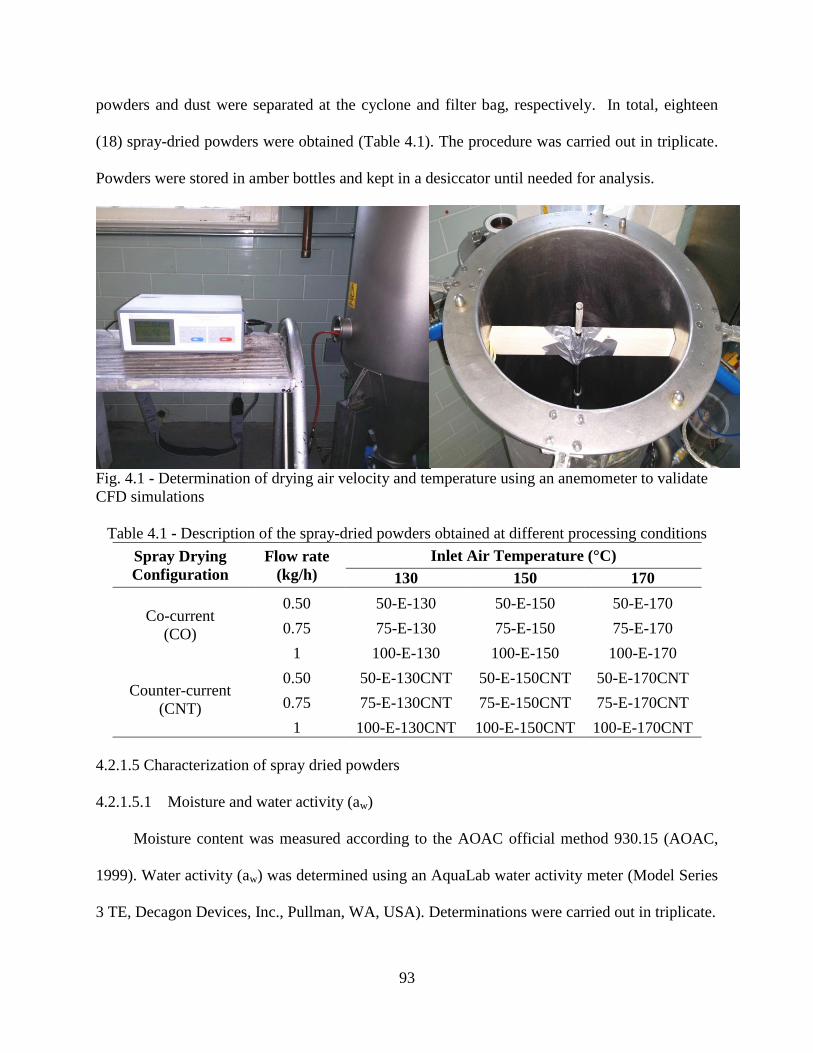
93
powders and dust were separated at the cyclone and filter bag, respectively. In total, eighteen
(18) spray-dried powders were obtained (Table 4.1). The procedure was carried out in triplicate.
Powders were stored in amber bottles and kept in a desiccator until needed for analysis.
Fig. 4.1 - Determination of drying air velocity and temperature using an anemometer to validate
CFD simulations
Table 4.1 - Description of the spray-dried powders obtained at different processing conditions
Spray Drying
Configuration
Flow rate
(kg/h)
Inlet Air Temperature (°C)
130 150 170
Co-current
(CO)
0.50 50-E-130 50-E-150 50-E-170
0.75 75-E-130 75-E-150 75-E-170
1 100-E-130 100-E-150 100-E-170
Counter-current
(CNT)
0.50 50-E-130CNT 50-E-150CNT 50-E-170CNT
0.75 75-E-130CNT 75-E-150CNT 75-E-170CNT
1 100-E-130CNT 100-E-150CNT 100-E-170CNT
4.2.1.5 Characterization of spray dried powders
4.2.1.5.1 Moisture and water activity (aw)
Moisture content was measured according to the AOAC official method 930.15 (AOAC,
1999). Water activity (aw) was determined using an AquaLab water activity meter (Model Series
3 TE, Decagon Devices, Inc., Pullman, WA, USA). Determinations were carried out in triplicate.
94
4.2.1.5.2 Microencapsulation efficiency (ME)
The total lipid content (OT) of the microencapsulated includes encapsulated oil (EO) and
surface oil (OS). The EO was determined as EO=OT–OS. The OT and OS were determined to
calculate ME using Eq. 4.1 as described in Wanasundara and Shahidi (1995).
ME = [Total oil – Surface oil)/Total oil] x 100 (4.1)
4.2.1.5.3 Lipid oxidation
a. Peroxide value (PV)
The PV of the spray-dried powders was determined by following the IDF method described
in Shantha and Decker (1993) with some modifications. An iron (II) chloride solution was
prepared by dissolving 0.4 barium chloride dehydrate in 50 mL of distilled water; then, to this
solution was added an iron (II) sulfate solution (0.5 g FeSO4.7H2O dissolved in 50 mL distilled
water). Afterwards, two mL of 10N hydrochloric acid were added and the barium sulfate
precipitate was filtered off and stored in a brown bottle and kept in the dark.
To determine the PV of the powders, 0.3 g of sample was mixed with 9.8 mL chloroform-
methanol (7+3, v/v) and vortexed for 4 s. Then, 50 µL of ammonium thiocyanate solution and 50
uL iron (II) solution were added and the mixture was vortexed for 4 s. After 5 min incubation at
room temperature, the absorbance of the samples was recorded at 500 nm against a blank that
contained all the reagents except the sample. A standard curve of Fe3+
concentration vs.
absorbance was constructed to quantify PV. The PV, expressed as milliequivalents of peroxide
per kilogram of sample, was calculated by using the following Eq. 4.2
𝑃𝑒𝑟𝑜𝑥𝑖𝑑𝑒 𝑉𝑎𝑙𝑢𝑒 =(𝐴𝑠−𝐴𝑏)∗𝑚
55.84∗𝑚0∗2 (4.2)
Where, 𝐴𝑠= absorbance of the sample; 𝐴𝑏= absorbance of the blank; m=slope (from the standard
curve); 𝑚0 = mass of the sample (g); 55.84 =atomic weight of iron.
95
b. Thiobarbituric acid reactive substances (TBARS)
TBARS of the powders were determined according to method described in Mei,
McClements, Wu and Decker (1998). A solution of thiobarbituric acid (TBA) was prepared by
mixing 15g of tricholoroactic acid, 0.375 g of TBA, 1.76 mL of 12 N HCL, and 82.9 mL of H2O.
The TBA solution (100 mL) was mixed with 3 mL of 2 (g/100 mL) butylated hydroxytoluene in
ethanol. Then, 2 mL of the resulting solution were mixed with 1 mL of a sample prepared with
0.5 g of powder and 5 mL of distilled water. The mixture was vortexed for 10 s and heated in a
boiling water bath for 15 min. Then, it was allowed to cool to room temperature at 25°C and
centrifuged at 3400 x g (5600 rpm) for 25 min. The absorbance of the supernatant was measured
at 530 nm. Concentrations of TBARS were determined from standard curves prepared with 0-
0.02 mmol/L of 1,1,,3,- tetraethoxypropane. The results were expressed in mmol of equivalents
of malonaldehyde per kg oil.
4.2.1.5.4 Microstructure and particle size analysis
Scanning Electron Microscopy (SEM) micrographs were obtained at the Louisiana State
University - Institute for Advance Materials. The microstructure of the powders was evaluated
by SEM (JSM-6610LV, JEOL Ltd. Japan). The samples were mounted on aluminum SEM stubs,
and then coated with gold:palladium (60:40) in an Edwards S150 sputter coater (Edwards High
Vacuum International, Wilmington, MA). The powders were systematically observed at 1000X
of magnification. Particle size analysis was carried out at the Composites and Engineered Wood
Products Laboratory of the LSU-School of Renewable Natural Resources. Particle size was
measured by a Microtrac S3500 system (MicroTrac, Largo FL). The system is equipped with
three solid state lasers fixed at 780 nm. Powder samples were placed into the test chamber with
circulating ethanol. A 10s period of ultrasound mixing at 20 watts was used before each test.
96
Then the sample was pumped through the sample cell at 40% of the maximum flow rate. Light
was scattered from the tri-lasers from low to high angles (0-163 degrees). The volume
distribution of the particle size was calculated using modified MIE-scattering technique.
4.2.1.5.5 Statistical analysis
Experimental data was statistically analyzed by SAS software version 9.2 (SAS Institute Inc.,
2008). Mean values and standard deviations from triplicate analysis were reported. A factorial
experimental design was used to carry out the Analysis of Variance (ANOVA). A Tukey’s
studentized range test was carried out to determine differences among treatments at the
significant level of P<0.05.
4.2.2 Computational fluid dynamics (CFD) simulation methodology
In this study, two sub-processes were separately studied to successfully model the spray
drying procedure using CFD; this approach allowed reaching convergence faster during the CFD
simulations. The drying phenomena occurring in the drying chamber was studied in the first
case; meanwhile, the second case was defined as the separation of the dried particles at the
cyclone separator. The CFD code ANSYS FLUENT 15.0 was used to develop the spray drying
simulations in a 3D-geometry using a pseudo-transient-method; which is a form of implicit
under-relaxation for steady-state conditions for air flow and particle injections under CO and
CNT spray drying configurations using a pressure nozzle with a solid-cone spray. Also, a hybrid
solution initiation was used to improve the convergence of the simulations. A 3D model of the
spray dryer was created in Autodesk Inventor (Fig.4.2) with the same dimensions of the pilot
scale spray dryer. The convergence of the numerical solution has been checked by means of
residuals of the governing equations and also by net imbalances between the entering and leaving
mass flow and heat transfer rates.
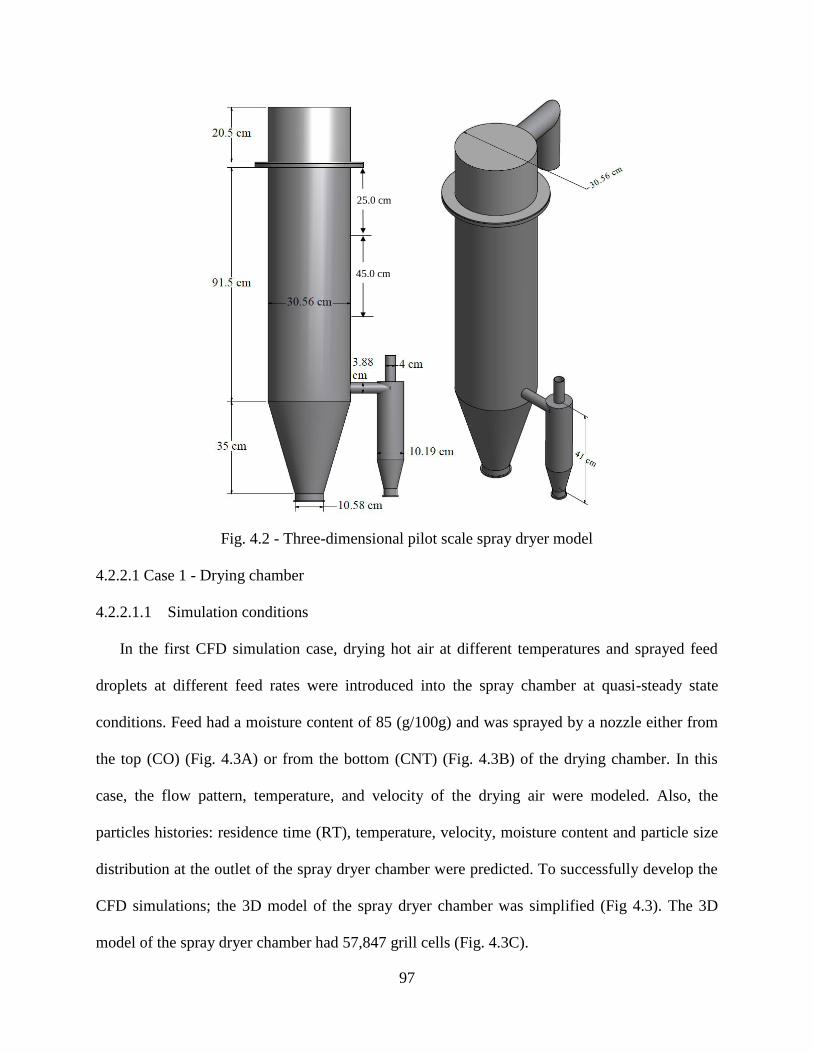
97
Fig. 4.2 - Three-dimensional pilot scale spray dryer model
4.2.2.1 Case 1 - Drying chamber
4.2.2.1.1 Simulation conditions
In the first CFD simulation case, drying hot air at different temperatures and sprayed feed
droplets at different feed rates were introduced into the spray chamber at quasi-steady state
conditions. Feed had a moisture content of 85 (g/100g) and was sprayed by a nozzle either from
the top (CO) (Fig. 4.3A) or from the bottom (CNT) (Fig. 4.3B) of the drying chamber. In this
case, the flow pattern, temperature, and velocity of the drying air were modeled. Also, the
particles histories: residence time (RT), temperature, velocity, moisture content and particle size
distribution at the outlet of the spray dryer chamber were predicted. To successfully develop the
CFD simulations; the 3D model of the spray dryer chamber was simplified (Fig 4.3). The 3D
model of the spray dryer chamber had 57,847 grill cells (Fig. 4.3C).
45.0 cm
25.0 cm
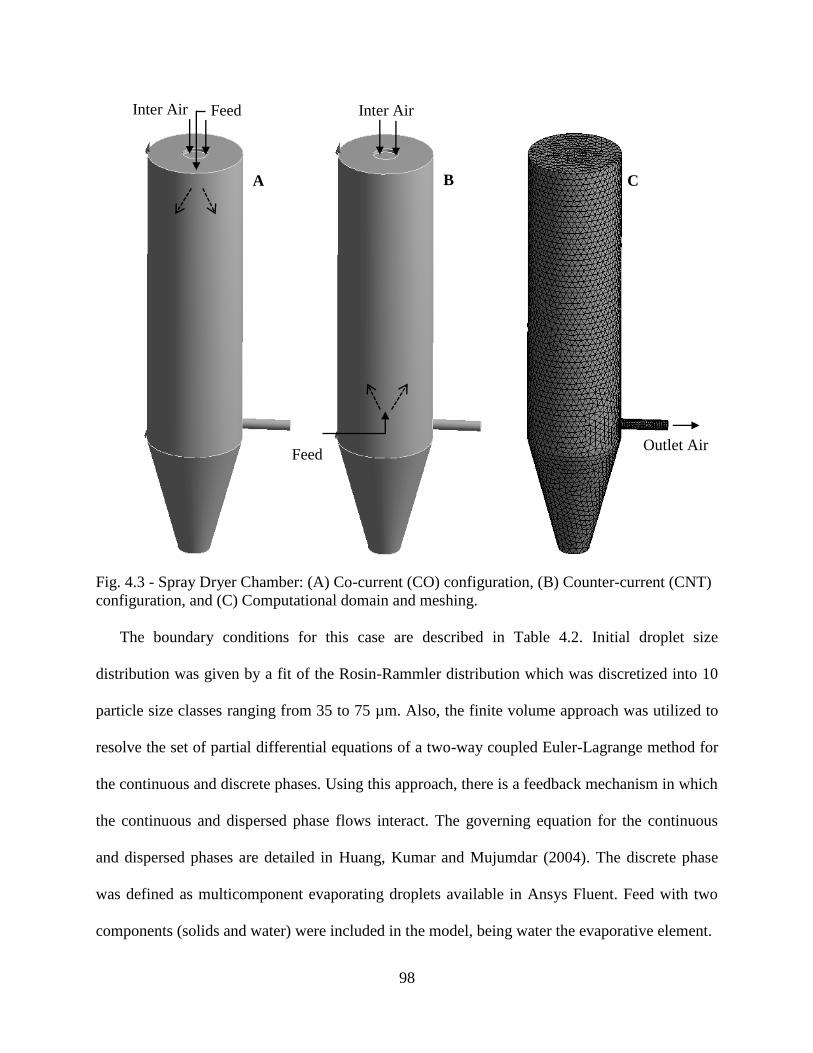
98
Fig. 4.3 - Spray Dryer Chamber: (A) Co-current (CO) configuration, (B) Counter-current (CNT)
configuration, and (C) Computational domain and meshing.
The boundary conditions for this case are described in Table 4.2. Initial droplet size
distribution was given by a fit of the Rosin-Rammler distribution which was discretized into 10
particle size classes ranging from 35 to 75 µm. Also, the finite volume approach was utilized to
resolve the set of partial differential equations of a two-way coupled Euler-Lagrange method for
the continuous and discrete phases. Using this approach, there is a feedback mechanism in which
the continuous and dispersed phase flows interact. The governing equation for the continuous
and dispersed phases are detailed in Huang, Kumar and Mujumdar (2004). The discrete phase
was defined as multicomponent evaporating droplets available in Ansys Fluent. Feed with two
components (solids and water) were included in the model, being water the evaporative element.
Inter Air
Outlet Air
Inter Air Feed
Feed
B C A
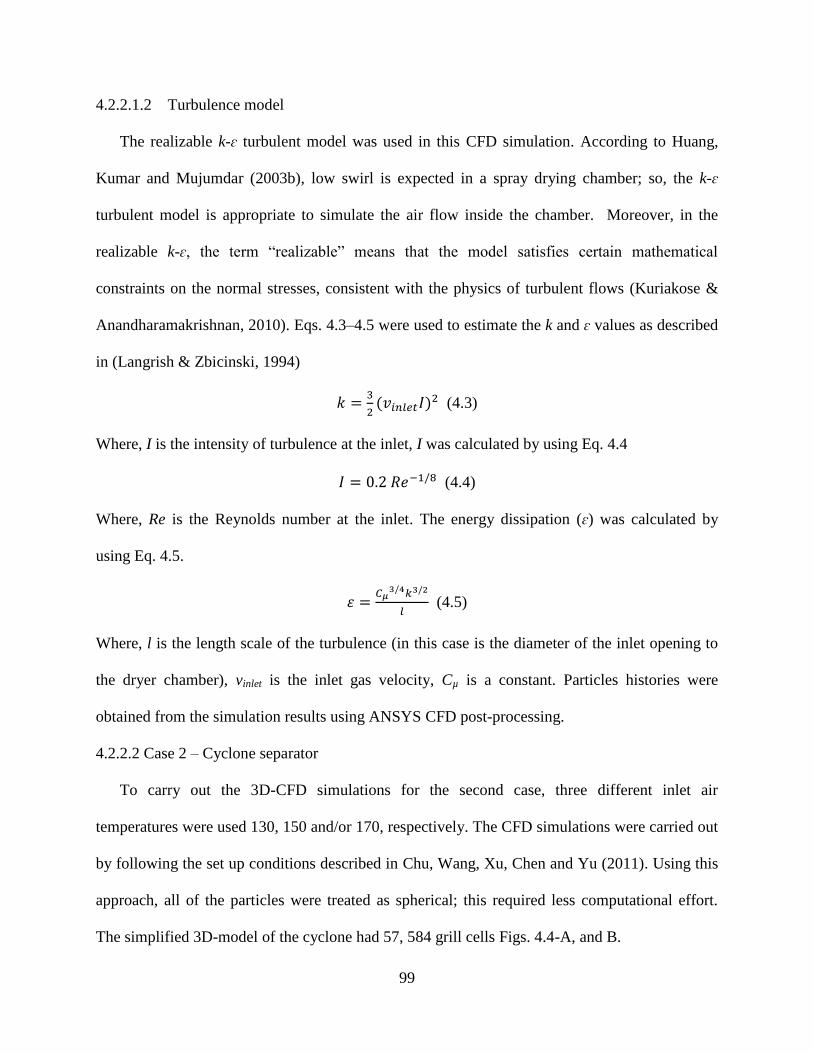
99
4.2.2.1.2 Turbulence model
The realizable k-ɛ turbulent model was used in this CFD simulation. According to Huang,
Kumar and Mujumdar (2003b), low swirl is expected in a spray drying chamber; so, the k-ɛ
turbulent model is appropriate to simulate the air flow inside the chamber. Moreover, in the
realizable k-ɛ, the term “realizable” means that the model satisfies certain mathematical
constraints on the normal stresses, consistent with the physics of turbulent flows (Kuriakose &
Anandharamakrishnan, 2010). Eqs. 4.3–4.5 were used to estimate the k and ɛ values as described
in (Langrish & Zbicinski, 1994)
𝑘 =3
2(𝑣𝑖𝑛𝑙𝑒𝑡𝐼)2 (4.3)
Where, I is the intensity of turbulence at the inlet, I was calculated by using Eq. 4.4
𝐼 = 0.2 𝑅𝑒−1/8 (4.4)
Where, Re is the Reynolds number at the inlet. The energy dissipation (ɛ) was calculated by
using Eq. 4.5.
𝜀 =𝐶𝜇
3/4𝑘3/2
𝑙 (4.5)
Where, l is the length scale of the turbulence (in this case is the diameter of the inlet opening to
the dryer chamber), vinlet is the inlet gas velocity, Cµ is a constant. Particles histories were
obtained from the simulation results using ANSYS CFD post-processing.
4.2.2.2 Case 2 – Cyclone separator
To carry out the 3D-CFD simulations for the second case, three different inlet air
temperatures were used 130, 150 and/or 170, respectively. The CFD simulations were carried out
by following the set up conditions described in Chu, Wang, Xu, Chen and Yu (2011). Using this
approach, all of the particles were treated as spherical; this required less computational effort.
The simplified 3D-model of the cyclone had 57, 584 grill cells Figs. 4.4-A, and B.
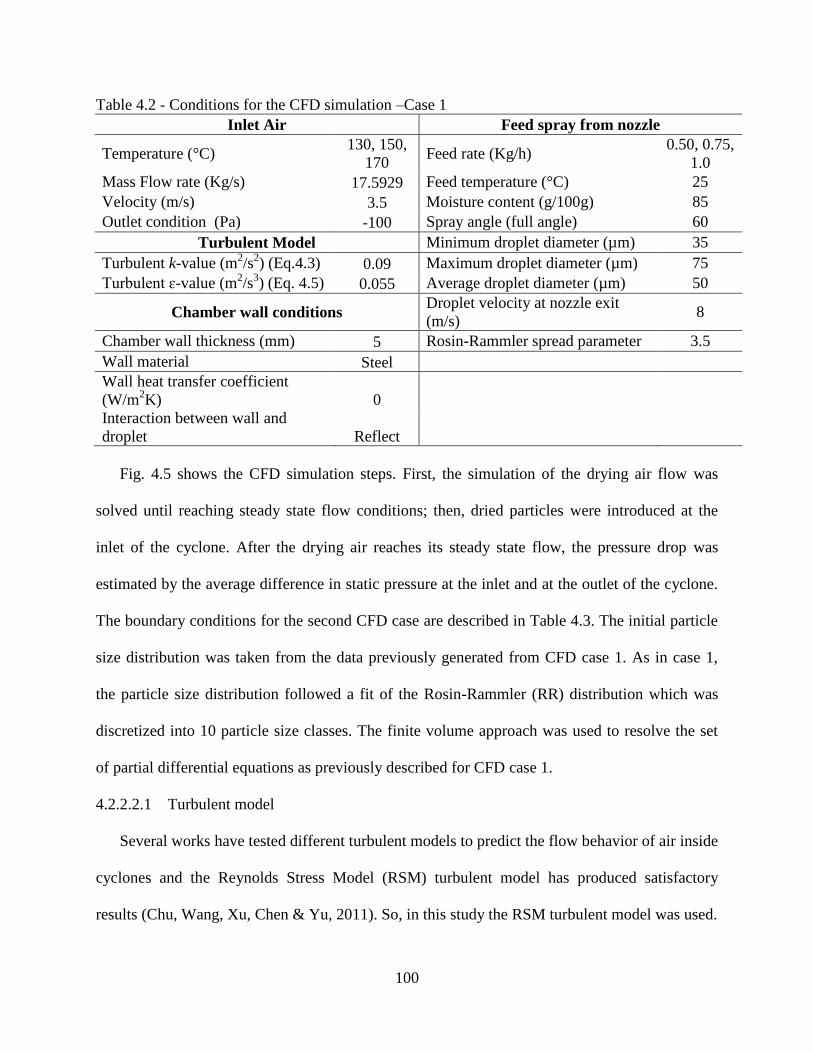
100
Table 4.2 - Conditions for the CFD simulation –Case 1
Inlet Air Feed spray from nozzle
Temperature (°C) 130, 150,
170 Feed rate (Kg/h)
0.50, 0.75,
1.0
Mass Flow rate (Kg/s) 17.5929 Feed temperature (°C) 25
Velocity (m/s) 3.5 Moisture content (g/100g) 85
Outlet condition (Pa) -100 Spray angle (full angle) 60
Turbulent Model Minimum droplet diameter (µm) 35
Turbulent k-value (m2/s
2) (Eq.4.3) 0.09 Maximum droplet diameter (µm) 75
Turbulent ɛ-value (m2/s
3) (Eq. 4.5) 0.055 Average droplet diameter (µm) 50
Chamber wall conditions Droplet velocity at nozzle exit
(m/s) 8
Chamber wall thickness (mm) 5 Rosin-Rammler spread parameter 3.5
Wall material Steel
Wall heat transfer coefficient
(W/m2K) 0
Interaction between wall and
droplet Reflect
Fig. 4.5 shows the CFD simulation steps. First, the simulation of the drying air flow was
solved until reaching steady state flow conditions; then, dried particles were introduced at the
inlet of the cyclone. After the drying air reaches its steady state flow, the pressure drop was
estimated by the average difference in static pressure at the inlet and at the outlet of the cyclone.
The boundary conditions for the second CFD case are described in Table 4.3. The initial particle
size distribution was taken from the data previously generated from CFD case 1. As in case 1,
the particle size distribution followed a fit of the Rosin-Rammler (RR) distribution which was
discretized into 10 particle size classes. The finite volume approach was used to resolve the set
of partial differential equations as previously described for CFD case 1.
4.2.2.2.1 Turbulent model
Several works have tested different turbulent models to predict the flow behavior of air inside
cyclones and the Reynolds Stress Model (RSM) turbulent model has produced satisfactory
results (Chu, Wang, Xu, Chen & Yu, 2011). So, in this study the RSM turbulent model was used.
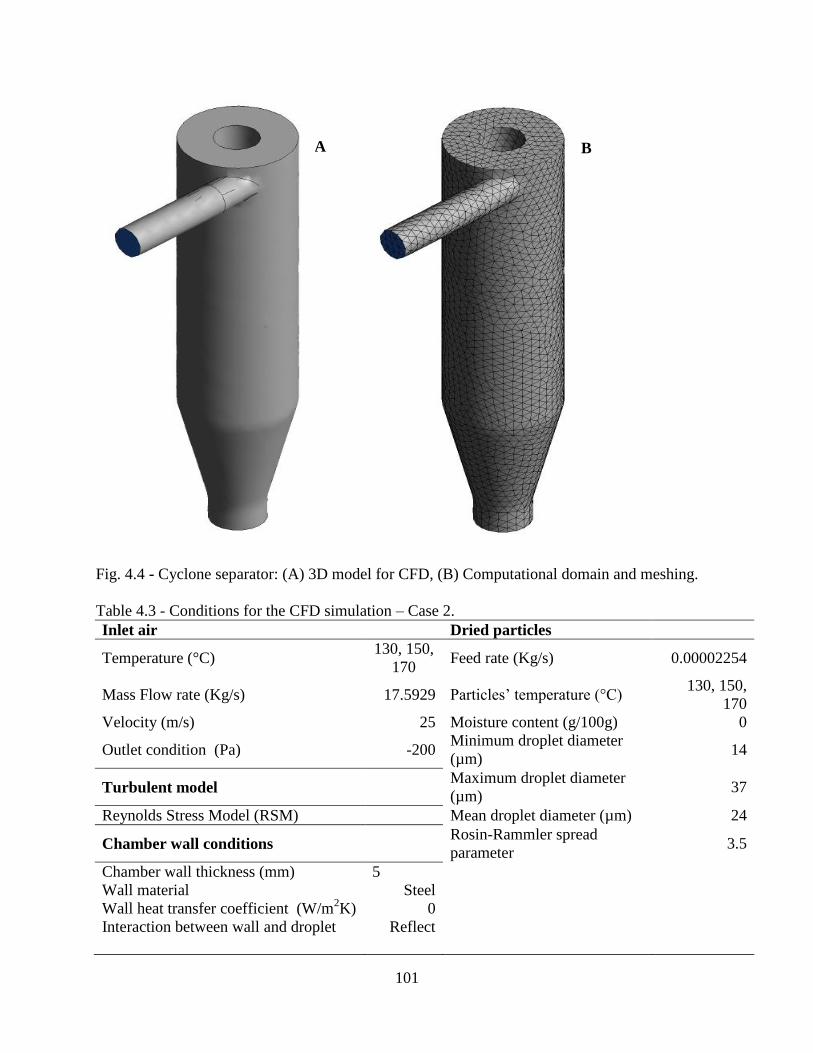
101
Fig. 4.4 - Cyclone separator: (A) 3D model for CFD, (B) Computational domain and meshing.
Table 4.3 - Conditions for the CFD simulation – Case 2.
Inlet air Dried particles
Temperature (°C) 130, 150,
170 Feed rate (Kg/s) 0.00002254
Mass Flow rate (Kg/s) 17.5929 Particles’ temperature (°C) 130, 150,
170
Velocity (m/s) 25 Moisture content (g/100g) 0
Outlet condition (Pa) -200 Minimum droplet diameter
(µm) 14
Turbulent model
Maximum droplet diameter
(µm) 37
Reynolds Stress Model (RSM)
Mean droplet diameter (µm) 24
Chamber wall conditions
Rosin-Rammler spread
parameter 3.5
Chamber wall thickness (mm) 5
Wall material Steel
Wall heat transfer coefficient (W/m2K) 0
Interaction between wall and droplet Reflect
A B
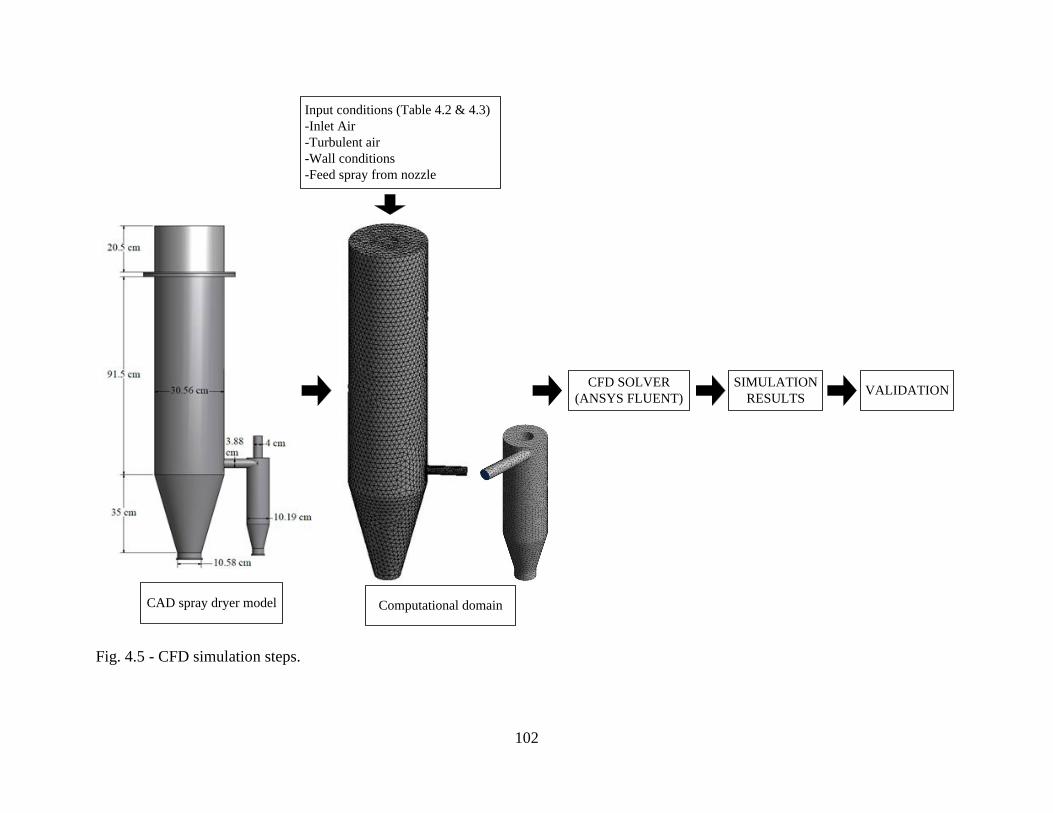
102
Input conditions (Table 4.2 & 4.3)
-Inlet Air
-Turbulent air
-Wall conditions
-Feed spray from nozzle
CAD spray dryer model
CFD SOLVER
(ANSYS FLUENT)
SIMULATION
RESULTSVALIDATION
Computational domain
Fig. 4.5 - CFD simulation steps.
103
4.3 Results and discussion
The development of 3D-CFD simulations is essential to accurately predict drying air flow
patterns and particle histories and trajectories inside the spray dryer (Mezhericher, Levy &
Borde, 2009). According to Kuriakose and Anandharamakrishnan (2010), 3D-CFD simulations
are better than 2D-CFD simulations because the asymmetry of the drying air flow patterns and
particle trajectories can be predicted and therefore more accurate results are obtained. However,
3D-CFD simulations require higher computational power; so, they are recommended for detailed
spray drying studies.
As previously discussed, the two main sections of the pilot-scale spray dryer used in this
study are the dryer chamber and the cyclone separator. Due to the complexity of the drying
phenomena taking place inside the spray dryer, each section of the spray dryer has been studied
separately. This simplification allowed the convergence of the 3D-CFD simulations.
The first part of this study (case 1) focused on the drying phenomena occurring at the drying
chamber of the spray dryer. Meanwhile, the second case focused on the separation of the spray-
dried particles from the drying air flow inside the cyclone separator.
4.3.1 Case 1
4.3.1.1 Experimental validation
4.3.1.1.1 Drying air velocity
The measured and predicted drying air velocities inside the drying chamber are shown in Fig.
4.5. According to Mezhericher, Levy and Borde (2009), air velocity inside the spray dryer is one
of the most important parameters of the spray drying process because it influences the particle
residence time inside the drying chamber. Experimental air velocities were measured during CO
and CNT spray drying conditions.
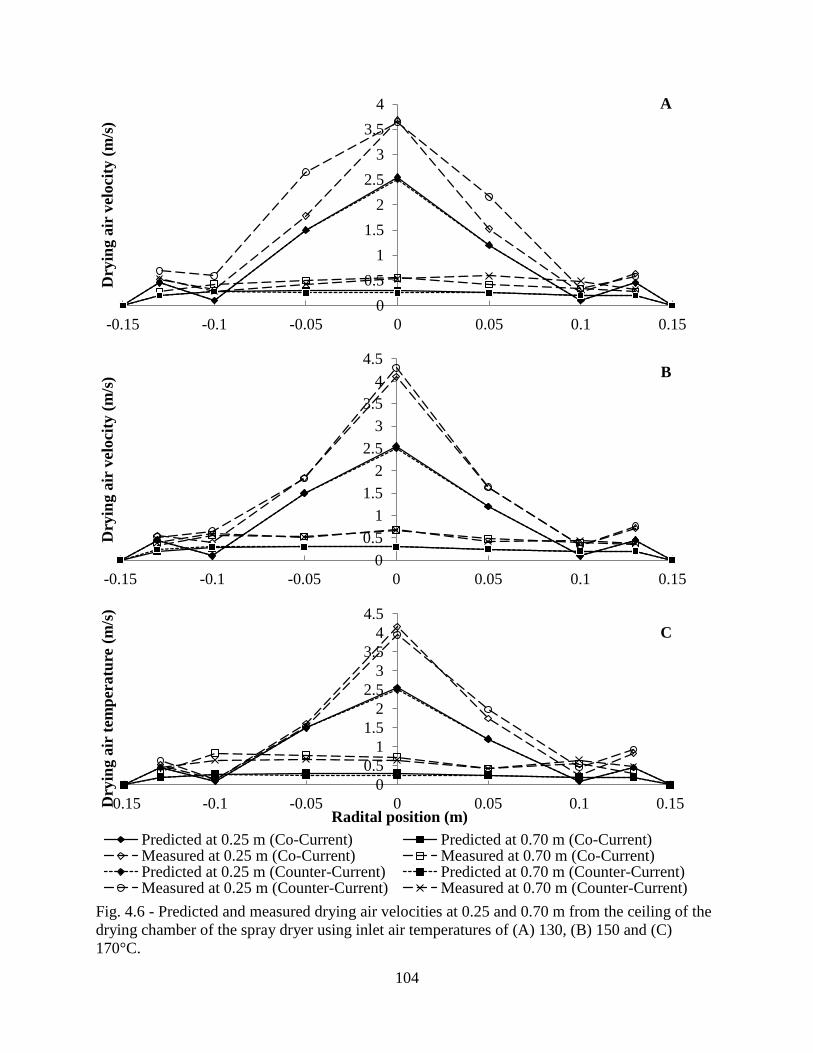
104
Fig. 4.6 - Predicted and measured drying air velocities at 0.25 and 0.70 m from the ceiling of the
drying chamber of the spray dryer using inlet air temperatures of (A) 130, (B) 150 and (C)
170°C.
0
0.5
1
1.5
2
2.5
3
3.5
4
-0.15 -0.1 -0.05 0 0.05 0.1 0.15
Dry
ing a
ir v
eloci
ty (
m/s
)
0
0.5
1
1.5
2
2.5
3
3.5
4
4.5
-0.15 -0.1 -0.05 0 0.05 0.1 0.15
Dry
ing a
ir v
eloci
ty (
m/s
)
0
0.5
1
1.5
2
2.5
3
3.5
4
4.5
-0.15 -0.1 -0.05 0 0.05 0.1 0.15Dry
ing a
ir t
emp
eratu
re (
m/s
)
Radital position (m)
Predicted at 0.25 m (Co-Current) Predicted at 0.70 m (Co-Current)Measured at 0.25 m (Co-Current) Measured at 0.70 m (Co-Current)Predicted at 0.25 m (Counter-Current) Predicted at 0.70 m (Counter-Current)Measured at 0.25 m (Counter-Current) Measured at 0.70 m (Counter-Current)
A
B
C
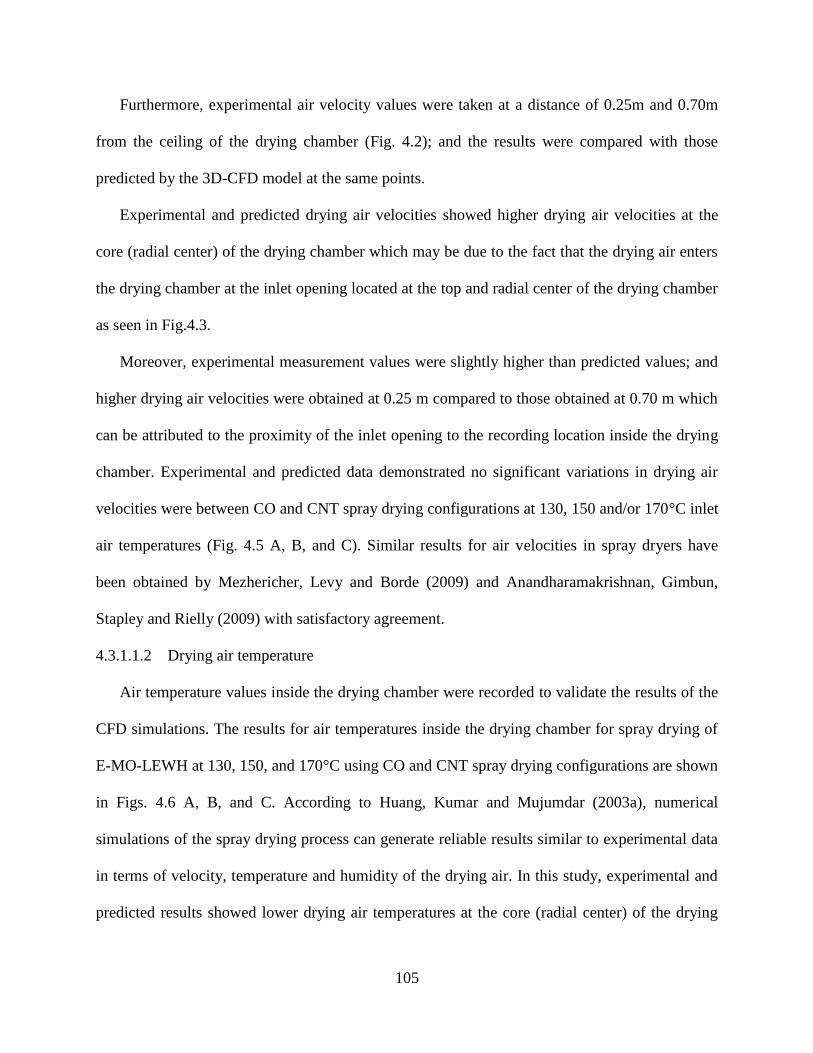
105
Furthermore, experimental air velocity values were taken at a distance of 0.25m and 0.70m
from the ceiling of the drying chamber (Fig. 4.2); and the results were compared with those
predicted by the 3D-CFD model at the same points.
Experimental and predicted drying air velocities showed higher drying air velocities at the
core (radial center) of the drying chamber which may be due to the fact that the drying air enters
the drying chamber at the inlet opening located at the top and radial center of the drying chamber
as seen in Fig.4.3.
Moreover, experimental measurement values were slightly higher than predicted values; and
higher drying air velocities were obtained at 0.25 m compared to those obtained at 0.70 m which
can be attributed to the proximity of the inlet opening to the recording location inside the drying
chamber. Experimental and predicted data demonstrated no significant variations in drying air
velocities were between CO and CNT spray drying configurations at 130, 150 and/or 170°C inlet
air temperatures (Fig. 4.5 A, B, and C). Similar results for air velocities in spray dryers have
been obtained by Mezhericher, Levy and Borde (2009) and Anandharamakrishnan, Gimbun,
Stapley and Rielly (2009) with satisfactory agreement.
4.3.1.1.2 Drying air temperature
Air temperature values inside the drying chamber were recorded to validate the results of the
CFD simulations. The results for air temperatures inside the drying chamber for spray drying of
E-MO-LEWH at 130, 150, and 170°C using CO and CNT spray drying configurations are shown
in Figs. 4.6 A, B, and C. According to Huang, Kumar and Mujumdar (2003a), numerical
simulations of the spray drying process can generate reliable results similar to experimental data
in terms of velocity, temperature and humidity of the drying air. In this study, experimental and
predicted results showed lower drying air temperatures at the core (radial center) of the drying
106
chamber for measurements taken at 0.70m than those recorded at 0.25m. Furthermore, greater
drops in air temperature values were recorded at 0.25 m for CO compared to those of CNT spray
drying. In contrast, greater drops in air temperature values were recorded at 0.70 m for CNT than
for CO spray drying. This effect can be explained by the location of the nozzle inside the drying
chamber during CO and CNT spray drying configurations. During spray drying, the feed is
directly sprayed into the drying chamber either from the top (CO) or from the bottom (CNT); this
produces high heat and mass transfer rates in the nozzle zone due to relatively high velocities
between the hot drying air and the feed droplets with large temperature driving forces (Huang,
Kumar & Mujumdar, 2003a). Our results are in good agreement with those reported by Huang,
Kumar and Mujumdar (2003b) and Birchal, Huang, Mujumdar and Passos (2006) for CO spray
drying configurations.
According to Mezhericher, Levy and Borde (2009) experimental data is the result of time-
averaged values of measurements done with some accuracy; however, variations up to 70%
between the predicted and experimental data can be obtained.
4.3.1.2 Simulation results
Results for predicted flow patterns, temperature, velocities of the drying air are presented in
this section. Also, predicted results for particle histories are discussed and compared against
experimental results. For the 3D-CFD simulations, two parameters were tracked during the
numerical iteration: residuals and outlet velocity.
The criteria for convergence were established based on the results for the residuals. Feed
droplets were introduced into the drying chamber after the outlet reached quasi-steady-state
conditions (at 200 iterations). This approach allowed reaching convergence in the simulations
which was achieved after 800 iterations.
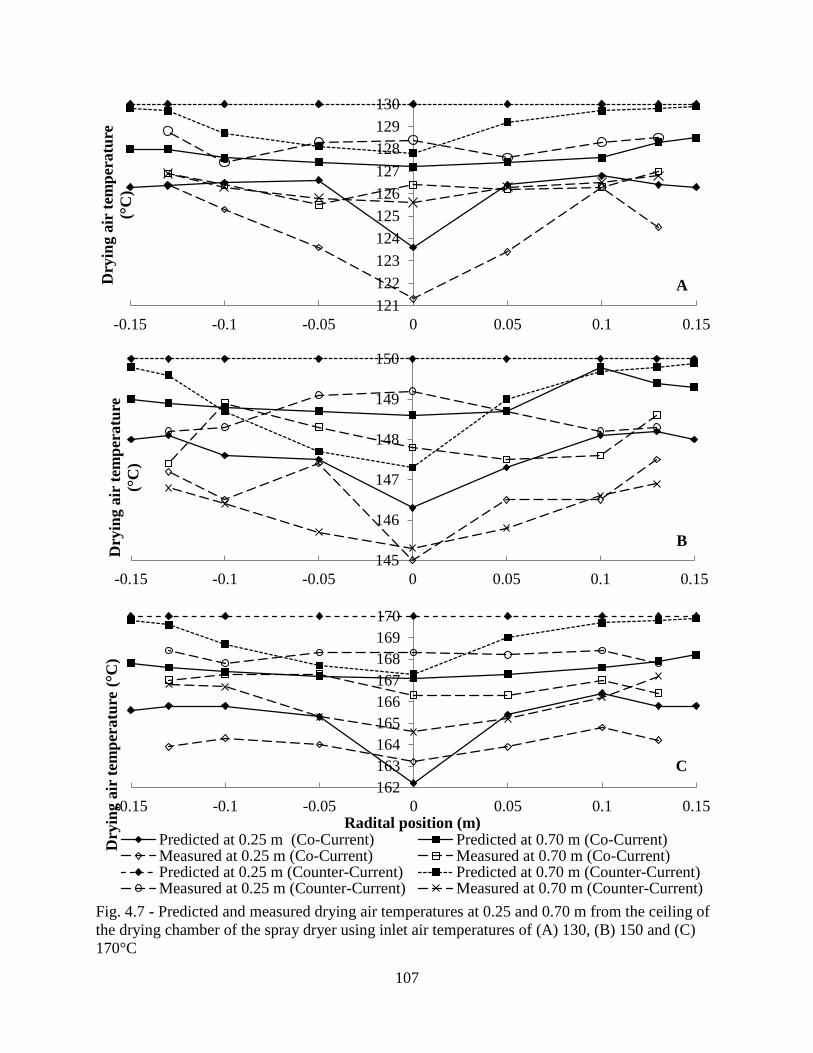
107
Fig. 4.7 - Predicted and measured drying air temperatures at 0.25 and 0.70 m from the ceiling of
the drying chamber of the spray dryer using inlet air temperatures of (A) 130, (B) 150 and (C)
170°C
121
122
123
124
125
126
127
128
129
130
-0.15 -0.1 -0.05 0 0.05 0.1 0.15
Dry
ing a
ir t
emp
eratu
re
(°C
)
145
146
147
148
149
150
-0.15 -0.1 -0.05 0 0.05 0.1 0.15
Dry
ing a
ir t
emp
eratu
re
(°C
)
162
163
164
165
166
167
168
169
170
-0.15 -0.1 -0.05 0 0.05 0.1 0.15
Dry
ing a
ir t
emp
eratu
re (°C
)
Radital position (m) Predicted at 0.25 m (Co-Current) Predicted at 0.70 m (Co-Current)Measured at 0.25 m (Co-Current) Measured at 0.70 m (Co-Current)Predicted at 0.25 m (Counter-Current) Predicted at 0.70 m (Counter-Current)Measured at 0.25 m (Counter-Current) Measured at 0.70 m (Counter-Current)
A
B
C
108
4.3.1.2.1 Drying air flow pattern
The drying air flow patterns inside the drying chamber during spray drying are shown in
Figs. 4.7, 4.8, and 4.9 for CO and CNT spray drying. It can be observed that the drying air flow
patterns are similar for both CO and CNT spray drying configurations.
According to the results obtained by the 3D-CFD model, no air recirculation occurs inside
the drying chamber at all of the tested conditions, this effect is desirable because air recirculation
inside the drying chamber increases RT and thermal degradation of bioactives. Additionally, no
reverse air flows are identified across the drying chamber during CO and CNT spray drying
configurations. The results suggested that neither the inlet air temperatures nor the feed rate (data
not shown) affected the drying air flow patterns inside the drying chamber.
Using the 3D-CFD simulations, it was possible to predict the asymmetric drying air flow
patterns inside the drying chamber. Drying air flow patterns are affected by the drying chamber
design and 3D-CFD simulations can effectively predict flow patterns of the drying air using an
adequate turbulence model (Kuriakose & Anandharamakrishnan, 2010). Several studies have
previously reported a precise prediction of the flow pattern of the drying air using CFD
(Langrish, Williams & Fletcher, 2004; Mezhericher, Levy & Borde, 2009; Oakley & Bahu,
1993).
In accordance with Huang, Kumar and Mujumdar (2003a), the k - ɛ turbulent model is a
suitable model to simulate the air flow inside the drying chamber because there is not high
swirling flow inside of it. Furthermore, the realizable k - ɛ turbulent model satisfies certain
mathematical constraints on the normal stresses which are consistent with the physics of
turbulent flows. This model provides better results for predicting air flow patterns under strong
pressure gradients, separation and recirculation (Kuriakose & Anandharamakrishnan, 2010).
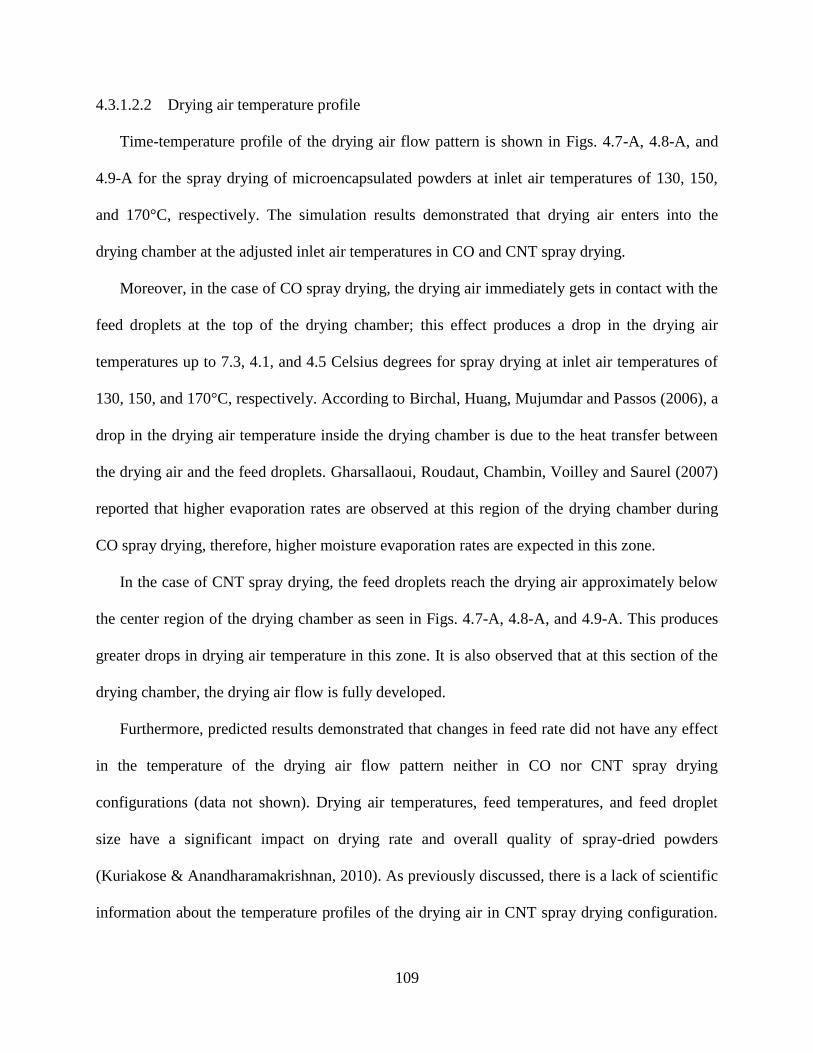
109
4.3.1.2.2 Drying air temperature profile
Time-temperature profile of the drying air flow pattern is shown in Figs. 4.7-A, 4.8-A, and
4.9-A for the spray drying of microencapsulated powders at inlet air temperatures of 130, 150,
and 170°C, respectively. The simulation results demonstrated that drying air enters into the
drying chamber at the adjusted inlet air temperatures in CO and CNT spray drying.
Moreover, in the case of CO spray drying, the drying air immediately gets in contact with the
feed droplets at the top of the drying chamber; this effect produces a drop in the drying air
temperatures up to 7.3, 4.1, and 4.5 Celsius degrees for spray drying at inlet air temperatures of
130, 150, and 170°C, respectively. According to Birchal, Huang, Mujumdar and Passos (2006), a
drop in the drying air temperature inside the drying chamber is due to the heat transfer between
the drying air and the feed droplets. Gharsallaoui, Roudaut, Chambin, Voilley and Saurel (2007)
reported that higher evaporation rates are observed at this region of the drying chamber during
CO spray drying, therefore, higher moisture evaporation rates are expected in this zone.
In the case of CNT spray drying, the feed droplets reach the drying air approximately below
the center region of the drying chamber as seen in Figs. 4.7-A, 4.8-A, and 4.9-A. This produces
greater drops in drying air temperature in this zone. It is also observed that at this section of the
drying chamber, the drying air flow is fully developed.
Furthermore, predicted results demonstrated that changes in feed rate did not have any effect
in the temperature of the drying air flow pattern neither in CO nor CNT spray drying
configurations (data not shown). Drying air temperatures, feed temperatures, and feed droplet
size have a significant impact on drying rate and overall quality of spray-dried powders
(Kuriakose & Anandharamakrishnan, 2010). As previously discussed, there is a lack of scientific
information about the temperature profiles of the drying air in CNT spray drying configuration.
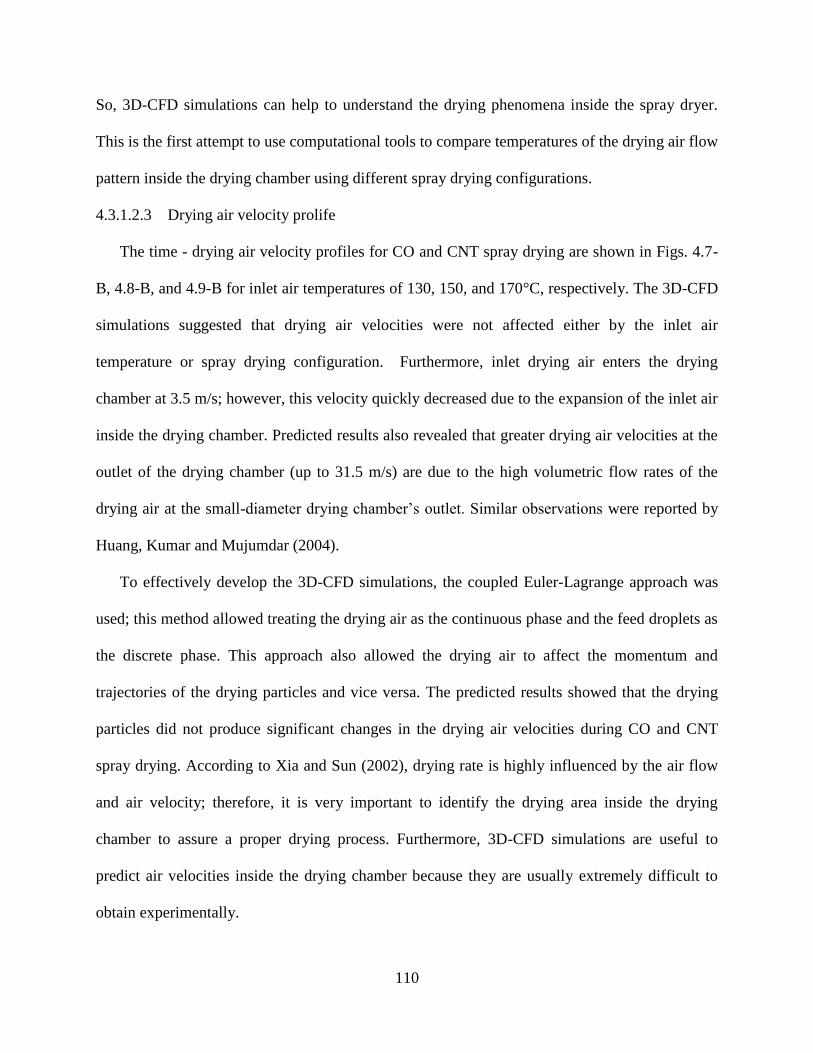
110
So, 3D-CFD simulations can help to understand the drying phenomena inside the spray dryer.
This is the first attempt to use computational tools to compare temperatures of the drying air flow
pattern inside the drying chamber using different spray drying configurations.
4.3.1.2.3 Drying air velocity prolife
The time - drying air velocity profiles for CO and CNT spray drying are shown in Figs. 4.7-
B, 4.8-B, and 4.9-B for inlet air temperatures of 130, 150, and 170°C, respectively. The 3D-CFD
simulations suggested that drying air velocities were not affected either by the inlet air
temperature or spray drying configuration. Furthermore, inlet drying air enters the drying
chamber at 3.5 m/s; however, this velocity quickly decreased due to the expansion of the inlet air
inside the drying chamber. Predicted results also revealed that greater drying air velocities at the
outlet of the drying chamber (up to 31.5 m/s) are due to the high volumetric flow rates of the
drying air at the small-diameter drying chamber’s outlet. Similar observations were reported by
Huang, Kumar and Mujumdar (2004).
To effectively develop the 3D-CFD simulations, the coupled Euler-Lagrange approach was
used; this method allowed treating the drying air as the continuous phase and the feed droplets as
the discrete phase. This approach also allowed the drying air to affect the momentum and
trajectories of the drying particles and vice versa. The predicted results showed that the drying
particles did not produce significant changes in the drying air velocities during CO and CNT
spray drying. According to Xia and Sun (2002), drying rate is highly influenced by the air flow
and air velocity; therefore, it is very important to identify the drying area inside the drying
chamber to assure a proper drying process. Furthermore, 3D-CFD simulations are useful to
predict air velocities inside the drying chamber because they are usually extremely difficult to
obtain experimentally.
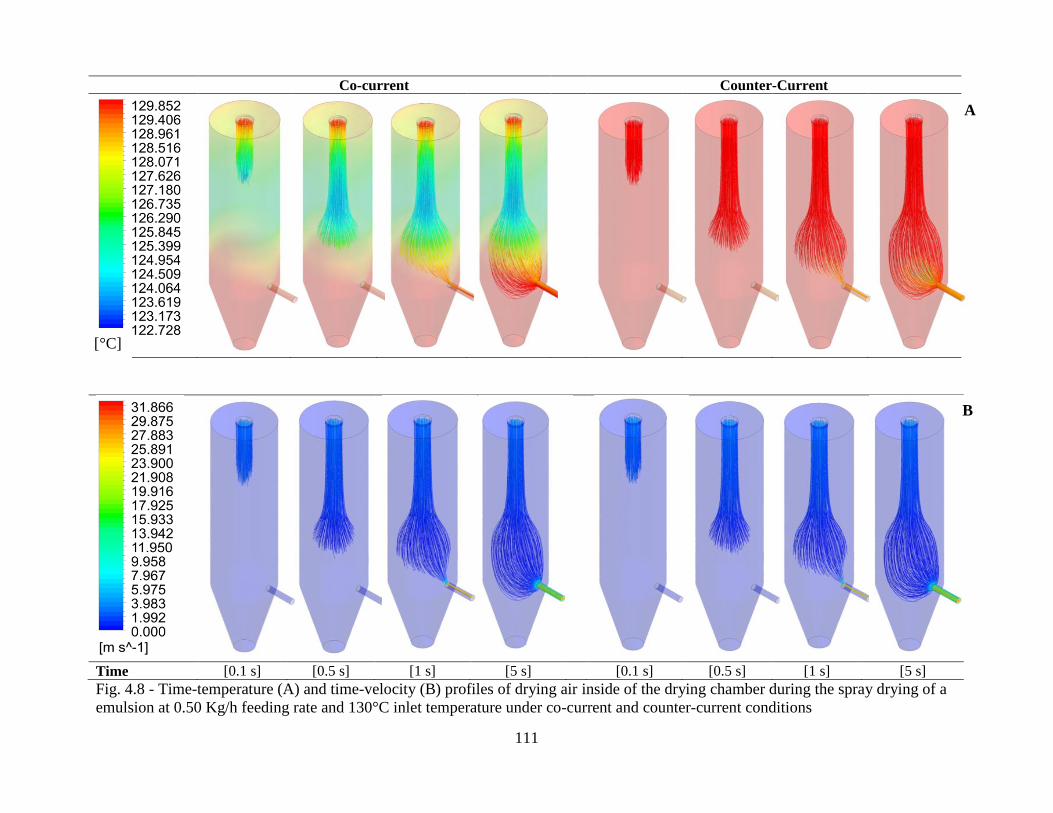
111
Time [0.1 s] [0.5 s] [1 s] [5 s] [0.1 s] [0.5 s] [1 s] [5 s]
Fig. 4.8 - Time-temperature (A) and time-velocity (B) profiles of drying air inside of the drying chamber during the spray drying of a
emulsion at 0.50 Kg/h feeding rate and 130°C inlet temperature under co-current and counter-current conditions
Co-current Counter-Current
[°C]
A
B
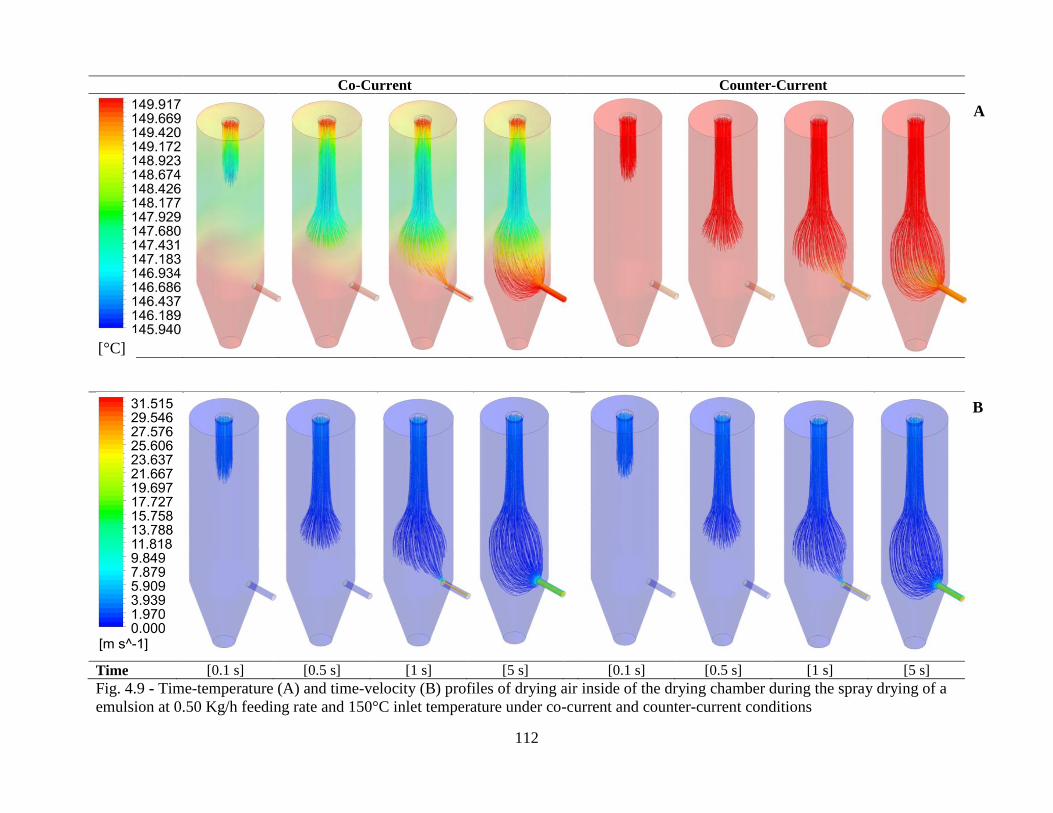
112
Co-Current Counter-Current
Time [0.1 s] [0.5 s] [1 s] [5 s] [0.1 s] [0.5 s] [1 s] [5 s]
Fig. 4.9 - Time-temperature (A) and time-velocity (B) profiles of drying air inside of the drying chamber during the spray drying of a
emulsion at 0.50 Kg/h feeding rate and 150°C inlet temperature under co-current and counter-current conditions
[°C]
[°C]
B
A
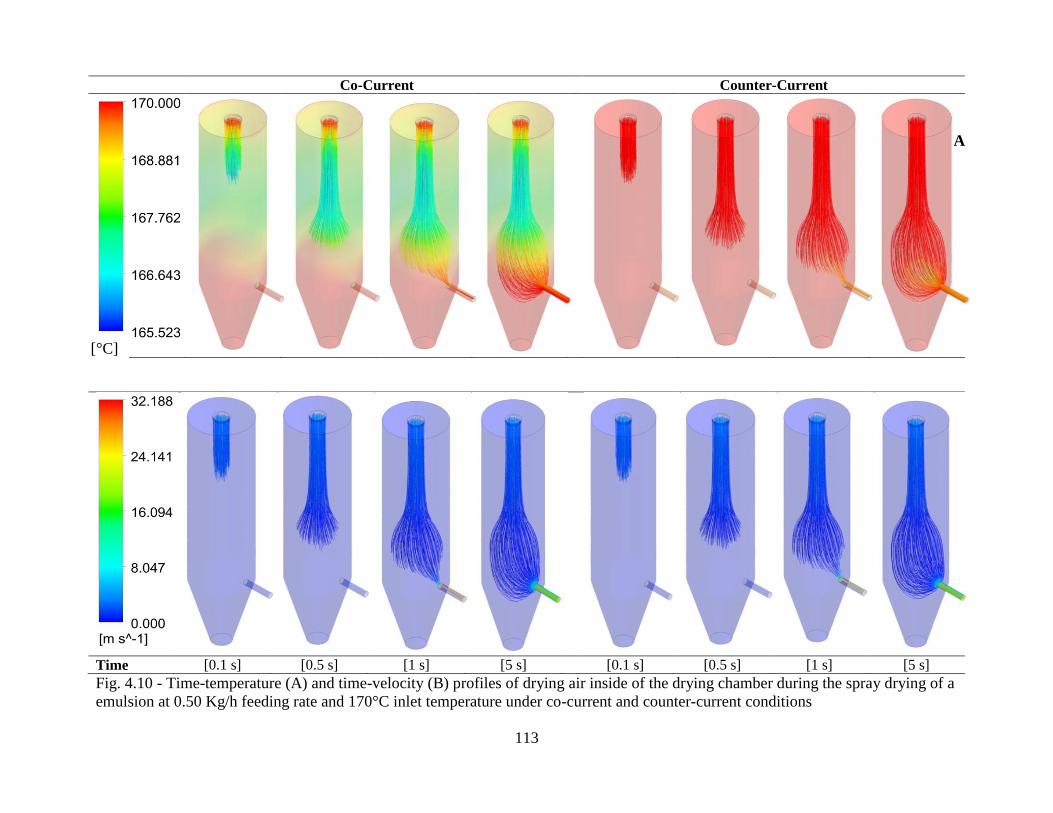
113
Co-Current Counter-Current
Time [0.1 s] [0.5 s] [1 s] [5 s] [0.1 s] [0.5 s] [1 s] [5 s]
Fig. 4.10 - Time-temperature (A) and time-velocity (B) profiles of drying air inside of the drying chamber during the spray drying of a
emulsion at 0.50 Kg/h feeding rate and 170°C inlet temperature under co-current and counter-current conditions
[°C]
A
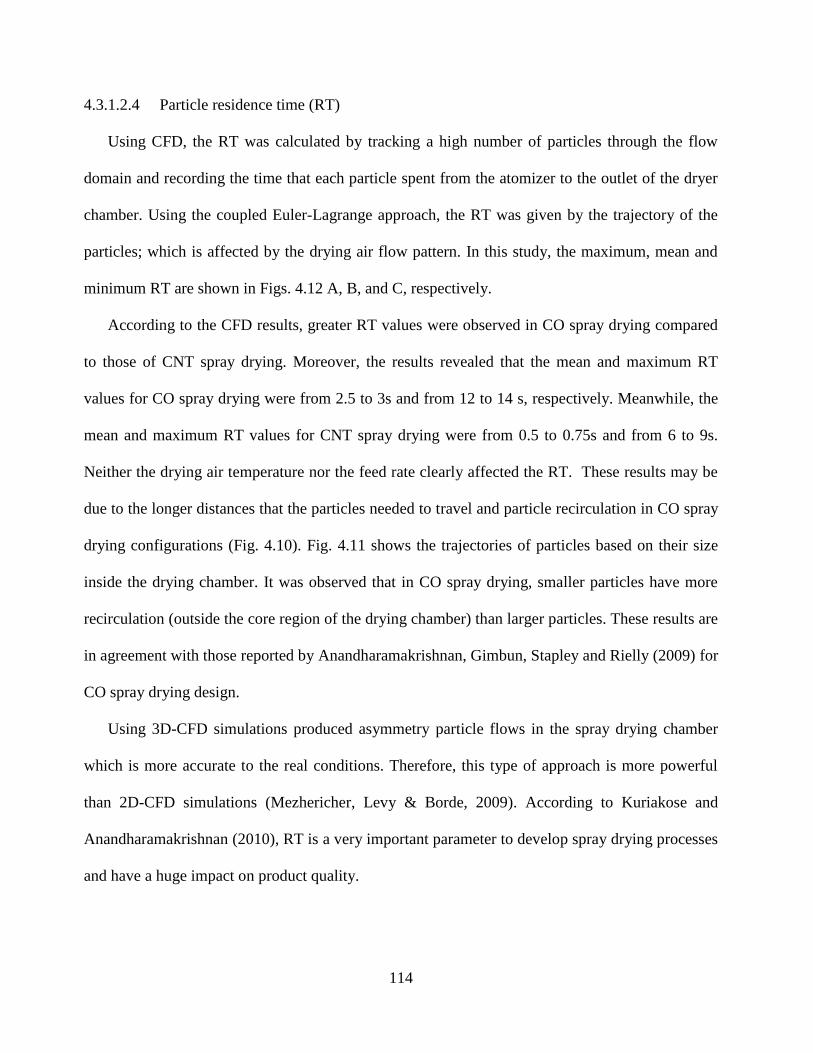
114
4.3.1.2.4 Particle residence time (RT)
Using CFD, the RT was calculated by tracking a high number of particles through the flow
domain and recording the time that each particle spent from the atomizer to the outlet of the dryer
chamber. Using the coupled Euler-Lagrange approach, the RT was given by the trajectory of the
particles; which is affected by the drying air flow pattern. In this study, the maximum, mean and
minimum RT are shown in Figs. 4.12 A, B, and C, respectively.
According to the CFD results, greater RT values were observed in CO spray drying compared
to those of CNT spray drying. Moreover, the results revealed that the mean and maximum RT
values for CO spray drying were from 2.5 to 3s and from 12 to 14 s, respectively. Meanwhile, the
mean and maximum RT values for CNT spray drying were from 0.5 to 0.75s and from 6 to 9s.
Neither the drying air temperature nor the feed rate clearly affected the RT. These results may be
due to the longer distances that the particles needed to travel and particle recirculation in CO spray
drying configurations (Fig. 4.10). Fig. 4.11 shows the trajectories of particles based on their size
inside the drying chamber. It was observed that in CO spray drying, smaller particles have more
recirculation (outside the core region of the drying chamber) than larger particles. These results are
in agreement with those reported by Anandharamakrishnan, Gimbun, Stapley and Rielly (2009) for
CO spray drying design.
Using 3D-CFD simulations produced asymmetry particle flows in the spray drying chamber
which is more accurate to the real conditions. Therefore, this type of approach is more powerful
than 2D-CFD simulations (Mezhericher, Levy & Borde, 2009). According to Kuriakose and
Anandharamakrishnan (2010), RT is a very important parameter to develop spray drying processes
and have a huge impact on product quality.
[°C]
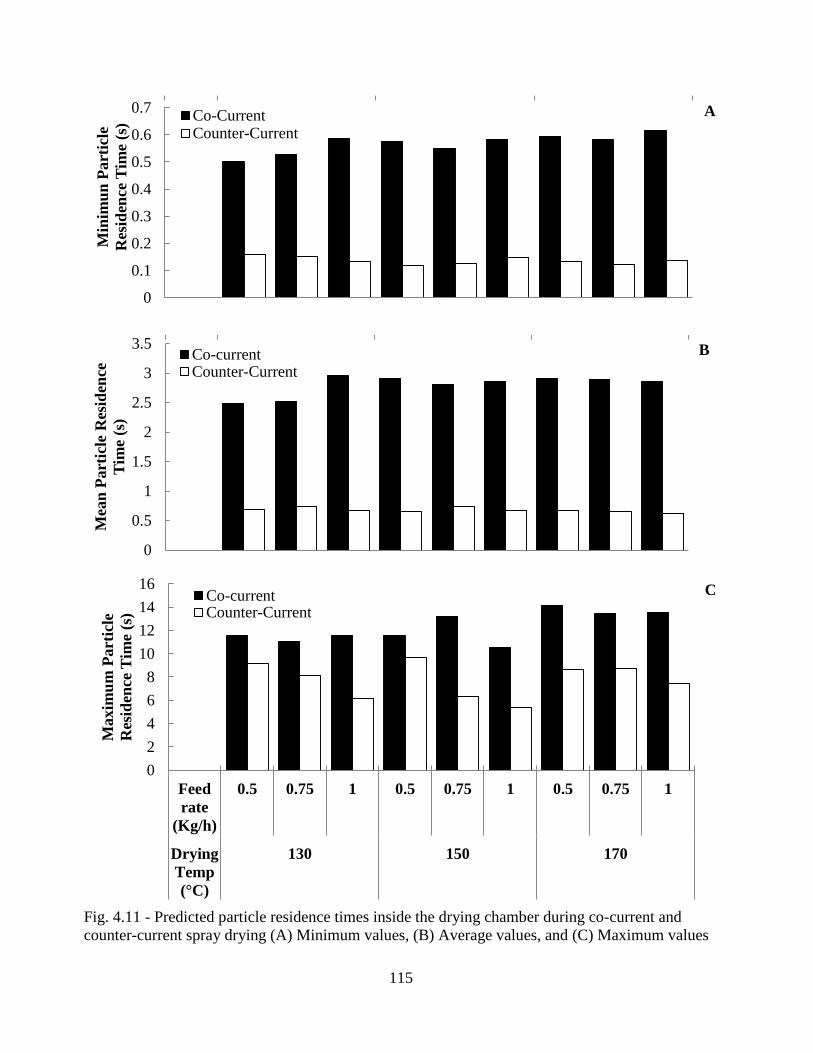
115
Fig. 4.11 - Predicted particle residence times inside the drying chamber during co-current and
counter-current spray drying (A) Minimum values, (B) Average values, and (C) Maximum values
0
0.1
0.2
0.3
0.4
0.5
0.6
0.7M
inim
un
Part
icle
Res
iden
ce T
ime
(s)
Co-CurrentCounter-Current
0
0.5
1
1.5
2
2.5
3
3.5
Mea
n P
art
icle
Res
iden
ce
Tim
e (s
)
Co-currentCounter-Current
0
2
4
6
8
10
12
14
16
Feed
rate
(Kg/h)
0.5 0.75 1 0.5 0.75 1 0.5 0.75 1
Drying
Temp
(°C)
130 150 170
Maxim
um
Part
icle
Res
iden
ce T
ime
(s)
Co-currentCounter-Current
A
B
C
116
Co-Current
Time [0.1 s] [0.5 s] [1 s] [5 s]
Counter-Current
Time [0.1 s] [0.5 s] [1 s] [5 s]
Fig. 4.12 - Simulated particle trajectories based on their diameter (m) inside the drying chamber
in co-current and counter-current spray drying configurations at 130°C inlet air temperature.
4.3.1.2.5 Particle temperature
Particle -temperature profiles based on particle trajectories during spray drying is shown in
Fig. 4.12. It is observed that powder particles quickly reached drying air temperature in both CO
and CNT spray drying configurations. Combining these results and those previously discussed
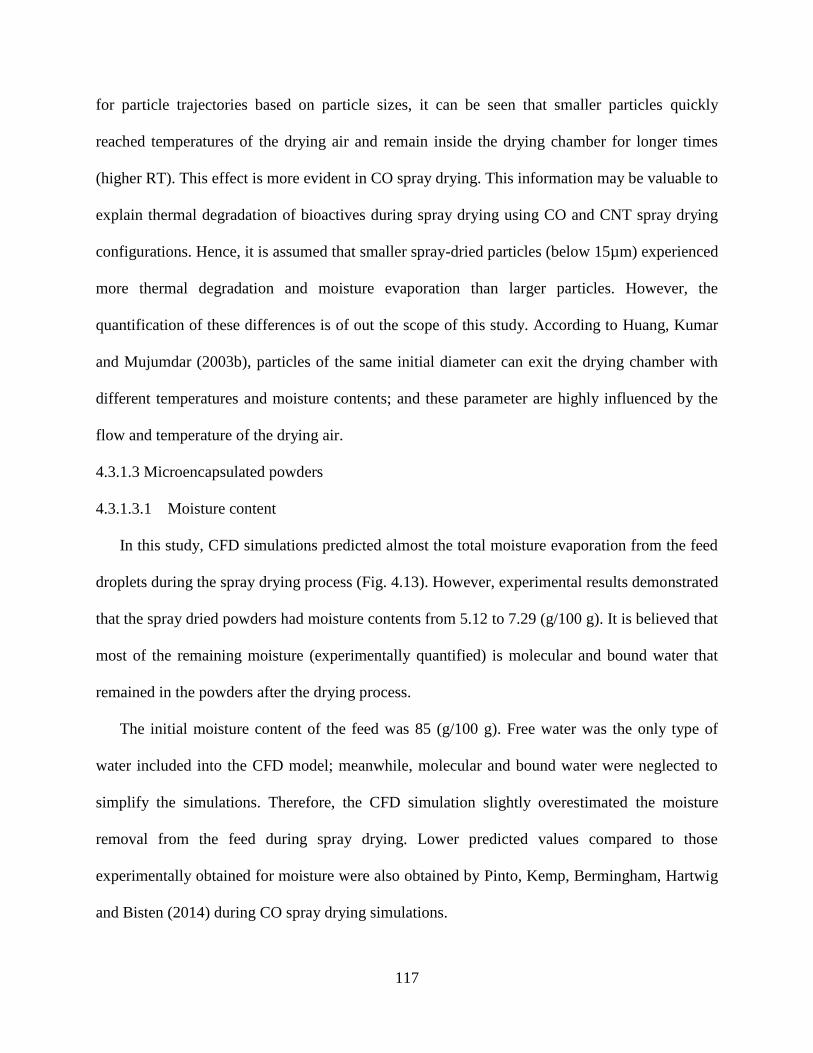
117
for particle trajectories based on particle sizes, it can be seen that smaller particles quickly
reached temperatures of the drying air and remain inside the drying chamber for longer times
(higher RT). This effect is more evident in CO spray drying. This information may be valuable to
explain thermal degradation of bioactives during spray drying using CO and CNT spray drying
configurations. Hence, it is assumed that smaller spray-dried particles (below 15µm) experienced
more thermal degradation and moisture evaporation than larger particles. However, the
quantification of these differences is of out the scope of this study. According to Huang, Kumar
and Mujumdar (2003b), particles of the same initial diameter can exit the drying chamber with
different temperatures and moisture contents; and these parameter are highly influenced by the
flow and temperature of the drying air.
4.3.1.3 Microencapsulated powders
4.3.1.3.1 Moisture content
In this study, CFD simulations predicted almost the total moisture evaporation from the feed
droplets during the spray drying process (Fig. 4.13). However, experimental results demonstrated
that the spray dried powders had moisture contents from 5.12 to 7.29 (g/100 g). It is believed that
most of the remaining moisture (experimentally quantified) is molecular and bound water that
remained in the powders after the drying process.
The initial moisture content of the feed was 85 (g/100 g). Free water was the only type of
water included into the CFD model; meanwhile, molecular and bound water were neglected to
simplify the simulations. Therefore, the CFD simulation slightly overestimated the moisture
removal from the feed during spray drying. Lower predicted values compared to those
experimentally obtained for moisture were also obtained by Pinto, Kemp, Bermingham, Hartwig
and Bisten (2014) during CO spray drying simulations.
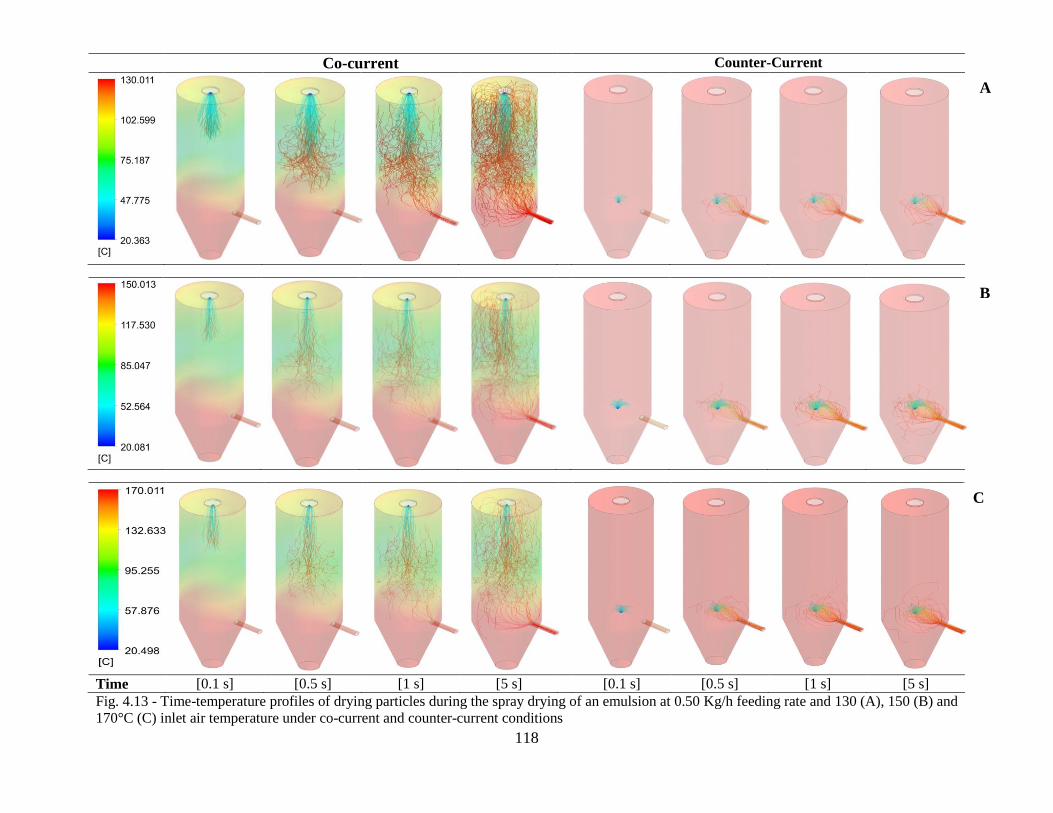
118
Co-current Counter-Current
Time [0.1 s] [0.5 s] [1 s] [5 s] [0.1 s] [0.5 s] [1 s] [5 s]
Fig. 4.13 - Time-temperature profiles of drying particles during the spray drying of an emulsion at 0.50 Kg/h feeding rate and 130 (A), 150 (B) and
170°C (C) inlet air temperature under co-current and counter-current conditions
A
B
C
119
Moreover, the experimental data demonstrated that moisture content was significantly
(p<0.05) affected by the inlet air temperature, spray drying configuration and interaction of both
effects.
Therefore, powders produced in CO spray drying had significantly (p<0.05) lower moisture
content than the powders produced in CNT spray drying (at 170°C inlet air temperatures).The
feed rate did not have a significant (P<0.05) effect on the final moisture content of the powders
(Fig. 4.13).
CFD simulations demonstrated that most of the moisture evaporation occurs immediately
after the feed droplets are sprayed inside the drying chamber (Fig. 4.14). Also, it was seen that
higher inlet air temperatures increases evaporation rates in CO spray drying (Figs. 4.14, A, B,
and C); meanwhile this effect is less evident in counter-current spray drying.
These results are in agreement with those reported by Woo, Daud, Mujumdar, Wu, Meor
Talib and Tasirin (2008). Furthermore, particle recirculation can be observed in co-current spray
drying which increased RT and affected the moisture content of the resulting dried particles.
Besides the atomization conditions, temperature and humidity of the drying air, and moisture
content and temperature of the feed can also affect the final moisture content of spray dried
powders (Pinto, Kemp, Bermingham, Hartwig & Bisten, 2014).
Prediction of moisture evaporation from atomized droplets is extremely difficult due to the
presence of solutes and changes in the morphology of the particles such as crust formation and
shrinkage.
However, 3D-CFD simulations are powerful tools that can produce reliable results for
moisture evaporation in spray drying operations (Woo, Daud, Mujumdar, Wu, Meor Talib &
Tasirin, 2008).
120
Fig. 4.14 - Predicted and experimental moisture content of powders dried at different inlet air
temperatures in co-current and counter-current spray drying configurations. a-f
Means with same
letters are not significantly (P<0.05) different between experimental values.
4.3.1.3.2 Water activity (aw)
Water activity (aw) is an important index to determine food stability, safety, and microbial
growth (Damodaran, Parkin & Fennema, 2008). Experimental results showed that aw were
significantly (P<0.05) affected by inlet air temperature, spray drying configuration and
interaction between these two effects. Hence, inlet air temperatures of 170°C produced powders
with lower aw (Fig. 4.15). Also, powders produced in CO conditions had lower aw compared to
those produced in CNT conditions. These results are in agreement with those obtained for
moisture content. All of the powders had aw values below 0.4. Microbiologically stable foods
have aw less than 0.6 (Quek, Chok & Swedlund, 2007). Jimenez, García and Beristain (2004)
have reported a very good oxidation stability of microencapsulated conjugated linoleic acid at
aw=0.743 for at least 60 days.
abc ab ab
ef ef ef f f f
a a ab ab abc ab
de cde bcd
0
1
2
3
4
5
6
7
8
9
Feed
rate
(Kg/h)
0.5 0.75 1 0.5 0.75 1 0.5 0.75 1
Drying
Temp
(°C)
130 150 170
Co-current (Predicted) Counter-Current (Predicted)
Co-Current (Experimental) Counter-Current (Experimental)
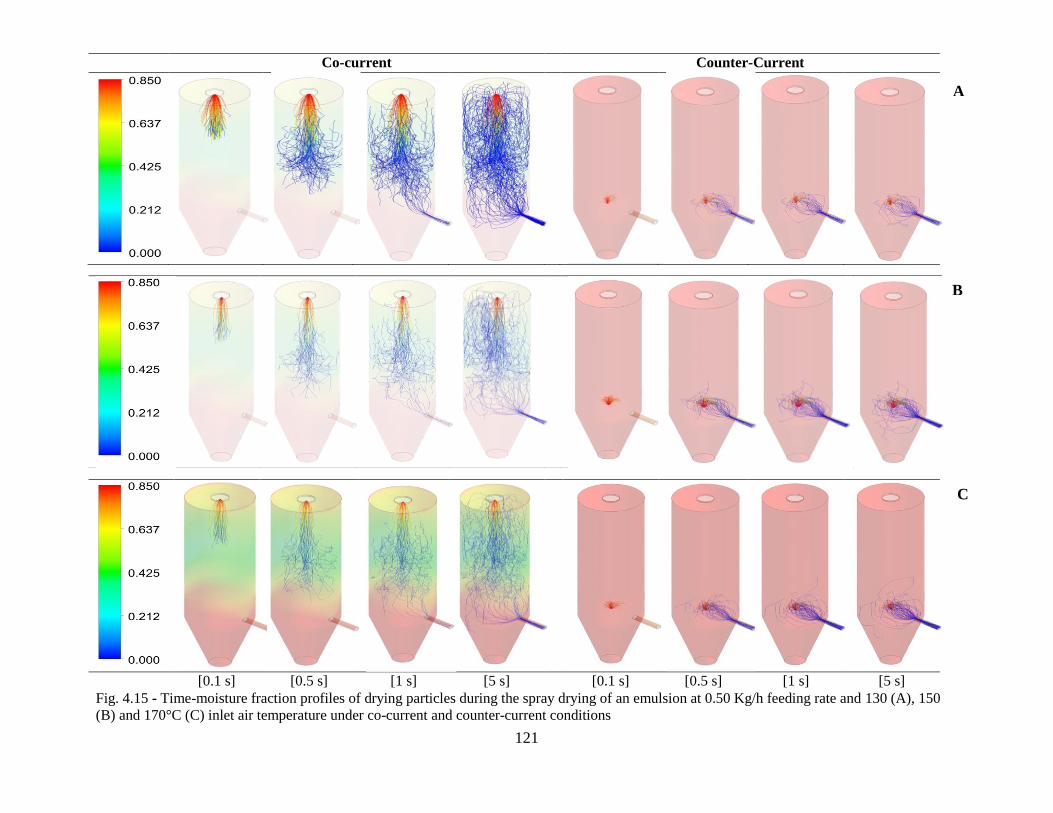
121
Co-current Counter-Current
Fig. 4.15 - Time-moisture fraction profiles of drying particles during the spray drying of an emulsion at 0.50 Kg/h feeding rate and 130 (A), 150
(B) and 170°C (C) inlet air temperature under co-current and counter-current conditions
[0.1 s] [0.5 s] [1 s] [5 s] [0.1 s] [0.5 s] [1 s] [5 s]
A
B
C
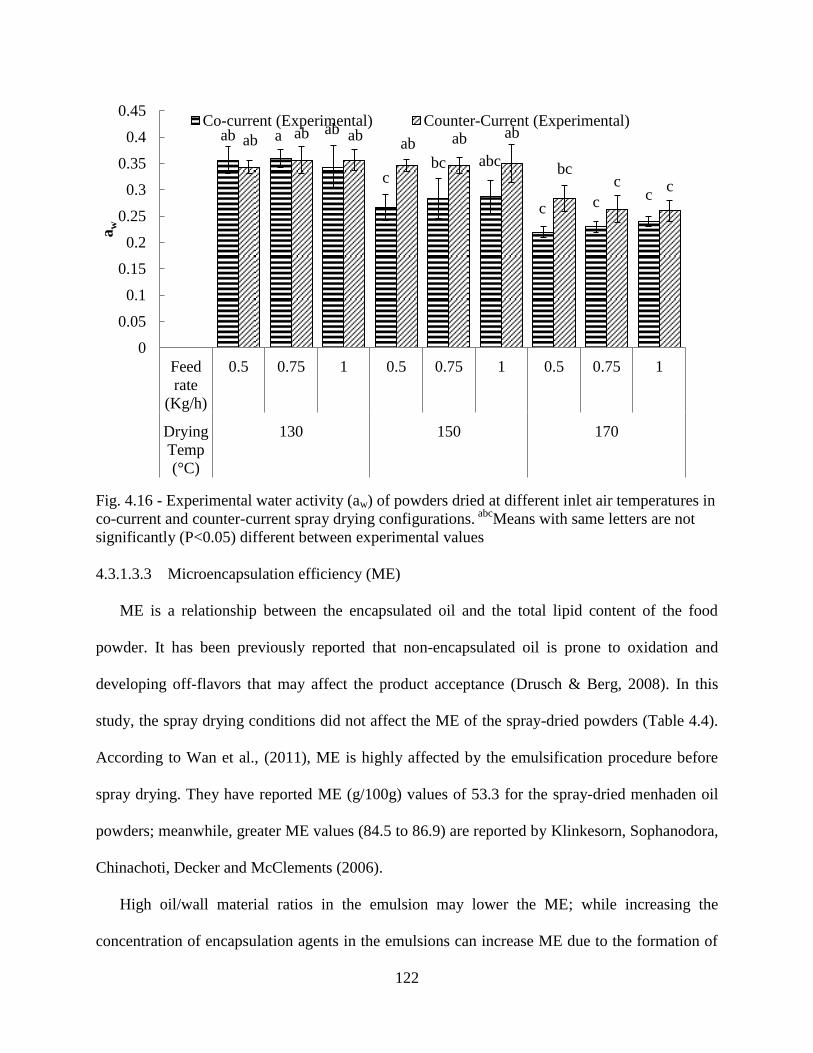
122
Fig. 4.16 - Experimental water activity (aw) of powders dried at different inlet air temperatures in
co-current and counter-current spray drying configurations. abc
Means with same letters are not
significantly (P<0.05) different between experimental values
4.3.1.3.3 Microencapsulation efficiency (ME)
ME is a relationship between the encapsulated oil and the total lipid content of the food
powder. It has been previously reported that non-encapsulated oil is prone to oxidation and
developing off-flavors that may affect the product acceptance (Drusch & Berg, 2008). In this
study, the spray drying conditions did not affect the ME of the spray-dried powders (Table 4.4).
According to Wan et al., (2011), ME is highly affected by the emulsification procedure before
spray drying. They have reported ME (g/100g) values of 53.3 for the spray-dried menhaden oil
powders; meanwhile, greater ME values (84.5 to 86.9) are reported by Klinkesorn, Sophanodora,
Chinachoti, Decker and McClements (2006).
High oil/wall material ratios in the emulsion may lower the ME; while increasing the
concentration of encapsulation agents in the emulsions can increase ME due to the formation of
ab a ab
c bc abc
c c c
ab ab ab ab ab ab
bc c c
0
0.05
0.1
0.15
0.2
0.25
0.3
0.35
0.4
0.45
Feed
rate
(Kg/h)
0.5 0.75 1 0.5 0.75 1 0.5 0.75 1
Drying
Temp
(°C)
130 150 170
aw
Co-current (Experimental) Counter-Current (Experimental)
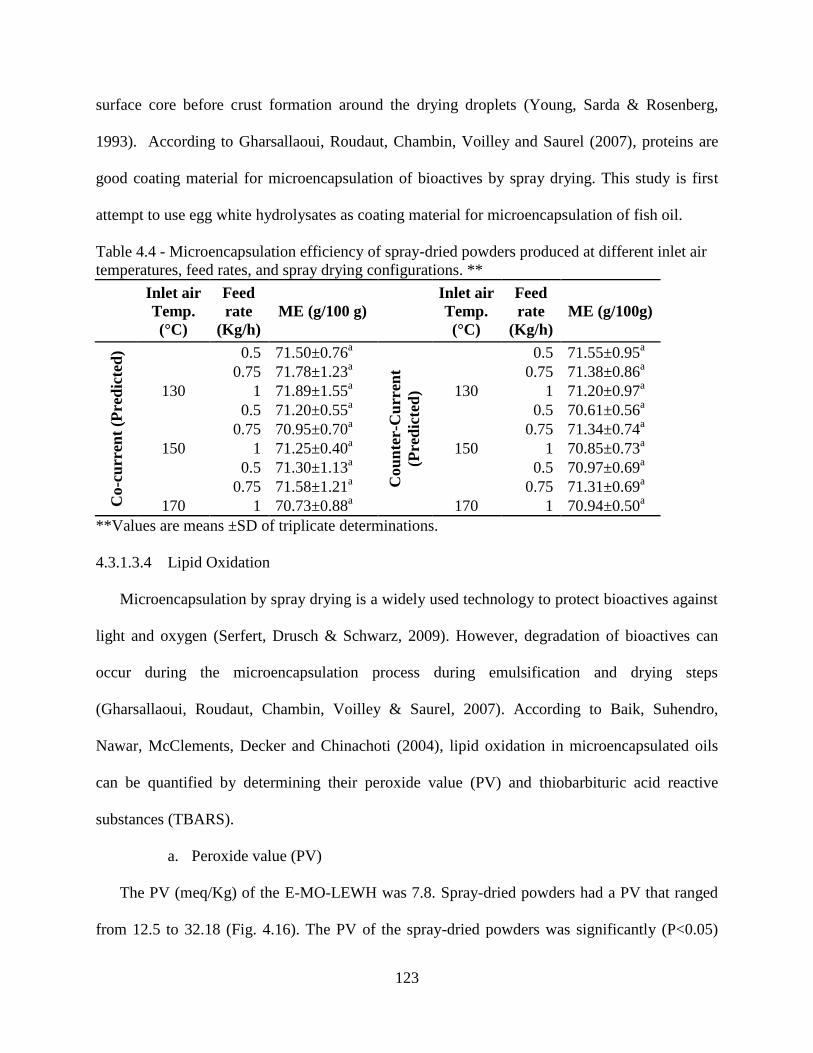
123
surface core before crust formation around the drying droplets (Young, Sarda & Rosenberg,
1993). According to Gharsallaoui, Roudaut, Chambin, Voilley and Saurel (2007), proteins are
good coating material for microencapsulation of bioactives by spray drying. This study is first
attempt to use egg white hydrolysates as coating material for microencapsulation of fish oil.
Table 4.4 - Microencapsulation efficiency of spray-dried powders produced at different inlet air
temperatures, feed rates, and spray drying configurations. **
Inlet air
Temp.
(°C)
Feed
rate
(Kg/h)
ME (g/100 g)
Inlet air
Temp.
(°C)
Feed
rate
(Kg/h)
ME (g/100g)
Co
-cu
rren
t (P
red
icte
d)
130
0.5 71.50±0.76a
Cou
nte
r-C
urr
ent
(Pre
dic
ted
) 130
0.5 71.55±0.95a
0.75 71.78±1.23a 0.75 71.38±0.86
a
1 71.89±1.55a 1 71.20±0.97
a
150
0.5 71.20±0.55a
150
0.5 70.61±0.56a
0.75 70.95±0.70a 0.75 71.34±0.74
a
1 71.25±0.40a 1 70.85±0.73
a
170
0.5 71.30±1.13a
170
0.5 70.97±0.69a
0.75 71.58±1.21a 0.75 71.31±0.69
a
1 70.73±0.88a 1 70.94±0.50
a
**Values are means ±SD of triplicate determinations.
4.3.1.3.4 Lipid Oxidation
Microencapsulation by spray drying is a widely used technology to protect bioactives against
light and oxygen (Serfert, Drusch & Schwarz, 2009). However, degradation of bioactives can
occur during the microencapsulation process during emulsification and drying steps
(Gharsallaoui, Roudaut, Chambin, Voilley & Saurel, 2007). According to Baik, Suhendro,
Nawar, McClements, Decker and Chinachoti (2004), lipid oxidation in microencapsulated oils
can be quantified by determining their peroxide value (PV) and thiobarbituric acid reactive
substances (TBARS).
a. Peroxide value (PV)
The PV (meq/Kg) of the E-MO-LEWH was 7.8. Spray-dried powders had a PV that ranged
from 12.5 to 32.18 (Fig. 4.16). The PV of the spray-dried powders was significantly (P<0.05)
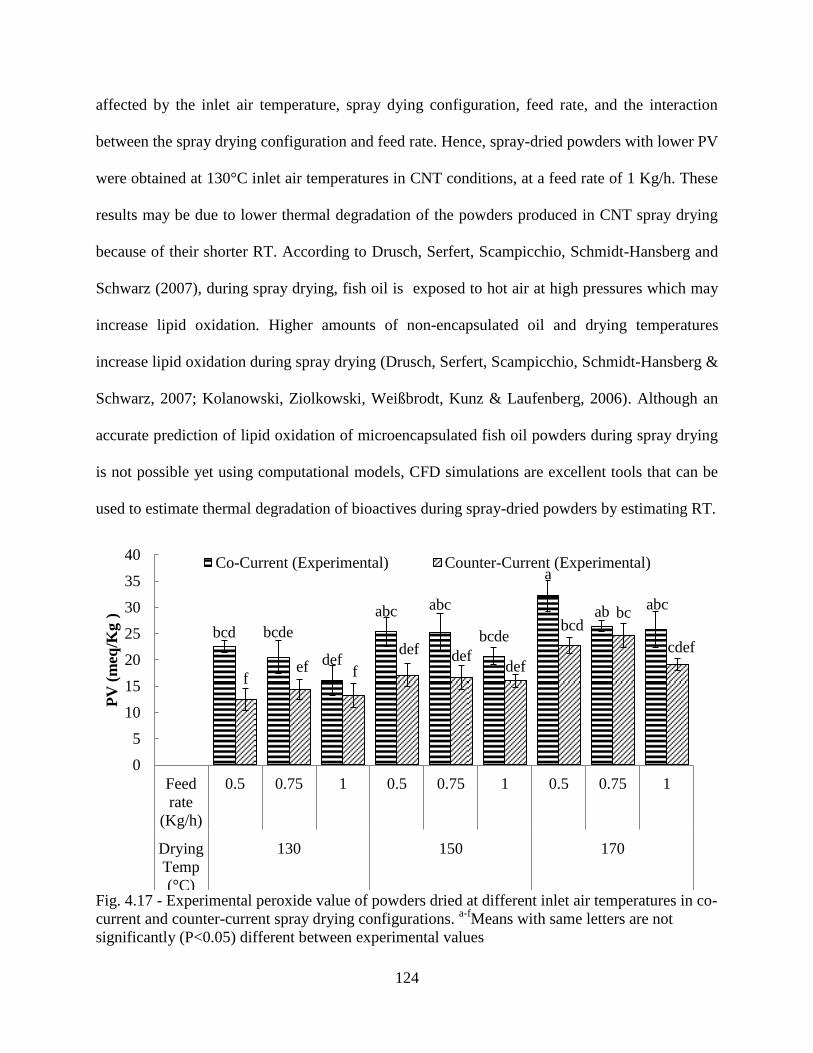
124
affected by the inlet air temperature, spray dying configuration, feed rate, and the interaction
between the spray drying configuration and feed rate. Hence, spray-dried powders with lower PV
were obtained at 130°C inlet air temperatures in CNT conditions, at a feed rate of 1 Kg/h. These
results may be due to lower thermal degradation of the powders produced in CNT spray drying
because of their shorter RT. According to Drusch, Serfert, Scampicchio, Schmidt-Hansberg and
Schwarz (2007), during spray drying, fish oil is exposed to hot air at high pressures which may
increase lipid oxidation. Higher amounts of non-encapsulated oil and drying temperatures
increase lipid oxidation during spray drying (Drusch, Serfert, Scampicchio, Schmidt-Hansberg &
Schwarz, 2007; Kolanowski, Ziolkowski, Weißbrodt, Kunz & Laufenberg, 2006). Although an
accurate prediction of lipid oxidation of microencapsulated fish oil powders during spray drying
is not possible yet using computational models, CFD simulations are excellent tools that can be
used to estimate thermal degradation of bioactives during spray-dried powders by estimating RT.
Fig. 4.17 - Experimental peroxide value of powders dried at different inlet air temperatures in co-
current and counter-current spray drying configurations. a-f
Means with same letters are not
significantly (P<0.05) different between experimental values
bcd bcde
def
abc abc
bcde
a
ab abc
f ef f
def def def
bcd bc
cdef
0
5
10
15
20
25
30
35
40
Feed
rate
(Kg/h)
0.5 0.75 1 0.5 0.75 1 0.5 0.75 1
Drying
Temp
(°C)
130 150 170
PV
(m
eq/K
g )
Co-Current (Experimental) Counter-Current (Experimental)
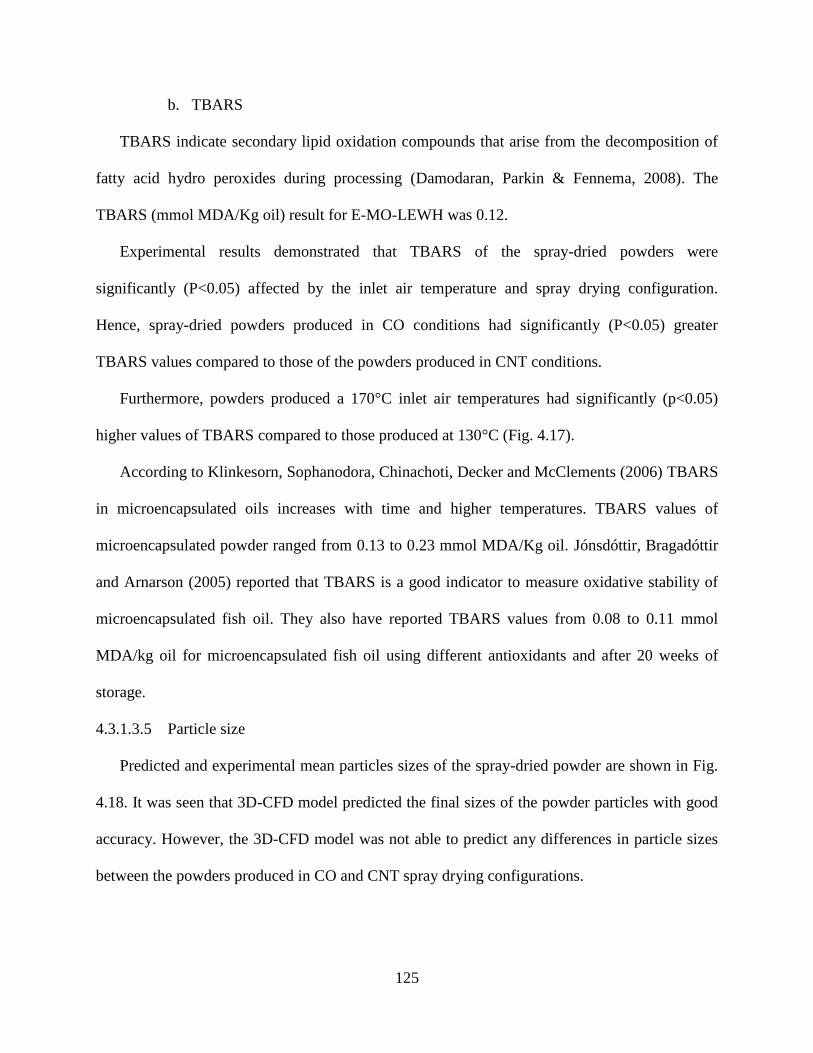
125
b. TBARS
TBARS indicate secondary lipid oxidation compounds that arise from the decomposition of
fatty acid hydro peroxides during processing (Damodaran, Parkin & Fennema, 2008). The
TBARS (mmol MDA/Kg oil) result for E-MO-LEWH was 0.12.
Experimental results demonstrated that TBARS of the spray-dried powders were
significantly (P<0.05) affected by the inlet air temperature and spray drying configuration.
Hence, spray-dried powders produced in CO conditions had significantly (P<0.05) greater
TBARS values compared to those of the powders produced in CNT conditions.
Furthermore, powders produced a 170°C inlet air temperatures had significantly (p<0.05)
higher values of TBARS compared to those produced at 130°C (Fig. 4.17).
According to Klinkesorn, Sophanodora, Chinachoti, Decker and McClements (2006) TBARS
in microencapsulated oils increases with time and higher temperatures. TBARS values of
microencapsulated powder ranged from 0.13 to 0.23 mmol MDA/Kg oil. Jónsdóttir, Bragadóttir
and Arnarson (2005) reported that TBARS is a good indicator to measure oxidative stability of
microencapsulated fish oil. They also have reported TBARS values from 0.08 to 0.11 mmol
MDA/kg oil for microencapsulated fish oil using different antioxidants and after 20 weeks of
storage.
4.3.1.3.5 Particle size
Predicted and experimental mean particles sizes of the spray-dried powder are shown in Fig.
4.18. It was seen that 3D-CFD model predicted the final sizes of the powder particles with good
accuracy. However, the 3D-CFD model was not able to predict any differences in particle sizes
between the powders produced in CO and CNT spray drying configurations.
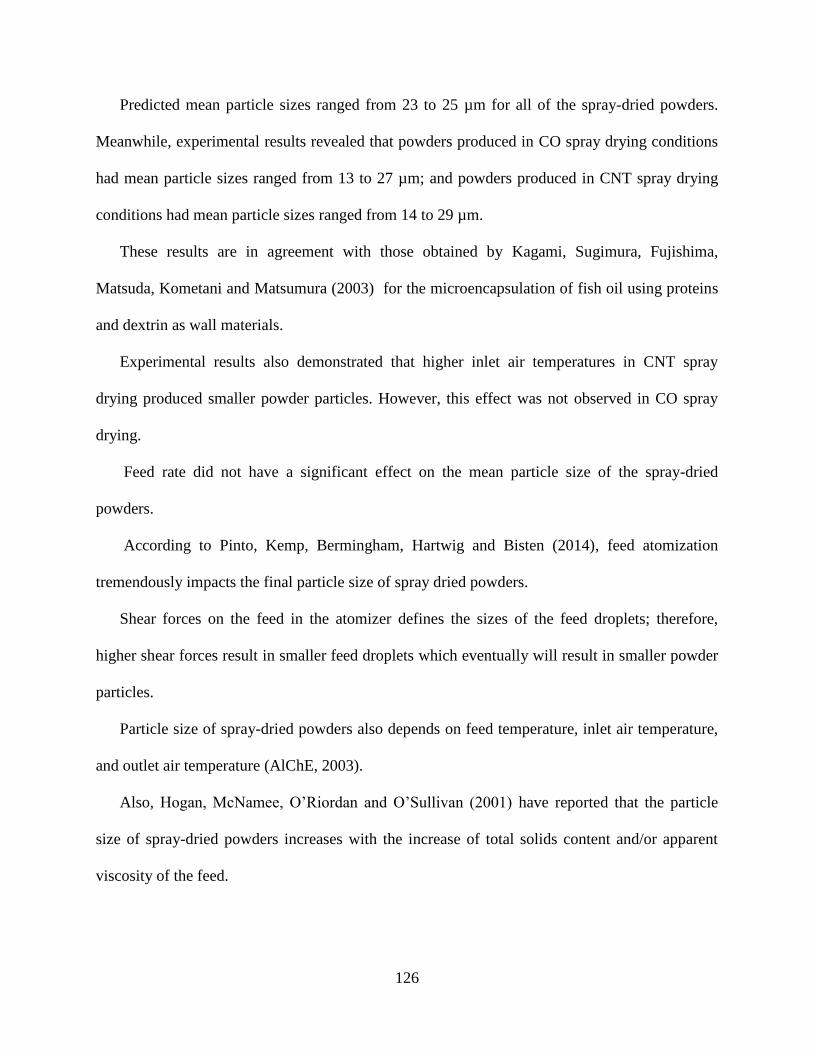
126
Predicted mean particle sizes ranged from 23 to 25 µm for all of the spray-dried powders.
Meanwhile, experimental results revealed that powders produced in CO spray drying conditions
had mean particle sizes ranged from 13 to 27 µm; and powders produced in CNT spray drying
conditions had mean particle sizes ranged from 14 to 29 µm.
These results are in agreement with those obtained by Kagami, Sugimura, Fujishima,
Matsuda, Kometani and Matsumura (2003) for the microencapsulation of fish oil using proteins
and dextrin as wall materials.
Experimental results also demonstrated that higher inlet air temperatures in CNT spray
drying produced smaller powder particles. However, this effect was not observed in CO spray
drying.
Feed rate did not have a significant effect on the mean particle size of the spray-dried
powders.
According to Pinto, Kemp, Bermingham, Hartwig and Bisten (2014), feed atomization
tremendously impacts the final particle size of spray dried powders.
Shear forces on the feed in the atomizer defines the sizes of the feed droplets; therefore,
higher shear forces result in smaller feed droplets which eventually will result in smaller powder
particles.
Particle size of spray-dried powders also depends on feed temperature, inlet air temperature,
and outlet air temperature (AlChE, 2003).
Also, Hogan, McNamee, O’Riordan and O’Sullivan (2001) have reported that the particle
size of spray-dried powders increases with the increase of total solids content and/or apparent
viscosity of the feed.
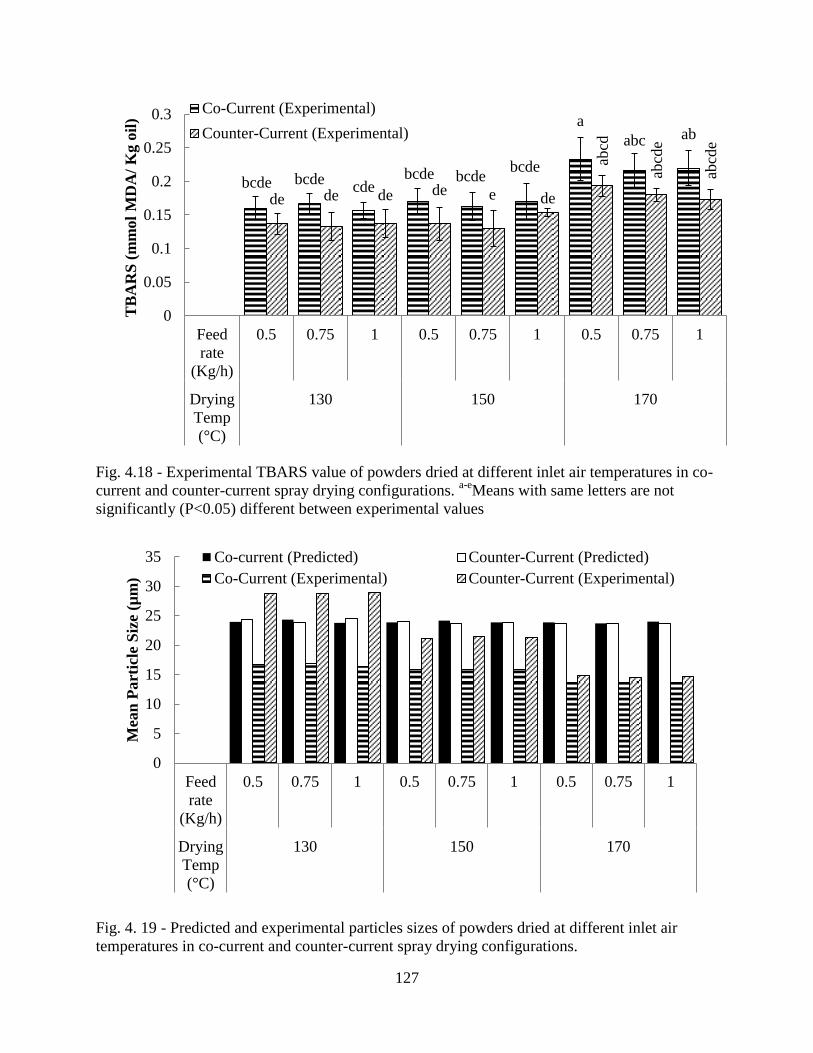
127
Fig. 4.18 - Experimental TBARS value of powders dried at different inlet air temperatures in co-
current and counter-current spray drying configurations. a-e
Means with same letters are not
significantly (P<0.05) different between experimental values
Fig. 4. 19 - Predicted and experimental particles sizes of powders dried at different inlet air
temperatures in co-current and counter-current spray drying configurations.
bcde bcde cde
bcde bcde bcde
a
abc ab
de de de de e de
abcd
abcd
e
abcd
e
0
0.05
0.1
0.15
0.2
0.25
0.3
Feed
rate
(Kg/h)
0.5 0.75 1 0.5 0.75 1 0.5 0.75 1
Drying
Temp
(°C)
130 150 170
TB
AR
S (
mm
ol
MD
A/
Kg o
il)
Co-Current (Experimental)
Counter-Current (Experimental)
0
5
10
15
20
25
30
35
Feed
rate
(Kg/h)
0.5 0.75 1 0.5 0.75 1 0.5 0.75 1
Drying
Temp
(°C)
130 150 170
Mea
n P
art
icle
Siz
e (µ
m)
Co-current (Predicted) Counter-Current (Predicted)
Co-Current (Experimental) Counter-Current (Experimental)
128
4.3.1.3.6 Microstructure
A 3D characterization of the powder particles was carried out through SEM to evaluate
particle microstructure. Higher shrinkage was observed in powder particles produced at 170°C
inlet air temperatures (Figs. 4.19 and 4.20). This may the result of moisture transport during the
falling rate period (Walton, 2000). According to Gharsallaoui, Roudaut, Chambin, Voilley and
Saurel (2007), during the constant drying rate period, the rate of water diffusion from the inside
of a particle to its surface is equal to the surface evaporation rate; once the droplet reaches a
critical moisture content, a dry crust is formed at the feed droplet surface and the drying rate
quickly decreases. Powder particles tend to contain voids, inflate and break when evaporation
occurs at higher temperatures during this phase.
More particle agglomeration was observed in powders dried at 130°C inlet air temperatures.
Huang, Kumar and Mujumdar (2006) have reported that low inlet air temperatures produce
agglomerated powders with high moisture contents; meanwhile, high air inlet temperature causes
excessive evaporation and produce low quality powders. It was also observed that the feeding
rates did not affect the microstructure of the powder particles.
The SEM micrographs also revealed that powders dried in CO spray drying conditions had
higher shrinkage and particle breakage compared to those dried in CNT conditions. This may be
due to the shorter RT in CNT spray drying compared to CO spray drying. These results are in
agreement with those of lipid oxidation (previously discussed).
In this study, CNT spray drying produced more spherical powder particles with few signs of
shrinkage and disruption. These results are not in agreement with those described by
(Gharsallaoui, Roudaut, Chambin, Voilley & Saurel, 2007), who reported that better quality
particles are obtained with CO spray drying.
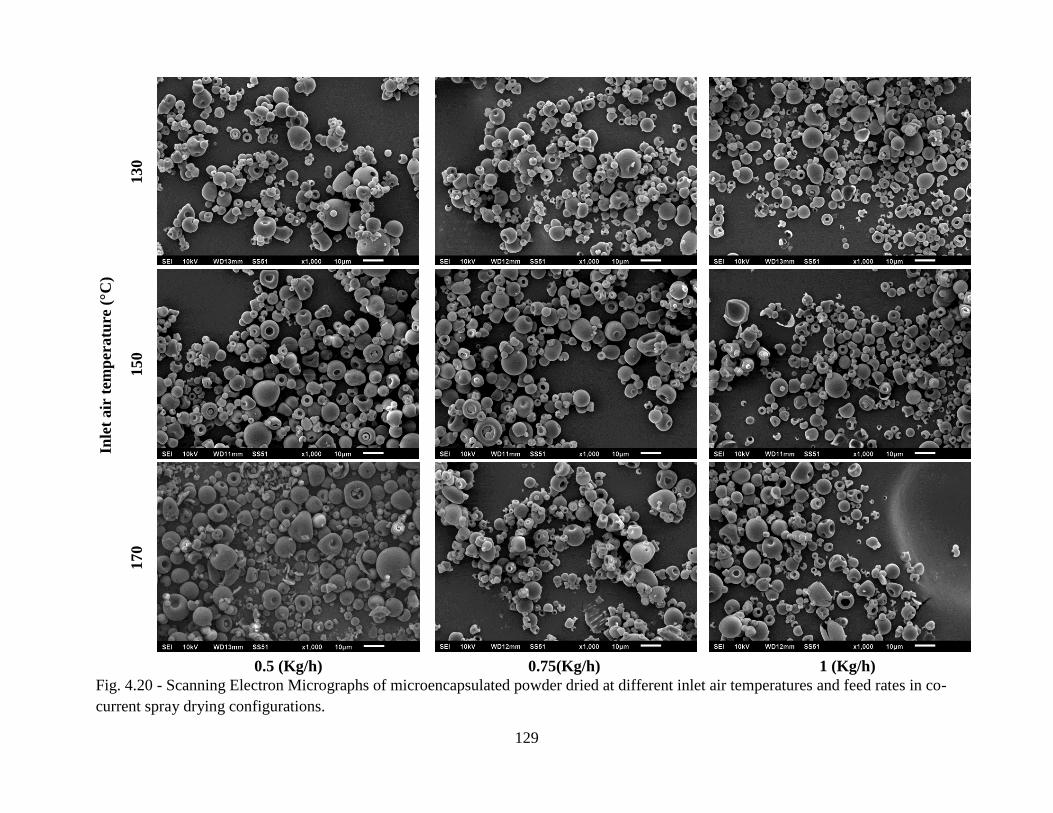
129
Inle
t air
tem
pera
ture
(°C
)
130
150
170
0.5 (Kg/h) 0.75(Kg/h) 1 (Kg/h)
Fig. 4.20 - Scanning Electron Micrographs of microencapsulated powder dried at different inlet air temperatures and feed rates in co-
current spray drying configurations.
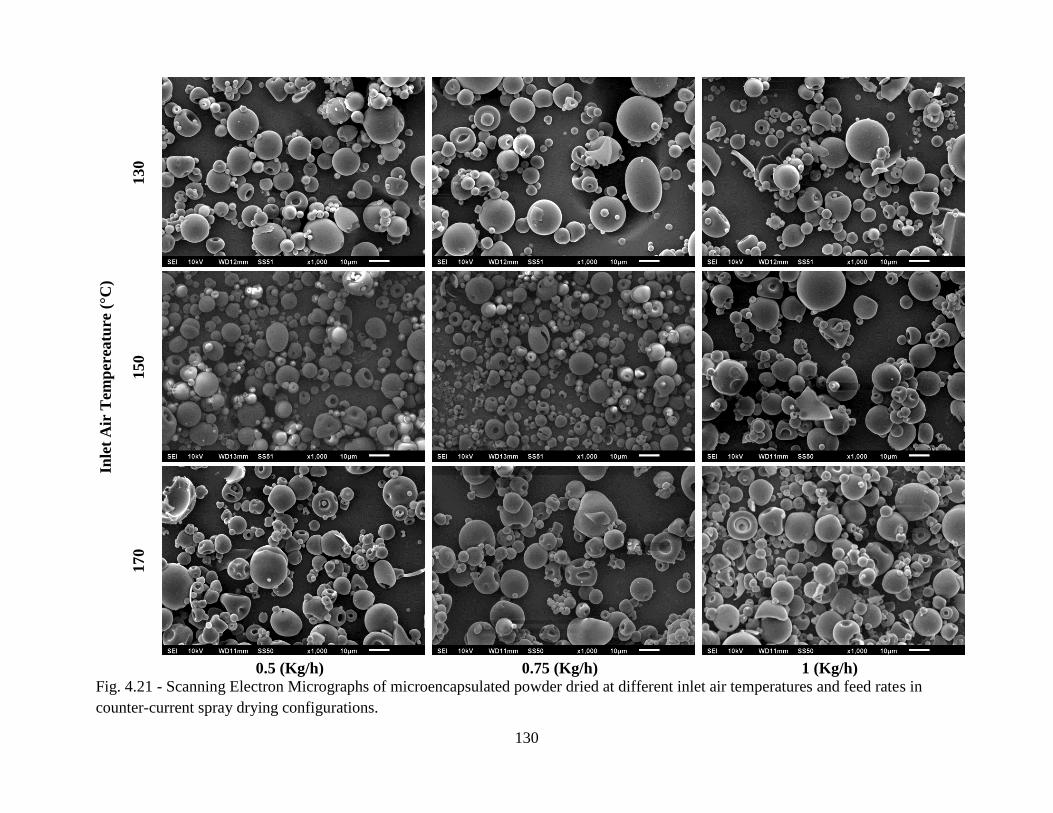
130
Inle
t A
ir T
emp
erea
ture
(°C
)
130
150
170
0.5 (Kg/h) 0.75 (Kg/h) 1 (Kg/h)
Fig. 4.21 - Scanning Electron Micrographs of microencapsulated powder dried at different inlet air temperatures and feed rates in
counter-current spray drying configurations.
131
4.3.2 Case 2
According to Gimbun, Chuah, Fakhru’l-Razi and Choong (2005), cyclone separators use
centrifugal forces produced by the spinning drying air stream to separate particles from the
carrier air. Due to their design, cyclones separators are highly suitable for high temperature and
pressure conditions and can reach collection efficiencies up to 99% for particles larger than 5 µm
(Da Silva, Briens & Bernis, 2003). Collection efficiencies and pressure drops are the two
important parameters identified in the study of the performance of cyclones separators. In this
work, a numerical study of the pilot-scale spray dryer’s cyclone separator was conducted by 3D-
CFD simulations. A finite volume method was used to solve the set of partial differential
equations of a two-way couple Euler-Lagrange approach for the continuous (drying air) and
discrete phase (dried particles).
4.3.2.1 Simulation results
4.3.2.1.1 Drying air flow pattern
The drying air flow pattern is shown in Fig. 4.21. It can be observed that the drying air flow
forms descending and ascending streams which flow parallel to one another before leaving the
cyclone through the outlet. Also, the ascending flow is not symmetrical and has a twisted
cylinder shape. Similar observations are previously reported (Da Silva, Briens & Bernis, 2003;
Griffiths & Boysan, 1996). According to Griffiths and Boysan (1996), after entering the cyclone,
the drying air flow creates a stream that flows and accelerates along the outer wall towards the
bottom of the cyclone; once it reaches the bottom, it changes direction and ascends through the
core towards the outlet. Identifying the air flow pattern inside the cyclone is important because it
can help to detect leakages which decrease collection efficiencies. In this study, no leakage
flows were identified inside the cyclone at any operating conditions.
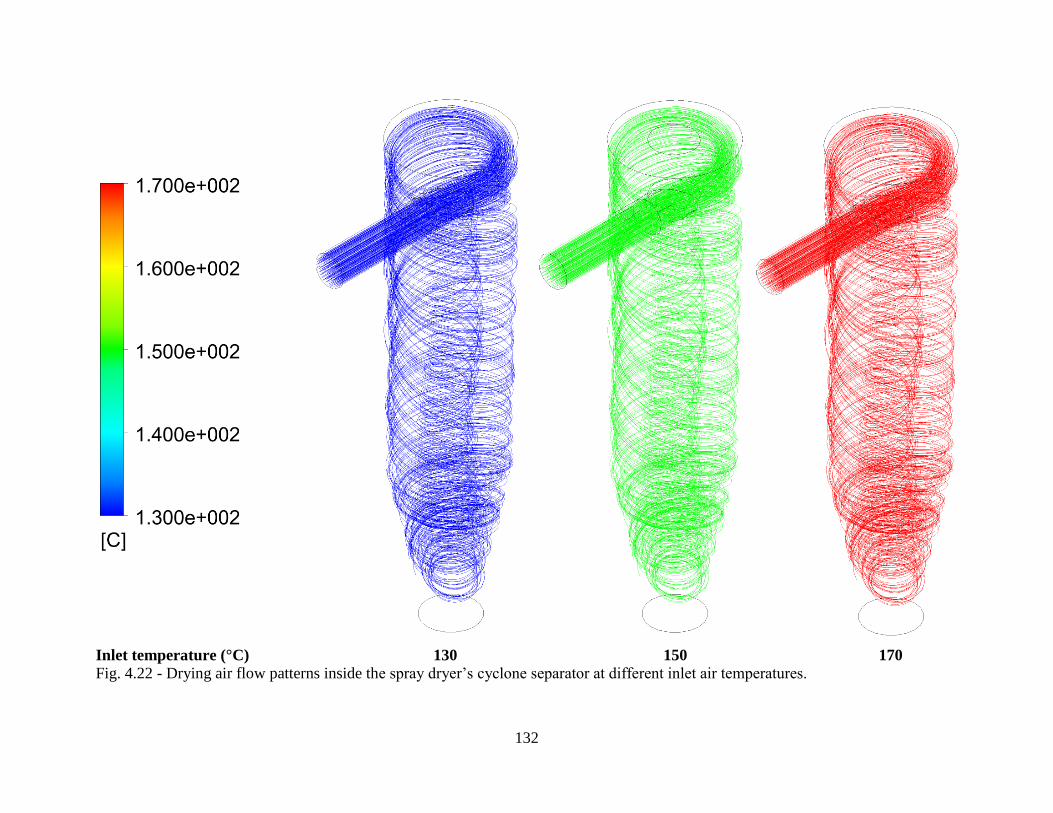
132
Inlet temperature (°C) 130 150 170
Fig. 4.22 - Drying air flow patterns inside the spray dryer’s cyclone separator at different inlet air temperatures.
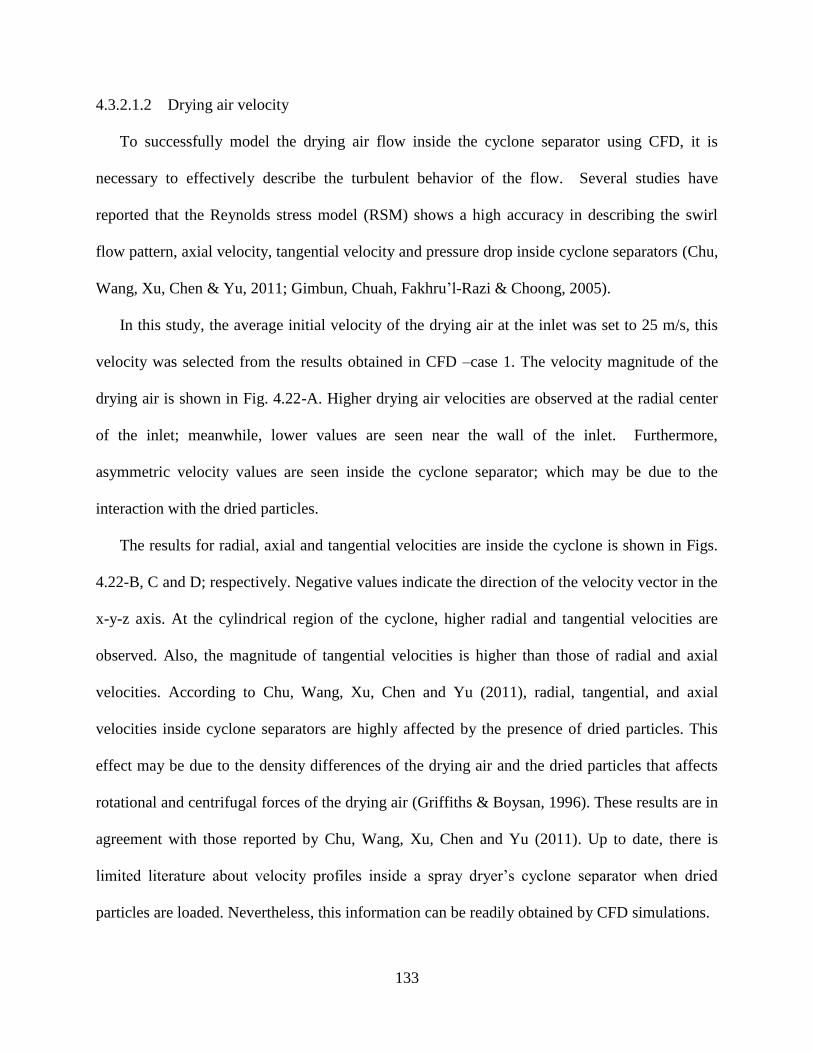
133
4.3.2.1.2 Drying air velocity
To successfully model the drying air flow inside the cyclone separator using CFD, it is
necessary to effectively describe the turbulent behavior of the flow. Several studies have
reported that the Reynolds stress model (RSM) shows a high accuracy in describing the swirl
flow pattern, axial velocity, tangential velocity and pressure drop inside cyclone separators (Chu,
Wang, Xu, Chen & Yu, 2011; Gimbun, Chuah, Fakhru’l-Razi & Choong, 2005).
In this study, the average initial velocity of the drying air at the inlet was set to 25 m/s, this
velocity was selected from the results obtained in CFD –case 1. The velocity magnitude of the
drying air is shown in Fig. 4.22-A. Higher drying air velocities are observed at the radial center
of the inlet; meanwhile, lower values are seen near the wall of the inlet. Furthermore,
asymmetric velocity values are seen inside the cyclone separator; which may be due to the
interaction with the dried particles.
The results for radial, axial and tangential velocities are inside the cyclone is shown in Figs.
4.22-B, C and D; respectively. Negative values indicate the direction of the velocity vector in the
x-y-z axis. At the cylindrical region of the cyclone, higher radial and tangential velocities are
observed. Also, the magnitude of tangential velocities is higher than those of radial and axial
velocities. According to Chu, Wang, Xu, Chen and Yu (2011), radial, tangential, and axial
velocities inside cyclone separators are highly affected by the presence of dried particles. This
effect may be due to the density differences of the drying air and the dried particles that affects
rotational and centrifugal forces of the drying air (Griffiths & Boysan, 1996). These results are in
agreement with those reported by Chu, Wang, Xu, Chen and Yu (2011). Up to date, there is
limited literature about velocity profiles inside a spray dryer’s cyclone separator when dried
particles are loaded. Nevertheless, this information can be readily obtained by CFD simulations.
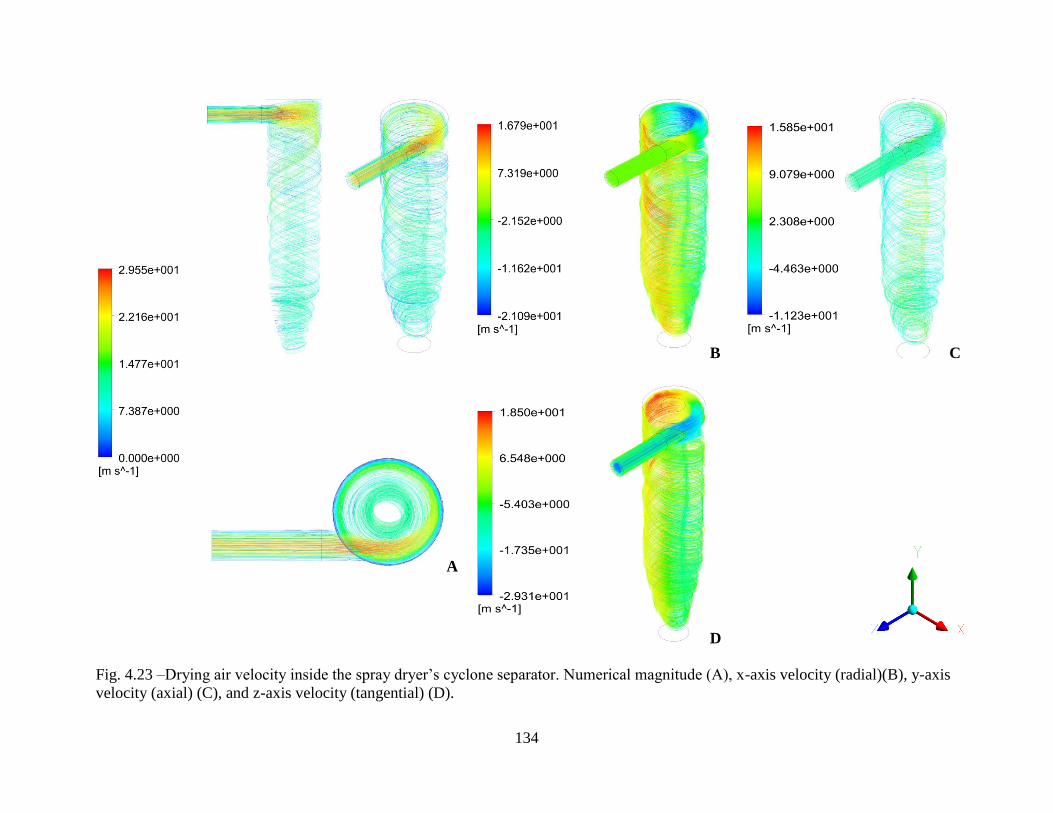
134
B
C
A
D
Fig. 4.23 –Drying air velocity inside the spray dryer’s cyclone separator. Numerical magnitude (A), x-axis velocity (radial)(B), y-axis
velocity (axial) (C), and z-axis velocity (tangential) (D).
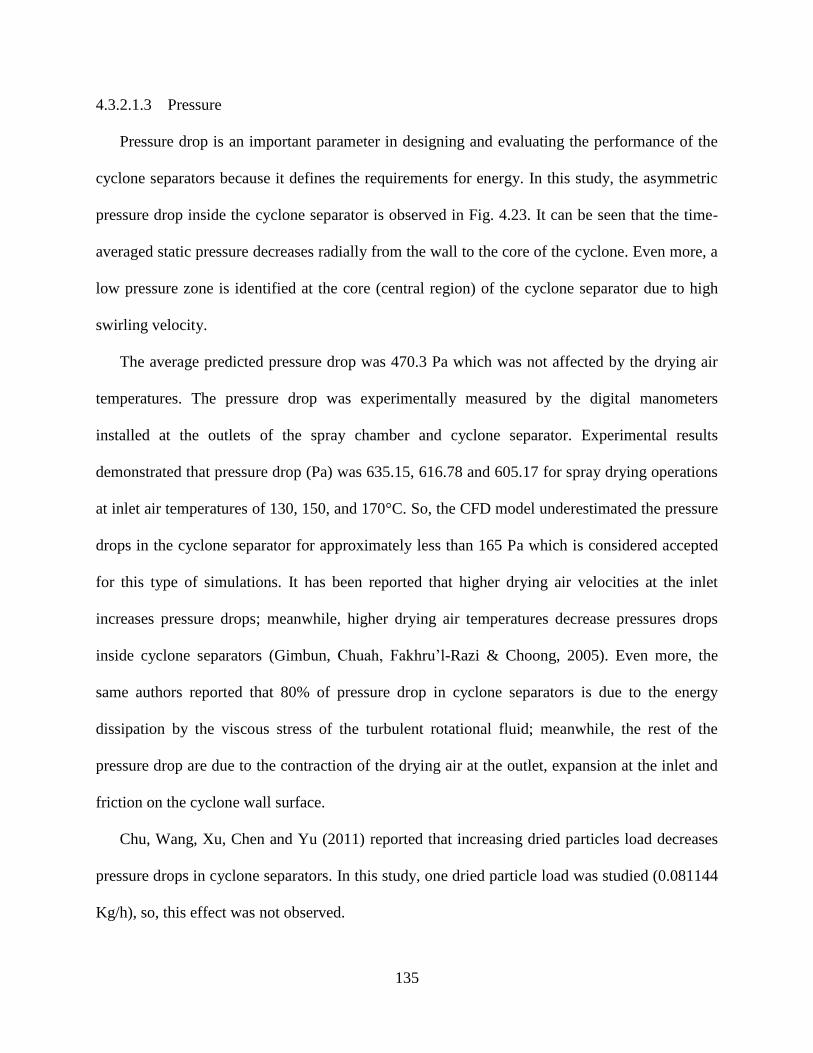
135
4.3.2.1.3 Pressure
Pressure drop is an important parameter in designing and evaluating the performance of the
cyclone separators because it defines the requirements for energy. In this study, the asymmetric
pressure drop inside the cyclone separator is observed in Fig. 4.23. It can be seen that the time-
averaged static pressure decreases radially from the wall to the core of the cyclone. Even more, a
low pressure zone is identified at the core (central region) of the cyclone separator due to high
swirling velocity.
The average predicted pressure drop was 470.3 Pa which was not affected by the drying air
temperatures. The pressure drop was experimentally measured by the digital manometers
installed at the outlets of the spray chamber and cyclone separator. Experimental results
demonstrated that pressure drop (Pa) was 635.15, 616.78 and 605.17 for spray drying operations
at inlet air temperatures of 130, 150, and 170°C. So, the CFD model underestimated the pressure
drops in the cyclone separator for approximately less than 165 Pa which is considered accepted
for this type of simulations. It has been reported that higher drying air velocities at the inlet
increases pressure drops; meanwhile, higher drying air temperatures decrease pressures drops
inside cyclone separators (Gimbun, Chuah, Fakhru’l-Razi & Choong, 2005). Even more, the
same authors reported that 80% of pressure drop in cyclone separators is due to the energy
dissipation by the viscous stress of the turbulent rotational fluid; meanwhile, the rest of the
pressure drop are due to the contraction of the drying air at the outlet, expansion at the inlet and
friction on the cyclone wall surface.
Chu, Wang, Xu, Chen and Yu (2011) reported that increasing dried particles load decreases
pressure drops in cyclone separators. In this study, one dried particle load was studied (0.081144
Kg/h), so, this effect was not observed.
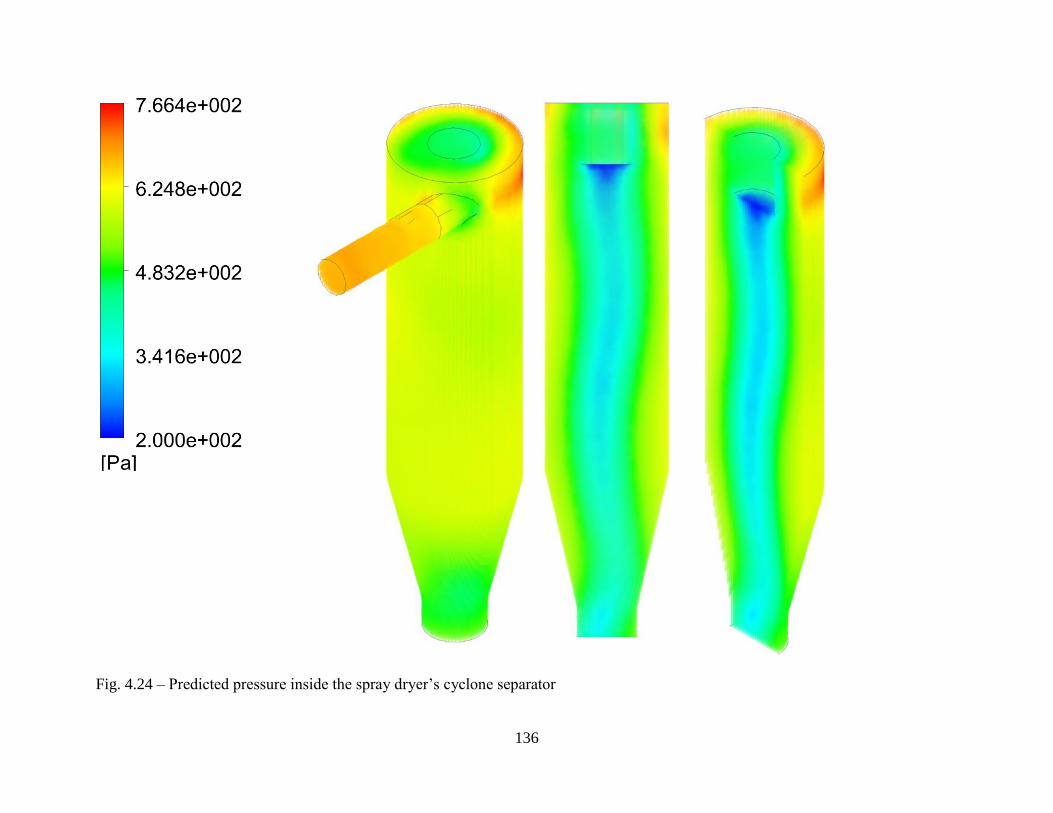
136
Fig. 4.24 – Predicted pressure inside the spray dryer’s cyclone separator
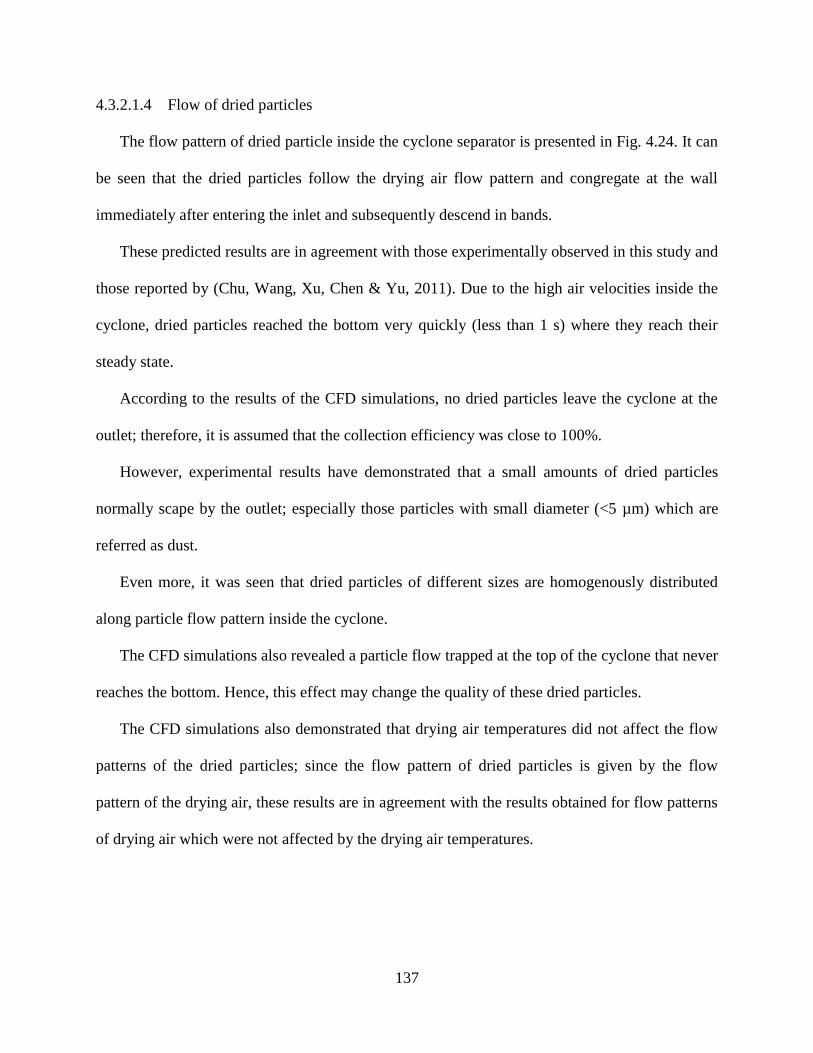
137
4.3.2.1.4 Flow of dried particles
The flow pattern of dried particle inside the cyclone separator is presented in Fig. 4.24. It can
be seen that the dried particles follow the drying air flow pattern and congregate at the wall
immediately after entering the inlet and subsequently descend in bands.
These predicted results are in agreement with those experimentally observed in this study and
those reported by (Chu, Wang, Xu, Chen & Yu, 2011). Due to the high air velocities inside the
cyclone, dried particles reached the bottom very quickly (less than 1 s) where they reach their
steady state.
According to the results of the CFD simulations, no dried particles leave the cyclone at the
outlet; therefore, it is assumed that the collection efficiency was close to 100%.
However, experimental results have demonstrated that a small amounts of dried particles
normally scape by the outlet; especially those particles with small diameter (<5 µm) which are
referred as dust.
Even more, it was seen that dried particles of different sizes are homogenously distributed
along particle flow pattern inside the cyclone.
The CFD simulations also revealed a particle flow trapped at the top of the cyclone that never
reaches the bottom. Hence, this effect may change the quality of these dried particles.
The CFD simulations also demonstrated that drying air temperatures did not affect the flow
patterns of the dried particles; since the flow pattern of dried particles is given by the flow
pattern of the drying air, these results are in agreement with the results obtained for flow patterns
of drying air which were not affected by the drying air temperatures.
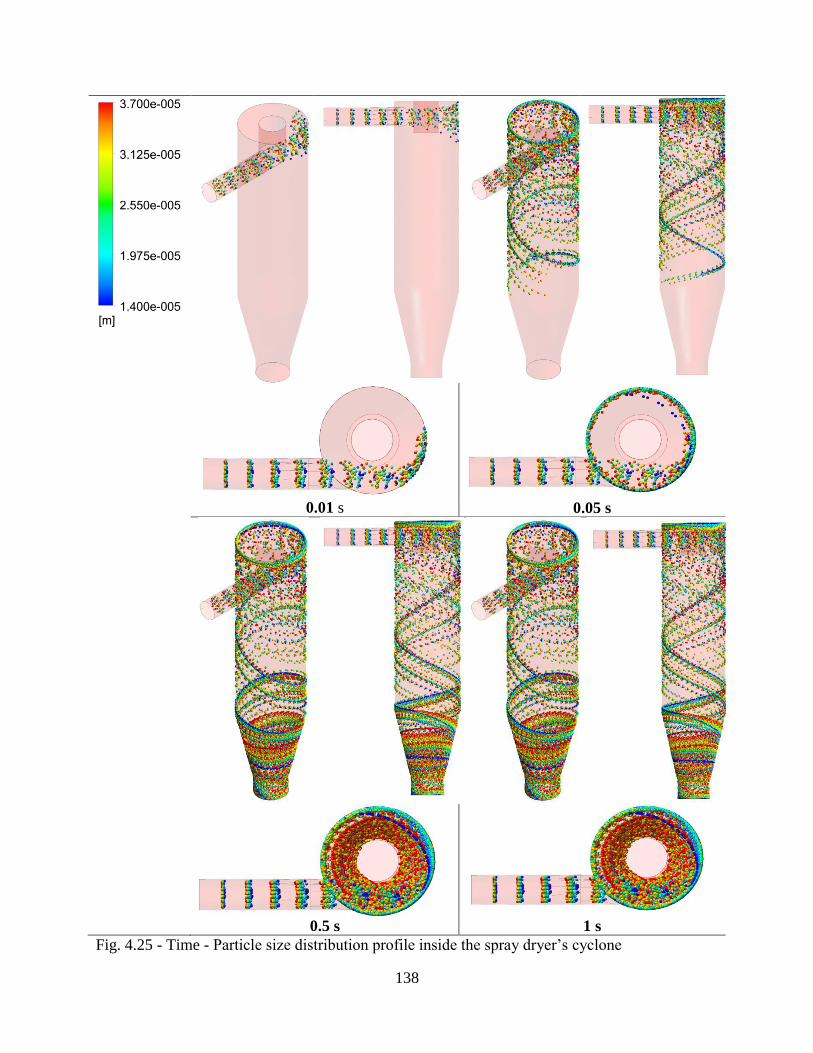
138
0.01 s 0.05 s
0.5 s 1 s
Fig. 4.25 - Time - Particle size distribution profile inside the spray dryer’s cyclone
139
4.4 Conclusion
Microencapsulated menhaden oil with egg white hydrolysates powders were effectively
produced by spray drying. This study is the first attempt to compare the performance of co-
current and counter-current spray drying configurations in the production of microencapsulated
fish oil powders using CFD simulations and experimental tools. The complex transport
phenomena occurring during spray drying was effectively modeled using 3D-CFD simulations.
The drying air flow inside the drying chamber and the cyclone separator was successfully
modeled by the realizable k-ɛ and Reynolds stress model (RSM) turbulent models, respectively.
Predicted results for moisture content and particle size distribution of microencapsulated
powders was comparable to those experimentally obtained. Lower lipid oxidation and thermal
degradation was observed in powders produced at 130°C inlet air temperatures under counter-
current spray drying configurations. Counter-current spray drying produced better quality
microencapsulated powder than co-current spray drying due to lower predicted particle residence
times.
Particle separation inside the spray dryer’s cyclone separator was successfully modeled by
3D-CFD. Also, predicted results for pressure drop inside the spray dryer’s cyclone separator was
comparable with those experimentally obtained.
Prediction of particle agglomeration, lipid oxidation and microstructure of spray dried
powders using CFD simulations is still limited. Nevertheless, it is a powerful tool to study the
spray drying process. The numerical results generated in this study provide valuable information
to pilot-scale testing and to engineer new powder products using spray drying technology.
The study demonstrated that the 3D-CFD spray drying modeling can be effectively used to
study the drying phenomena and to predict the final quality of spray dried powders.
140
4.5 References
AlChE. (2003). Spray dryers: a guide to performance evaluation: Equipment Testing Procedures
Committee - American Institute of Chemical Engineers
Anandharamakrishnan, C., Gimbun, J., Stapley, A., & Rielly, C. D. (2009). Application of
computational fluid dynamics (CFD) simulations to spray-freezing operations. Drying
Technology, 28(1), 94-102.
AOAC. (1999). Official methods of analysis. Arlington, VA: Association of Official Analytical
Chemists.
Baik, M.-Y., Suhendro, E., Nawar, W., McClements, D., Decker, E., & Chinachoti, P. (2004).
Effects of antioxidants and humidity on the oxidative stability of microencapsulated fish oil.
Journal of the American Oil Chemists' Society, 81(4), 355-360.
Bimbenet, J., Bonazzi, C., & Dumoulin, E. (2002). Drying of foodstuffs. Drying 2002, 64-80.
Birchal, V., Huang, L., Mujumdar, A., & Passos, M. (2006). Spray dryers: modeling and
simulation. Drying Technology, 24(3), 359-371.
Chu, K. W., Wang, B., Xu, D. L., Chen, Y. X., & Yu, A. B. (2011). CFD–DEM simulation of the
gas–solid flow in a cyclone separator. Chemical Engineering Science, 66(5), 834-847.
Da Silva, P., Briens, C., & Bernis, A. (2003). Development of a new rapid method to measure
erosion rates in laboratory and pilot plant cyclones. Powder technology, 131(2), 111-119.
Damodaran, S., Parkin, K., & Fennema, O. (2008). Fennema's Food Chemistry: CRC PRESS.
Drusch, S., & Berg, S. (2008). Extractable oil in microcapsules prepared by spray-drying:
Localisation, determination and impact on oxidative stability. Food Chemistry, 109(1), 17-
24.
Drusch, S., Serfert, Y., Scampicchio, M., Schmidt-Hansberg, B., & Schwarz, K. (2007). Impact
of Physicochemical Characteristics on the Oxidative Stability of Fish Oil Microencapsulated
by Spray-Drying. Journal of Agricultural and Food Chemistry, 55(26), 11044-11051.
Ducept, F., Sionneau, M., & Vasseur, J. (2002). Superheated steam dryer: simulations and
experiments on product drying. Chemical Engineering Journal, 86(1), 75-83.
Fletcher, D., Guo, B., Harvie, D., Langrish, T., Nijdam, J., & Williams, J. (2006). What is
important in the simulation of spray dryer performance and how do current CFD models
perform? Applied mathematical modelling, 30(11), 1281-1292.
141
Gharsallaoui, A., Roudaut, G., Chambin, O., Voilley, A., & Saurel, R. (2007). Applications of
spray-drying in microencapsulation of food ingredients: An overview. Food Research
International, 40(9), 1107-1121.
Gimbun, J., Chuah, T. G., Fakhru’l-Razi, A., & Choong, T. S. Y. (2005). The influence of
temperature and inlet velocity on cyclone pressure drop: a CFD study. Chemical Engineering
and Processing: Process Intensification, 44(1), 7-12.
Griffiths, W. D., & Boysan, F. (1996). Computational fluid dynamics (CFD) and empirical
modelling of the performance of a number of cyclone samplers. Journal of Aerosol Science,
27(2), 281-304.
Hogan, S. A., McNamee, B. F., O’Riordan, E. D., & O’Sullivan, M. (2001). Emulsification and
microencapsulation properties of sodium caseinate/carbohydrate blends. International Dairy
Journal, 11(3), 137-144.
Huang, L., Kumar, K., & Mujumdar, A. (2003a). A parametric study of the gas flow patterns and
drying performance of co-current spray dryer: Results of a computational fluid dynamics
study. Drying Technology, 21(6), 957-978.
Huang, L., Kumar, K., & Mujumdar, A. (2003b). Use of computational fluid dynamics to
evaluate alternative spray dryer chamber configurations. Drying Technology, 21(3), 385-412.
Huang, L., Kumar, K., & Mujumdar, A. (2004). Simulation of a spray dryer fitted with a rotary
disk atomizer using a three-dimensional computional fluid dynamic model. Drying
Technology, 22(6), 1489-1515.
Huang, L. X., Kumar, K., & Mujumdar, A. S. (2006). A comparative study of a spray dryer with
rotary disc atomizer and pressure nozzle using computational fluid dynamic simulations.
Chemical Engineering and Processing: Process Intensification, 45(6), 461-470.
Jimenez, M., García, H. S., & Beristain, C. I. (2004). Spray-drying microencapsulation and
oxidative stability of conjugated linoleic acid. European Food Research and Technology,
219(6), 588-592.
Jónsdóttir, R., Bragadóttir, M., & Arnarson, G. (2005). Oxidatively Derived Volatile Compounds
in Microencapsulated Fish Oil Monitored by Solid‐phase Microextraction (SPME). Journal
of Food Science, 70(7), c433-c440.
Kagami, Y., Sugimura, S., Fujishima, N., Matsuda, K., Kometani, T., & Matsumura, Y. (2003).
Oxidative Stability, Structure, and Physical Characteristics of Microcapsules Formed by
Spray Drying of Fish Oil with Protein and Dextrin Wall Materials. Journal of Food Science,
68(7), 2248-2255.
Kieviet, F., & Kerkhof, P. J. (1995). Measurements of particle residence time distributions in a
co-current spray dryer. Drying Technology, 13(5-7), 1241-1248.
142
Kieviet, F. G. (1997). Modelling quality in spray drying: Laboratory of Separation Processes and
Transport Phenomena, Department of Chemical Engineering, Eindhoven University of
Technology.
Klinkesorn, U., Sophanodora, P., Chinachoti, P., Decker, E. A., & McClements, D. J. (2006).
Characterization of spray-dried tuna oil emulsified in two-layered interfacial membranes
prepared using electrostatic layer-by-layer deposition. Food Research International, 39(4),
449-457.
Kolanowski, W., Ziolkowski, M., Weißbrodt, J., Kunz, B., & Laufenberg, G. (2006).
Microencapsulation of fish oil by spray drying--impact on oxidative stability. Part 1.
European Food Research and Technology, 222(3-4), 336-342.
Kuriakose, R., & Anandharamakrishnan, C. (2010). Computational fluid dynamics (CFD)
applications in spray drying of food products. Trends in Food Science & Technology, 21(8),
383-398.
Langrish, T., Williams, J., & Fletcher, D. (2004). Simulation of the effects of inlet swirl on gas
flow patterns in a pilot-scale spray dryer. Chemical Engineering Research and Design, 82(7),
821-833.
Langrish, T., & Zbicinski, I. (1994). The effects of air inlet geometry and spray cone angle on
the wall deposition rate in spray dryers. Chemical engineering research & design, 72(A3),
420-430.
Mei, L., McClements, D. J., Wu, J., & Decker, E. A. (1998). Iron-catalyzed lipid oxidation in
emulsion as affected by surfactant, pH and NaCl. Food Chemistry, 61(3), 307-312.
Mezhericher, M., Levy, A., & Borde, I. (2009). Modeling of droplet drying in spray chambers
using 2D and 3D computational fluid dynamics. Drying Technology, 27(3), 359-370.
Mezhericher, M., Levy, A., & Borde, I. (2012). Three-dimensional spray-drying model based on
comprehensive formulation of drying kinetics. Drying Technology, 30(11-12), 1256-1273.
Oakley, D., & Bahu, R. (1993). Computational modelling of spray dryers. Computers &
chemical engineering, 17, S493-S498.
Paris, J. R., Ross Jr, P. N., Dastur, S. P., & Morris, R. L. (1971). Modeling of the air flow pattern
in a countercurrent spray-drying tower. Industrial & Engineering Chemistry Process Design
and Development, 10(2), 157-164.
Pinto, M., Kemp, I., Bermingham, S., Hartwig, T., & Bisten, A. (2014). Development of an
axisymmetric population balance model for spray drying and validation against experimental
data and CFD simulations. Chemical Engineering Research and Design, 92(4), 619-634.
143
Quek, S. Y., Chok, N. K., & Swedlund, P. (2007). The physicochemical properties of spray-dried
watermelon powders. Chemical Engineering and Processing: Process Intensification, 46(5),
386-392.
Scott, G., & Richardson, P. (1997). The application of computational fluid dynamics in the food
industry. Trends in Food Science & Technology, 8(4), 119-124.
Serfert, Y., Drusch, S., & Schwarz, K. (2009). Chemical stabilisation of oils rich in long-chain
polyunsaturated fatty acids during homogenisation, microencapsulation and storage. Food
Chemistry, 113(4), 1106-1112.
Shantha, N. C., & Decker, E. A. (1993). Rapid, sensitive, iron-based spectrophotometric methods
for determination of peroxide values of food lipids. Journal of AOAC International, 77(2),
421-424.
Tonon, R. V., Grosso, C. R. F., & Hubinger, M. D. (2011). Influence of emulsion composition
and inlet air temperature on the microencapsulation of flaxseed oil by spray drying. Food
Research International, 44(1), 282-289.
Walton, D. E. (2000). The Morphology of Spray-dried Particles a Qualitative View. Drying
Technology, 18(9), 1943-1986.
Wan, Y., Bankston Jr, J. D., Bechtel, P. J., & Sathivel, S. (2011). Microencapsulation of
menhaden fish oil containing soluble rice bran fiber using spray drying technology. Journal
of Food Science, 76(4), E348-E356.
Wanasundara, U. N., & Shahidi, F. (1995). Storage Stability of Microencapsulated Seal Blubber
Oil. Journal of Food Lipids, 2(2), 73-86.
Woo, M. W., Daud, W. R. W., Mujumdar, A. S., Wu, Z., Meor Talib, M. Z., & Tasirin, S. M.
(2008). CFD evaluation of droplet drying models in a spray dryer fitted with a rotary
atomizer. Drying Technology, 26(10), 1180-1198.
Xia, B., & Sun, D.-W. (2002). Applications of computational fluid dynamics (CFD) in the food
industry: a review. Computers and electronics in agriculture, 34(1), 5-24.
Yin, H., Pu, J., Wan, Y., Xiang, B., Bechtel, P. J., & Sathivel, S. (2010). Rheological and
Functional Properties of Catfish Skin Protein Hydrolysates. Journal of Food Science, 75(1),
E11-E17.
Young, S., Sarda, X., & Rosenberg, M. (1993). Microencapsulating properties of whey proteins.
1. Microencapsulation of anhydrous milk fat. Journal of Dairy Science, 76(10), 2868-2877.
144
CHAPTER 5 - CONCLUSIONS
The study demonstrated that egg white hydrolysates powders containing (1) all of the
essential amino acids including leucine, valine and lysine, (2) high amount of free amino acids
and (3) antioxidant properties can be effectively produced using food-grade proteases obtained
from Aspergillus oryzae and spray drying. Maximum degree of protein hydrolysis in the egg
white hydrolysates was achieved by optimizing the reaction temperature, pH, enzyme:substrate
ratio, and reaction time of the hydrolysis procedure using a surface response methodology
(RSM).
Also, the study demonstrated that egg white hydrolysates can be effectively use in media
that supports the growth of starter cultures of lactic acid bacteria (LAB) including L. plantarum,
L. acidophilus, and L. reuteri as a nitrogen source. Therefore, egg white hydrolysates may have a
potential application for the production of halal and kosher foods.
Furthermore, microencapsulated menhaden oil with egg white hydrolysates powders were
effectively produced by spray drying. The first attempt to compare the performance of co-current
and counter-current spray drying configurations in the production of microencapsulated fish oil
powders using computational fluid dynamics (CFD) simulations and experimental tools was
presented in this study. CFD simulations effectively described the complex transport phenomena
occurring during spray drying by modeling the drying air flow inside the drying chamber and the
cyclone separator using the realizable k-ɛ and the Reynolds stress model (RSM) turbulent
models. Also, CFD simulations predicted moisture contents and particle size distributions of the
microencapsulated powders with high accuracy. The results of this study also demonstrated that
lower spray drying temperatures (130°C) and counter-current spray drying configurations
produced better quality microencapsulated powders with lower lipid oxidation and thermal
degradation.
145
It was also possible to model particle separation inside the spray dryer’s cyclone separator
using CFD simulations; this allowed estimating pressure drops in the cyclone separator which
were comparable with those experimentally obtained.
CFD simulations can be used as a simulation tool in the food processing area; however,
prediction of particle agglomeration, lipid oxidation and microstructure of spray dried powders is
still limited using this technology. Nevertheless, it is a powerful tool to study the spray drying
process.
The valuable information obtained in this study can be used to scale-up the process to
effectively produce egg white hydrolysates powders that can be use in media for LAB growth
and to engineer new food powder products using spray drying technology.
146
VITA
Kevin Estuardo Mis Solval is originally from Guatemala. In December 2008 he obtained his
B.S. in Food Science and Technology from Escuela Agricola Panamericana, El Zamorano,
Honduras. Afterwards, he joined the LSU Department of Food Science as a graduate student in
the spring of 2009 under the supervision of Dr. Subramaniam Sathivel. He successfully
completed his master’s degree in Food Science in May 2011. Then, he joined the LSU-
Biological and Agricultural Engineering department as a Ph.D. student in June 2011. He has
visited many countries including the USA, Mexico, Guatemala, El Salvador, Honduras,
Nicaragua, Costa Rica, Panama and Brazil. He speaks Spanish, English and Portuguese. Kevin
happily got married with Deborah Xavier in December 2014. He is deeply thankful to the LSU
community for making his time at graduate school more fun, enjoyable and unforgettable. He is
set to obtain his Ph.D.’s degree in Engineering Science in May 2015. Kevin enjoys attending
sport events, swimming, and cooking.