Developing a Structured Forecasting and Policy Analysis ... · Developing a Structured Forecasting...
67
WP/09/65 Developing a Structured Forecasting and Policy Analysis System to Support Inflation-Forecast Targeting (IFT) Douglas Laxton, David Rose, and Alasdair Scott
Transcript of Developing a Structured Forecasting and Policy Analysis ... · Developing a Structured Forecasting...

WP/09/65
Developing a Structured Forecasting and Policy Analysis System to Support Inflation-Forecast Targeting (IFT)
Douglas Laxton, David Rose,
and Alasdair Scott


© 2009 International Monetary Fund WP/09/65 IMF Working Paper Research Department
Developing a Structured Forecasting and Policy Analysis System to Support Inflation-Forecast Targeting (IFT)1
Prepared by Douglas Laxton, David Rose, and Alasdair Scott
Authorized for distribution by Charles Collyns
March 2009
Abstract
This Working Paper should not be reported as representing the views of the IMF. The views expressed in this Working Paper are those of the author(s) and do not necessarily represent those of the IMF or IMF policy. Working Papers describe research in progress by the author(s) and are published to elicit comments and to further debate.
This paper presents a basic plan for developing a Forecast and Policy Analysis System designed to support an inflation-forecast targeting regime at a central bank. It includes discussion of the development of data management and reporting processes; the creation of a forecast team and the development of human capital; the implementation of a simple model, plus possible extensions; and the management of regular economic projections. We emphasize that it is better to implement simple models earlier and use them well, rather than wait in an attempt to develop an all-encompassing model. JEL Classification Numbers: E5, Z0 Keywords: forecasting, economic projections, macroeconomic models Author’s E-Mail Address: [email protected]; [email protected]
1 The authors wish to thank a large number of people in central banks that have provided comments on earlier versions of this paper. Extensive modeling resources to support IFT regimes can be found at www.douglaslaxton.org.

2
CONTENTS Page
I. Introduction....................................................................................................................3
II. Developing a Decision-Making Process........................................................................5
III. Benefits of a Successful IFT Regime...........................................................................10
IV. Critical Path For Developing A Structured FPAS .......................................................12
V. The Quarterly Projection Exercise...............................................................................18
VI. The Core Model ...........................................................................................................24
VII. The Role of Models in the FPAS.................................................................................27
VIII. On the Evolution and Development of the FPAS........................................................33 Text Figures 1. The Role of Models in the Forecast Process................................................................29 2. From Policy Issues to Policy Recommendations.........................................................32 3. How Several Models can be Combined to Impose Consistency .................................35 Appendix Figures 4. A Possible Reporting Structure....................................................................................46 5. Links Between Different Databases.............................................................................50 6. The Monetary Policy Transmission Mechanism .........................................................52 7. Inflation Expectations 10-Years-Ahead in the United Kingdom.................................53 Appendix Tables 1. Estimation of a Model with Model-Consistent Measures of Potential GDP...............63 2. Notation: Time Periods Correspond to Calendar Quarters ..........................................64

3
I. INTRODUCTION
Countries with experience implementing independent monetary policies in periods of flexible exchange rates have had considerable advantages making the transition to explicit inflation-forecast targeting (IFT) regimes. This is because they already had most of the systems and expertise in place to support IFT. However, for countries facing a rapid transition from fixed exchange rates to IFT, developing the internal monitoring and forecasting processes has been more difficult.
This document provides a basic plan for developing a forecasting and policy analysis system (FPAS) to support policy decision-making in countries that are considering (or have recently adopted) an IFT regime. The suggestions are based on our view of ‘best practice’ for IFT, and an assessment of how that practice could be transplanted to institutions that face challenges of limited resources and fast-changing economies. We deliberately avoid reference to specific institutions, because we think that no institution has a monopoly on what constitutes best practice. While institutions that are new to IFT undoubtedly face challenges, they are also free to consider the whole picture of what is required for IFT in creating their own practices.
The proposed development strategy is based on a belief that many of the difficulties associated with developing the systems and expertise required for IFT are usually the result of two problems:
• First, there may be an attempt to develop the perfect system too quickly, at the expense of achieving a minimum acceptable degree of functionality in the short run.
• Second, there may be an attempt to put too much emphasis on the model itself. An effective IFT system requires considerable integration of its parts⎯the databases, the reporting system, the forecasting process, the information technology, the communication and decision-making framework, and so on.
Hence, while the system proposed here borrows greatly from the forecasting and policy analysis systems that have been developed over the years in various central banks, it has deliberately been kept simple. The system must focus on the needs of policymakers, but always with a view to the resources available. It can and should be refined and extended as time and resources permit. However, it is most important to start operating as quickly as possible.
The goal of the paper is to outline systems and processes that help the staff of the economics
4
departments in central banks achieve a coherent view of what is happening in the economy, what the policy implications of that are, and what that implies for research and further investigation.
More concretely, the proposed system involves the following parts:
1. Developing a reporting, database, and near-term forecasting system based on a limited but key set of macroeconomic variables, so that everyone involved in the forecast and policy process can share the same information.
2. Updating the database, monitoring and reports on a timely (weekly) basis so that everyone involved in the process will be informed about how new information affects the near-term inflation forecast (and the implications, if any, for the longer-term outlook).
3. Developing a simple quarterly projection model of the economy that embodies policymakers’ views about the monetary policy transmission mechanism and the standard set of shocks that affect the economy. The model may be very simple at first; the important thing is to get a complete system operating quickly. The model can be extended over time as dictated by experience, but the core projection model should not be allowed to turn into a ‘black box’ by becoming too complicated.
4. Developing a consistent, model-based macroeconomic forecast every quarter. This includes assessing the risks to the previous official baseline forecast and using that to propose changes to the official baseline forecast.
5. Developing measures of uncertainty in the forecast, such as model-based confidence intervals. These measures should be used to communicate the extent of this uncertainty, both internally and to the public.
6. Studying specific risks in the baseline forecast and developing contingency plans for reacting to new information that is released between official forecasts.
Inflation-forecast targeting involves using a wide range of information in order to obtain the best forecasts for inflation and the economy. The staff must extract the underlying pressures on inflation and the economy from data that may be conflicting and noisy. To foster the necessary cooperative effort, all participants must be able to share information and to see how new information⎯from themselves and their colleagues⎯affects the forecast.
5
This is important because successful inflation forecasts are not mechanical; the principal role of models is to see what implications these judgments about the state of the economy have for policy. In fact, in the very early stages of an IFT regime, forecasting and policy analysis may be based entirely on judgment, without the use of any formal model. The development of the FPAS can be greatly advanced simply by developing a process for regular meetings and reports, where the staff review recent economic developments and provide an assessment of the risks to the previous baseline forecast. However, as the IFT regime evolves, it would be useful to impose more discipline and structure on the policy debates by developing a core macro model explicitly designed to support IFT. The model may therefore be a natural extension of an existing process, but introducing a macro model in a situation where there is no process for interpreting and reporting data outturns is not likely to be very helpful.
Similarly, it will be difficult for staff to introduce successfully the changes proposed here unless their ‘clients’⎯the senior managers who make key policy decisions⎯are receptive to the need for such a structured process. In what follows, we assume that this exists, but there may need to be a preliminary process wherein upper management is introduced to the processes described here and persuaded of their benefits. This may take some time, but it is nonetheless necessary that staff and upper management approach building a structured FPAS with a shared view of what is to be put in place and the ultimate goals.
The remainder of the paper is organized as follows. Section II discusses an internal process for policy decisions with fixed, announced action dates and reports to the public. It also reviews what information and analysis policymakers need to make informed and timely decisions about setting the policy instrument. Section III explains the basic benefits associated with a successful IFT framework and the specific benefits associated with developing a structured FPAS. Section IV discusses the steps that are necessary in developing such a system. Section V describes how the quarterly projection exercise could be organized. Section VI provides an outline of a simple model that could be used for small open economies, and explains some of the technical aspects about the forecast. Section VII explains what would have to be done to develop the internal expertise to build more sophisticated macroeconomic models for use in the FPAS.
II. DEVELOPING A DECISION-MAKING PROCESS
In a regime with a fixed exchange rate, there is no independent domestic monetary policy and so no decision-making process is required, other than the day-to-day reaction to developments in the exchange market and closely related financial markets. However, once there is an independent domestic monetary policy, such as arises from an IFT regime, it becomes imperative that there be a structure and process for monetary policy decisions. In later sections of this paper, we will look at the details of the underlying FPAS necessary to support monetary policy decisions. Here, we focus on the end result, the policy decisions,

6
covering the information required, the nature of discussions and deliberations that will facilitate the process and the nature of communication of the decisions to markets and the public generally.
Different institutions have different internal decision-making structures. In some, the final decisions on policy actions may rest in a single individual, a Governor of the central bank or the equivalent. In others, there may be a group of senior managers charged with that task. In our discussion, we will simplify the exposition by assuming that the decision-making body is a Monetary Policy Committee (MPC). In this discussion, it does not matter whether the MPC is a group or an individual.
Central to the success of an IFT regime is developing credibility that the monetary authority will act to respect the announced inflation targets over time.2 A major benefit from earning such credibility is that routine shocks will not have profound lasting effects; long-term inflation expectations will remain anchored to the policy target and routine shocks will have only minor transitory effects on markets. This ideal situation will not come immediately from an announcement of a new policy regime. It will have to be earned and defended over time. The only way this can happen is through clear and consistent communication of the policy decisions and, most importantly, the reasons for them.
Information comes to policy decision-makers all the time. In financial markets, there is something new every day. However, IFT policy decisions require a longer horizon and a clear macroeconomic framework. In most countries, complete economic data in the form of national and/or domestic accounts comes quarterly, with a lag of course. Yet, many partial indicators are available monthly. In the sections that follow, we describe a system of monitoring, forecasting and policy analysis that is structured around the flow of information. This system is designed to provide for ongoing discussion of economic developments and the implications for monetary policy that will take place continuously, and with some formal internal discussion and summary at least once a week. Policy decisions based on such ongoing discussions will be better informed and better communicated. However, that does not mean that decisions need to be taken and communicated every week.
In recent years, many monetary institutions have moved to a fixed calendar of formal decision dates and consequent communication with markets, with these dates announced in
2 This does not mean that the target must be hit. Indeed, that has zero probability in an uncertain world. Moreover, in the face of difficult shocks, other considerations might dictate that ‘good’ policy would imply not focusing solely on bringing inflation to the target as quickly as possible. The key to credibility is to explain in detail the reasons for decisions and, in particular, to avoid any sense that decisions are systematically inconsistent with hitting the targets.

7
advance. Since we are discussing regimes designed to deal with inflation, there is a case for using the release of data on inflation, typically monthly, to trigger the process of deciding and communicating the results. Indeed, in some institutions, a full monetary or inflation report is generated monthly. If that is desired and feasible, there is no problem. However, we want to stress that neither the decision-making nor the communication need be tied to such a demanding schedule. For countries entering into IFT decision-making for the first time, full reporting on a quarterly basis, linked to the release of the domestic accounts, and a full-blown update of the economic outlook and medium-term forecast, would be reasonable.
This does not mean that decisions should be taken and communication undertaken only at these quarterly ‘full-report’ times. There could be a fixed schedule of monthly decisions triggered by the latest inflation data (if available at monthly frequency), with a brief update on economic and monetary conditions and the reasons for any actions taken, presented in the context of an update on the previous quarterly report, in the months between releases of the domestic accounts.
It is not essential that the fixed schedule be monthly. It is widely accepted that quarterly is not often enough, but some countries have chosen to have fewer than twelve dates in their decision-making schedule. In the end, the frequency of decisions and reports must strike a balance. Having too many puts unnecessary strain on internal resources and may frustrate markets if there is regularly too little new information to warrant reviewing economic conditions and policy choices. Having too few decision dates risks avoiding the discipline of confronting the evolving evidence and providing a clear interpretation, and risks delaying policy action past the point where it is clearly called for.
It is important when choosing at fixed timetable for decisions and communications with markets that it be made clear that there is nothing to stop the MPC from acting at other times and communicating the nature and reasons for these actions, if extraordinary circumstances arise. This cannot be a regular occurrence, or the benefits of the fixed timetable will be eroded, but markets will understand that the MPC must be free to act when necessary under extraordinary circumstances. It is in everyone’s interest that monetary policy be conducted well.
Although a schedule should not be allowed to compromise good monetary decisions, there are important advantages to having fixed decision dates and reports. Markets like predictability of process. Having a fixed timetable for policy decisions and public discussion focuses the attention of all players on the underlying issues at the same time and with the same data. Commentators, both from markets and from the academic community, will debate what the policy authority should do, listen to what is said about what was decided, debate whether it was the right action, and then move on. Both sides can gain from this. It is important to remember that markets are there to provide goods and services and, while the

8
monetary policy environment can be an important consideration for at least the timing of resource allocation decisions, it would be unfortunate if markets felt it necessary to focus on these issues all the time, rather than their core businesses.
The policy authority also benefits from the fixed timetable, since there is no need to respond formally to every piece of new information. It is also helpful that there is the discipline of responding and providing commentary at each decision date. Even when no change of policy stance is necessary, and perhaps especially when that is so early on in the learning process, it is important that the MPC communicates to the markets why that is so. Without the discipline of fixed dates, it might be tempting to wait until there is something more to do and say. Or, possibly worse, it might be tempting to react to every new development, without the benefit of careful thought. The fixed timetable also provides useful discipline for the internal communication process; nothing focuses an organization better than the need to put arguments on paper for release to the public.
It is also helpful for policy makers to get responses from the markets at these specific times. At the least, contrary views can help define the research agenda. Issues of disagreements on the facts can be dealt with relatively easily. Issues of interpretation are more difficult, but the policy maker must always be ready to engage in the debate, if by doing no more than repeating consistently the story that blends the economic conjuncture (economic conditions as revealed in the data), the vision of how the economy operates and how policy decisions impact on that economy, and how the decisions taken therefore fit with the objectives of the IFT regime.
Let us now consider what information the MPC needs to make policy decisions. For virtually every country entering into an IFT regime, the starting point must be a world economic outlook, with special attention to economic conditions in the economies of important trading partners and sources of capital. It is by no means necessary to develop such an outlook internally, but members of the Staff must be assigned to monitor and report on external conditions and to provide a forecast of the implications for trade and prices. Special attention must be given to oil prices or significant commodity prices, depending on what is important for the domestic economy. Significant capital account developments, linked to developments in private and public debt or to major foreign direct investments, may also be important to the outlook generally and domestic investment demand monitoring. To understand developments with respect to the currency, there will have to be some consensus on the underlying real exchange rate path. This is easy to say, but not so easy to obtain.
9
Nevertheless, the interpretation of data and the consequences for policy must always be presented in the context of the underlying trend equilibrium paths.3
Turning to the domestic economy, the MPC will need to know about domestic demand and the nature of inflationary pressures. This will require some consensus on the level and growth rate of potential output, as well as a detailed monitoring of the components of aggregate demand. The notion of an output gap, the difference between aggregate demand and potential, provides a key part of the macroeconomic model of the links between economic conditions and inflation to be described below. Judgments on the level and likely future course of excess demand will be a key part of the background necessary for policy choices.
In most countries with an IFT regime, the policy instrument is some interest rate that can be set or influenced directly by the monetary authority. Often, the rate used in announcing policy decisions will be some rate that determines lending conditions in an overnight market including the central bank and large financial institutions. Broader short-term market rates that influence domestic demand are usually closely linked to the policy rate. Understanding the links between these and other market rates is necessary background, but whatever particular market rates are chosen for focus in the policy discussions, the policy maker will have to have some view of the underlying real equilibrium, in order to interpret the implications of particular choices for nominal rates. A particular level for nominal rates may be stimulatory or restrictive, depending on the underlying real equilibrium and the expected rate of inflation.4
Finally, since inflation, somehow defined, is the underlying focus of an IFT regime, the policy maker will need a complete monitoring of recent developments and the likely course of various measures of inflation over the policy horizon. In all cases, short-term monitoring of this sort will include attention to component detail and all useful indicators and other information, far more detail than would be incorporated into any macroeconomic model used to provide a vision of how the economy works and is influenced by policy choices.
We have stressed that monetary policy decisions are always made in an uncertain environment. It is important in the decision-making process that this be addressed explicitly. The MPC will not want just the best guess of the staff in terms of a baseline forecast. They will need, as well, a thorough discussion of the main risks to the forecast and the particular
3 The discussion in the rest of this paper provides suggestions as to how work on such topics could proceed.
4 Note that the equilibrium real rate of interest will itself move in reaction to shocks, so that nominal rates will sometimes have to change merely to keep monetary policy at “neutral” levels.

10
judgments made by the staff in arriving at the baseline forecast. Particularly important in this are the implications for the policy choices that must be made.
The process of assembling and presenting this macroeconomic view will depend on what information is available. Let us begin with a period when the full domestic accounts have been released. In this case, the Staff will have reviewed all the data and arrived, in consultation with the MPC, on a new base-line forecast and a new set of alternative scenarios based on various risks to the baseline projection. This exercise will include a review of all the underlying judgments about real equilibriums mentioned above. In most cases, the baseline projection will include a path for the policy rate consistent with respecting the IFT goals. The alternative scenarios will also contain information on the possible effects of shocks or risk scenarios on the policy choices. The MPC must consider all this information, along with all other available economic intelligence, and their personal views, in coming to a choice as to what to do. In the context of a quarterly report to markets, a full discussion would be expected, including the underlying views about external conditions and commodity prices, views about the state and future course of the domestic economy, and the implications for inflation. Policy changes must be presented as response to changing views on these matters in order to build a broader consensus as to how monetary policy works. Routine discussion will gradually build confidence and credibility, which will pay off when serious shocks arise.
Consider now how this process would change if the decision point were not one that included a complete release of domestic accounts. In such circumstances, the Staff will normally not be expected to prepare a complete new baseline projection. Rather, economic developments will be assessed relative to the existing baseline. All the components described above will be there, starting with changes to the external outlook and ending with the monitoring of developments and the short-term outlook for inflation. The MPC may want to see a review of the policy implications of these changes of view, perhaps in the form of analysis of the effects relative to the previous baseline of the new information or views, or a revision of the risk assessment. Communication of decisions would then focus on what has changed since the last decision point and how it has influenced the choices made. In cases where no change in a policy setting has been announced, this must be explained in terms of why the new information is within the compass of the previous scenario. Explaining if there is a change of view on the nature of the main risks or the balance of risks would also be useful in such updates.
III. BENEFITS OF A SUCCESSFUL IFT REGIME
There are several real benefits that can be derived from a successful IFT regime. These include:
1. Less uncertainty about the future price level and inflation.
11
2. More efficient allocation of resources because of better price signals.
3. Lower levels of unemployment and higher levels of productive economic activity.
4. Lower real interest rates and higher levels of investment (and permanent income).
5. Improved transparency and policy credibility.
The ultimate success of an IFT regime depends on how well the monetary authorities do at avoiding large boom and bust cycles and providing an anchor for inflation expectations. In a fixed exchange rate regime, the performance of the central bank can be monitored–internally and externally–by reference to well-defined targets, which are continually observable in real time. However, in a floating exchange rate regime with IFT, a central bank needs to rely on internal assessments to determine the appropriate policy stance. Moreover, a clear logical policy framework is needed to support the dissemination of policy to the outside world. This emphasizes the need for an internal structure that can provide the basis for assessments of the state of the economy and the nature of the underlying pressures challenging the achievement of the target. The decision-making process inside central banks can be improved considerably by the development of a structured FPAS. Indeed, we can identify at least six types of benefits that can be derived from a structured FPAS. These benefits include:
1. Improved communication between all people involved in the forecast and policy debates, leading to important synergies and the continual improvement of the process of coming to a collective view.
2. A more structured debate about the risks in the forecast, allowing policymakers to more easily identify and communicate the key policy issues.
3. The development of a database to assess the historical forecasting record, informing staff where new research effort is required.
4. The development of highly specialized human capital.
5. The development of institutional knowledge about the monetary transmission mechanism and the effects of disturbances or shocks that arise.
6. The possibility of greater transparency about the systematic component of monetary policy and how the forecast is developed.

12
The challenge for the institution is how to allocate its resources and structure the decision-making process to achieve these benefits. In what follows, we assume that the institution has a team of economists on staff, serving a central decision maker such as a Monetary Policy Committee. Our plan will involve organizing these staff into forecast teams, reporting to the MPC, that can produce and maintain various inputs into a projection process: databases; regular reports; assessment of current economic conditions and the near-term outlook; and, of course, the forecast itself. Our proposed structure is derived from the argument that a carefully structured process will be required for the staff to be able to provide the requisite internal advice to the MPC on how the economy is evolving and the appropriate policy response. This will involve being able to reassure the MPC that the staff have all relevant information at their disposal, and that they are able to extract the key messages from this information. The next section describes the building blocks for this process in more detail.
IV. CRITICAL PATH FOR DEVELOPING A STRUCTURED FPAS
This section provides a critical path for developing a structured forecasting and policy analysis system and the necessary expertise to use it. An important assumption of the proposed path is that management has a strategic vision of what the system looks like: who is involved; what resources they have; and how the information flows within the institution. If this vision is widely understood and accepted, then the system is able to exploit the synergies associated with a shared common paradigm and philosophy, enhanced data integrity, improved communication between staff and management, and the productive use of information technology. Furthermore, there must be recognition by all parties involved in the process that approaches that attempt to develop a perfect system too quickly, or parts of the system independently of other parts of the system, may be doomed to failure.
The initial systems proposed here are, by design, simple and should be extended as dictated by experience.
Step #1: Creation of a Small Forecasting Team with Well-Defined Responsibilities
The two main responsibilities of the forecast team are to ensure that the forecast process is internally consistent and that the near-term and medium-term forecasts are based on all relevant information. To achieve these two objectives, it is essential that the forecasting team has the support of management and can mobilize resources within the institution to help.
The responsibilities and focus of members of the Forecasting Team can be separated into two types: those that focus on developing near-term forecasts for the economy (current and next quarter), and those that focus on developing medium-term projections (as well as conducting alternative scenarios that are generated to highlight risks).
13
We make a distinction between near-term and medium-term forecasts for several reasons. First, in order to build and maintain credibility, the institution will need to be seen, both externally and by the MPC, to be able to forecast the near term reasonably well. Much of what determines near-term outcomes is often quite idiosyncratic, and therefore difficult to forecast by a macroeconomic model designed to capture stylized business cycle dynamics. Expert staff using detailed (often anecdotal) information will have a comparative advantage in forecasting the short-run outturns. Second, macro variables are usually quite persistent, which implies that an assessment of pressures underlying the economy will need to include an assessment of those pressures over the near term as well. It therefore makes better sense for a model-based, medium-term analysis to start when macro variables are freer to move in response to fundamental pressures. Although it is difficult to be precise about just when this might be, treating the first two quarters as the near term will work well in practice.
This implies that the near-term and medium-term forecasters have quite different roles. The role of the near-term forecasters is to assess the current state of the economy and to develop forecasts for the current and subsequent quarters based on all available information. By contrast, the role of Macroeconomic Projections Team (MPT) is to assess how the estimated disequilibria (or imbalances) in the economy will play out (and hence what pressures there will be on policy).
Within the first group, each forecaster should have a well-defined role, such as monitoring a particular sector. This might be usefully organized along the lines of national accounts expenditure groups, balance of payments, prices and inflation, money and credit, financial markets, and external conditions, hence achieving economy-wide coverage.
While this demarcation of responsibilities is necessary for the team members to work effectively, each member of the team should be aware of their responsibilities to the others. An essential part of this is providing feedback, as required, to ensure that the forecast process and scenarios are internally consistent.
While there should be well-defined roles, individuals should not be asked to play the same role indefinitely. There should be ongoing training to ensure that when someone leaves another is ready to take over.5 This is necessary for the integrity of the system over time and to ensure that motivation is kept high. Indeed, each group that supports the forecast should
5 Because the skills necessary to support an efficient FPAS can be very specific and highly specialized, most of the training is best done informally by more experienced staff or by the managers of the small groups. It is important that senior management not just reward people who are good at fighting fires; they must also reward people who spend time training and coaching staff in new tasks. This will improve the system over time.

14
have positions devoted to longer-term projects, training, or backup for the forecast role. For human-capital development, it would be useful if the staff in these groups interacted with the research staff in the division assigned to execute longer-term projects. Furthermore, to exploit the benefits of information technology, all staff involved in the IFT system should have direct access to support resources (programmers, research assistants and database managers) assigned to assist them with their tasks.
Appendix 1 provides an example of how the responsibilities of the Forecast Team could be defined and organized and how they could report to the Monetary Policy Committee. As mentioned above, while the Forecasting Team should have well-defined responsibilities, the exact composition and the responsibilities of individual team members should depend on the expertise of the available personnel and the other trained resources that the FPAS system has its disposal.
Step #2: Development of a Database System Designed to Support Monitoring and Near-Term Forecasting
The first task of the Forecast Team should be to develop a Historical and Near-Term Forecasting (HNTF) database. This database forms a common point of reference for discussions between staff and management. It also forms the basis for trying to assess trends and make judgments about what is signal and what is noise in the latest data outturns. Until it is completed, it will be very difficult to develop a reporting system, or to impose consistency and transparency in the forecast process.
This database should include the key macroeconomic aggregates that are used to monitor and forecast the economy. For an FPAS designed explicitly for IFT, it should also include extra detail to provide the basis for assessing and forecasting trends in the real economy and core measures of inflation. Appendix 2 discusses database management issues in more detail and the relationship between the HNTF database and other databases that need to be created to support IFT. The HNTF database should include the sector specialists’ near-term forecasts for the first two quarters of the forecast as well as historical time series.
The database should be updated weekly and be accessible to everyone who is involved in the forecast and decision-making process. The process of weekly updates forms the basis for continual ‘filtering’ of new information, providing staff with the ability to systematically account for how and why a new outturn affects their view of the state of the economy. This involves discussions of data problems, special factors, and many of the technical aspects that are central to extracting trends from data. The output is information that can be used in formal reports to management and the public (such as Situation Reports and Inflation Reports). These discussions also lead to the important ‘stylized facts’⎯the staffs view of how the economy works⎯which a formal macro model should be able to mimic.

15
It is important that clear lines of responsibility be established for updating the database, for explaining and documenting how the data are constructed, why the data have changed, and any special factors that might have affected them. Each weekly database should be stored permanently so that they can be analyzed periodically. This will provide measures of the uncertainty in the near-term forecast and may indicate where the near-term forecasting system can be improved.
Step #3: Development of a Weekly Reporting and Intelligence System
The HNTF database serves as the foundation for a weekly reporting system. A weekly report to management ensures that new information is assessed systematically, and should reassure the MPC that they have a command of ongoing developments in the economy. This weekly reporting system will include a standardized set of tables and charts, and will provide the basis for discussing risks associated with the last official forecast and other more recent monitoring.6 Indeed, within hours of the database update, the chief economist (or a designated backup) should chair a short meeting with the staff and forecast team to discuss possible revisions to the near-term outlook. Shortly after this meeting, the chief economist should report the information to the MPC and explain how the recent data and other anecdotal evidence have suggested changes to the near-term outlook. If the process is working well, it will help ensure that no action is taken in those situations when the outturn is judged insignificant noise, but where policymakers will react to an apparently extreme development, even if this were not one of the fixed decision dates.
These meetings are intended to provide a regular forum for upper management to ask specific questions and to probe the staff’s interpretation of the data (and any related implications for the near-term forecast and monetary policy). All members of the Forecast Team should therefore be present at key meetings with the MPC. The chief economist should also invite other staff members if questions are likely to be posed that require their specific expertise.7
In addition to improving communications between staff and the MPC, the reporting system should provide benefits for the staff themselves. First, it should provide a forum in which staff can understand how new information leads to changes in the very near-term forecast. Second, it will help focus attention on the links required between the actual consumers and producers of data⎯that is, part of the reporting process is to provide incentives for ongoing contact between staff at the central bank and at the statistical agencies.
6 It is important to note that this database system is not intended to replace existing systems for managing the reporting and release of even higher frequency data.
7 This will also have the benefit of giving the staff some exposure to the deliberations of the MPC.
16
We have described weekly meetings as a default option, which raises two issues. First, depending on staff and MPC structure, this may prove to be quite demanding. There is some flexibility here to work with less frequent meetings, and we trust it goes without saying that if resource demands mean that the quality of the information to the MPC suffers then changes would be made. Second, there is the risk that staff and the MPC may become focused on immediate concerns or very recent data, causing them to focus on the noise rather than the signal. This is an ongoing risk with economic forecasting. We are inclined to think that it will be easier for staff to stay on top of recent outturns with more short meetings rather than fewer longer ones, since at the higher frequency there will be fewer outturns to consider. Whether the meetings are weekly or less frequent, the most important question is whether there is any new information that would lead staff to change their view.
We also see these meetings as somewhat independent of the policy decision cycle. The frequency at which the MPC changes the monetary instrument will generally not be a staff decision—in some countries, the MPC may not be bound by a fixed decision calendar at all. In advanced economies, the underlying shocks will tend to be ‘fundamental’ in nature, whereas in emerging market economies the policymakers will have to deal with confidence shocks and potentially large swings in asset prices as the result of shifts in portfolio allocations as a result of preference shocks. For this reason, we favor the weekly frequency for reports to the MPC, as much of the relevant information will be informal in nature and the MPC will need to feel well-informed about potentially fast-changing circumstances. Indeed, part of the transition process will involve building up the credibility of the institution and the IFT framework through clear and well-informed communications with private sector commentators.
Step #4: Creation of a Repository for Written Documents
It is important to learn from experience and to incorporate available information as efficiently as possible. In order to develop this sort of institutional knowledge, it is important that staff document data problems, special factors, changes in procedures, revisions to data, models etc. In addition, these written documents provide an invaluable resource for new staff as they attempt to learn new tasks or improve on existing ones. The repository system should be simple and the notes should be accessible to everyone. A very simple system is proposed where internal research notes (RNs) are distinguished from memos (MEs), but both are stored in a specific location that staff and upper management can access. This process can be facilitated by computer technology, but it is important to keep the system that manages the repository simple initially when the quantity of written documents is fairly small. As with other aspects of the system, it is more important to get something working as quickly as
17
possible rather than spending too much time and resources trying to develop the perfect system.8
Step #5: Development of a Simple Model of the Economy
A natural extension of the system when these elements are in place is to express the institution’s view of the way the economy works in a formal model. It is essential that the model reflect the views of policymakers for it to be considered seriously in policy discussions. Of course, the staff must also have confidence that the model’s properties are defensible. In the early stages of working under an IFT regime, it will probably be much easier to achieve this consensus with a small model, with a view to elaborating it over time in response to questions that need to be addressed in policy debates. It is much better that a simple model is introduced as soon as possible, rather than aiming to introduce a complex model in one, long step. Even in the longer term, carefully-considered analysis with a simple model will prove to be far superior to badly-coordinated and under-resourced analysis with a complex model.
The core model’s purpose is to aid staff in interpreting the implications of the state of the economy provided by the near-term forecasters. The model’s insight and usefulness come from ensuring some degree of macro consistency in the projection process. It should not, however, be treated as a ‘black box’⎯in particular, staff should always be aware that there are important uncertainties in the model’s assumptions and should attempt to understand the implications of these uncertainties for policy. The model should be improved over time, but always with the requirement that it remain clear and be widely understood.
Step #6: Exploring the Implications of Risk and Uncertainty in the Forecast, and Highlighting this Uncertainty to the MPC and Externally
One of the main advantages of using a core model in the projection process is that the model can provide a logical foundation for studying the policy implications of uncertainty. Indeed, the potential strength of models designed to support IFT is not that they can forecast the economy accurately, but that they can be used as organizational devices for developing strategies for dealing with uncertainty.
8 For central banks that have a small number of documents the simplest system would be to create searchable web pages that staff assistants can easily update.
18
One useful step would be to compute confidence levels around the forecast.9 This serves to remind both participants within the institution and market observers that forecasts are not exact, and hence that policy decisions should not be swayed by small errors. In essence, the monetary policymaker lives to fight another day, by re-assessing new information and re-setting policy accordingly. On the other hand, this process can also be used to illustrate specific risks around the official baseline forecast in order to warn market participants in advance about how monetary conditions might need to change in response to new information. By highlighting the risks and uncertainties surrounding the forecast, the institution will find it easier to communicate these points to observers and to deal with the effects of larger shocks as they arise.
V. THE QUARTERLY PROJECTION EXERCISE
The quarterly projection exercise has a number of objectives. These include: (1) producing an internally consistent, medium-term baseline forecast; (2) assessing risks and uncertainties in the forecast; and (3) providing a regular forum for the deliberations that are necessary for the MPC to develop strategies for implementing monetary policy. The quarterly projection exercise should be completely open and transparent to all involved; this can be facilitated by a series of meetings and written documents that are circulated before and after the meetings.
The role of the Leader of the Forecast Team is to manage the projection process and to organize the meetings that will inform all participants about how the forecast is being constructed. The quarterly exercise could be organized as follows:
Step #1: Production of the Forecast Calendar
The first step in the quarterly projection process is to produce and circulate the forecast calendar. The Leader of the Forecast team should circulate a preliminary version of the forecast calendar to the MPC and the staff at least 8 weeks prior to the release of the national accounts, to be finalized within a week.10 This means that all of the key meetings can be scheduled well in advance, so that both staff and management can plan accordingly.
9 Chen and others (2009) and Clinton and others (2009) provide examples of how to construct model-consistent confidence bands that respect the zero interest rate floor. See www.douglaslaxton.org for the code.
10 We assume that the release date of the national accounts is the trigger date for the quarterly forecast schedule. Obviously, central banks that do not have a regular quarterly updating of the national accounts will need to choose a different trigger based on the expected release dates of key pieces of information.

19
The first date in the forecast schedule⎯the Issues Meeting⎯should typically be about two or three weeks before the release of the national accounts. The quarterly projection exercise finishes when the MPC signs off on the baseline forecast and risk assessments. This final, ‘big picture’ forms the basis for the forecast book.
Step #2: Production of the Issues Paper (2 Days before the Issues Meeting)
Three days before the Issues Meeting, staff and members of the MPC should submit issues to the Leader of the Forecast Team in the form of written memoranda. The Leader of the Forecast Team should then assemble these smaller issues notes into a complete Issues Paper. We can usefully think of the material in the Issues Paper under three headings:
• changes in the staff’s view of how the economy is working and consequent proposed changes to the model’s structure and properties;
• long-run or equilibrium issues, such as structural imbalances, the trend real exchange rate, potential GDP etc.; and
• implications of recent data for the near-term forecast.
The Issues Paper should be circulated at least 2 days before the Issues Meeting. After reading it, staff and members of the MPC should be aware of the concerns of all people involved in the Quarterly Projection Exercise.
Step #3: The Issues Meeting (2 or 3 weeks before the release of National Accounts)
(Attended by the MPC, Forecast Team and Sector Specialists)
The exact date of the Issues Meeting will depend on the time required to consider the topics in the Issues Paper, but would usually be two or three weeks before the release of the national accounts. The Issues Meeting should be chaired by the chief manager of the FPAS, or the person on the MPC who is responsible for the process. This person must ensure that the points from the Issue Paper are worked through. If an issue is deemed to require further thought, additional analysis may be requested, either for immediate action or for future Issues discussions. After the Issues Meeting, everyone involved in the projection exercise should have a good idea about how the quarterly projection exercise will proceed and what the key assumptions will be. However, they will also be aware of differences in views, and this information will be essential for preparing the risk assessments.

20
Step #4: National Accounts Meeting (The day the National Accounts are released). (Attended by the Forecast Team and Sector Specialists)
Shortly after the release of the national accounts there should be a meeting with the people responsible for producing the national accounts. This meeting is to assess data quality and to collect any background information that people in the statistical agency might have on special factors that have influenced the data. A short document should be written that summarizes these discussions.
Step #5: The Near-Term Forecast Meeting (1-2 Days after the Release of the National Accounts).
(Attended by the MPC, Forecast Team and Sector Specialists)
Shortly after the national accounts meeting, staff should update the near-term forecast and present the implications of new data and anecdotal information to the MPC. At this meeting, there should also be discussion of the risks to the near-term forecast and any related risks they might pose for the medium-term forecast. This meeting and the update of the HNTF database provide two of the essential building blocks for the first round of the quarterly projection. It is important to emphasize that the purpose of this meeting is to lay the foundation for the rest of the quarterly projection⎯that is, to assess the current state of the economy. Members of the MPC should be able to question the staff’s judgment and to suggest changes to the basic assumptions that will be used to generate the near-term part of the official forecasts. The intent here is to make near-term forecasts only for those variables that can be assumed to be unresponsive to changes in monetary conditions. Variables such as interest rates and exchange rates should be allowed to adjust in response to changes in the official short-term policy rate.
Before the official forecast is finalized, the near-term forecast should be updated based on any new information that has arrived. In normal circumstances, this update should be relatively minor. However, in extenuating circumstances, the update may require a slight extension of the forecast schedule. Therefore, after the near-term forecasting meeting, everyone involved should have a clear picture of the basic assumptions of the near-term outlook and be aware of what sorts of new developments would cause a change in view.
Step #6: The First Medium-Term Projection Round (Round 1)
In what follows, it is assumed that a good forecast is not produced in one step but requires several iterations. Each iteration, or round, should serve to highlight inconsistencies in the forecast and build a consensus view about the pressures on the economy and the response of policy. Unless there are extenuating circumstances, it should take about five working days of

21
projection rounds for the forecast to converge. This should not be taken as a fixed rule, but if the quarterly projection rounds take much longer than five working days to complete, there may be problems that need to be rectified to make the process more efficient.
The first round serves the purpose of building on the near-term forecast and assembling all the information required to derive implications from that forecast and the other exogenous assumptions for the medium term. This cannot be expected to be fully consistent⎯that will be ensured by subsequent rounds. The objective is to gain a first impression of the medium term. Hence, the emphasis is upon making sure that all information is brought to the attention of everyone involved in the process.
Formally, directly after the HNTF database has been updated, the Macroeconomic Projections Team (MPT) updates the estimates of the equilibrium measures that are used in the Quarterly Projection Model and then employs the accepted forecasting rules (agreed upon in the Issues Meeting) to derive the first round of the medium-term projection. The results of this round and all future rounds should be available when the staff and members of the MPC arrive each morning.
The reports circulated with each quarterly projection round should be transparent about the assumptions used to generate the results. Indeed, each person involved in the process should be able to access a system that will allow them to incorporate changes to the assumptions and to produce scenarios based on their own judgment.11 After discussing concerns with staff and members of the MPC based on the results in the previous projection round, the Forecast Team should meet at about11:00 a.m. for approximately 60 minutes to discuss any suggested changes that they should make to the baseline forecast. Because one of their key roles is to ensure that the projection exercise is internally consistent, the baseline scenario should not be changed unless that represents a clear consensus on the part of the MPC. If suggested changes make the forecast internally inconsistent with other maintained assumptions, then these new changes can be considered as potential starting points for (completely separate) alternative scenarios. These scenarios will highlight and quantify risks in the official baseline scenario by showing the implications of an alternative assumption for policy. By 1:00 p.m. each day, the MPT should have clear directions from the Forecast Team about the types of judgment that they wish to impose in the next projection round. The job of the MPT is to then construct and circulate the results for the next projection round so that it is available the following morning.12
(continued…)
11 A complete model-based prototype FPAS is available at www.douglaslaxton.org
12 To ensure that each round is ready in the morning and the forecast cycle is respected, some overtime (or shift work) by a couple members of the MPT may be necessary. Staff should be

22
Step #7: Imposing Judgment in Subsequent Projection Rounds
In subsequent projection rounds, it is the role of the Model Operator (MO) from the MTP to incorporate judgment through the residuals (or the add factors) of the model. This judgment usually arises from the need to refine the aggregate picture produced in earlier rounds; the model should show up inconsistencies between assumptions, leading sector experts to adjust their own assumptions in the light of their effects on the broader picture.
Judgment should be added in small increments. After the daily meeting with the Forecast Team, the Model Operator should prepare a series of mini-projection rounds (Round 1a, 1b, etc.) that add judgment incrementally so that it can be quantified and its impact understood. When these rounds have been signed off by the Leader of the Forecast Team, they should then be circulated so that they are available when the staff arrives the following morning.
After each projection round (Round 1, 2, 3…) a set of standard reports should be circulated along with a summary of the changes made to the forecast round and the reasons for these changes. Each daily report on the development of the medium-term projection should show how the current round has changed from the previous round, as well as provide information that shows how it differs from the last official forecast.
While generally the case for judgment comes from looking at the aggregate, ‘top-down’ perspective coming out of the forecast, in some cases it will be useful to take a ‘bottom up’ perspective. Satellite models designed to provide details about specific sub-components should be used to check the consistency of the aggregate picture. For example, if the core projection model contains an aggregate Phillips Curve that is based on the CPI, it would be important to check the consistency of this forecast with other models that include explicit interactions between wages, producer prices and the CPI. If the core projection model contains an aggregate equation for output gap, it would be necessary to check the consistency of the projection with models that attempt to disaggregate the GDP forecast into smaller expenditure components. The choice of how disaggregated these components should become depends on how useful they are judged for monitoring the state of the business cycle, accounting for special factors, or linking the forecast to specific assumptions about external demand conditions. Appendix 3 provides a flow chart that shows the interactions between the core projection model and the satellite models.
compensated for this overtime in some way (perhaps, time off in lieu) to prevent burnout and to make the positions attractive enough that someone can be convinced to take them.

23
Step #8: Forecast Presentation.
(Attended by the MPC, Forecast Team and Sector Specialists)
It should take about 5 working days of projection rounds for the forecast to converge. At the end of this period, there should be a final meeting with the staff and the MPC.
The presentation by the staff should be at a high level and focus on the main story line. What is desired is a coherent, systematic analysis, starting from external conditions and moving to the outlook for the domestic economy and the implications for policy. The presentation should use simple charts that illustrate the main points. Especially important is to highlight what has changed in the facts or in the judgments of the staff. The presentation should start with the near-term outlook and then move to the medium-term outlook. It is recommended that the presentation be made by one person; but that specialists be called on to amplify important points or reply to questions. The presentation should conclude with a discussion of some of the main risks that have been considered formally.13
By the end of this meeting, the MPC should provide guidance to the staff on the following questions: What changes are necessary for the forecast to become an official forecast? What risks do they wish to highlight in the Risk Section of the Forecast Book?
After the meeting with the MPC, it should take no more than 2-3 days to lock in the official baseline forecast and to prepare the alternative scenarios.
Step #9: Documenting the Forecast Process and the Scenarios
The next step is to write a short forecast book that explains the assumptions used to generate the forecast. This book should provide a summary and presentation of the forecast. If the model has been revised, the model documentation should be updated. These are two areas where Information Technology can streamline these processes and allow the staff to complete these tasks in a timely manner. In addition, the document that explains the objectives of the forecast process should be revised if any changes were implemented during the projection process or any new changes have been approved by the MPC.
13 Especially early in the learning process, it would be useful for the staff to have a “dry run” to make sure the presentation is clear and within the time constraints.
24
Step #10: Post Mortem Meeting.
(Attended by the MPC, Forecast Team and Sector Specialists)
The last step is to have a meeting that discusses what went well and what needs to be done to improve process. Concrete action plans should be created at these meetings aimed at improving the system over time. The issues discussed in this meeting could range in complexity from changes in procedures or model structure or the database and management information system to much larger issues such as the development of the next generation of models that are being designed explicitly to support IFT.
VI. THE CORE MODEL
Up to this point, we have been vague about the kind of core model we recommend for the FPAS. The process described in the previous section and the steps outlined in Section IV will remain essentially unchanged no matter what sort of model is used. In this section, however, we describe in more detail the sort of model that could be used.
There is no such thing as the perfect model. All models, even complex ones, are heroic oversimplifications of the real world. Moreover, regardless of what type of model is being created, the staff will not create a final product at the first attempt. Models always need maintenance as more is learned about their properties, and conditions change. It is important to get something operating as soon as possible so that the whole institution can learn from its use. A particular problem is that the staff may have in mind a more complex model they would ultimately like to use in the FPAS. The staff should not let a preoccupation with the perceived ideal model stop them from establishing a simple working model or the other elements that make up the FPAS (the database, reporting systems, and so on). It is far more important in the early stages of an IFT regime to establish a relationship with the MPC and ensure that the MPC is comfortable with the forecast process. The first goal should be to establish a forecast process that provides the MPC with the reassurance that they will not be caught out by information that was not well incorporated into the analysis. Typically, policymakers are much more comfortable and realistic about the idea of making a series of small mistakes, but become much more uncomfortable with making large serially correlated errors. The core model is only a part of this.
Two further points bear emphasizing. First, it is important that the core model should be focused on the task of inflation-forecast targeting. In this respect, the key value of the model is its ability to help the MPC proceed from the assessment of the state of the economy to the implications for the desired stance of monetary policy. Second, the core model should reflect the view of the MPC about the workings of the economy, always guided, of course, by the advice of the staff. Clearly, both sides need to have some confidence in the model’s

25
properties for the process to work. Hence, we emphasize that the system can and should be kept very simple, at least initially. In the early stages of an IFT regime, it will be easier to come to a consensus view on the nature of the economy when the model is small, probably with only a handful of behavioral equations linked to some key accounting identities. It cannot be stressed enough that the MPC must understand and accept that the model provides a reasonable characterization of how the economy works and how policy works. Otherwise, there will always be a cloud over things the model does best, like risk analysis.
Given a near-term forecast for the next two quarters and a consistent measure of the output gap, the FPAS could be supported by something as simple as a small ‘gaps’ model that attempts to provide consistent projections for real GDP, inflation, market-determined interest rates and the exchange rate.14 We provide the skeleton of such a model in Appendix IV. Such a model completely abstracts from issues about the supply side, fiscal solvency, private wealth, and the equilibrium levels of the real exchange rate and interest rates. These are no doubt important, and views about them would have to be brought to the table as part of the forecast and policy discussions. Nonetheless, the use of a simple model would immediately help to start a dialogue between the staff and the MPC about such issues as the appropriate policy response to the inflation forecast, and the pros and cons of various assumptions and alternative scenarios. The effort in the early stages should be on building a relationship with the MPC that exploits the value added from being able to talk through counterfactual experiments using the model. This would also allow the staff to discuss uncertainty in the inflation forecast, and the risks to any proposed policy decision.
Because a small gaps model abstracts from so many issues and deals only in broad aggregates of inflation and output, demand will probably arise soon from the staff for an expanded or more complete model. This can present a number of dangers. There is a tendency for the projection model to evolve in an ad hoc manner, which usually results in a model that is expensive to operate and maintain. More damagingly, the addition of detail usually comes at the cost of clarity and insight, so that the model becomes something of a ‘black box’. Not merely is this a problem for staff⎯all but a few staff will effectively become excluded from the forecast process⎯it is potentially very damaging to relations with the members of the MPC, who, when unable to find a clear story in the model-based forecast,
14 If creating a small macro model is not possible in the very beginning, the core model could be just a benchmark inflation-forecast-based reaction function, which would say that policy must tighten if inflation is forecast to remain above the target rate for some time. See Appendix IV for an example of such a reaction function.

26
will be inclined to resort to their own judgments and anecdotal evidence, which would risk compromising consistency in the published forecast.15
If there is to be a larger model, it should not aim to provide just more disaggregation. This can be handled separately in ‘satellite’ models, while preserving the simplicity and clarity of the core model (see Section VII). Instead, any development should be to provide more structure by which to provide insight to the policy decisions. One example might be adding an explicit treatment of the role of oil or commodity prices in the inflation process. This can be done within the gaps model framework.16 Other elaborations, such as adding a labor market, would also be possible within this framework.17
The shift from a gap model to dynamic general equilibrium models with such features as stock-flow dynamics and forward-looking expectations is far from trivial.18 It requires highly specialized human capital, powerful computers and solution software, and very large demands on data sources. It will also take some time to build such a model, even under ideal circumstances. As an intermediate solution, it may be useful to develop add factors to the aggregate demand and supply schedules that have a structural reasoning behind them. As an example, one that could be very relevant in transition economies undergoing large fiscal adjustment⎯is to use the gap model in conjunction with an added composite indicator of fiscal stance. This would measure not just the expenditure component of government spending, but provide an estimate of the likely demand effects that arises when households’ intertemporal assessment of government policy is made. That is, any change to aggregate demand because of a change in government spending will depend on not just the initial expenditure, but also how households assess the impact on the present value of their labor income (i.e., what taxes are likely in the future) and the extent to which government debt is net wealth. This will depend on the extent to which households have finite horizons, how impatient they are, and the anticipated pattern of future taxes and deficits. In general, there will be important questions involving future potential growth that can only be answered in a
15 Indeed, it is recommended that the MDG create a web-based system that allows users to modify the assumptions used in the official projection process in order to generate their own scenarios. This will increase awareness of the model’s properties, help individuals outside the MDG to engage in risk assessments, and limit the risk that the model will be seen as a black box by outsiders.
16 See, for example, the model described in Berg, Karam and Laxton (2006a,b). See Carabenciov and others (2008, 2008a, 2008b) for examples of these small monetary policy models estimated with Bayesian techniques.
17 See, for example, Coats, Laxton and Rose (2003).
18 See Laxton (2008) and Kumhof and Laxton (2007) for examples of DSGE models designed explicitly for policy analysis.
27
more complicated general equilibrium setting, but nonetheless a simpler composite indicator would enable a first pass to be taken at the appropriate counterfactual experiments.
The use of such indicator variables also provides some practice at working with more structural issues. This can make the transition to larger general equilibrium systems easier for staff. The advantage of the larger models in the context of an IFT regime is that they can provide a more careful articulation of the relationship between private agents and monetary policy. This implies moving to models with careful specifications for the motivations of private agents, their intra- and intertemporal constraints, endogenous policy reaction rules, forward-looking expectation structures, and appropriate arbitrage conditions. In a small open economy, there may be important issues relating to tradable- and nontradable-goods sectors. Staff will therefore need to be careful that they have the necessary data to work with a model with tightly specified fiscal accounts and stock-flow relationships.
VII. THE ROLE OF MODELS IN THE FPAS
As was suggested earlier, there is a potential role for more than one model within the FPAS. This section contains a proposed structure for using several models to assist in the preparation of inflation forecasts. The approach emphasizes the benefits of using many models, each carefully tailored to specific purposes. Indeed, once a small gaps model is established, there are probably greater potential gains to be made by adding the sorts of models described here than by moving to a more complex core model.
Behind this argument is the view that no one model will be able to do everything. Any model designed with that intention in mind would be hopelessly complicated and intractable, and therefore would not add any value to the forecast process. Models do not add value by mimicking the data, but by providing insight into the economic phenomena that might lie behind the data. Models should be treated as tools that allow economists to systematically address issues that they might otherwise miss. In order to provide this sort of insight, models should be as simple as possible; the most obvious way of bringing simplicity to models is for them to be carefully designed with specific criteria in mind.19
This approach, when taken to heart, means that the model builder may happily ignore some features of the data for a given model. This is in contrast to traditional approaches to econometric model building, which emphasize finding the ‘true’ Data Generating Process
19 In particular, for use in an IFT regime, the model must describe a complete macro system that includes a description of the way policy decisions influence the economy. We would add to that the requirement that the model not allow agents to make persistent systematic expectations errors.

28
above all else.20 Indeed, when designing models to support an inflation-targeting framework one of the easiest traps to fall into is to model features of the data that are in fact purely spurious. This usually guarantees many unproductive hours spent re-estimating the model in a futile quest to uncover the ‘true DGP’.21
With that in mind, we can think of using a collection of models that allow us to build up the forecast profile. That is, we want to paint a broad picture that starts with the question “Where is the economy now?” and moves to “Where does it need to go?” In doing that, the Forecast Team will need to answer a variety of questions, such as how much inertia there is in current trends and how close to equilibrium various sectors and markets are. This process helps the MPC answer the most important question of all: “What does monetary policy need to do to accomplish its inflation and stabilization objectives?”
We can usefully arrange this in the form of a timeline, running from the short term to the medium term (see Figure 1). Monitoring and near-term forecasting models are designed to capture short-run trends. The basic premise behind this idea is that there are important real and nominal rigidities in the economy that imply that the data have a certain amount of momentum from their current short-run trends. These rigidities help us to forecast the near term. The degree of inertia will vary from sector to sector; asset markets are famously volatile and able to reverse trends quickly, while labor and product markets tend to adjust more slowly. The models used for capturing these aspects of the data will typically be small, time-series models⎯often univariate⎯that are cheap to estimate and maintain. They provide an important insight into the likely path of the economy in the near term, but, lacking any structure, provide no insight at all about the reaction of the economy to economic imbalances or to how the economy might respond to economic policies.
20 Individuals who have inherited responsibility for large-scale, econometric models to do IFT have sometimes described the forecasting process as equivalent to attempting to teach a dinosaur to jump though hoops. This is, in part, because the ‘testing-down’ procedures relied on to build such models to have either eliminated the monetary transmission mechanism, or diminished the role of monetary policy to second-order effects. If monetary policy has no effect, using it to implement IFT can be extremely problematic.
21 One of the best examples of such a mug’s game would be to ignore the Lucas critique by assuming that historical estimates of inflation persistence embodied in reduced-form Phillips curves are structural and then using the estimated model to evaluate the benefits and costs of providing a successful anchor for inflation. Since a key objective of an IFT regime is to change how agents form expectations, such ‘estimates’ will be misleading at best. Alichi and others (2009) provide a model based on endogenous policy credibility where the weight on lagged inflation in the Phillips curves is reduced when the monetary authorities develop a track record in producing low-inflation outcomes.
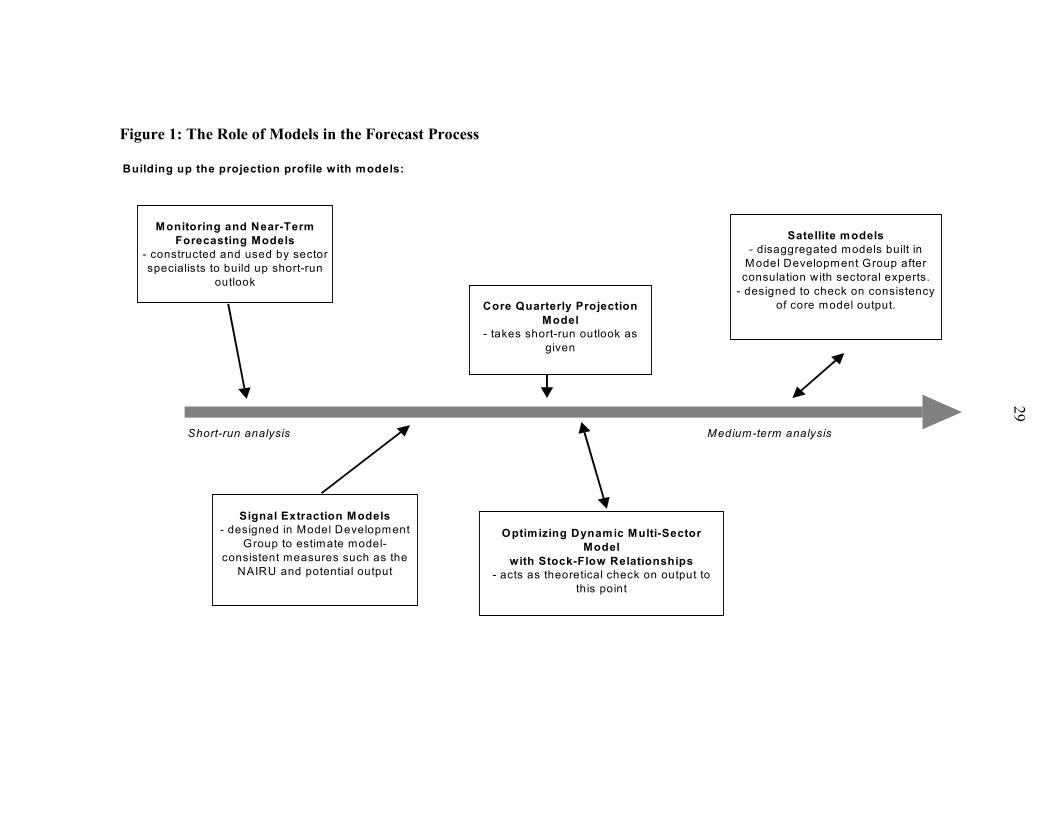
Figure 1: The Role of Models in the Forecast Process
29
Building up the projection profile with models:
Short-run analysis Medium-term analysis
Monitoring and Near-Term Forecasting Models
- constructed and used by sector specialists to build up short-run
outlook
Signal Extraction Models - designed in Model Development
Group to estimate model-consistent measures such as the
NAIRU and potential output
Core Quarterly Projection Model
- takes short-run outlook as given
Optimizing Dynamic Multi-Sector Model
with Stock-Flow Relationships- acts as theoretical check on output to
this point
Satellite models- disaggregated models built in
Model Development Group after consulation with sectoral experts.
- designed to check on consistency of core model output.
30
Given a picture of likely short-run trends, we need to form a view on what this implies for the state of the economy. Here we use signal extraction models to provide insight as to how the current cycle compares with a typical business cycle and to ask what part of the short-run trend represents a permanent trend (which we might associate with supply) and what represents a mean-reverting component (which we could think of as a cyclical demand effect). Because an important objective should be to impose consistency in the projection scenarios, the methodology for measuring the output gap should involve developing efficient and robust measures of these unobservable variables that are consistent with the underlying structure of the core Quarterly Projection Model.22
Now that the staff have a picture of the likely short-run scenario and the key pressures in the economy (such as the state of excess demand in the goods market, as measured by an output gap), they are in a position to use the core Quarterly Projection Model (QPM) to create a medium-term scenario. This model must be designed to help the staff draw a link between the current pressures in the economy and the implications for monetary policy. In particular, in the scenario the model will generate a policy response consistent with the IFT regime, one that respects both the judgmental starting conditions and the model’s logic concerning medium-term equilibration forces.
Of course, if there are issues in the forecast that relate to permanent real shocks (such as implied by changes in fiscal policy) or if there are important sectoral issues arising from relative prices, such as the terms-of-trade, the staff might want to have a more elaborate model. As noted, added complication brings with it the risk that issues become more difficult rather than easier to address clearly. One way of ensuring that the core Quarterly Projection Model does not lose consistency and that any new developments add economic insight (rather than simply more detail) is to build and maintain an optimizing dynamic multi-sector model. This sort of model can provide a theoretically tight framework that can be used as a check on the consistency of the core QPM. If the core model were the sort mentioned above, then the optimizing model would provide a check on intertemporal
22 For a brief discussion about how model-consistent estimates of these unobservable variables can be developed using a constrained maximum likelihood approach, see Appendix IV. Such measures are much more efficient for forecasting than the measures derived by univariate models that ignore the links between inflation and the economy. Moreover, such measures will result in more robust policy analysis. See Laxton and N’Diaye (2002). Carabenciov and others (2008, 2008a, 2008b) have now extended this approach for measuring all the latent variables in the model using Bayesian techniques. While we emphasize that such methods can be an enormous leap forward beyond naive measures based on univariate filtering, in real forecasting exercises these equilibrium measures should be chosen on the basis of a much larger information set and in a manner that is consistent with the near-term forecast.
31
constraints (wealth issues), the effects of real side shocks (such as changes in fiscal policy), and any other issues relating to structural adjustment and long-run equilibriums. Insights from such models can be incorporated into a medium-term projection from the simpler model using judgment.
This sort of model can also act as a working prototype for developments on the core model. However, a theoretically tighter optimizing model will be best at dealing with permanent effects of changes; it may produce quite unrealistic dynamics because modeling rigidities in adjustment is the weakest part of theory and attempting to do so may make those models unnecessarily complicated. Dynamics from optimizing models can often have unfortunate implications. For example, a model with purely model-consistent expectations where all variables are ‘jump’ variables may imply that there is a negligible short-run trade-off between output and inflation, or further that there are no costs associated with disinflation or volatile policy. The challenge when expanding the QPM is to retain the appropriate short-run nominal and real rigidities when incorporating the features of the optimizing models. This can be an ambitious undertaking, hence it may be more practical to work with a simpler model as the core QPM in the interim and use the optimizing model as a check on theoretical consistency of the results, particularly in the medium term. Nonetheless, the optimizing model provides a way forward for expansion of the QPM, adding a distinction between tradable and non-tradable goods, incorporating intermediate goods into the production process, modeling a proportion of households as income-constrained, dealing with stock and asset equilibrium issues, and paying careful attention to the nature and scope of government in the economy.
None of this implies that the core QPM should be disaggregated for the sake of it. Instead, disaggregation into national-accounting components can be accomplished more easily and cheaply by satellite models. These are small subsystems that would use simple rules of thumb, based on observed historical patterns, to decompose the output from the core mode into various subcomponents. Hence, a household consumption satellite might take the path for model consumption and break that down into paths for consumption of services, non-durables, durables, and ‘super-durables’ such as expenditure on housing stock. This breakdown can be accomplished based on knowledge of long-run ratios and estimated dynamic patterns for each of the subcomponents.23 The satellite models will therefore provide output that may be more accessible and easily understood, and can be checked by 23 Note, however, that in the case of a transition economy, these historical patterns should be treated with caution. For example, when financial and housing markets are deregulated one might expect large shifts in the ratio of housing expenditure to overall household consumption. Under such circumstances, model builders may find it more useful to look at the corresponding evidence for more developed economies.

32
sector analysts for consistency with previous experience. In some cases, there may beidiosyncratic events for subcomponents known in advance, and this could mean that the staff may wish to revise the aggregate path.
quite
24
These models therefore form part of a process for the forecast. The benefit of this proposed structure is that the aggregate QPM forms a general overview of the economy, and can therefore be kept very simple and transparent. This is important for the forecast process. It also has the benefit that the core QPM can be easily used for policy analysis. As for the forecast process, it makes no sense to expect that one model will always be suitable for all policy questions. However, it can be very useful for internal communications with the MPC to be able to ask general hypothetical questions of the same model that they see used for the forecast round. By keeping the core model as simple and transparent as possible, we can pose questions directly to it and get fast, easily interpreted answers.
Figure 2: From Policy Issues to Policy Recommendations
Core model for medium term projection
Policy issues Policy recommendations
The forecast process, however, is made possible by supplementing this core model with the other models we have discussed. The process looks something like the picture in Figure 3. This shows how the sector specialists would start by interpreting the data, using the short-run indicator models, and then use that—in conjunction with a set of starting assumptions about exogenous paths for fiscal and external variables—to build up a near-term profile. From this near-term profile, we will typically need to extract key unobserved variables such as the output gap, for that and the rest of the near-term profile to be fed into the core model. As noted, the core model helps the staff arrive at an overview. Part of this process involves decomposing the aggregate picture via the satellite models, and this can lead to the staff wanting to revise the aggregate picture. The staff has two sorts of control over the aggregate picture. The first is to revise the starting assumptions. The second is to use ‘add-factors’
24 In small economies, this can happen quite easily when there is ‘lumpy’ expenditure on large items or projects. For example, the purchase of an individual airliner or new military expenditure can make a large difference to the aggregate national accounting profile.
33
directly on the core model (such as when a large investment expenditure is known in advance) in order to alter a particular variable’s path. This procedure will typically require iteration. As a further check, the use of a theoretically tight optimizing model may also imply alterations to the model’s projection paths (for example, if accumulating debt implied a more suppressed path for consumption than would have been projected in a model without such constraints.)
The final output, of course, is a projection profile, which provides a staring point for advice to the MPC. By this stage, the staff should be in a good position to explain what they think the pressures facing the economy are, and what that implies for monetary policy. Using this process and the models involved, the staff should also be in a position to explain their choices for starting assumptions, their interpretations of recent data outcomes, and their handling of idiosyncratic events. The MPC may wish to have some options explored further, so that more iterations are added to the process. However, the structure here is capable of dealing with policy issues in a controlled and systematic manner.
The core model comes into its own in adding to the above analysis information on risks to the scenario, both through alternatives that assess the importance of particular risks in the assumptions and through more general risk analysis involving confidence intervals and so on.
VIII. ON THE EVOLUTION AND DEVELOPMENT OF THE FPAS
This section concerns itself with strategies for ensuring that the FPAS can be taken from its first beginnings to a successful and established system. These strategies can be related to four specific areas:
• model development;
• Information technology and systems (IT) development;
• staff development; and
• the creation of a forecast and model culture.
When the essential elements of the system are in place, management can start thinking about their development. It is probably easiest to plot a course for model development, with the staff aiming to move over time to more and more sophisticated structural models. We emphasize again, however, that the job of the core model is to provide the link between developments in the economy and the implications for monetary policymakers.

34
Operationally, the value of the model will come from the ability to perform ‘counterfactuals’ and experiments that provide insight into recent data outturns. This implies that management should be very careful that any proposed developments do not make the model more difficult to understand, and hence to use and communicate to the MPC. The relationship with the MPC, which is so important for the functioning of the system, can break down when the staff are unable to explain their projections. It is helpful, therefore, to aim for a model that is well within the ‘comfort zone’ of both.

35
Figure 3: How Several Models can be Combined to Impose Consistency
Short-run indicator models
Starting assumptions (forward exogenous
paths)
Near-term profile
Signal-noise models
Output gap
Core model
Aggregate forecast profile
Advice to the MPC
Satellite models
Disaggregated profile
Addfactors
Revised assumptions
Optimising models
Addfactors
36
Information technology is easily overlooked when thinking about developing the system. It is, however, very important. Automating tasks has the obvious benefit that there is less room for human error, and it is a prerequisite for the effective use of the forecasting model. Effective IT also has the benefit that it allows the staff more time to think about economics, rather than the details of data-processing tasks. Several specific steps can be taken:
1. There are obvious economies of scale and scope in deploying resources for Information and Computer Technology, but it is important to avoid the pure ‘service bureau’ approach.
2. Make sure that the staff has direct access to programmers and IT experts who can work to improve productivity and support the needs of the staff.
3. Avoid the attitude that ‘one size can fit all’! Within limits, staff should be able to specify what they need to help them with their work, rather than only having generic solutions imposed upon them.
4. If a member of the MPC has some expertise in this area, they should be given the responsibility for ensuring that the Bank’s available resources are being used effectively to support the FPAS, as well as the other needs of the central bank. It should also be recognized that this is not a part-time job and that major productivity gains for the institution can be realized if available resources can be deployed effectively.
The most challenging development issue for management will probably concern human capital. The maintenance and improvement of the FPAS over time will depend on how well the central bank can protect and develop its internal human capital. It is important to recognize that many of the skills necessary to operate an FPAS are highly specialized. This raises a number of issues:
1. The importance of training for these specialized tasks. In the early days of the system, it may be possible and useful to use external consultants from other institutions who have experience in the issues involved. This can accelerate the development of expertise of the staff. However, management should be very careful that expertise is in fact developed as part of this process. If possible, contracts with external experts that are designed to help set up the FPAS should have duration of at least one year. After a certain point, this training will often have to be done in-house, as so much human capital will depend on the accumulation and transmission of experience with the FPAS.

37
2. The importance of safeguarding against the departure of staff. Once some expertise is gained, it will be important for more experienced staff to mentor new staff and ensure that someone is ready to take over when a staff member leaves. It is important for management to recognize that this can be time-consuming and to create incentives so that staff do not guard or restrict their own human capital. Recording procedures in the system will be very important. Much, however, comes down to the attitude of management⎯the entire system will function more efficiently if everyone involved in the process realizes that there can be important synergies from openness and transparency.
3. The importance of external contacts. As mentioned, there are obvious benefits if the institution can benefit from procedures and systems developed elsewhere. Management should also work to develop contacts with educational institutions in order to ensure that people in these institutions are aware of the types of human resources and skills that are required for the FPAS.
4. Staff contact with the MPC. It is beneficial for staff motivation if they feel that they are able to make an impact and to receive credit for initiative and good work. This can be achieved by making sure that staff members are invited to some MPC meetings. This approach has the added benefit that the staff members hear directly the concerns and thinking of the MPC, which will help them anticipate what kind of material the MPC finds useful.
5. Staff motivation and incentives. As discussed, rotation should be facilitated and planned. In addition to spreading a general knowledge of how the system works, this is one way by which management can ensure that staff members do not become stale or burnout in a particularly stressful position. In general, staff should be closely supervised, but also given the freedom to be autonomous and undertake new initiatives.
6. Facilitation of a cooperative team atmosphere. The synergies that arise from a widespread understanding of the system should be evident. Small initiatives can be very helpful here. For example, if model builders and forecasters sit near each other, that regular informal contact can greatly aid communication and understanding. Similarly, informal in-house seminars, such as ‘brown paper bag’ lunchtime seminars, that give an opportunity for staff to discuss problems and issues, can be very useful.
Many of these points touch on the general issue of creating a forecasting and model culture. This is hard to define precisely, but the important realization for management is that

38
it is not possible to create a properly functioning FPAS by simply importing models, IT, or temporary external consultants. Staff will need to feel connected to the process, involved in the final outcome, and credited for successful innovation and work. Management should aim to build up a group culture of using models and understanding their limitations. This can be important when questions from the MPC need to be qualified or reinterpreted in order to produce sensible results in a formal model. In particular, the notion of a culture speaks to the ability to undertake model development work in-house; the best racing car is not much good without skilful drivers. This can be aided by investing in an active model development and research program⎯a separate division of economists engaged in longer-term but well-focused research projects aimed at improving the human capital of the staff and the quality of the FPAS over time. The culture can also be facilitated by a regular review process immediately after each quarterly projection exercise, where the staff can ask themselves what changes could be introduced to make the process more efficient or what model developments would make sense.
39
REFERENCES
Alichi, A., H. Chen, K. Clinton, C. Freedman, M.J. Johnson, O. Kamenik, Turgut Kisinbay, and D. Laxton, 2009, “Inflation-Forecast Targeting Under Imperfect Policy Credibility,” Forthcoming IMF Working Paper.
Berg, A., P. Karam, and D. Laxton, 2006a, “A Practical Model-Based Approach to Monetary Policy Analysis—Overview,” IMF Working Paper 06/080 (April 2006), available at www.imf.org
———, 2006b, “Practical Model-Based Monetary Policy Analysis—A How-to Guide,” IMF Working Paper 06/081 (April 2006), available at www.imf.org
Carabenciov, I., I. Ermolaev, C. Freedman, M. Juillard, O. Kamenik, D. Korsunmov, and D. Laxton, 2008, “A Small Quarterly Projection Model of the U.S. Economy,” IMF Working Paper No. 08/278 (Washington, DC.: International Monetary Fund).
———, and J. Laxton, 2008a, “A Small Multi-Country Global Projection Model,” IMF Working Paper No. 08/279 (Washington, DC.: International Monetary Fund).
———, and J. Laxton, 2008b, “A Small Multi-Country Global Projection Model with Financial-Real Linkages and Oil Prices,” IMF Working Paper No. 08/280 (Washington, DC.: International Monetary Fund).
Chen, H., K. Clinton, O. Kamenik, and D. Laxton, 2009, “Constructing Forecast Confidence Bands with GPM, Forthcoming IMF Working Paper.
Chin, M., and G. Meredith, 1998, “Long-Horizon Uncovered Interest Rate Parity,” NBER Working Paper No. 6797 (November).
Clinton, K., M. Johnson, O. Kamenik, and D. Laxton, 2009, “Deflation Risks Under Alternative Monetary Policy Rules,” forthcoming IMF Working Paper.
Coats, W., D. Laxton and D. Rose, 2003, The Czech National Bank’s Forecasting and Policy Analysis System, (Prague, Czech Republic: Czech National Bank).
Dornbusch, R., 1976, “Expectations and Exchange Rate Dynamics.” Journal of Political Economy 84 (December): pp. 1161–76.

40
Epstein, N., D. Laxton. P. Karam and D. Rose, 2006, “A Simple Forecasting and Policy Analysis System for Israel: Structure and Applications” in Israel: Selected Issues, IMF Country Report No. 06/121 (March 2006), available at www.imf.org.
Isard, P., and D. Laxton, 2000, “Issues Related to Inflation Targeting,” IMF Staff Country Report No. 00/106.
Kumhof, M., and D. Laxton, 2007, "A Party Without a Hangover? On the Effects of U.S. Fiscal Deficits" IMF Working Paper 07/202 (August 2007), available at www.imf.org
Laxton, D., 2008, “Getting to Know the Global Economy Model and Its Philosophy,” IMF Staff Papers, Vol. 55, No. 2, pp. 213–42.
Laxton, D., and A. Scott, 2000, “On Developing a Structured Forecasting and Policy Analysis System Designed to Support Inflation-Forecast-Targeting,” in Inflation Targeting Experiences: England, Finland, Poland, Mexico, Brazil, Chile, (Ankara: The Central Bank of Turkey), pp. 6–63.
Laxton, D., and P. N’Diaye, 2002, “Monetary Policy Credibility and the Unemployment-Inflation Nexus: Some Evidence from Seventeen OECD Countries,” IMF Working Paper 02/220 (Washington: International Monetary Fund).
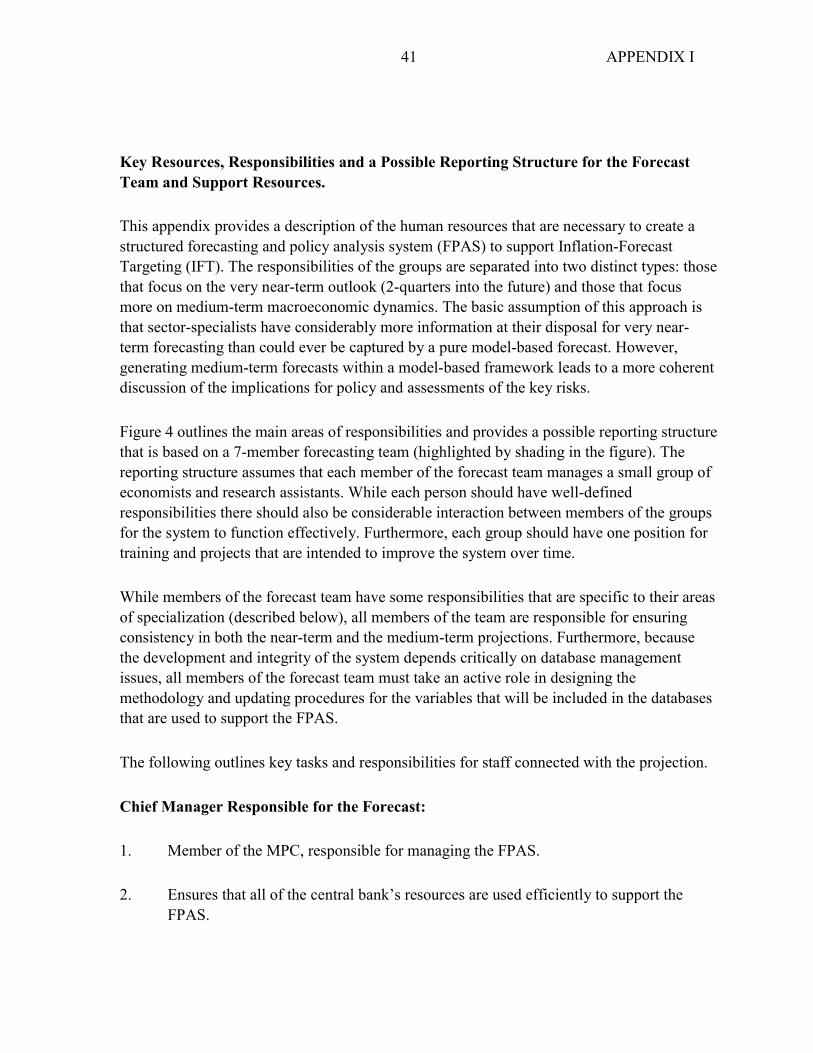
41 APPENDIX I
Key Resources, Responsibilities and a Possible Reporting Structure for the Forecast Team and Support Resources.
This appendix provides a description of the human resources that are necessary to create a structured forecasting and policy analysis system (FPAS) to support Inflation-Forecast Targeting (IFT). The responsibilities of the groups are separated into two distinct types: those that focus on the very near-term outlook (2-quarters into the future) and those that focus more on medium-term macroeconomic dynamics. The basic assumption of this approach is that sector-specialists have considerably more information at their disposal for very near-term forecasting than could ever be captured by a pure model-based forecast. However, generating medium-term forecasts within a model-based framework leads to a more coherent discussion of the implications for policy and assessments of the key risks.
Figure 4 outlines the main areas of responsibilities and provides a possible reporting structure that is based on a 7-member forecasting team (highlighted by shading in the figure). The reporting structure assumes that each member of the forecast team manages a small group of economists and research assistants. While each person should have well-defined responsibilities there should also be considerable interaction between members of the groups for the system to function effectively. Furthermore, each group should have one position for training and projects that are intended to improve the system over time.
While members of the forecast team have some responsibilities that are specific to their areas of specialization (described below), all members of the team are responsible for ensuring consistency in both the near-term and the medium-term projections. Furthermore, because the development and integrity of the system depends critically on database management issues, all members of the forecast team must take an active role in designing the methodology and updating procedures for the variables that will be included in the databases that are used to support the FPAS.
The following outlines key tasks and responsibilities for staff connected with the projection.
Chief Manager Responsible for the Forecast:
1. Member of the MPC, responsible for managing the FPAS.
2. Ensures that all of the central bank’s resources are used efficiently to support the FPAS.

42 APPENDIX I
Head Leader of the Forecast Team
1. Coordinates all aspects of the Quarterly Projection Exercise.
2. Documents all aspects of the Quarterly Projection Exercise.
3. Ensures that all of the central bank’s resources are used efficiently to support the FPAS.
4. Responsible for ensuring database integrity.
5. Responsible for supervising the development of the Management Information System.
Head of the Macroeconomic Projections Team (MPT)
1. Member of the Forecast Team.
2. Medium-term focus but should have considerable input into official near-term assumptions.
3. Head of group responsible for producing the forecast.
4. Works very closely with the head of Model Development to prepare different versions of the model to produce the forecast.
Head of the Model Development Team (MDT)
1. Member of the Forecast Team.
2. Medium-term focus.
3. Head of group responsible for model development.
4. Works very closely with the Macroeconomic Projections Team and should be a suitable backup for the head of MPT.

43 APPENDIX I
5. Prepares the models for the forecast rounds and provides support to the Macroeconomic Projections Team.
6. Develops the human capital responsible for building macroeconomic models and other tools designed explicitly to support IFT and the FPAS.
Head of the External Sector (Foreign Demand and Rest of World Assumptions)
1. Member of the Forecast Team.
2. Responsible for providing weekly updates of near-term staff forecasts for key external variables.
3. Manages a small group of economists and research assistants that provide assistance in supporting all the tasks and doing high quality research in this area.
Head of the Team that Forecasts Domestic Demand and Imports
1. Member of the Forecast Team.
2. Responsible for providing weekly updates of near-term forecasts for C, I, G and M.
3. Manages a small group of economists and research assistants, who provide support for all the tasks and doing high quality research in this area.
Head of the Team that Forecasts Inflation and Labor Markets
1. Member of the Forecast Team.
2. Responsible for weekly updates of near-term forecasts for inflation, unemployment, etc.
3. Manages a small group of economists and research assistants that provide assistance in supporting all the tasks and doing high quality research in this area.
Head of Team that forecasts Financial Markets and Foreign Exchange Markets
1. Member of the Forecast Team.

44 APPENDIX I
2. Monitors financial markets and foreign exchange markets
3. Responsible for updating near-term forecasts for interest rates, exchange rates etc.
4. Manages a small group of economists and research assistants that provide assistance in supporting all the tasks and doing high quality research in this area.
5. Monitors how market participants react to central bank communications (Minutes, Inflation Reports etc.)
Head of Management Information Systems and Database Management Group
1. Not a member of the Forecast Team but has strong links to them.
2. Responsible for the technical aspects of managing and updating the historical databases, the HNTF database, the Repository System for written documents, and the archiving of daily projection rounds and official forecasts.
3. Responsible for maintaining the Management Information System.
4. Manages a small division of support and research staff
5. Group should include experts in seasonal adjustment, survey design, and information technology.)
6. Responsible for ensuring the integrity of the databases.
Head of Special Studies and Strategic Policy Analysis
1. Not a member of the Forecast Team but encourages strong links between staff in this division and the staff that directly support the FPAS.
2. Should sit in on FPAS meetings to be aware of issues where this division might be able to contribute something.
3. Responsible for managing highly trained research staff.
4. Provides resources for special requests from the MPC.

45 APPENDIX I
5. Provides good entry positions to attract new staff.
6. Executes long-term research projects.
7. Provides support to the FPAS.
8. Supplies staff to the FPAS.
9. Works with staff involved in the FPAS to assist them with their research and analysis.
46
Figure 4: A Possible Reporting Structure Shaded areas indicate members of the Forecast Team.
Chief Manager Responsible for
Forecast
Monetary Policy
Projection Coordinator Head of Forecast Team
Head of Special Studies and Strategic Policy Analysis
Focus on Medium- Term Outlook
Focus on Near- Term Outlook
Financial and
FX Markets
Inflation and Labor
Market Head of Management Information System
and Data Management
Seasonal Adjustment Survey Design Support Staff
Prices Wages and Unit Labor Costs Employment and Unemployment Training and Research
FX Markets Bond Markets Policy Research Function Training and Research
Head of Macroeconomic Projection Team
(MPT)
Model Operator Backup Model Operator Model Database Manager Training and Research
Head of Model Development Team
(MDT)
Analysis of Trends Satellite Models Multi-Sector Models Training and Research
Exports Commodity and Foreign Prices External Demand Training and Research
GDP ADDUP Foreign Demand
and Rest of World
Government Consumption Investment Imports Training and Research
GDP ADDUP Domestic Demand
And Imports
Focus on Data Issues and Management
Information Systems
47 APPENDIX II
Database Management Issues
Effective database management practices are essential for supporting the needs of a structured Forecasting and Policy Analysis System. Indeed, until a system has been developed that produces timely and reliable updates of all the essential historical data, considerable time and resources will be wasted hunting and gathering data. If an effective database management system has not been developed, one of the first priorities of the Forecast Team should be to ensure that one is created as quickly as possible.
Both staff and members of the MPC who are responsible for the FPAS must take a keen interest in the data. The databases themselves must be organized explicitly to satisfy the needs of users. Indeed, without strong links between the ‘consumers’ (the MPC) and ‘producers’ (staff) of these databases there will be no clear incentives for producers to deliver timely and reliable data. (See Figure 5 below for an outline of the links between producers and consumers of data.).
Management should have easy access to the data and should be able to view them through an efficient Management Information System. Analysts and model builders should also have easy access to historical data to facilitate analysis and model building. The choice of software for managing the database may be a difficult one. While user-friendly and powerful software has been developed to manage time-series databases and would definitely improve the efficiency of the FPAS, the benefit of such software would have to be weighed against the costs in many countries associated with using scarce resources.
As can be seen in the figure, the Management Information System draws on three distinct types of official FPAS databases: a Historical Database, a Historical and Near-Term Forecasting Database, and the Quarterly Projection Database. Each of these types serves a particular need.
The Historical Database
In the Historical Database, we can think of three basic types of data.
The first type of data is taken directly from external sources such as the official statistical agency. In this case, the job of the Database Management Group (DMG) is to extract those data from these external sources that are required for the FPAS and to update the Historical Database and Management Information System as quickly as possible. As is the case with all databases, the choice of variables in the Historical Database must be based on the needs of the consumers of the data (the MPC and staff involved in the FPAS).

48 APPENDIX II
If the updating process does not occur within a few minutes, or does not cover all of the needs of the users in the FPAS, there may be a tendency for people involved in the process to revert to the original source.25 In order to prevent this from happening, management of the DMG should develop special relationships with the statistical agency so that the Historical Database and Management Information System can be updated extremely quickly. Indeed, in some cases it may be wise to arrange to do this before the data are officially released to the public by the statistical agency. This ensures that the historical databases and Management Information System can be updated quickly, hence providing the MPC with an option to comment on the data shortly after their release to market participants and the public.
The second type contains data that are based on data released by the statistical agency but may be transformed in some way. For example, the statistical agency may choose not to seasonally adjust certain data, or it may not release the desired disaggregated details that are deemed necessary for the FPAS. If requested by a member of the Forecasting Team, the DMG should derive such estimates and then update them according to the methodology that has been suggested in a written request supplied to the DMG. Once again, it is very important to update these data as quickly as possible so that people come to rely upon these data rather than the original source.
The third type contains data series constructed from raw data that are created inside the central bank. In this case, the DMG may provide aggregations of raw data that may be published directly by the central bank. Again, it is important that members of the Forecasting Team be responsible for determining the needs of the FPAS and ensuring that members of the DMG update the databases on a systematic basis.
Each time series should be documented within the database so that any potential user of a series can understand how the data have been constructed. Each time series should also be assigned a specific ‘owner’. This person should be responsible for documentation and suggesting improvements to the methodology that is followed to construct it. For example, if the FPAS is organized along the lines suggested in Appendix I, the wage and unit labor cost specialist might be assigned ownership of measures of data on wages. While the updating of these data would be done in the DMG section, the Wage Specialist should be responsible for understanding the methodology that is being used to construct them and would act as a contact person if any questions were posed from other potential users of these data. The
25 For a database to have integrity there must be strong interaction between consumers and producers of the data, and both groups must be involved in improving the data and its documentation over time. Consumers of data will avoid databases that suffer from low integrity, sloppy documentation, and tardiness.

49 APPENDIX II
argument for assigning ownership to specialists that are responsible for monitoring certain sectors is that these people should have an intimate understanding of the potential problems with the data that they monitor. They will therefore be in a position to develop expertise that would suggest better methods for deriving data and spotting errors.
The Historical and Near-Term Forecasting Database (HNTF)
Unlike the Historical Database, which would be updated as and when the data become available from original sources, the HNTF database would only be updated weekly in advance of the regular weekly meetings. The historical part of this database would be linked to the historical database produced in the DMG. By contrast, the near-term forecast component of the HNTF database would be supplied to the DMG by those members of the Forecast Team who are directly responsible for the data in their specific sectors. After updating the HNTF database, reports should be generated and circulated to all participants involved in the IFT process. These reports would be designed to show how the near-term forecast changes based on the staff’s interpretation of new information. These HNTF databases should be stored permanently in order to evaluate the forecasting performance of the staff and as a benchmark to evaluate if new methods could improve forecasting performance.
The updating of the HNTF is essential for signaling to management how the staff sees the potential risks evolving with the latest official forecast. There should be strict rules about when this database is updated and who exactly is responsible for updating each part.
In order to get the system up and running as quickly as possible, the number of variables in the HNTF database should be limited initially, and then can be expanded based on the perceived needs of management and staff.
The Quarterly Projection Database
The Quarterly Projection Database provides all of the data that are used and reported in the quarterly projection rounds (see Section V). Archiving these databases will allow a review process to take place that identifies systematic errors in the forecasts and aims for improvements in the forecast process and procedures that are relied upon. Depending on the capacity of the computer system, the staff and MPC may find it useful to have each iteration of the forecast round specifically and separately recorded.

50 APPENDIX II
Figure 5: Links Between Different Databases
HNTF Database -updated weekly -near-term forecast updated by member of the forecast team -stored permanently -historical data plus 2-quarter-ahead forecasts
Quarterly Projections Database
-updated quarterly -stored permanently -historical data extended to end of projection horizon
Staff’s Analysis
Historical Database -continuous and timely updates -documentation -clear lines of responsibility -timely updates
A. Management Information System
MPC
51 APPENDIX III
Develop a Simple Core Quarterly Projection Model (QPM) and a View on the Monetary Transmission Mechanism
A prerequisite for inflation-forecast-based targeting is that there must be a reasonably clear view about the monetary transmission mechanism as well as the major shocks that influence the economy and inflation.26 One of first steps is to develop a view of the fundamental role of the monetary authority and how monetary policy works.
The analytical frameworks that have been developed for addressing monetary policy issues for an open economy traditionally exhibit the monetary policy transmission mechanism depicted in Figure 6.
The monetary authority influences a short-term interest rate with the objective of affecting the rate of inflation and the output gap. As shown by the arrows, changes in the policy instrument are transmitted to the policy target variables through several channels.
Adjustments in the policy rate can trigger movements in the nominal exchange rate, which are transmitted directly to tradable goods prices and inflation. Indirectly, there is an effect on the economy through their effects on the real exchange rate and the gap between actual and potential output. Changes in the policy rate can also affect market-determined long-term interest rates, depending on how it affects bond market participants’ expectations of the path of the future policy rate. The policy rate also affects real interest rates, through their effects on market-determined rates, but they may also affect them through changes in the time profile of inflation expectations. Changes in the real interest rate in turn influence the economy through their effects on aggregate demand and the output gap; and changes in the output gap influences inflation through channels summarized by the inflation equation (Phillips curve).
In addition, important feedback mechanisms are at work over time, with inflation expectations responding in part to the history of inflation and inflation itself influenced, in turn, by changes in inflation expectations.
Figure 6 does not show any feedback mechanisms from the policy target variables to the policy instruments. The task of identifying and implementing a feedback mechanism that is conducive to macroeconomic stability is the responsibility of the monetary authority. In
26 For examples of small monetary policy models estimated with Bayesian techniques see Carabenciov and others (2008, 2008a, 2008b).

52 APPENDIX III
particular, the role of monetary policy is to react to observed and anticipated changes in inflation and other macroeconomic variables, taking account of the behavioral relationships among these variables to achieve the policy objectives.
In reality, the operation of monetary policy is greatly complicated by three types of uncertainty: imperfect information about the magnitudes of the various transmission effects shown in the diagram; difficulties in identifying the effects on macroeconomic variables of various types of economic shocks; and the problem of measuring key variables in the transmission mechanism that are not directly observable (such as inflation expectations and
Figure 6. The Monetary Policy Transmission Mechanism
Short-term Policy Interest Rate
Market Determined
Interest Rates
Nominal Exchange
Rate
Inflation
Inflation Expectations
Real Exchange
Rate
Market Determined Real
Interest Rates
Output Gap

53 APPENDIX III
the output gap). The operation of monetary policy is also complicated by the fact that policy credibility is imperfect and can vary with the effectiveness of the monetary authority in achieving desirable outcomes for policy target variables. The endogenous behavior of policy credibility and its role in the monetary policy transmission mechanism has not yet been adequately incorporated into models used to analyze monetary policy issues. However, there is considerable evidence that suggests that such links exist in countries that have been successful in providing an anchor for inflation expectations.
At a minimum, models designed for IFT should attempt to separate dynamics coming from expectations from ‘intrinsic’ dynamics.27 This is so that they can be used to study the implications of different assumptions about how expectations formation may adjust after the adoption of an IFT regime has been adopted. In some cases, the process of developing policy credibility in the IFT regime can occur quite rapidly. For example, Figure 7 shows how long-term inflation expectations became anchored to the 2.5 percent target in the United Kingdom following the implementation of an IFT regime that was based on the creation of an independent central bank with explicit and transparent objectives. In many other countries that have adopted IFT regimes, however, policy credibility and the process that governs inflation expectations has evolved much more slowly over time.
0
1
2
3
4
5
6
1/6/95 13/3/96 27/12/96 13/10/97 29/7/98 14/5/99 28/02/2000
Figure 7: Inflation Expectations 10-Years-Ahead in the United Kingdom
Introduction of NewFramework
Credibility Gap
New Point TargetOld Target < 2.5%
3.5
2.5
1.5
Countries that have adopted an IFT policy have generally embraced the principle that the fundamental role of the monetary authority is to provide a nominal anchor for the economy.
27 Intrinsic dynamics are those that are caused by the presence of adjustment costs (such as fixed-term contracts).
54 APPENDIX III
This may cause the monetary authority to believe that its sole purpose is to anchor inflation at the target, leading to quite aggressive policy. Indeed, the preceding view of the transmission mechanism includes the well-known stylized fact of “long and variable lags”, and this may make the monetary authority even more anxious to react pre-emptively to inflationary pressures. However, one of the lessons derived from historical experience is that it can be unproductive to ignore stabilization issues by placing too large a weight on manipulating near-term inflation forecasts.28 That being said, another important lesson from history is that it can be even more costly to do too little by placing too high a weight on extremely uncertain measures of output gaps or other measures of excess demand. An understanding of the uncertainties involved in the transmission mechanism brings with it the implication that the monetary authority should be prudent and not do too little, which might bring the credibility of the whole system into question.
28 There is a trade-off between the variability of inflation and the variability of output. Hence, the return on more aggressive attempts to anchor inflation may decline, if the consequence is increased volatility in output. Excessive overshooting should be avoided.

55 APPENDIX IV
A Simple Model of the Output-Inflation-Policy Nexus and a Methodology for Obtaining Timely Model-Consistent Measures of Potential GDP
This appendix has four objectives. First, it provides some general advice about how to provide initial direction to the FPAS and the Model Development Team. Second, it proposes a simple parsimonious open-economy model of the output-inflation-policy nexus. Third, it proposes a hybrid estimation-calibration strategy for choosing the parameters of the model. Fourth, it explains how efficient model-consistent measures of potential GDP can be constructed and updated as new information arrives.
Making a Start
Policymakers in central banks face considerable uncertainty when deciding on the desired stance for monetary policy. However, despite all the potential sources of uncertainty there is growing evidence that there can be large benefits from strategies that are successful in avoiding large and persistent errors in the stance of monetary policy. This is particularly the case when an IFT regime with well-specified objectives has become credibly established, because this eliminates a major source of uncertainty for other decision makers in both the private and government sector.
The role of the Model Development and the Forecast Team is to provide a framework that helps the MPC to address policy issues that arise because of uncertainty. This emphasis on the implications of uncertainty for policy suggests a methodology that is geared more towards avoiding large policy errors than methodologies that seek the best models on some more general metric. An approach that is virtually guaranteed not to work in practice is to seek the true data-generating process by estimating a general unconstrained reduced-form system of linear equations, with a ‘testing down’ procedure to determine which variables are statistically significant. Following such an approach in practice will create much frustration for all people involved in the process and will not provide much in the way of useful insights for monetary policy.
A preferred approach is to start with an estimation methodology that imposes sufficient structure on the problem so that it enables the Forecast Team and MPC to rule out nonsensical parameter estimates (wrong signs), or bizarre system properties. Indeed, when working with small samples it may be advisable to lean towards pure calibration methods that are designed to produce sensible system properties until sufficient data become available to make estimation strategies feasible and more reliable. From the perspective of the MPC, the approach suggested here involves the following steps:

56 APPENDIX IV
1. Ask the Model Development Team (MDT) to quickly develop a simple parsimonious model of the economy. This will require them to take a stand on lag structures and the links between the key macroeconomic variables outlined in Figure 6. This will also shift the focus of the discussion away from a backward-looking description of past data towards a more forward-looking discussion that involves making assumptions about fundamental and proximate causation.
2. Ask the MDT to provide their best estimates of specific parameter values, but also ask them to supply plausible ranges for all the parameter values. This includes ranges for the unobservable components such as inflation expectations and the output gap. This will elevate the discussion by recognizing uncertainty explicitly.
3. Ask the MDT to show the implications for the macroeconomic system properties under a plausible range of parameter values and other assumptions. This will provide a system-based perspective about how certain linkages (magnitudes of parameter values) contribute to system properties.
4. Encourage the MDT and other staff to study the policy implications of uncertainty and to propose a base-case calibration of the model that will guard against large systematic policy errors.
5. Lock in a basic model that reflects the collective view of the MPC and the staff, but use differences in views to help quantify uncertainty in the projection.
6. Adjust the structure and calibration as dictated by experience and empirical evidence.
The remainder of this appendix provides a discussion of how the MDT can complete the first two steps.
An Eight-Equation Model of the Output-Inflation-Policy Nexus
This appendix includes equation specifications for a simple, open economy that describes the joint determination of CPI (or Net CPI) inflation, the output gap and potential GDP, a market interest rate, and the exchange rate.29 Table 1 presents the equations of the model and Table 2 defines notation; the timing is quarterly.
29 Models not much more complex than this one are now used by more than 2 dozen country desks at the IMF for routine forecasting and risk analysis.

57 APPENDIX IV
Equation (1) is simply a definition of the output gap. It is defined to be 100 times the difference between GDP and potential GDP, where the latter is a measure of how much the economy could produce on a sustained basis without creating systematic pressure for inflation to rise or fall. Because both GDP and potential GDP in the equation are measured in logs, ygap will be approximately equal to conventional measures of the output gap measured in percent.
Equation (2) is a behavioral equation that relates the output gap to its own lead and lagged values, the lagged value of a relevant market determined real interest rate, and a lagged value of a measure of the real exchange rate. All variables in this equation are expressed as gaps or deviations from their equilibrium values.30 The equation also includes a disturbance term that measures all shocks to the output gap that are unrelated to changes in the real exchange rate and market-determined real interest rates.31 The own-lag term allows for the inertia in the system, and permits properties where shocks have persisting effects. The lead allows more complex cycle dynamics and forward-looking elements in aggregate demand. The real-exchange-rate term allows for effects from foreign shocks.32 The interest-rate term provides the crucial link from monetary policy actions and the economy.
Equation (3) provides a stochastic process for potential GDP. This specification assumes that there are shocks ( gdp
tε ) that directly affect the level of potential GDP each quarter. However, as shown in equation (4), the specification also assumes that there can be large persistent deviations in the trend growth rate of potential GDP ( ) from a constant steady-state
growth rate ( ). The latter assumption is necessary for emerging economies that are expected to experience high growth for a long time as their productivity levels approach levels in the industrialized economies.
tγssγ
33
30 It is also assumed that all variables are seasonally adjusted, so that lag terms are not needed to capture seasonal effects.
31 Note that because the output gap equation is function of a market-determined real interest rate, the model logically requires a link between the policy rate and the market rate. Often, however, this is not made explicit, based on the confidence that the market rate will respond closely enough to the true policy rate that this complexity can be ignored.
32 z is the real exchange rate (measured so an increase is a depreciation), in percentage points, and the * denotes an equilibrium value.
33 Indeed, a more elaborate model would separate GDP into components (such as labor supply and labor productivity) in order to explicitly model catch-up phenomena in productivity levels.
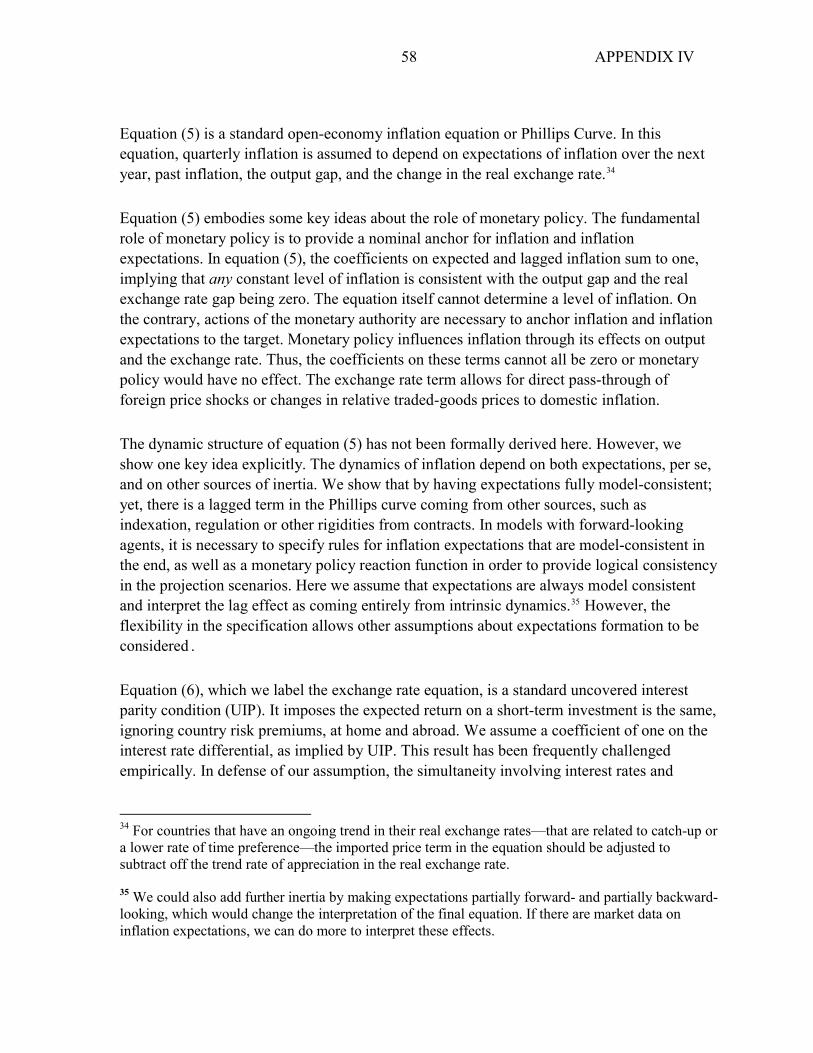
58 APPENDIX IV
Equation (5) is a standard open-economy inflation equation or Phillips Curve. In this equation, quarterly inflation is assumed to depend on expectations of inflation over the next year, past inflation, the output gap, and the change in the real exchange rate.34
Equation (5) embodies some key ideas about the role of monetary policy. The fundamental role of monetary policy is to provide a nominal anchor for inflation and inflation expectations. In equation (5), the coefficients on expected and lagged inflation sum to one, implying that any constant level of inflation is consistent with the output gap and the real exchange rate gap being zero. The equation itself cannot determine a level of inflation. On the contrary, actions of the monetary authority are necessary to anchor inflation and inflation expectations to the target. Monetary policy influences inflation through its effects on output and the exchange rate. Thus, the coefficients on these terms cannot all be zero or monetary policy would have no effect. The exchange rate term allows for direct pass-through of foreign price shocks or changes in relative traded-goods prices to domestic inflation.
The dynamic structure of equation (5) has not been formally derived here. However, we show one key idea explicitly. The dynamics of inflation depend on both expectations, per se, and on other sources of inertia. We show that by having expectations fully model-consistent; yet, there is a lagged term in the Phillips curve coming from other sources, such as indexation, regulation or other rigidities from contracts. In models with forward-looking agents, it is necessary to specify rules for inflation expectations that are model-consistent in the end, as well as a monetary policy reaction function in order to provide logical consistency in the projection scenarios. Here we assume that expectations are always model consistent and interpret the lag effect as coming entirely from intrinsic dynamics.35 However, the flexibility in the specification allows other assumptions about expectations formation to be considered .
Equation (6), which we label the exchange rate equation, is a standard uncovered interest parity condition (UIP). It imposes the expected return on a short-term investment is the same, ignoring country risk premiums, at home and abroad. We assume a coefficient of one on the interest rate differential, as implied by UIP. This result has been frequently challenged empirically. In defense of our assumption, the simultaneity involving interest rates and
34 For countries that have an ongoing trend in their real exchange rates—that are related to catch-up or a lower rate of time preference—the imported price term in the equation should be adjusted to subtract off the trend rate of appreciation in the real exchange rate.
35 We could also add further inertia by making expectations partially forward- and partially backward-looking, which would change the interpretation of the final equation. If there are market data on inflation expectations, we can do more to interpret these effects.

59 APPENDIX IV
exchange rates makes any effort to estimate this coefficient particularly difficult.36 Fundamentally, however, we do not see this as an empirical issue; a macro model with irrational arbitrage is, to say the least, unappealing. We think that any desired dynamics must be introduced in other ways, such as through expectations.
In equation (7), we permit, but do not impose, model-consistent expectations for the exchange rate. When δ1 = 1, the model will have Dornbusch (1976) overshooting dynamics. In practice, overshooting often seems to take place in slower motion; a value of δ1 somewhat less than one may generate dynamics that are more realistic.37
Finally, equation (8) is the monetary reaction function that completes the model. The essential point is that the monetary authority must act to set a path for interest rates that anchors inflation and inflation expectations to the target rate of inflation. That feature is captured in the term that provides response to the forecasted difference between inflation and the target rate, four quarters ahead. The rest of the equation provides additional dynamics. The own lag provides for ‘interest smoothing’ where the model authority responds gradually to the signal for change. The output gap term provides the notion that the policy decision should depend on more than the inflation forecast, per se. If there is excess demand and inflation is projected to be above the target, response will be stronger than if the same forecast is associated with excess supply.
What are reasonable ranges for all the Parameter values in the model?
Estimates of the reasonable ranges for parameter values will be gradually refined over time. This should be done judgmentally after reviewing various analyses, possibly including: (1) unrestricted estimation; (2) less-restricted estimation; (3) empirical evidence from other sources (estimation of disaggregated models, for example); (3) information from Input-Output Tables; (4) system properties; and (5) an evaluation of potential Type I and Type II policy errors. The issues in (4) and (5) are important. For most new IFT countries the data will not support estimation reliably, and judgment is essential. Often, the stylized facts about
36 See Chin and Meredith (1998), for example.
37 The value of δ1 matters a lot. When δ1 = 1, the real exchange rate will be a function of the future sum of real interest differentials (and risk premia) and will provide a very direct and forward-looking channel through which monetary policy will operate. Some observers have argued that it is prudent to assume a much smaller value of δ1 to avoid errors that would arise if monetary policy is not that powerful. Isard and Laxton (2000) suggest that it would be prudent to assume that δ1 is slightly below 0.5 because of larger and asymmetric costs that would result from assuming extreme values such as zero or one.

60 APPENDIX IV
cycle properties, or even the evidence from particular historical episodes, will suggest model properties that are desired. Producing such properties should receive considerable weight in the calibration. In (5), the point is that certain coefficients may be especially important in terms of the nature of policy errors. Some weight should be given to setting parameters to reduce the likelihood of large, systematic policy errors.
The following provides an initial range of parameter estimates for the equations specified in Table 1. For a detailed discussion of such choices, see Berg, Karam and Laxton (2006a,b). For a particular application, see Epstein and others (2006).
Initial Range of Parameter Estimates in the YGAP Equation
For most economies, there are significant lags in the transmission of monetary policy. This suggests that the sum of the parameters on the real-interest-rate term and the real-exchange-rate term ( θ2 and θ3 ) should be small relative to the weight on lagged dependent variable ( θ1 ). Berg, Karam and Laxton (2006a, 2006b) suggest that for most economies we would expect that the sum of θ2 and θ3 would likely lie somewhere between 0.10 and 0.20 and that θ1 would likely lie somewhere between 0.5 and 0.9, and that the coefficient on the lead should be quite small, perhaps 0.1. For very open economies we would expect that θ3 might be larger than θ2 and for fairly closed economies we would expect the opposite. One way of estimating the relative magnitude of these two parameters would to decompose GDP into components⎯such as domestic demand, exports and imports⎯and then estimate the real interest rate and real exchange rate effects on these components separately. This preliminary estimation could then be used as a check on estimates obtained from aggregate equations. Without this type of information, we would suggest setting a lower bound for θ2 and θ3 in the neighborhood of 0.05 and an upper bound of 0.30.

61 APPENDIX IV
Initial Range of Parameter Estimates in the Inflation Equation
The behavior of the economy depends critically on the value of α1. If there is a high weight on the forward component (α1 is 1), then inflation is equal to the sum of all future output and exchange rate gaps. A small but persistent increase in interest rates will have a large and immediate effect on current inflation. If, on the other hand, there is a lot of inertia (α1 is close to 0), then current inflation is a function of lagged values of the gaps, and it may require lengthy periods of monetary pressure to move inflation toward some desired path. Where price setting is flexible and the monetary authorities are very credible, high values of α1 might be reasonable, but for most countries, values significantly below 0.50 seem to produce results that are more consistent with data.38 In the absence of information to the contrary, we would suggest that calibration start with a low number for α1 to avoid the risk of overly optimistic assumptions about the speed of adjustment.39
The value of α2 determines, conditional on the above discussion, the strength of the short-term responsiveness of inflation to excess demand. Economies with more rigidity in price setting (regulation, contracts, etc.) would be expected to have lower values, all else equal.40 For such countries, a value in the range of 0.25 to 0.35 would be a reasonable starting point.
Because the model has been designed for open economies, it includes an imported price inflation term, through the change in the exchange rate. The value of α3determines the effects of exchange rate changes on inflation. It would typically be larger in economies that are very open. Higher exchange rate pass-through is generally also observed in countries where monetary policy credibility is low and where the value-added of the distribution sector is low. There is significant evidence of pricing-to-market behavior in many economies, suggesting thatα3would be smaller than the import weight in the CPI basket.41
(continued…)
38 The choice of parameters like this may change over time. For example, if the successful implementation and communication of a policy regime like inflation targeting results in gains in credibility, we would expect to see more weight to be placed on the forward component.
39 See Epstein et al. (2005) for a discussion of this point in the context of an application to Israel.
40 It is important to understand, however, that the general issue of the nature and speed of response to excess demand is not primarily determined by this parameter. The policy response to excess demand and the influence of the response of the exchange rate, along with the degree of inertia in expectations, tend to be the crucial issues.
41 Many factors impact on the exchange rate pass-through and its determinants, including central bank credibility, the composition of trade, the importance of distribution costs, the nature of shocks, and
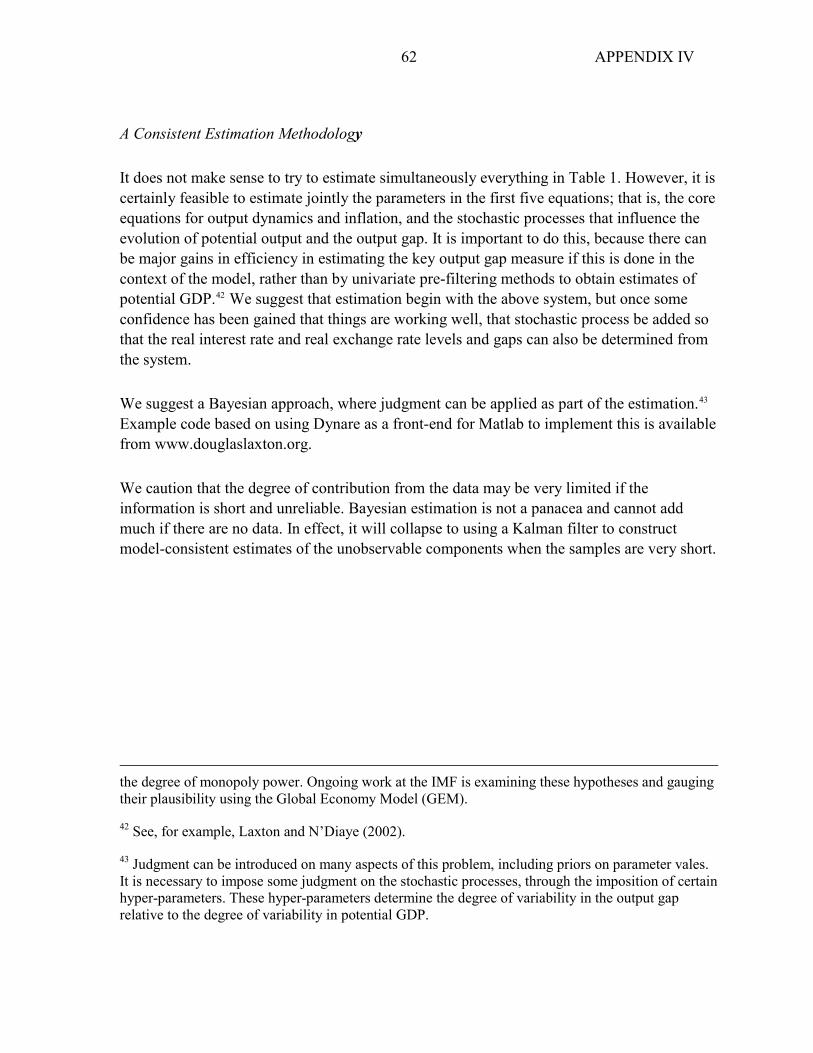
62 APPENDIX IV
A Consistent Estimation Methodology
It does not make sense to try to estimate simultaneously everything in Table 1. However, it is certainly feasible to estimate jointly the parameters in the first five equations; that is, the core equations for output dynamics and inflation, and the stochastic processes that influence the evolution of potential output and the output gap. It is important to do this, because there can be major gains in efficiency in estimating the key output gap measure if this is done in the context of the model, rather than by univariate pre-filtering methods to obtain estimates of potential GDP.42 We suggest that estimation begin with the above system, but once some confidence has been gained that things are working well, that stochastic process be added so that the real interest rate and real exchange rate levels and gaps can also be determined from the system.
We suggest a Bayesian approach, where judgment can be applied as part of the estimation.43 Example code based on using Dynare as a front-end for Matlab to implement this is available from www.douglaslaxton.org.
We caution that the degree of contribution from the data may be very limited if the information is short and unreliable. Bayesian estimation is not a panacea and cannot add much if there are no data. In effect, it will collapse to using a Kalman filter to construct model-consistent estimates of the unobservable components when the samples are very short.
the degree of monopoly power. Ongoing work at the IMF is examining these hypotheses and gauging their plausibility using the Global Economy Model (GEM).
42 See, for example, Laxton and N’Diaye (2002).
43 Judgment can be introduced on many aspects of this problem, including priors on parameter vales. It is necessary to impose some judgment on the stochastic processes, through the imposition of certain hyper-parameters. These hyper-parameters determine the degree of variability in the output gap relative to the degree of variability in potential GDP.
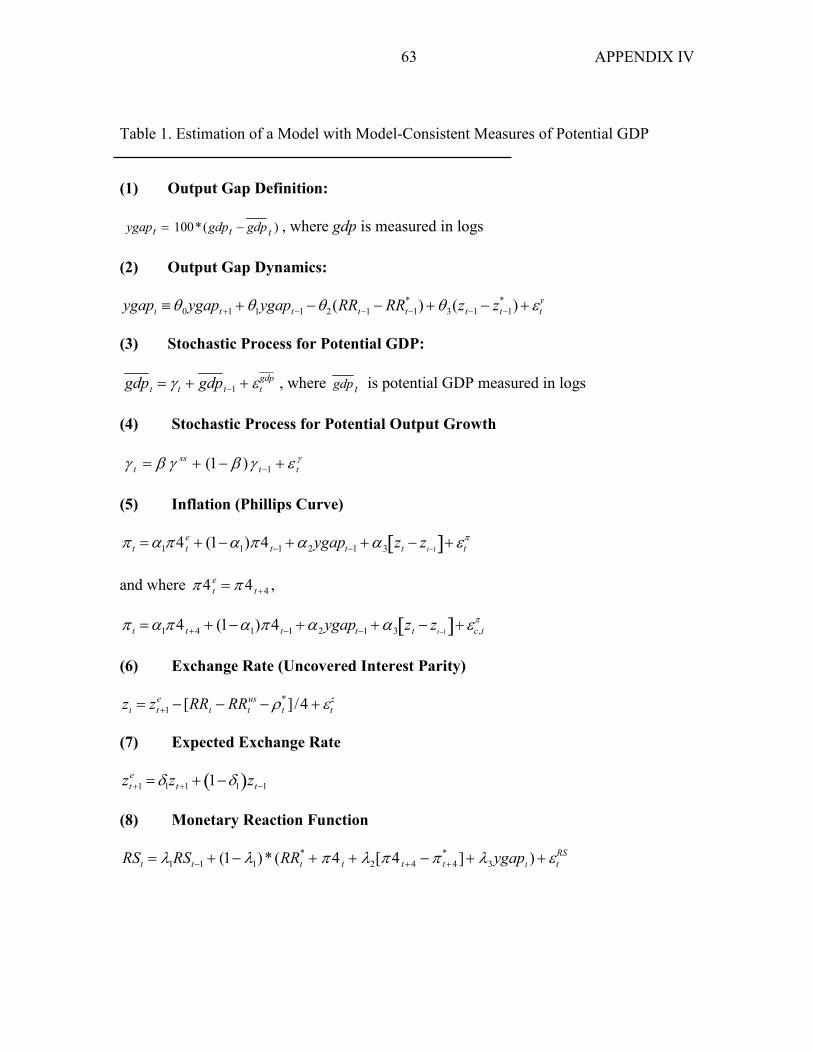
63 APPENDIX IV
Table 1. Estimation of a Model with Model-Consistent Measures of Potential GDP
(1) Output Gap Definition:
)(*100 ttt gdpgdpygap −= , where gdp is measured in logs
(2) Output Gap Dynamics: ygapt ≡θ0ygapt+1 + θ1ygapt−1 −θ2(RRt−1 − RRt−1
* ) + θ3(zt−1 − zt−1* ) + εt
y (3) Stochastic Process for Potential GDP: gdpt = γ t + gdpt−1 + εt
gdp , where tgdp is potential GDP measured in logs (4) Stochastic Process for Potential Output Growth
γεγβγβγ ttss
t +−+= −1)1( (5) Inflation (Phillips Curve) π t =α1π4 t
e + (1−α1)π4 t−1 +α2ygapt−1 +α3 zt − zt−1[ ]+ εtπ
and where π4 t
e = π 4 t+4 , π t =α1π4 t+4 + (1−α1)π4 t−1 +α2ygapt−1 +α3 zt − zt−1[ ]+ εc,t
π (6) Exchange Rate (Uncovered Interest Parity) zt = zt+1
e − [RRt − RRtus − ρt
*]/4 + εtz
(7) Expected Exchange Rate zt+1
e = δ1zt+1 + 1−δ1( )zt−1 (8) Monetary Reaction Function RSt = λ1RSt−1 + (1− λ1)* (RRt
* + π 4 t + λ2[π 4 t+4 −π t+4* ]+ λ3ygapt ) + εt
RS

64 APPENDIX IV
Table 2. Notation: Time Periods Correspond to Calendar Quarters Definitions: ygap : Output gap. gdp : Real GDP in logs. gdp : Real potential GDP in logs.
γ : Real potential GDP growth rate.
RR : Market-determined real interest rate. RS : Market-determined, short-term nominal interest rate. Z : Real exchange rate.
tπ : Quarterly change in the log of the CPI (or net CPI). π4 t+4
* : Target inflation rate four quarters ahead. π4 t+4
e : Expected inflation over next four quarters. ρ : Country risk premium.
Model Parameters:
β : Parameter that determines the speed of adjustment of γ to . ssγ
α i : Parameters in the inflation equation. θi : Parameters in the output gap equation. λi : Parameters in the reaction function. δ1 : Parameter in the expected exchange rate equation.
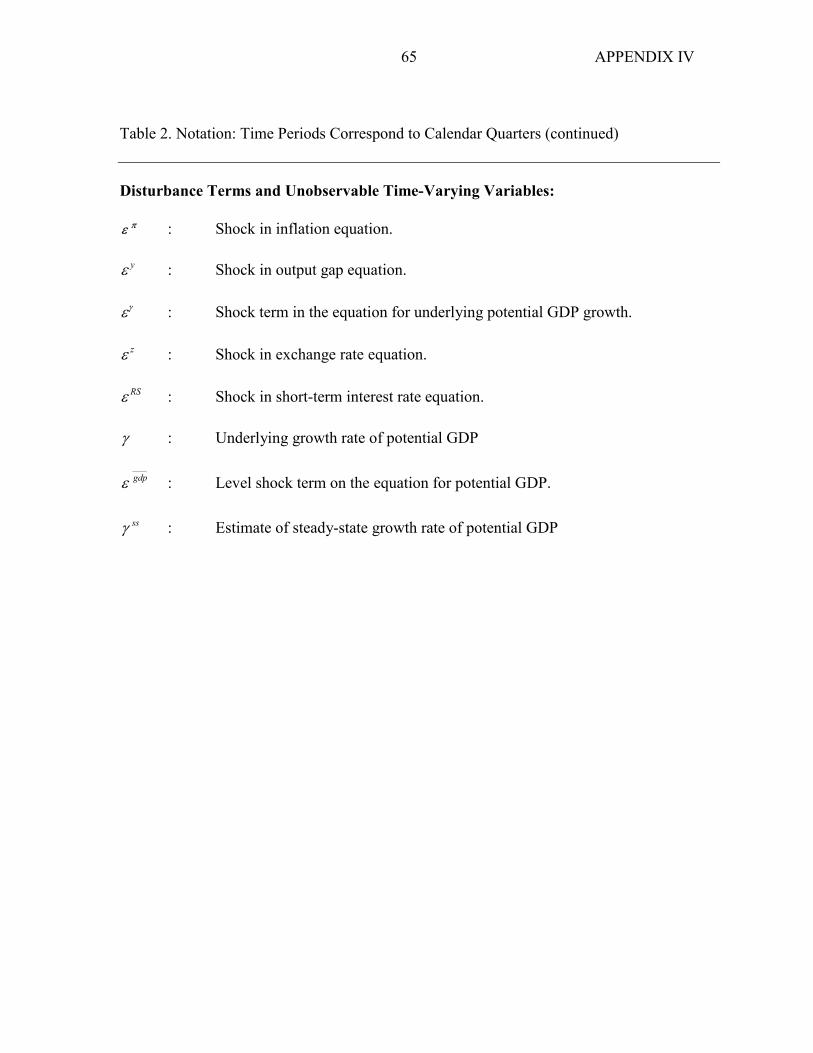
65 APPENDIX IV
Table 2. Notation: Time Periods Correspond to Calendar Quarters (continued) Disturbance Terms and Unobservable Time-Varying Variables:
πε : Shock in inflation equation. ε y : Shock in output gap equation. εγ : Shock term in the equation for underlying potential GDP growth. ε z : Shock in exchange rate equation. ε RS : Shock in short-term interest rate equation. γ : Underlying growth rate of potential GDP
gdpε : Level shock term on the equation for potential GDP.
ssγ : Estimate of steady-state growth rate of potential GDP