
Developing a decision-making model that best closes the ...
139
DEVELOPING A DECISION- MAKING MODEL THAT BEST CLOSES THE GAP BETWEEN STRATEGY AND THE CAPITAL INVESTMENT PROCEDURE FOR CADBURY SOUTH AFRICA By Brendan David Wilson Submitted in partial fulfilment of the requirements for the degree of Magister in Business Administration at the NMMU Business School Research supervisor: Dr Shaun Krause November 2005
Transcript of Developing a decision-making model that best closes the ...

DEVELOPING A DECISION- MAKING MODEL THAT BEST CLOSES THE
GAP BETWEEN STRATEGY AND THE CAPITAL INVESTMENT
PROCEDURE FOR CADBURY SOUTH AFRICA
By
Brendan David Wilson
Submitted in partial fulfilment of the requirements for the degree of
Magister in Business Administration
at the NMMU Business School
Research supervisor: Dr Shaun Krause
November 2005

i
DECLARATION
“I Brendan David Wilson hereby declare that:
− The work in this research paper is my own original work;
− All sources used or referred to have been documented and
recognised; and
− This research paper has not been previously submitted in full or
partial fulfilment of the requirements for an equivalent or higher
qualification at any other recognised education institution”

ii
ABSTRACT
This study addresses the fact that the current Cadbury investment appraisal
process does not adequately address the strategic implications of many capital
investment decisions. Although attempts are made to quantify, in financial
terms, the strategic benefits from a given investment, it appears that many
perceived benefits are left out of the appraisal process because they lack
precise financial quantification, resulting in managers placing greater reliance
on the qualitative dimensions of their investment decision-making such as
judgement and intuition.
The current Cadbury process is based on the unequivocal advice that
academics give to organisations and to managers about how to appraise large-
scale capital investment projects. The use of discounted cash flow techniques,
based upon the discounting of decision contingent cash flows at the
organisations opportunity cost of capital is regarded as the definitive investment
appraisal technique. On this, the academic literature is clear.
Whilst there are strong theoretical justifications for the use of discounted cash
flow based models, managers continue to use non-DCF appraisal techniques
such as payback irrespective of their theoretical shortcomings. The lack of use
of a sophisticated risk assessment model is also disappointing, with Cadbury
ignoring individual project risk and adopting a naive approach.
Finally, this study indicates that Cadbury managers need not be forced into
choosing either an economic/normative approach or a strategic/managerial
approach to capital-investment decision-making but that rather a hybrid
approach, including both the economic and strategic dimensions of choice, is
more applicable for effective strategy incorporation.

iii
ACKNOWLEDGEMENTS
The successful completion of this study would have been impossible without the
support, assistance and encouragement of others.
I would like to record my sincere thanks and appreciation to the following:
− Dr Shaun Krause, my promoter, for his professional and constructive
guidance during the course of my research efforts.
− Mr Louis Coetzee, my work superior, who inspired me to embark on this
journey and who allowed me the time necessary to complete it.
− Mr George Boucher, my work colleague, who proofread many a paper
and who absorbed the workload, and allowed me to focus on this study.
− My wife, Diane, and son, Brett, for their love, sacrifice and
understanding.
iv
TABLE OF CONTENTS PAGE
DECLARATION I
ABSTRACT II
ACKNOWLEDGEMENTS III
LIST OF DIAGRAMS VIII
LIST OF EQUATIONS IX
LIST OF FIGURES X
LIST OF TABLES XII
CHAPTER 1 1
THE PROBLEM AND ITS SETTING 1
1.1 INTRODUCTION AND BACKGROUND 1
1.1.1 INTRODUCTION 1
1.1.2 CADBURY SOUTH AFRICA 2
1.2 MAIN PROBLEM 5
1.3 SUB-PROBLEM’S 6
1.4 THE DELIMITATIONS 7
1.4.1 BASIS FOR THE MODEL 7
1.4.2 MANAGEMENT LEVEL 7
1.4.3 SUBJECT OF EVALUATION 8
1.4.4 GEOGRAPHIC LOCATION 8
1.5 DEFINITION OF KEY TERMS 8
1.5.1 CAPITAL EXPENDITURE 8
1.5.2 BENEFITS 9
1.5.3 BLACK BOX 9
1.6 ABBREVIATIONS 9
1.6.1 CAPEX 9
1.6.2 DCF 9
1.6.3 RAM 9
1.7 ASSUMPTIONS MADE 9
1.8 IMPORTANCE OF THE STUDY 10
1.9 METHOD OF THE STUDY 11
1.9.1 LITERATURE SURVEY 11
1.9.2 EMPIRICAL STUDY 11
1.10 STRUCTURE OF THE STUDY 12

Contents (continued) v
CHAPTER 2 13
2 REVIEW OF THE RELATED LITERATURE 13
2.1 INTRODUCTION 13
2.1.1 AREA OF EVALUATION 13
2.2 IMPACT OF CAPITAL BUDGETING ON THE VALUE OF AN
ORGANISATION 15
2.3 LINK BETWEEN CAPITAL BUDGETING AND STRATEGY 16
2.3.1 STRATEGY 16
2.3.2 RELEVANT CASH FLOWS 17
2.3.3 CAPITAL BUDGETING 18
2.3.4 RISK 23
2.3.5 BEHAVIOURAL RISK APPROACHES 24
2.3.6 DECISION TREE ANALYSIS 25
2.3.7 EXPLICIT RISK APPROACHES 27
2.4 GAP BETWEEN STRATEGY AND CAPITAL BUDGETING 33
2.5 ALTERNATIVE MODELS 37
2.5.1 REAL OPTIONS MODEL 38
2.5.2 FINANCIAL APPRAISAL PROFILE (FAP) MODEL 44
2.5.3 THE SAMUELS, WILKES AND BRAYSHAW THREE STAGE
MODEL. 47
2.6 CONCLUSION 49
CHAPTER 3 52
3 RESEARCH DESIGN AND METHODOLOGY 52
3.1 INTRODUCTION 52
3.2 WHAT IS RESEARCH DESIGN? 52
3.2.1 THE CONCEPT OF RESEARCH 52
3.2.2 THE CONCEPT OF DESIGN 53
3.2.3 VALIDITY AND RELIABILITY 54
3.3 METHODOLOGICAL APPROACHES 55
3.3.1 POSITIVIST APPROACH 55
3.3.2 POST-POSITIVISM OR CRITICAL REALISM APPROACH 56
3.3.3 THE INTERPRETATIVE APPROACH 56
3.3.4 MODELS AND MODELLING 56
3.4 QUANTITATIVE VERSUS QUALITATIVE RESEARCH 57
3.4.1 QUANTITATIVE RESEARCH 58

Contents (continued) vi
3.4.2 QUALITATIVE RESEARCH 58
3.5 CHOOSING THE MOST APPROPRIATE RESEARCH METHOD 58
3.6 RESEARCH GOALS AND STRATEGIES 60
3.6.1 RESEARCH GOALS 60
3.6.2 RESEARCH STRATEGY 62
3.6.3 SURVEY RESEARCH 62
3.6.4 THE POPULATION 65
3.7 GENERAL PROCEDURES 66
3.8 CONCLUSION 67
CHAPTER 4 68
4 EMPIRICAL RESULTS 68
4.1 INTRODUCTION 68
4.2 GENERAL OBSERVATIONS ON THE DATA 68
4.3 STRATEGY INCORPORATION 70
4.4 IMPORTANCE OF FINANCIAL EVALUATION 71
4.5 TECHNIQUES USED IN THE CAPITAL BUDGETING PROCESS 74
4.6 ACCURACY OF CASH INFLOWS 74
4.7 PRESENTATION OF REMAINDER OF QUESTIONNAIRE’S
RESULTS 78
4.8 TESTING OF THE HYPOTHESES 84
4.8.1 HYPOTHESIS 1 86
4.8.2 HYPOTHESIS 2 87
4.8.3 HYPOTHESIS 3 88
4.9 CONCLUSION 89
CHAPTER 5 90
5 FINAL SUMMARY, RECOMMENDATIONS AND CONCLUSION 90
5.1 SUMMARY OF THE MOST IMPORTANT FINDINGS FROM THE
EMPIRICAL STUDIES. 90
5.1.1 STRATEGY 91
5.1.2 PAYBACK 92
5.1.3 CURRENT CADBURY SCHEMES FOR INCORPORATING
STRATEGY 94
5.1.4 RISK 96
5.2 RECOMMENDATIONS 97

Contents (continued) vii
5.2.1 REQUIRED CHARACTERISTICS OF A FINANCIAL DECISION-
MAKING MODEL 97
5.2.2 REQUIRED DECISION-MAKING 98
5.2.3 CURRENT CADBURY DECISION MODEL 99
5.2.4 RECOMMENDED IMPLEMENTATION STRATEGY 100
5.2.5 PROPOSED PROCESS 103
5.3 RECOMMENDATIONS FOR FURTHER RESEARCH 105
5.4 CONCLUSION 105
REFERENCES 107
ANNEXURE A: HOW TO USE THE BLACK-SCHOLES OPTION PRICING
MODEL 112
ANNEXURE B: THE MATHEMATICS BEHIND THE BINOMIAL MODEL 114
ANNEXURE C: USING THE FINANCIAL APPRAISAL MODEL 116
ANNEXURE D: QUESTIONNAIRE DEVELOPMENT 117
ANNEXURE E: QUESTIONNAIRE 119
ANNEXURE F: COVERING LETTER 124
ANNEXURE G: LETTER FROM PROMOTER 125

viii
LIST OF DIAGRAMS
PAGE
Diagram 1 Group Structure Cadbury South Africa 3
Diagram 2 Organogram for Project department 4
Diagram 3 Cash flow components 18
Diagram 4 Decision tree for drug development. 27
Diagram 5 Mapping an investment opportunity onto a call option 39
Diagram 6 The Binomial Model 43
Diagram 7 "Black box" model of capital investment appraisal 49
Diagram 8 Fixed path investment route 50
Diagram 9 Investments as options to future investments 51
Diagram 10 Cyclic nature of research 53
Diagram 11 Key methodological approaches 55
Diagram 12 Proposed model for Cadbury 106
Diagram 13 Valuing a call option with a Binomial Model 114

ix
LIST OF EQUATIONS
PAGE
Equation 1 Payback Period 20
Equation 2 Accounting Rate of Return 21
Equation 3 Net Present Value 22
Equation 4 Profitability Index 22
Equation 5 Required Rate of Return 32
Equation 6 Strategic Net Present Value 38
Equation 7 Discounted Payback Index 45
Equation 8 Marginal Growth Rate 45
Equation 9 Risk Index 46

x
LIST OF FIGURES
PAGE
Figure 4-1 Management level of respondents 69
Figure 4-2 Management split of whether projects can be approved
on strategy 71
Figure 4-3 Split among senior managers of a project being approved
on strategy only. 72
Figure 4-4 Does lobbying of projects occur? 73
Figure 4-5 How different management levels agree or disagree
about cash inflows. 73
Figure 4-6 Management split on whether cash flows are accurate. 75
Figure 4-7 Management split on whether cash flows are manipulated
to meet financial measures. 76
Figure 4-8 Response to question 3 78
Figure 4-9 Response to question 9 78
Figure 4-10 Response to question 10 79
Figure 4-11 Response to question 11 79
Figure 4-12 Response to question 14 79
Figure 4-13 Response to question 15 80
Figure 4-14 Response to question 16. 80
Figure 4-15 Response to question 20 81
Figure 4-16 Response to question 21 81
Figure 4-17 Response to question 25 81
Figure 4-18 Response to question 26 82
Figure 4-19 Response to question 27 82
Figure 4-20 Response to question 30. 82
Figure 4-21 Response to question 31 83
Figure 4-22 Response to question 32 83
Figure 4-23 Response to question 33 83
Figure 4-24 Summary of responses to questions for hypothesis 1 86
Figure 4-25 Summary of responses to questions for hypothesis 2 87
Figure 4-26 Summary of responses to questions for hypothesis 3 88
Figure 5-1 Comparison of strategy to assumed project 92

List of figures (continued) xi
Figure 5-2 Comparison of Capital budgeting technique use from
different studies. 93
Figure 5-3 Management support of manipulation 95

xii
LIST OF TABLES
PAGE
Table 2.3-1 Decision tree construction. 26
Table 2.3-2 Example of the calculation of WACC. 29
Table 2.4-1 Comparative results of prior studies. 35
Table 2.4-2 Comparison of basic capital budgeting tools. 36
Table 2.5-1 Major types of real options 41
Table 3.4-1 Differences between qualitative and quantitative research 57
Table 3.5-1 Distinguishing characteristics of quantitative and qualitative
approaches 59
Table 3.6-1 Population Sample 65
Table 4.2-1 General observations of demographics of population 69
Table 4.3-1 Incorporation of strategy and understanding of strategy 70
Table 4.3-2 Average periods of strategy and approval 71
Table 4.5-1 Preferences regarding the capital budgeting technique
used and understanding of technique 74
Table 5.2-1 Difference between Real Option and current process 100
Table 5.2-2 Difference between Financial Appraisal Profile and current
process 101
Table 5.2-3 Similarities between Samuels, Wilkes and Brayshaw
3 stage model, current, and ideal. 102

1
CHAPTER 1
THE PROBLEM AND ITS SETTING
1.1 INTRODUCTION AND BACKGROUND
1.1.1 Introduction
Investment decisions are among the most important decisions made by
organisations. The capital budgeting process governs the way in which
managers at various levels produce and share information about proposed
investments and determines how they are evaluated.
The capital budgeting literature has primarily focused on the financial evaluation
of an investment and proposes that the process is like a “black box” where a
manager can assess risk, choose the right discount rate and generate net
present value which then leads to perfect decisions that maximise the
organisation’s wealth (Brealey & Myers, 1991: 215). Organisations produce
detailed documents that guide managers as to how this process works for their
organisation. These documents explain what constitutes a successful project by
detailing the required information, the format, the discount rate, the risk factors
and the required measures.
In a multinational organisation managers far removed from the impact of the
decision make the final decision based on information generated by managers
who are. The following quotation raises certain questions: “Figures can’t lie, but
liars can figure” (Anonymous). The inclusion of this quotation is not to suggest
that managers are liars, but rather that a manager who really believes in the
benefits of a particular investment will feed valid numbers into the “black box”
investment process that will generate the correct answer for project approval
even if he/she is not the final decision-maker. This is similar to the agency
issue, which organisations face, where managers place personal goals ahead
of organisational goals- the goal in this instance might be the acceptance of a
project (Gitman, 2003: 19).

2
Organisations recognise the agency issue and establish incentive systems to
induce truthful evaluation and number inputs. The inclusion of strategy into this
conventional “black box” model of investment appraisal is thus made extremely
challenging as strategic investments do not fit the model correctly and are
hence usually eliminated by the model, or, strategically minded managers input
numbers into the “black box” that guarantee a positive outcome and position the
strategic investment. Organisations usually do have a methodology in place to
deal with strategic investments but this often requires a written justification and
the investment is then qualitatively evaluated. How senior managers make “non
black box” decisions is not known (Brealey & Myers, 1991: 215).
The lack of rigour, where capital budgeting decisions are made through a less
formal process of deriving consensus among top managers could lead to
situations in which weak projects are justified on an ad hoc basis, all in the
name of strategy. This indicates that the “black box” model has certain failings,
particularly with regard to strategic investments.
Cadbury South Africa as a multinational company experiences the problems
highlighted above with the “black box model” and a model that overcomes the
limitations of the “black box model” and the lack of analytical discipline that
often characterises qualitative evaluation strengthening the strategic aspects
will ensure its continued growth.
1.1.2 Cadbury South Africa
Cadbury South Africa is one of 137 manufacturing operations within the
Cadbury Schweppes group worldwide and forms part of the Europe, Middle
East and Africa (EMEA) business region as divided by Cadbury Schweppes.
Cadbury South Africa was part owned until 2000 when Cadbury Schweppes
bought out the 45 per cent minority shareholders (Coetzee, 2005).
The head office for Cadbury South Africa is based in Johannesburg, which is
also the site of the main distribution depot. Cadbury South Africa is split into
confectionery and beverage with manufacturing sites located in the major
centres and is spread out across three countries; South Africa, Namibia and
Swaziland (refer to Diagram 1) (Coetzee, 2005).

3
Diagram 1: Group Structure Cadbury South Africa
ConfectioneryProducts: Chocolate and sugar confectionery
Main manufacturing locations: Port Elizabeth, Swaziland, Windhoek
BeverageProducts: Squashes, cordials.bases.nectars,sports drinks
Main manufacturing locations: Johannesburg, Cape Town, Durban
Cadbury South Africa
Source: Author’s own construction
The technology installed on the various sites ranges from 60-year-old
equipment to the latest. The largest and most complex manufacturing site is
located in Port Elizabeth. It was established in 1930 and consists of chocolate
and sugar confectionery. The majority of capital expenditure occurs at the Port
Elizabeth site (Coetzee, 2005).
Cadbury South Africa has an approximate R 3 billion turnover per annum and
on average spends in the region of R 200 million on capital projects including
information technology and distribution (Coetzee, 2005).
The beverage and confectionery streams were run as separate business units
until the end of 2004. At the beginning of 2005, they were combined under one
board becoming Cadbury South Africa. This has resulted in the organisation
undergoing a restructuring, where synergies in the areas of logistics and
customer operations were utilised. Certain common support functions including
financial, projects, risk management and quality were centralised for the two
streams (Coetzee, 2005).
Capital expenditure is tightly controlled by Cadbury Schweppes and all capital
expenditure has to follow a resource allocation model (RAM) process. The
financial indicators are calculated using proprietary software (HOLT
EVALUATOR). This software is used to create a common base across the
various regions with regard to capital expenditure evaluation because Cadbury
Schweppes is valued by the market on a discounted cash flow basis, but is
managed on an economic profit basis (Cadbury Schweppes, 2005). Various
approval levels for capital expenditure exist from local, regional and Group

4
based on pound sterling value. Group fixes the exchange rate for conversion to
pound sterling for approval values (Cadbury Schweppes, 2005).
The capital expenditure for Cadbury South Africa, excluding information
technology and distribution is the responsibility of the Manufacturing
Development and Projects engineering manager who is responsible for the
generation of the approval documentation (RAM) and the implementation of the
larger engineering capital projects (refer to Diagram 2)(Coetzee, 2005).
Diagram 2: Organogram for Project department
Source: Author’s own construction
MANAGER:MANUFACTURING DEVELOPMENT &
PROJECTS ENGINEERING
CONTROL & ELECTRICAL ENGINEER
ConfectioneryMechanical Technician
BeverageMechanical Technician
ConfectioneryMechanical Technician
MANAGER:PROJECTS ENGINEERING
ConfectioneryINDUSTRIAL ENGINEERING SERVICES
ConfectioneryPROJECTS SUPPORT ASSISTANT
MANAGER:PROJECTS DEVELOPMENT
ConfectioneryCAPEX & FINANCIAL EVALUATOR

5
1.2 MAIN PROBLEM
Cadbury South Africa has a detailed resource allocation model (RAM)
procedural manual that lays down the how, why and what of generating a
capital expenditure proposal and details the self-imposed criteria that will be
used as decision rules to capital expenditure going forward. These are:
• Cash Payback, tax charged (0 – 3 years)
• Internal rate of return (IRR) (>25%)
• Profitability index (PI) (>100%)
These measures, by the manual’s own admission, focus purely on gaining
better cash flow for the organisation and any projects that fall outside of these
parameters need to have a compelling written motivation (Cadbury Schweppes,
2005). The foregoing raises two questions. Firstly, and bearing in mind that the
company’s stated objective is to maximise shareholder wealth in the long term,
how will this objective be achieved if Cadbury Schweppes’ current criteria for
capital investment decision-making are all based upon generating cash flow
benefits in the short term? Secondly, how might the company link its strategic
requirements with a capital expenditure procedure that rewards short-term
gains?
Many definitions of strategy exist in the literature but the following definition by
Johnson and Scholes (2002: 10) contains the main characteristics:
“Strategy is the direction and scope of an organisation over the long term, which
achieves advantage for the organisation through its configuration of resources
within a changing environment and to fulfil stakeholder expectations”. According
to this definition, strategy has the following characteristics:
• It is long term.
• Gains advantage for the organisation.
• Involves change.
• Is unique to the organisation, due to its unique configuration.
• Must meet stakeholder expectations.

6
These characteristics lead to the following problem, which will be addressed by
this research:
An investigation into the existing gap between strategy and the
capital investment procedure for Cadbury South Africa.
1.3 SUB-PROBLEMS
In order to develop a research strategy that addresses and solves the main
problem, the following sub-problems and hypotheses have been identified:
Sub-Problem 1
How and to what degree are capital investment decisions accepted on financial
criteria?
Hypothesis 1
Capital investment decisions are only accepted on financial criteria.
Sub-Problem 2
To what extent is the use of accounting concepts continuing, in the face of
discounted cash flow calculations?
Hypothesis 2
Although three financial measures are calculated and presented, Payback is the
only measure accepted by most decision-makers.
Sub-Problem 3
How and to what extent, do strategic investments promote intervention by
management to ensure positive results?
Hypothesis 3
Management manipulates cash flows to ensure a positive result when a project
is strategic of nature or if the majority of benefits are intangible in order to gain
acceptance within the purely financially based evaluation criteria.
The importance of attaining greater clarity on the main problem and sub-
problems is highlighted by several factors. These factors make effective capital
investment decisions imperative and include:
• The sensitivity of the economy to the volatile changes in the local, national
and global environment.
• The high levels of Rand expenditure on the acquisition of goods and
services by engineering projects.

7
• The opening up of international markets and creation of opportunities for
global expansion.
• Priority setting criteria are not consistently applied to all projects.
• Companies are focusing on functional efficiency instead of strategy.
• Most top managers play little if any role in the early studies of knowledge
acquisition, concept investigation and basic design of a development effort.
• Top managers tend to have an insular focus on technology projects, which
can result in actual management performance being below perceived
performance.
• Lack of top management buy-in is the principal reason that projects fail.
The future development of effective investment decisions in line with corporate
objectives will have important ramifications for engineering projects at Cadbury
South Africa.
1.4 THE DELIMITATIONS
1.4.1 Basis for the model
It is intended in this study to develop a model from the current literature that
Cadbury South Africa’s managers can use to assist decision-making regarding
capital expenditure. The aim of the study is to develop this model by integrating
what the literature reveals as alternatives to the usual financial capital budgeting
process and how this model can be included in the existing procedure. The
model will be specifically aimed at strategic investments as these are the type of
investments that usual generate problems under the current investment
process. The study does not intend to create a new system of capital
expenditure evaluation, only a tool that can be used in support of the existing
system to allow more effective decision-making.
1.4.2 Management level
As previously mentioned in section 1.1.2, the capex proposal system has
various levels of approval, namely, local, regional and group. The study will be
limited to the senior managers, middle managers and directors of Cadbury
responsible for decision-making regarding Cadbury South Africa. All other levels
such as junior managers and team leaders are excluded.

8
1.4.3 Subject of evaluation
According to Horngren, Foster and Datar (1997: 781) the capital expenditure
process can be broken up into five distinct interrelated steps.
1. Proposal generation
2. Review and analysis
3. Decision-making
4. Implementation
5. Follow-up
It is intended in this study to focus only on the review and analysis and the
decision-making steps of the capital expenditure process, with particular
emphasis on how to include strategic organisational goals within a process that
by default eliminates strategic projects.
The objective is to develop a model that can be used to justify those projects
that are strategically important but are rejected as their financial evaluation fails
the current decision criteria.
1.4.4 Geographic location
Cadbury South Africa is part of Cadbury Schweppes; therefore, the same
capital process is followed throughout the Cadbury Schweppes organisation.
This means that no geographic location that falls within the Cadbury group is
excluded.
1.5 DEFINITION OF KEY TERMS
1.5.1 Capital expenditure
Gitman (2003: 356) defines capital expenditure as “ an outlay of funds by the
firm that is expected to produce benefits over a period of time greater than one
year”. The definition highlights the key factors, benefits and period greater than
one year. Levy and Sarnat (1982: 15) define capital expenditure as “an
investment decision that management commits current resources to in order to
secure a stream of benefits in future years”.
For the purpose of this study, capital expenditure will be defined as the
investment of an organisation’s funds in projects that will produce benefit over a
period greater than one year.

9
1.5.2 Benefits
Gitman (2003: 361) defines a benefit for a capital expenditure as a cash inflow
that is a direct result of the capital expenditure. Horngren et al (1997: 781) state
that the benefits can be both quantitative and qualitative and although capital
expenditure analysis emphasises financial quantitative factors, qualitative
factors play an important role.
For the purpose of this study, benefit will be defined as the financial and other
qualitative aspects that positively impact on an organisation because of the
implementation of a capital expenditure proposal.
1.5.3 Black Box
Brealey and Myers (1991: 215) define a ‘black box’ as something that is
accepted and used but not understood. For example, a computer is a black box
as all users do not understand the exact workings or can fix it, but it can be
used.
For the purpose of this study, black box will be defined as something that is
used but not understood.
1.6 ABBREVIATIONS
1.6.1 CAPEX
Capex is the abbreviation used for capital expenditure.
1.6.2 DCF
DCF is the abbreviation used for discounted cash flow.
1.6.3 RAM
RAM is the abbreviation for Resource Allocation Model.
1.7 ASSUMPTIONS MADE
It is assumed that the middle managers, senior managers and directors of
Cadbury South Africa, as well as group middle and senior managers are
representative of the decision- makers that will utilise the developed model.
It is assumed that differences in cultures are nullified, with regard to capital
investment and that a Cadbury culture is prevalent with regard to capital

10
investment hence results are applicable throughout the organisation irrespective
of the geographical location of the sample.
It is further assumed that the alternative models that will be identified from the
literature study are relevant and applicable to the needs of Cadbury South
Africa.
1.8 IMPORTANCE OF THE STUDY
Salvatore (2001: 619) states that the application of new technological
breakthroughs may lead to new and better production methods, changes in
consumer tastes may make an organisation’s existing products outdated and
give rise for entirely different products, while mergers with other organisations
may significantly strengthen an organisation’s position. The above opportunities
are typical capital expenditure type opportunities and are strategic in nature. An
organisation's management team needs to be alert to explore these and other
opportunities (Salvatore, 2001:620).
According to Northcott (1992: 26), capital expenditure is an important
determinant of the future success of an organisation and this decision-making is
not an easy task. According to Salvatore (2001: 620), reasons for this are that
major capital expenditure projects are mostly irreversible and capex decision-
making usually involves substantial financial outlay in return for future, uncertain
returns. Poor capex decisions do not only misdirect financial resources, but can
also undermine the future strategic development and operations of an
organisation negatively impacting on the organisation’s wealth-creating
opportunities (Northcott, 1992: 28). The above indicates that strategic capital
expenditure decision-making is of critical importance to an organisation.
Cadbury South Africa, as part of the Cadbury group, has a detailed Resource
Allocation Model; this model does have limitations in that it focuses on certain
financial criteria that determine a project’s possible acceptance. The present
financial rules are currently focused on short-term benefits and this makes
strategic type investments difficult to justify. Over time, this could erode
Cadbury South Africa’ s ability to maintain its current market position. A model
that assists with justifying strategic investment decisions will improve Cadbury

11
South Africa’s ability to maintain its dominant market position as well as its
stated vision of ensuring continued wealth-creation for its shareholders in the
long term.
1.9 METHOD OF THE STUDY
This study is intended to develop a model for use by Cadbury South Africa
managers and group managers to assist with decision-making regarding capital
expenditures that operate in conjunction and in support of the existing process
model. The following procedure will be adopted to solve the main and sub-
problems:
1.9.1 Literature survey
The traditional “black box” model of capital investment analysis will be reviewed
and alternative, more strategic- based models will be reviewed and presented.
1.9.2 Empirical study
An empirical study consisting of the following will be conducted:
1.9.2.1 E-mail survey
An email survey will be conducted among middle managers, senior managers
and directors of the Cadbury Organisation using a questionnaire prepared by
the researcher, using information from the literature survey. The reason for
choosing these three management levels is that they decide what capital
expenditure proposals are presented or approved and hence should be able to
give a good indication of the current capital investment procedure.
1.9.2.2 Measuring instrument
The measuring instrument will take the form a comprehensive questionnaire,
developed by the researcher.
1.9.2.3 Sample
The Cadbury Schweppes hierarchal list will be used to gain the names and
email addresses of all current middle managers, senior managers and directors
in the organisation who are involved with capital investment decisions.

12
1.9.2.4 Statistical analysis of data
At the time of drafting the questionnaire, relevant statistical procedures for
interpreting and analysing the data will be discussed with a statistician.
1.9.2.5 Development of a decision-making model
The answers from the questionnaire and models from the literature study will be
combined, to propose a model that can be added to the existing capital
investment process.
1.10 STRUCTURE OF THE STUDY
The study has been divided into five chapters with the following content:
Chapter 1: Problem statement and definition of concepts.
Chapter 2: Literature review and theoretical framework.
Chapter 3: Research design and methodology.
Chapter 4: Presentation and discussion of results.
Chapter 5: Conclusion and recommendations.
13
CHAPTER 2
2 REVIEW OF THE RELATED LITERATURE
2.1 INTRODUCTION
The objective of this chapter is to explore what the literature states regarding
the “black box” model of capital budgeting where a manager can assess risk,
choose the right discount rate and generate net present value which then leads
to perfect decisions that maximise the organisation’s wealth (Brealey & Myers,
1991: 215). Alternative, strategic, models will be included to allow the proposal
of a hybrid model that can be utilised by Cadbury South Africa in support of its
existing resource allocation model that is based on the “black box model”. The
postulated hybrid model will allow senior management to improve their
evaluation of capital investment proposals, particularly strategic capital
investment proposals.
2.1.1 Area of evaluation
The subject of capital budgeting has been part of the theory of corporate
finance since 1919 when decision-making focused on the “humanities” rather
than the “economic science” (Dempsey, 1996: 1). The capital budgeting
process can be subdivided into four stages according to Dempsey (1996: 1),
namely:
• Identification and development of project proposals;
• Financial evaluation of projects;
• Implementation of projects; and
• Project review.
The focus of the majority of the finance literature is related to the financial
evaluation of projects which started in the late 1950’s with the move away from
the “humanities” towards the “economic science”, which occurred with the
development of discounted cash flow (DCF) calculations (Buckley, 1996: 17;
Dempsey, 1996; Johnson, 1994:79; Northcott, 1992:50; Brealey & Myers, 1991:
73-94).

14
The DCF calculations consisting of net present value (NPV) and internal rate of
return (IRR) has been considered the most effective method of analysis of
capital investment analysis (Buckley, 1996: 17; Dempsey, 1996; Johnson,
1994:79; Northcott, 1992:50; Brealey & Myers, 1991: 73-94).
Ryan (2002) in reviewing past empirical studies of capital budgeting practices
by managers, noted the increasing preference in use of the discounted cash
flow analysis, in particular the preference of use of NPV as the preferred capital
budgeting tool, indicating a match between academic theory and practice.
Trigeorgis and Mason (2001: 47) and Hall (1998: 22) found in their research
that many corporate managers overrule the analysis results from the DCF
techniques and use non-financial criteria in order to accommodate strategic
considerations. Their conclusions are in conflict with the findings of Ryan
(2002).
Pike and Wolfe (1988: 100) found that how investment decision-makers actually
made their decisions when faced with a strategic decision was still not clearly
defined and this was confirmed by Gitman (2003:445) and Mekonnen Akalu
(2002) who have postulated that despite NPV and IRR delivering good
decisions, a more strategic approach has been emerging towards capital
budgeting decisions in practice.
The above indicates a conflict between theory and practice with regard to
strategy and capital budgeting. In order to explore this gap between strategy
and capital budgeting theory and practice the literature review will include four
areas:
1. How capital investment impacts on the value of an organisation,
2. The link between capital investment and the strategy of an
organisation by briefly exploring strategy and then briefly identifying
the relevant cash flows and describing the “black box” model by
examining its components of decision criteria and risk,
3. The gap that exists between strategy and capital investment, and
4. Current models that the literature suggests as methods of closing the
gap between strategy and capital investment.

15
2.2 IMPACT OF CAPITAL BUDGETING ON THE VALUE OF AN
ORGANISATION
Strategy, capital investment and the value of an organisation are all linked with
each other in that they share the common purpose of achieving maximum
wealth for the shareholder. What constitutes the wealth of an organisation is not
the objective of this review but has been the objective of numerous texts
(Gitman, 2003; Northcott, 1992; Bierman & Smidt, 1980). It is sufficient to note
that the wealth of an organisation can be defined as the value of the share price
of its stock, which is based on the timings of its cash flows, their magnitude and
their risk (Gitman, 2003: 16).
Capital budgeting has an impact on the wealth of an organisation as it is
normally responsible for all expenditures that produce benefits longer than one
year (Aggarwal, 1993: 10; Bierman & Smidt, 1980: 4). Typical investments
covered by capital budgeting are buildings, machinery, advertising campaigns,
and information technology equipment.
The time span of capital budgeting determines the impact that it has on the
wealth of the organisation as the continued wealth or success of the
organisation is dependent on the decisions made at the present time while
committing the resources of the organisation in exchange for future benefits.
The commitment of resources in terms of time and money in investments that
may only deliver benefits to the organisation after a period of time, emphasises
the importance of the accuracy of capital budgeting and the effect that it can
have on the wealth of the organisation (Aggarwal, 1993: 10; Northcott, 1992:4;
Seitz, 1990: 3; Bierman & Smidt, 1980: 4). The closer the expected benefits are
to the present, the less the potential exists of negatively impacting on the wealth
of the organisation, as opposed to benefits that accrue over a longer period of
time that increase the risk of a negative result.

16
Of all the resources that capital investment can absorb, money can be
considered as the most important, as money can usually acquire the other
resources. This dictates that money needs to be used as effectively as possible,
which links with the goal of capital expenditure -wealth maximisation- which
occurs when the benefits of an investment exceed its original cost (Seitz,
1990:3).
Review of the above indicates that the wealth of an organisation is directly
linked to the capital budgeting process in that the goal of capital budgeting is to
increase the wealth of the organisation. Capital budgeting occurs over a period
greater than one year by definition. This then appears to tie it into the strategy
of the organisation. The following section will review how capital budgeting and
strategy are linked.
2.3 LINK BETWEEN CAPITAL BUDGETING AND STRATEGY
Wealth-maximising organisational strategy supports financial performance
objectives, and wealth-maximising financial decisions support organisational
strategy (Seitz, 1990: 563). Both of these need to be in harmony if an
organisation is to create long-term sustainable wealth. There is, however, a
potential bias against strategy within an organisation’s capital budgeting
process (Seitz, 1990: 563). This will be explored in the following section. The
objective of this section is to indicate that synergies exist between strategy and
capital budgeting.
2.3.1 Strategy
According to Shrivastava (1994:5), strategy is a concept that helps executives
to manage both the efficiency and the effectiveness of an organisation. It aligns
or matches the organisation with its environment. Bourgeois (1996:95) states
that there is no genuine definition for strategy, but rather general ideas shared
by managers. These ideas include a plan for the future, setting goals and steps
to reach them, methods to face competition, mission, course of action,
integrated decisions, and a battle plan.

17
Seitz (1990: 550) concluded that strategy for an organisation is the definition of
what business it is in as well as how it will position itself in relation to its
competitors. This was built on the military definition of strategy, which simply
stated, is that strategy is the preparation for battle while tactical decisions are
ones that are made during the battle.
Bierman and Smidt (1980:3) in converting this statement into financial terms
postulates that strategic investment decisions involve large sums of money, and
normally result in a departure from the way an organisation usually does
something, while a tactical decision involves relatively small amounts of money
and maintains the organisation’s way of doing things.
The organisation’s strategy must be supported by the capital budgeting policy
as the strategy creates the opportunities and the capital budgeting policy needs
to insure that these opportunities are utilised. The difference between strategic
investment and tactical investment should also be clearly defined.
Brealey and Myers (1991: 267) see this problem as a strategic fit between what
they define as “bottom-up” and “top down” processes where the tactical aspect
would be when a proposal originates from a functional manager “bottom-up” as
opposed to proposals from senior management “top-down”, which could be
considered to be more strategic in nature.
2.3.2 Relevant cash flows
The evaluation of capital expenditure alternatives requires that an organisation
determines the relevant cash flows. These are the incremental cash outflow
(Investment) and the resulting subsequent cash inflows (Gitman, 2003: 360).
A conventional pattern project includes three basic components (Gitman, 2003:
361; Johnson, 1994; Seitz, 1990):
1. An initial investment – relevant cash outflow for a proposed project at time
zero.
2. Operating cash inflows –the incremental after-tax cash inflows resulting from
execution of a project during its life.

18
3. Terminal cash flow- the after-tax non-operating cash flow occurring in the
final year of the project. It is usually attributable to liquidation of the project.
These three cash flows are depicted in Diagram 3
Diagram 3: Cash flow components
Time line for major cash flow components
Source: Adapted from Gitman (2003: 361)
2.3.3 Capital budgeting
Capital budgeting traditionally has been understood to be an ordered process
where information flows into some “black box” where it is digested and turned
into recommendations for action (Northcott, 1992:9). Northcott (1992), Brealey
and Myers (1991) have been among some who have challenged this traditional
“black box” theory of capital budgeting. The “black box” theory proposes that a
manager can assess risk, choose the right discount rate and generate net
present value which then leads to perfect decisions that maximise the
organisation’s wealth (Brealey & Myers, 1991: 215).
2 1 3 4 5 6 7 8 9 10 0
R 50,000
R 4,000
R 5,000
R 6,000 R 7,000 R 8,000 R 9,000
R 7,000 R 8,000 R 8,000 R 10,000
Operating Cash Inflows
Initial Investment
R 25,000
Terminal Cash Flow
End of Year

19
Capital budgeting as a process can be divided into four stages; identification
and development of investment proposals; financial evaluation of projects;
implementation of projects; and project review. The scope of this study
concentrates on the first two.
The financial evaluation portion has a number of tools to determine the wealth
that a project can create for the organisation; these methods can be split into
accounting based concepts and economic based concepts (Northcott, 1992:
26).
Five of the principal methods for evaluating capital projects are as follows:
1. Payback period (PP)
2. Accounting rate of return (AROR)
3. Net present value (NPV)
4. Internal rate of return (IRR)
5. Profitability index (PI)
Most large companies according to Ryan (2002) utilise all, one or more of these
methods when evaluating capital projects. Cadbury Schweppes, as previously
mentioned, utilises three of these, namely: Payback period, internal rate of
return and profitability index when evaluating capital projects.
2.3.3.1 Accounting concepts
From an accounting perspective, long term financial success is measured via
profitability, while short term financial success is measured on liquidity (Buckley,
1996: 17; Northcott, 1992: 31). Liquidity concerns are translated into questions
of how quickly an investment can repay its cost (Horngren et al, 1997: 782).
Probability considerations have been translated into questions concerning the
profit return generated by a capital investment on the investment it represents
(Northcott, 1992: 29).
Two main analysis techniques have arisen from the accounting perspective,
Payback period (PP) and accounting rate of return (AROR), also known as the
return on capital employed (Gitman, 2003: 387).

20
2.3.3.1.1 Payback Period (PP)
Payback period (PP) is concerned with liquidity and calculates the number of
years to recapture the initial investment in a project. If the Payback period
calculated is less than some predetermined required Payback period, the
proposal is accepted (Northcott, 1992: 27). The major shortcoming of this
method is that it ignores the benefits that occur after the Payback period and so
cannot be viewed as a measure of profitability over a project’s entire life
(Buckley, 1996: 17). PP calculation is represented by equation 1.
- - - - - - - - - - - - - - - - - - - - 1
This Payback period is often referred to in the literature as simple Payback and
according to Northcott (1992: 49), this simple Payback can be improved, by
discounting the cash inflows at the appropriate discount rate and determining
the time period for recovery of the initial investment. The discounted Payback
period (DPP) now incorporates the economic concept of the time value of
money, increasing the investment recovery time and hence takes more of the
investment’s cash inflows into account (Northcott, 1992: 49). The second
advantage of DPP is that the accept /reject criteria are not only based on an
arbitrary value set by an organisation but the investment can be considered as
successful if it pays back within its expected life span (Northcott, 1992:50).
DPP still ignores cash flow after the investment’s Payback period - a
disadvantage that it shares with PP. It retains it ability to focus on liquidity where
appropriate and remains a relatively simple analysis method to compute and
understand (Northcott, 1992:50).
receiptcash net Annual
outlay investment Initial =PP

21
2.3.3.1.2 Accounting rate of return (AROR)
Accounting rate of return (AROR) compares the profitability of a capital
expenditure to the capital employed in the investment. One of the problems with
this method is the selection of which way to represent profit and capital
employed (Thomas, DeLorenzo & Bray, 5). According to Northcott (1992: 31)
two different representations of AROR are in general use, this can be
incorporated as the initial capital employed in the investment or the average
capital employed over the life of the investment. AROR is represented by
equation 2.
- - - - - - - - - - - - - - - - - - - - 2
2.3.3.2 Economic concepts
From an economic perspective, less emphasis is placed on liquidity and
profitability and more on the maximization of shareholder wealth and the
consideration of risk (Salvatore, 2001: 619; Northcott, 1992: 34). The
combination of wealth maximisation objectives and risk considerations has led
to the development of capital investment evaluation techniques different to the
accounting techniques. Key to understanding the economic concepts is the time
value of money. According to Gitman (2003: 150) the concept of the time value
of money is simply illustrated by thinking about an interest –earning bank
account. Cash deposited in a bank account today earns interest on it causing a
larger amount of money to be received in the future. The rate of interest earned
reflects the anticipated inflation, the risk of lending money to the bank, and the
value that the bank must pay to persuade the investor to forgo the immediate
use of the money. Two main techniques based on the time value of money exist
for the evaluation of capexes, net present value (NPV) and the internal rate of
return (IRR) (Northcott 1992: 38).
employed capital Initial
annumper profit accounting Average =AROR

22
2.3.3.2.1 Net present value (NPV)
According to Horngren et al (1997: 783) the net present value technique finds
the expected net monetary gain or loss from a capex proposal by discounting all
expected future cash inflows and outflows to the present point in time, using the
required rate of return. Projects with a positive NPV are considered acceptable
as the return of these projects exceeds the cost of capital (Horngren et al, 1997:
783). The NPV calculation is represented by equation 3.
- - - - - - - - - - - - - - - - - - - - 3
2.3.3.2.2 The internal rate of return (IRR)
The internal rate of return focuses on finding the discount rate at which the NPV
of the project would be zero. This means that the IRR is the rate of return
earned by the project itself, and equates the present value of future cash flows
to the initial outlay (Horngren et al, 1997: 785). If the IRR is greater than the
cost of capital, the project is acceptable (Gitman, 2003: 403).
2.3.3.2.3 The profitability index (PI)
The profitability index (PI) is associated to NPV. NPV is the deviation between
the project value and cost. Profitability index is the ratio of project value to cost
(Johnson, 1994: 81). The profitability index indicates how much the investment
in total is going to return as a value over time, compared with the total
investment. The profitability index indicates the effectiveness of the capital
spent (Cadbury Schweppes, 2005). The PI is represented by equation 4.
- - - - - - - - - - - - - - - - - - - - 4
( )
periodsofnumberratediscount
investmentinitial
infowscash11
==
==
−+
=�=
n
k
CF
CF
CFk
CFNPV
o
t
o
n
tt
t
( )
periodsofnumberratediscount
investmentinitial
inflowscash
11
==
==
÷��
���
�
+= �
=
n
k
CF
CF
CFk
CFPI
o
t
o
n
tt
t

23
A positive NPV will result in a PI greater than one, and vice versa. A PI that is
greater than one indicates an attractive investment (Seitz, 1990: 51).
The presentation of the above concepts has been done in order to clarify their
use in the exploration of the gap between strategy and capital budgeting. To
summarise, the most important of these are Internal Rate of Return (IRR),
Payback Period (PP), Profitability Index, Accounting rate of return (AROR) and
net present value (NPV).
2.3.4 Risk
Visser (2004:301) quotes Haimes (1998) as proposing the following generic
definition of risk as “a measure of the probability and severity of adverse
effects”. Risk is applicable to various areas and is defined differently in different
areas. Risk is an abstract concept, and Visser (2004:302) proposes that it has
two dimensions, namely (a) the probability of a particular result occurring and
(b) the impact that the result will have should it occur. Risk with reference to
capital budgeting is explored below.
2.3.4.1 What is risk in capital budgeting?
Gitman (2003: 427) defines risk with regard to capital budgeting as follows:
“ The chance that a project will prove unacceptable; or more formally, the
degree of variability of cash flows”.
The risk is due to the variability of the expected cash inflows as the expected
expenditure or cash outflows can usually be determined with a large degree of
certainty. The cash inflows are usually determined from a number of variables
linked to revenues, expenditures and taxes. Examples are cost of raw materials,
labour rates, utility costs, level of sales. The risk is a result of the interaction of
the underlying variables (Gitman, 2003:427).
The assessment of risk for a capital expenditure is an evaluation of the
probability that the cash inflows will be large enough for project assessment.
There are two methodologies of dealing with risk, namely, behavioural and
explicit. Behavioural approaches enable management to get a “feel” for the risk
levels while explicit methods overtly recognise risk.
24
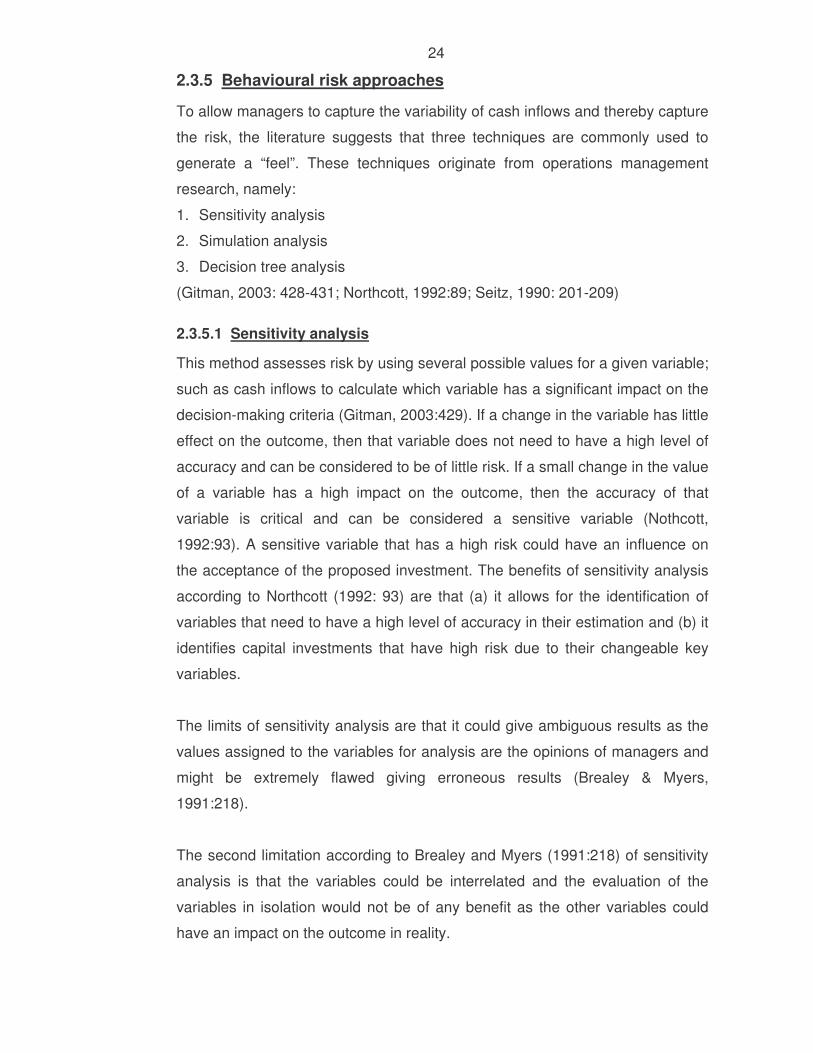
2.3.5 Behavioural risk approaches
To allow managers to capture the variability of cash inflows and thereby capture
the risk, the literature suggests that three techniques are commonly used to
generate a “feel”. These techniques originate from operations management
research, namely:
1. Sensitivity analysis
2. Simulation analysis
3. Decision tree analysis
(Gitman, 2003: 428-431; Northcott, 1992:89; Seitz, 1990: 201-209)
2.3.5.1 Sensitivity analysis
This method assesses risk by using several possible values for a given variable;
such as cash inflows to calculate which variable has a significant impact on the
decision-making criteria (Gitman, 2003:429). If a change in the variable has little
effect on the outcome, then that variable does not need to have a high level of
accuracy and can be considered to be of little risk. If a small change in the value
of a variable has a high impact on the outcome, then the accuracy of that
variable is critical and can be considered a sensitive variable (Nothcott,
1992:93). A sensitive variable that has a high risk could have an influence on
the acceptance of the proposed investment. The benefits of sensitivity analysis
according to Northcott (1992: 93) are that (a) it allows for the identification of
variables that need to have a high level of accuracy in their estimation and (b) it
identifies capital investments that have high risk due to their changeable key
variables.
The limits of sensitivity analysis are that it could give ambiguous results as the
values assigned to the variables for analysis are the opinions of managers and
might be extremely flawed giving erroneous results (Brealey & Myers,
1991:218).
The second limitation according to Brealey and Myers (1991:218) of sensitivity
analysis is that the variables could be interrelated and the evaluation of the
variables in isolation would not be of any benefit as the other variables could
have an impact on the outcome in reality.

25
2.3.5.2 Simulation analysis
This analysis method is similar to sensitivity analysis but differs in that rather
than altering one variable at a time, multiple variables are altered and treated as
if they are risky (Gitman, 2003: 431; Nothcott, 1992:91; Seitz, 1990:201).
The most commonly used simulation model is the Monte Carlo technique that
derives its name from the use of values that are randomly drawn, but with the
probability of each draw controlled to approximate the actual probability of
occurrence.
According to Nothcott (1992:92), to implement a Monte Carlo simulation a
manager has to:
1. Identify the important variables of the capital investment;
2. Determine the range of these variables;
3. Give probabilities to the range of the variables;
4. Develop an application to run the simulation.
The output of the model gives the manager an expected result and a range of
alternative results after a large number of itineration that allows management to
gain an opinion of the risk of the proposed capital investment (Nothcott,
1992:92). The limitations of this analysis are that the input is dependent on the
decision-maker, and depends on the accuracy and unbiased input of the
decision-maker to ensure that the outcomes are realistic (Northcott, 1992:92;
Brealey & Myers, 1991: 228).
2.3.6 Decision tree analysis
Where decisions consist of a sequence of dependent decisions such as an
opportunity to expand or abandon a factory depending on sales during the first
year, decision tree analysis can be utilised (Lawrence & Pasternack, 2002:349;
Seitz, 1990:205).
Lawrence and Pasternack (2002:349) describe a decision tree as a
chronological representation of the decision process where the root of the tree
is a node, representing the present time from which a network of nodes,
representing future points in time where decisions are required radiate.

26
Branches representing possible decisions or states of nature link these nodes.
Table 2.3-1summarises the elements of a decision tree.
Table 2.3-1: Decision tree construction.
Decision Tree Construction
Node Type Branches Data on Branches
Decision
(Square Nodes)
Possible decisions that
can be made at this time.
Cost or benefit
associated with the
decision.
States of Nature
(Circle Nodes)
Possible states of nature
that can occur at this
time.
Probability the state of
nature will occur given all
previous decisions and
states of nature
Source: Lawrence and Pasternack (2002: 349)
Decision tree analysis, as all risk measurement techniques, does not make the
decision but allows the decision-maker to be able to gain a better understanding
of the consequences of a particular decision (Seitz, 1990:207).
Cash flow forecasts depend on certain assumptions, usually based on the
organisation’s future investment and operating structure. These assumptions
are usually not questioned by the decision-makers, decision trees allow the
underlying assumptions to be brought to the attention of the decision-makers by
displaying the links between the present and future decisions, allowing an
organisation to find the strategy with the best result (Brealey & Myers, 1991:
236).
Decision trees can be combined with simulation models like the Monte Carlo
model and the combined analysis can deliver a more specific view of risk and
profitability than the other two used in isolation. The combined analysis can
allow organisations to consider ways in which to reduce risk and allows for a
better understanding of whether the expected profitability is worth the risk
(Brealey & Myers, 1991: 236; Seitz, 1990:208).

27
To better demonstrate a decision tree Diagram 4 depicts an example of a
research and development decision to develop a drug and then market it taken
from a case study by Copeland and Keenan (1998b: 140). This example
demonstrates the decision nodes, states of nature and the probabilities as
described by Table 2.3-1.
Diagram 4: Decision tree for drug development.
Source: Adapted from Copeland and Keenan (1998b: 140)
Decision trees have the following problems according to Brealey and Myers
(1991:236):
1. They can become very complex depending on the number of decisions and
possibilities.
2. They do not consider all possible options and do not indicate how to value
options and are merely a good way of summarising cash flow
consequences.
2.3.7 Explicit risk approaches
The behavioural risk approaches that have been explored above allow
organisational decision-makers to get a “feel” of the risk inherent with a
particular capital investment. The explicit approaches are all linked to the
economic evaluation of a capital project, where the discount factor that is used
to calculate the time value of money, is either altered to reflect the risk, or if
used as a decision criterion, is set to a value that reflects the anticipated risk of
the investment.

28
To understand how risk is explicitly allowed for, it is necessary to comprehend
the discount factor. The discount factor is variously referred to throughout the
literature as the discount rate, required return, cost of capital, opportunity cost
and hurdle rate (Gitman, 2003: 159; Brealey & Myers, 1991:13; Seitz, 1990:43).
The meaning remains the same and can be summarised as the return forgone
by investing in a project rather than investing in the financial markets (Gitman,
2003: 159; Brealey & Myers, 1991:13; Seitz, 1990:43). Simply put, the discount
factor is the rate that a project must achieve to match the cost of generating the
funding needed to implement the project.
Capital investment is rarely funded by organisations from a single source but if it
were then the discount rate would be the cost of finance or interest rate. Capital
investment is usually funded from multiple sources and the overall cost of
capital would have to be one that reflects the different sources of funding
(Gitmann, 2003: 483; Broyles, 2003:249; Northcott, 1992: 77). Two methods of
calculating the overall cost of capital are:
1. Weighted average cost of capital (WACC.),
2. Capital asset pricing model (CAPM)
2.3.7.1 Weighted average cost of capital (WACC)
The weighted average cost of capital (WACC) according to Bierman and Smidt
(1980: 258) represents the average cost of funds to an organisation and as
such represents the sources of capital and their uses. WACC for a given capital
structure reflects the characteristics of organisations assets and in particular,
their average risk as well as the timing of expected cash proceeds. WACC
represents an averaging of all the financial risks of an organisation.
The calculation of the weighted average cost of capital (WACC) according to
Northcott (1992:77) has several steps:
1. The identification of the ranges of the sources of long-term capital.
2. The determination of the cost of the capital sources.
3. The determination of the market value of the capital sources.
4. The calculation of the WACC.

29
Four sources of long-term capital exist;(a) long-term debt, (b) preferred shares,
(c) common shares, and (d) retained earnings (Gitman, 2003: 472; Lovemore,
1996: 87). The cost of each of the above mentioned sources of capital can be
calculated, this is not being explored in this text but is extensively covered in
management accounting texts.
It is sufficient to note for the purpose of this text that the cost of long-term debt
is a function of the interest payable, the tax rate, any issuing expenses and the
market value of the debt. The cost of equity capital sources (ordinary or
preference shares) for listed organisations depends on dividend payable, the
cost of issuing equity and the market price of shares. Retained earnings are
usually a less expensive source of capital than issuing new shares, due to the
fact that they do not incur the transaction costs associated with the public
offering of shares (Gitman, 2003: 473; Bierman & Smidt, 1980:245-251).
The weightings given to each source of funds in the WACC calculation are
based on the market value of the debt, ordinary shares and preference shares
and are impacted on by the relative proportions employed of each capital
source (Nortcott:1992:78).
The calculation of WACC once the sources of funds, their costs and their
relative weightings have been determined is relatively easy as represented by
Table 2.3-2 adapted from Gitman (2003:483).
Table 2.3-2: Example of the calculation of WACC.
Source: Adapted from Gitman (2003:483)
Sources of capitalWeight
(1)Cost(2)
Weighted cost
[(1)x(2)](3)
Long term debt 40% 5.60% 2.2%Preferred shares 10% 10.60% 1.1%Common stock shares 50% 13% 6.5%
Totals 100% 9.8%
Weighted average cost of capital (WACC)= 9.8%
Calculation of the weighted average cost of capital

30
The literature identifies two problems with the use of WACC for all projects,
namely (Lovemore, 1996: 87-89; Northcott, 1992:79; Bierman & Smidt, 1980:
258):
1. WACC is a reflection of the current cost of a pool of funds used for financing
the current investments of the organisation. An investment outside of the
normal activity of an organisation should have a different risk profile and
hence the current WACC rate will not sufficiently allow for that risk profile.
2. If the investment is large enough, it might alter the WACC rate by its
implementation, for example, a large loan might have to be incurred that
could then alter the weighting of the long term debt and hence the WACC
rate.
As WACC does not consider unique risk, it could lead to the acceptance of a
high return but overly high-risk projects (Brealey & Myers, 1991: 182). A model
suggested by the literature that considers a project’s unique risk is the capital
asset pricing model (CAPM).
2.3.7.2 Capital Asset Pricing Model (CAPM)
According to Samuels, Wilkes and Brayshaw (1990: 216), the CAPM assess
risk by showing the connection between individual project returns and the
market for risky assets as a whole. The CAPM evaluates the project’s unique
risk against its own returns and not the return that an investor could earn from
the organisation’s cost of capital (Samuels et al, 1990:216).
Risk, as viewed by investors, needs better definition to allow for a better
understanding of the CAPM model and hence is briefly discussed. Northcott
(1992: 81) defines risk as the unpredictability of returns from an investment.
Gitman (2003: 234) breaks risk down into two components (a) diversifiable risk
and (b) non-diversifiable risk.
Diversifiable risk or unsystematic risk is considered by Gitman (2003:234) to be
the portion of an investment’s risk that can be associated with random causes
and that can be eliminated by the use of diversification. Examples of
organisational specific diversifiable risks are: strikes, lawsuits and loss of a key
account (Gitman, 2003:234).

31
Non- diversifiable risk or systematic risk according to Gitman (2003:234) is that
portion of an investment’s risk that is attributable to market forces, affects all
organisations in that market place, and as such cannot be eliminated by
diversification. Examples of systematic risks are war, inflation, international
incidents and political events (Gitman, 2003:234).
Investors are able to establish a portfolio of investments that can eliminate
diversifiable risks but are unable to eliminate non-diversifiable risks, hence non-
diversifiable risk is the only important risk and as such, the measurement of
non-diversifiable risks in the selection of investments with the best risk return
characteristics is the most important (Gitman, 2003:234).
The CAPM model links non-diversifiable risk and the return for all assets. A
measure of non-diversifiable risk is the beta coefficient (�).
Beta Coefficient (�)
The beta coefficient, �, is an expression of the “market sensitivity” of an
investment, or how volatile it is compared with the “normal volatility” of the
market (Nothcott, 1992:82). A beta (�) of one indicates that changes in an
investment’s returns agree precisely with market fluctuations (Northcott,
1992:82). A � of less than one reflects a low risk investment whose returns are
more stable than the overall market, and a � of greater than one indicates an
investment whose returns are more volatile than overall market movements
(Northcott, 1992:82). The estimation of � for an organisation is complex and is
not included in detail in this text as it is not central to the problem. It is,
therefore, sufficient to note that � can be derived using three methods, namely:
1. � based on historical returns
The � is calculated using monthly holding period returns for security and the
market portfolio for a period of 3 to 5 years with the risk-free rate for a particular
month as well (Seitz, 1990:259).
2. � for comparable organisations
The � is estimated by referring to other companies with similar risk
characteristics (Seitz, 1990:259).

32
3. State of nature models for � estimation.
The return for the market portfolio and holding-period return are estimated
under a variety of conditions. These estimates are then used to compute a
covariance and a � (Seitz, 1990:259).
CAPM equation
The CAPM uses the � coefficient to measure non-diversifiable risk and is
represented by equation 5 (Gitman, 2003: 238; Northcott, 1992: 85; Brealey &
Myers, 1991: 194; Seitz, 1990:263).
- - - - - - - - - - - - - - - - - - - - 5
The term (Rm-Rf) reflects the “market premium, that is, the return over and
above the risk free rate which the market earns.
According to Northcott (1992:86) and Seitz (1990:253) the CAPM approach to
determine the risk adjusted discount rate is complex and is based on a number
of underlying assumptions about the model and the market, these are:
• That the market is efficient and market � is reliable.
• That the CAPM model, which is a single time model, is appropriate for
assessment of multiple time period investments.
• That the � of doubt is zero or can be found
• That capital markets are perfect and investors are economically rational and
risk adverse.
Gitman (2003: 245) states that CAPM is not applicable to assets such as plant
and equipment owing to indivisibility, relatively large size, limited number of
transactions and absence of an efficient market for such assets. Despite the
above-mentioned limitations, the CAPM is a useful conceptual framework for
the evaluation and linking of risk and return and is considered theoretically
better than WACC (Gitman, 2003:245; Northcott, 1992:86).
( )[ ]
investmenttheofbetaThe
returnmarketThe
returnofratefreeriskThe
ReturnOfRateRequired
==
==
×−+=
A
m
f
A
afmfA
R
R
RRR
RRRRRR
β
β

33
2.4 GAP BETWEEN STRATEGY AND CAPITAL BUDGETING
Brealey and Myers (1991: 918) comment that since 1964 financial authors have
been questioning how strategic financial decisions are made and felt that even
in 1991 this answer was still not present. Gitman (2003:445) confirms that even
in 2003 the statement of Brealey and Myers (1991:918) still remains true and
postulates that although traditional approaches to capital budgeting yielded
good answers, more strategic approaches to capital decision-making was still
emerging.
The indicated dissatisfaction with the commonly used financial evaluation
methods, which are the discounted cash flow techniques of NPV and IRR (Hall,
1998; Buckley, 1996: 17; Johnson, 1994:79; Northcott, 1992:50; Brealey &
Myers, 1991: 73-94) can be linked to their dependency on the perfect market
paradigm (Dempsey, 1996: 9). According to Dempsey (1996:9), this paradigm
states that an organisation’s value reflects the present value of the
organisation’s expected future net cash flows capitalised fittingly, including
expected cash flows from future investment chances. Put another way, this
proposes that the cash flows, discount rates and other inputs into the financial
evaluation equations can be calculated for each and every situation accurately
and then evaluated and relied on to give the correct answer. This causes
managers to be directed away from strategically necessary investments
because of the strategic investment’s lack of amenability to quantitative analysis
(Dempsey, 1996: 9; Brealey & Myers, 1991:268).
The detractors of DCF methodology, according to Trigeorgis and Mason (2001);
Hayes and Garvin (1982), hold a common concern that DCF holds a bias to
analyse the analysable so that an organisation over time allows itself to sink
slowly as the only proposals that allow for convincing DCF/NPV type analysis
are the incremental ones. The radical long-term view or strategic view that is
more difficult to quantify and which does not fit neatly into a DCF analysis is
ignored.
According to Dempsey (1996:13), the view expressed above would indicate that
if the future is highly uncertain then capital budgeting analysis is ineffective as it
could be considered to be a waste of time to attach discount rates to projected

34
cash flows when neither the cash flows nor rates are known with any certainty.
Ryan (2002), in review of past empirical studies and from research, found the
continued use of the supposedly wrong Payback method. Dempsey (1996)
postulates that this is due to the significant information that it provides, such as
amount of cash that can be spent on a capital project and when its return is
due.
Table 2.4-1represents the comparative results of prior studies as compiled by
Ryan (2002) that indicate the prevalence of the Payback period and the
increasing use of discounted Payback methods. Table 2.4-2 represents a
summary of the empirical research that Ryan (2002) performed and indicates
that NPV is most often used followed by IRR and then Payback. This supports
Dempsey (1996) in his statement that Payback maintains its prevalence.
Managers are therefore forced by the academics into choosing an
economic/normative approach or a strategic/managerial approach to capital
investment decision-making.

35
Table 2.4-1: Comparative results of prior studies.
The following abbreviations are used: Payback: PB, Internal Rate of Return: IRR, Net Present Value: NPV, Profitability Index: PI, and Accounting Rate of
Return: AROR.
Source: Adapted from Ryan (2002:11)

36
Table 2.4-2: Comparison of basic capital budgeting tools.
Source: Adapted from Ryan (2002:12)

37
2.5 ALTERNATIVE MODELS
The previous sections indicated that academics are unequivocal in the advice
that they give to organisations and managers about how to appraise large scale
capital investment projects. The net present value rule, based upon the
discounting of decision contingent cash flows at the organisation’s opportunity
cost of capital is regarded as the definitive investment appraisal technique.
Although managers are faced with a variety of financial models when appraising
capital projects, not all managers accept the theoretical consensus about which
ones to use (Gitman, 2003: 445). Whilst there are strong theoretical
justifications for the use of discounted cash flow based models, managers
continue to use non-DCF appraisal techniques such as payback (Ryan: 2002).
There is a growing recognition by management that the strategic implications of
current capital investment decisions are not adequately addressed by traditional
approaches to capital investment appraisal (Ryan, 2002). Although attempts are
made to quantify in financial terms the strategic benefits from a given
investment, many perceived benefits are left out of the appraisal process
because they lack precise financial quantification. This under-specification of
the strategic benefits associated with given capital investment decisions has
given rise to alternative models to investment appraisal that combine the
economic/normative approach with the strategic/managerial approach.
Three models that address these shortcomings are (Mauboussin: 1999;
Managementor: 2000; Samuels et al: 1990):
(1) The real options model;
(2) The financial appraisal profile model and
(3) The Samuels, Wilkes and Brayshaw 3 stage model.

38
2.5.1 Real Options model
2.5.1.1 Introduction
The real option model extends the financial call option theory to options on real,
or non-financial, assets. The financial call option gives the owner the right, but
not the obligation, to buy or sell an asset at a particular price (exercise price)
within a predetermined period (Mauboussin, 1999: 5; Copeland & Keenan,
1998a: 40). This is like an organisation that has a real option, which is the right
but not the obligation to execute a potential value adding investment. Examples
of such investments are: new plants, line extensions, joint ventures and
licensing agreements (Mauboussin, 1999: 5). Copeland & Keenan (1998a: 41)
identify five variables that act on an option and impact on the value of the
option, namely:
• The value of the option increases with the value of the underlying variable,
• The value of the option increases with its uncertainty,
• The value of the option decreases as the exercise price goes up,
• The period for which the option is valid increases its value as the longer it is
valid the larger the uncertainty,
• The time value of money increases the value of the option (risk free rate)
because present value of the exercise cost falls as the interest rates rise.
The real option model, according to Mauboussin (1999: 5) is best used as a
complement to DCF analysis as it adds the important dimension of analytical
flexibility, by melding strategic intuition with analytical rigour. The real option
model, because it uses financial market data also has the added benefit of
being aligned with the real world. The real options imbedded in a capital
investment can alter the evaluation of the investment when taken into account;
this is represented by equation 6.
- - - - - - - - - - - - - - - - - - - - 6
optionrealofValueNPVNPV ltraditionastrategic +=

39
2.5.1.2 Similarities between call options and project investments
It has been mentioned previously that a project investment is similar to a
financial call option as both entitle the organisation to the right but not the
obligation to acquire an asset. Luehrman (1998: 52) has mapped this similarity
between a European call option and a project investment as represented by
Diagram 5.
Diagram 5: Mapping an investment opportunity onto a call option
Source: Adapted from Luehrman (1998: 52)
Projects usually involve the expenditure of capital to acquire or build a
productive asset; the expenditure is analogous to the exercising of an option on
a share of stock (Luehrman, 1998:52). With reference to Diagram 5 the amount
of capital spent corresponds to the option’s exercise price (X). The present
value of the asset built or bought corresponds to the option’s share price (or
stock price) (S). The length of time that the organisation can defer the
investment decision without losing the opportunity corresponds to the option’s
time to expiration (t). The uncertainty about the future value of the project’s cash
flow or risk corresponds to the standard deviation of returns on stock (�). The
time value of money is represented for both by the risk free rate of return (rf)
(Luehrman, 1998: 52). These five variables are directly related to the variables
that affect the value of an option as discussed in section 2.5.1.1 above.

40
2.5.1.3 Capital investment options
The option-based approach to capital investment analysis is not simply the
application of a new set of valuation equations and models. It requires new
methods of framing strategic questions, these questions change from what will
be gained from moving from point A to point B to if the organisation starts going
down the path from point A to point B, what options will become available and
what value can be gained from the ownership of those options (Amram &
Kulatilaka, (1999: 95)? The identification of real options according to Amram
and Kulatilaka, (1999:96), Mauboussin (1999: 10) and Copeland and Keenan
(1998a: 41) is not an easy task and can be easily overlooked. Amram and
Kulatilaka (1999:96), Mauboussin (1999: 10) and Copeland and Keenan
(1998a: 41) suggest that real options can be classified into three main groups:
Invest/grow options, defer/learn options and disinvest/shrink options, each of
these groups can be further expanded and defined, some of these options are
interrelated. These are explored below (Mauboussin, 1999: 10):
1. Invest/Grow Options
• Scale up: This is where initial investments scale up to future value-creating
opportunities. Scale-up options require some prerequisite investments. For
example, a distribution company may have valuable scale-up options if the
served market grows.
• Switch up: A switch—or flexibility—option values an opportunity to switch
products, process, or plants given a shift in the underlying price or demand
of inputs or outputs. One example is a utility company that has the choice
between three boilers: natural gas, fuel oil, and dual-fuel. Although the dual-
fuel boiler may cost the most, it may be the most valuable, as it allows the
company to always use the cheapest fuel.
• Scope up: This option values the opportunity to transfer an investment
made in one industry into another, related industry. A company that
dominates one sector of e-commerce and transfers that success into a
neighbouring sector is exercising a scope up option.
2. Defer/Learn
• Study/start: This is a case where management has an opportunity to invest
in a particular project, but can wait some period before investing. The ability

41
to wait allows for a reduction in uncertainty, and can hence be valuable. For
example, a real estate investor may acquire an option on a parcel of land
and exercise it only if the contiguous area is developed.
3. Disinvest/Shrink Options
• Scale down: Here, a company can shrink or downsize a project in
midstream as new information changes the payoff scheme. An example
would be an airline’s option to abandon a non-profitable route.
• Switch down: This option places value on a company’s ability to switch to
more cost-effective and flexible assets as it receives new information.
• Scope down: A scope-down option is valuable when operations in a related
industry can be limited or abandoned based on poor market conditions and
some value salvaged. A conglomerate exiting a sector is an example.
Gitman (2003: 446) presents four major types of real options as per table Table
2.5-1. These options are similar to the options presented by Amram and
Kulatilaka (1999:96), Mauboussin (1999: 10) and Copeland and Keenan
(1998a: 41) presented above.
Table 2.5-1: Major types of real options
Source: Adapted from Gitman (2003: 446)
O p tio n T y p e D e s c rip tio n
A b a nd on m e n t o p tio n T h e op tio n to a ba n do n o r te rm in a te a
p ro je c t p rio r to the e nd o f its p la nn e d
life . T h is o p tion a llo w s m a n a g e m en t
to a vo id o r m in im ize lo sse s on
p ro je c ts th a t tu rn b a d .
F le x ib ility o p tion T h e o p tio n to in co rpo ra te fle x ib ility
in to th e o rg a n isa tio n ’s o p e ra tio n s,
p a rticu la rly p rod u c tion in p u ts .
G ro w th op tio n
T h e o p tio n to d e ve lo p fo llo w -on
p ro je c ts , e xp an d m arke ts , e xpa n d
p la n ts an d so o n , w h ich w o u ld no t b e
p o ss ib le w ith o u t im p le m e n ta tio n o f
th e p ro je c t th a t is b e ing e va lu a ted .
T im in g o p tion T h e op tio n to d e te rm in e w h e n
va rio u s a c tion s w ith re sp e c t to a
g ive n p ro je c t a re ta ken . T h is o p tion
re co g n ize s th e o rg a n isa tio n ’s
o p po rtu n ity to d e la y acce p tan ce o f a
p ro je c t. To re fle c t n e w in fo rm a tio n .

42
2.5.1.4 Determining the value of a real option
Mauboussin (1999: 13) states that there are three steps in turning real options
into usable results.
1. Accurately identify a real option.
2. Use the real options model itself.
3. Consider the potential differences between option-model derived value and
real-world value
The literature suggests that there are two methods for calculating the value of a
real option, namely:
1. The binomial option pricing model
2. The Black-Scholes formula.
The mathematics behind these methods are complex, and available in detail in
the option literature, the text will only give a brief understanding of these
methods which are further detailed in ANNEXURE A and ANNEXURE B
2.5.1.4.1 Binomial option pricing model
Mauboussin (1999: 6) proposes that the most commonly used model for real
option evaluation is the binomial option-pricing model. According to Mauboussin
(1999:6) the binomial model describes price movements over time, where the
asset value can move to one of two possible prices with associated
probabilities. Decision trees, discussed in section 2.3.6 above, are commonly
used to represent the binomial model and Diagram 6 represents the binomial
process through a decision tree (Copeland & Keenan, 1998: 140b; Luerhrman,
1997:138). As an option is the right but not the obligation to make an
investment, the payoff scheme to the option holder is asymmetric, with the
option only being exercised if positive and unexercised if worthless. In reviewing
Diagram 6 the time and range of outcomes are shown as important to the option
value (Mauboussin, 1999:6).

43
Diagram 6: The Binomial Model
Source: Adapted from Mauboussin (1999:6)
2.5.1.4.2 Black-Scholes option pricing model
The second commonly referred to valuation method is the Black-Scholes model
which is a narrow case of the binomial model (Mauboussin, 1999: 7; Luehrman,
1998: 52; Copeland & Keenan, 1998a: 40; Leslie & Michaels, 1997: 99). The
drivers of the option value as discussed in section 2.5.1.1 above can be
condensed into five simple inputs (Mauboussin, 1999:7):
1. Current value of the underlying asset (s)
2. Strike price of the option (x)
3. Time to expiration (t)
4. Risk free interest rate (Rf)
5. Variance in the value of the underlying asset (�²)
These inputs are related to Black-Scholes model as per Diagram 5 and their
use in calculating the option is demonstrated in ANNEXURE A.

44
2.5.1.5 Comment on real option model
The real option model attempts to capture the flexibility that normal DCF
calculations fail to recognise by capturing both the direct cash flows from
traditional NPV and a real option value that would reflect operating and strategic
adaptability. The one limiting factor to the widespread use of real option
analysis can be attributed to the complexity of the mathematics involved in the
base calculations.
2.5.2 Financial appraisal profile (FAP) model
The main attributes of the Financial Appraisal Model are that it adopts a
“management team” approach in the evaluation of capital investments. The
approach is a profile approach, rather than the reliance on only a single criterion
such as net present value. This wider profile is better able to provide analysis of
the financial, risk and strategic merits of an investment decision
(Managementor, 2000).
There are three parts to the FAP model according to Managementor (2000) that
have to be calculated, namely:
1. The NPV profile (NPVP).
2. The risk index (RI) that is based on the highest risk value.
3. The strategic index (SI). This is calculated by the multiplication of corporate
ranking and project strategic score, based on a subjective viewpoint.
2.5.2.1 The NPV profile (NPVP)
The NPV profile is the NPV extended by the inclusion of the discounted
Payback period (DPP), the discounted Payback index (DPI) and the marginal
growth rate (MGR) into the financial profile of a capital investment proposal
(Limes Consultancy, 2003; Managementor, 2000). These are explored below:
1. NPV is the net present value of the annualised cash inflows of the
investment (Refer to section 2.3.3.2.1 above). The discounting factor used
for the NPV calculation is the risk free rate. The risk free rate is the cost of
capital that has not been modified for risk or organisational infrastructure
costs (Limes Consultancy, 2003; Managementor, 2000).

45
2. DPP is the Payback period of the project using the discounted cash inflows
(Refer to section 2.3.3.1.1 above).
3. DPI is the number of times that the initial cost of the investment will be
recovered over the project’s life and is calculated by dividing the
accumulated discounted cash flows by the initial capital cost and is an
indication of the project’s profitability (Limes Consultancy, 2003;
Managementor, 2000). DPI is represented by equation 7.
- - - - - - - - - - - - - - - - - - - - 7
4. MGR is the marginal rate of return on the project after discounting the cash
flows at the cost of capital (risk free rate) (Limes Consultancy, 2003;
Managementor, 2000). MGR is an indicator of a project’s rate of net
profitability (Limes Consultancy, 2003; Managementor, 2000). MGR is
represented by equation 8.
- - - - - - - - - - - - - - - - - - - - 8
The FAP model uses the net present value as an initial evaluation criterion of
risk and the hurdle figure used has to decided on by the organisation’s senior
management. If an investment does not meet the required criterion then it is
rejected in the initial evaluation (Managementor, 2000).
NPVP evaluation provides several measures based on consistent data, and
acts as a measure of a project’s suitability based on a number of financial
measures (Limes Consultancy, 2003). An example of how the NPVP is
calculated is demonstrated in ANNEXURE C.
outlay investment Initial inflowscash net of luePresent va =DPI
( )[ ]
indexpaybackdiscountedlifeproject
1001/1
==
×−=
DPI
n
DPIMGR n

46
2.5.2.2 Risk index
The risk index reflects the extreme risk impact and value judgment uncertainty
of an investment and consists of several risk elements dependent on the
analysis of the investment’s environmental situation (Managementor, 2000).
As previously mentioned in section 2.3.4 above, Visser (2004:302) proposes
that a risk element has two dimensions, namely (a) the probability of a
particular result occurring and (b) the impact that the result will have should it
occur. These dimensions can be expressed mathematically by equation 9.
- - - - - - - - - - - - - - - - - - - - 9
The value of risk of each element is the accumulated averages of the risk
figures perceived by individual team members of the evaluation team. Each
member of the evaluation team assesses the impact of risk and assigns
probability of occurrence with respect to each element of risk (Managementor,
2000).
The project risk index is the highest risk value of the individual risk elements.
2.5.2.3 Strategic Index
In the conventional “black box” model, strategic benefits are usually omitted due
to the inability to quantify them in financial terms as discussed in section 2.4.
The FAP model allows strategic benefits to be identified and evaluated in a
meaningful manner by using the Strategic Index (SI) (Managementor, 2000).
The strategic index is calculated by means of corporate ranking (CR) and
project strategic score value (PSSV). Corporate ranking (CR) is the weight
placed on a particular strategic benefit by senior management in order to reflect
its importance with relation to other strategic benefits. Project strategic score
value represents the benefit level within a given project, these factors (PSSV)
impactofdegreeoccurranceofyprobabilit
riskofdegree
Pr
===
×=
×=
I
P
R
IPR
or
eConsequencobabilityRisk

47
and (CR) are derived from the subjective estimates of experts in the
organisation (Managementor, 2000).
The strategic index (SI) is then calculated by calculating the weighted average
of (CR) and (PSSV).
2.5.2.4 Using the FAP Model
The financial appraisal model presents- after calculation of the net present
value profile (NPVP), the risk index (RI) and the strategic index (SI)- a wider
vision of the investment to the decision-makers. It provides a financial appraisal
in the NPVP, takes risk into account via RI. It does it slightly differently to the
“black box” model but is not superior at this stage to the “black box “model. The
differentiating factor that closes the gap between strategy and capital budgeting
is the strategic index (SI).
2.5.3 The Samuels, Wilkes and Brayshaw three stage model.
This model attempts to balance the strategic and numerical considerations of a
decision that contains an element of quantitative, by separating the objective
quantifiable from the judgemental elements (Samuels et al, 1990:167).
Samuels et al (1990:167) propose that three stages are used in this process,
namely:
1. Strategic evaluation
2. Financial analysis
3. Justification analysis based on sensitivity analysis.
2.5.3.1 Strategic evaluation
Unlike the FAP model, stage one of the Samuels et al (1990:168) model is the
strategic evaluation of the investment proposal. Management evaluates the
proposal against the organisation’s strategic plan and if it is not aligned then it
can be definitely ruled out. At this stage it cannot, however, be definitely
accepted. The rule is that the proposal must match the strategic plan of the
organisation and if it does, it passes on to stage two. If not, no further evaluation
is performed.

48
2.5.3.2 Financial evaluation
Samuels et al (1990:168) propose that conventional discounted NPV calculation
be performed. If a positive NPV is shown then the proposal is accepted, if
negative then it passes on to stage 3.
Samuels et al (1990:168) break the conventional NPV calculation into three
stages, namely:
(a) Model construction, where they propose that an appropriate economic
model, usually NPV , of the organisation’s decision problem is constructed,
the model needs to be based on the tangible or quantifiable benefits of the
investment.
(b) Data estimation, where estimates of all quantifiable (tangible) cash flows
are obtained. It is at this point that an applicable discount rate for the NPV
calculation is obtained based on judgement and estimation.
(c) Calculation of NPV, This is performed conventionally and if positive then
the investment is accepted immediately as the cash flows used are based
only on tangible benefits. If negative, it moves on to stage three.
2.5.3.3 Justification analysis based on sensitivity analysis
The analysis is based on sensitivity analysis as per section 2.3.5.1 above.
Samuels et al (1990:168) propose that if the tangible benefits as evaluated in
the second stage have not exceeded tangible costs, then management must
weigh the value of the agreed intangible benefits against the shortfall in NPV.
Two methods of causing the NPV to go positive, using intangible benefits are
suggested by Samuels et al (1990:168), namely:
1. Point system, where all the intangible benefits are listed and a panel of
experts then assign point scores to each benefit. The point scores cannot be
translated directly into cash values and the points must be considered to be
ordinal numbers that cannot be added. On completion of the scoring, if the
points per intangible benefit are enough to turn the NPV positive then the
project is accepted. The question that management is really asking is,” Is the
value of the intangible benefits enough to turn the NPV calculation positive”?

49
2. Lowering the discount rate, the rule used, is if intangible benefits can be
demonstrated then the discount rate is lowered. If the lowering of the
discount rate results in a positive NPV then the investment is accepted.
2.6 CONCLUSION
The literature is comprehensive and detailed with regard to the suggested
method of capital investment analysis. The “black box” model presented by the
literature is as follows: use the Net Present Value method and adjust the
discount factor for risk using either WACC or CAPM. If the answer is greater
than zero then accept the proposal as the project will create value, or if
preferred convert the answer to a percentage by using IRR, which is related to
NPV.
The “black box” is used as an analogy as it suggests something that is not well
understood as to how it works exactly, but if fed with the correct inputs it can be
relied on to deliver a predictable result consistently. The problem with “black
boxes” is highlighted when the inputs that need to be fed into it do not fit the
requirement of the “black box” and the operator, therefore, has either to
manipulate the inputs to suit the “black box” or discard the inputs in favour of
ones that match. The “black box” model is represented by Diagram 7.
Diagram 7: "Black box" model of capital investment appraisal
Source: Author’s own construction
Tangible Benefits
Converted to cash flow
N PV IRR PI
Pay Back Period
W A CC CA PM D iscount
Rate
N PV >0 IRR> set value PI> Set value PP > Set value
NPV <0 IRR< set value PI< Set value PP <Set value
Investm ent
V alue
R isk free rate
D ecision

50
The literature has raised doubt in this model in that it can only quantify the
tangible and the intangible benefits that are inherent in projects are largely
ignored. The consequences are that projects that have the potential to increase
shareholder wealth are eliminated or projects are approved on an ad hoc basis,
ignoring financial figures. This can result in potentially poor projects being
accepted.
Alternative models to the “black box” model seek to value the intangible benefits
and attempt to quantify these intangibles. The approaches do not discard the
NPV calculation but rather modify it or are used in conjunction with the NPV
model. There are two basic approaches, namely, value the tangibles and the
intangibles separately and if the sum of the two is positive then approve. The
second approach is to consider all options and not take an all or nothing
approach as proposed by the “black box” model but rather see the investment
as a series of potential options which can be purchased separately.
Diagram 8 represents the fixed path route that the “Black box” model imposes
on an organization.
Diagram 8: Fixed path investment route
Source: Adapted from Amram and Kulatilaka (1999:101)
Initial Investment
Second Investment
Third Investment
Terminal Value
Time
Value

51
Diagram 9 represents the second approach of seeing options, or the fact that
investments create opportunities to change operating and investment decisions
later depending on the actual outcome.
Diagram 9: Investments as options to future investments
Source: Adapted from Amram and Kulatilaka (1999:101)
Time
Value
52
CHAPTER 3
3 RESEARCH DESIGN AND METHODOLOGY
3.1 INTRODUCTION
The objective of this chapter is to establish an appropriate research strategy for
the main problem of which model best addresses the strategic needs of
Cadbury South Africa when evaluating capital investment proposals. The
research strategy must be applicable to the nature of the problem.
It will be assumed that the nature of the research problem, the objectives of the
research and the methodology of the research focus the research strategy
towards the primary research methodology.
3.2 WHAT IS RESEARCH DESIGN?
3.2.1 The concept of research
The literature has numerous definitions of research, but for the purpose of this
text the definition of Leedy and Ormrod (2005:2), who define research as a
systematic process of collecting, analysing, and interpreting information in order
to increase understanding of the phenomenon being investigated contains the
main aspects, namely, that research:
• Is ordered and planned.
• The information gathered needs analysis and interpretation.
• That understanding of the subject being researched is increased.
Research is not linear, but rather cyclic as represented by Diagram 10. The
research process follows the following developmental steps according to
Rudestam and Newton (2001:5):
1. The most common entry point into this cycle is some form of “empirical
observation” that results in a process of inductive logic, culminating in a
proposal.
2. The researcher clarifies the developed proposition, which exists within a
theoretical concept, by clarifying the relationship between a particular
proposition and the broader context of theory and previous research.

53
3. By use of deductive reasoning, the researcher moves from the larger context
of theory to the generation of a specific research question. The initial loop is
closed when the researcher seeks data that answers the research question.
4. Generalisations are made based on particular data that has been observed
(inductive process), and the generalisations are tied to a conceptual
framework, which leads to the clarification of further research questions and
implications for additional study.
Diagram 10: Cyclic nature of research
Source: Adapted from Rudestam and Newton (2001: 5)
3.2.2 The concept of design
Leedy and Ormrod (2005: 85) consider research design to be a plan or strategy
that provides an overall structure for procedures that a researcher follows in the
collection of data and the analysis of the data. Grix (2004:174) relates design to
strategy and states that the choice of research strategy impacts on the level and
units of analysis used the type of study and the sources of data collected.
The above definitions lead to a simple definition of research design constituting
the formulation of an action plan aimed at directing and incorporating data in an
overall framework in order to solve a research problem.
Conceptual framework ( Theory , literature )
Research Q uestions/ hypotheses
Data Analysis
Data collection
Empirical observations
Proposition
Deductive Inductive

54
Central to research design are four fundamental questions that must be
resolved with respect to the data:
• What are the data required?
• Where are the data situated?
• How will the data be assured?
• How will the data be construed?
3.2.3 Validity and reliability
Two considerations important to any type of measurement are validity and
reliability (Leedy & Ormrod, 2005:27; Rudestam & Newton, 2001: 98). Validity is
related to the soundness or the effectiveness of the measuring instrument and
asks the following questions:
• Is the measuring instrument measuring what it should?
• What is the level of accuracy of the measurement?
Common types of validity according to Leedy and Ormrod (2005:92) and
Rudestam and Newton (2001:98) are:
• Internal validity –the freedom from bias in forming conclusions from the data
• External validity- refers to the ability to generalise the findings of the study.
• Content validity- the accuracy with which an instrument measures the
components or situations under study
• Criterion related validity- a check that employs a second measure of validity
against the accuracy of the first.
• Construct validity- any concept such as honesty that cannot be directly
observed or isolated.
• Face validity- the extent to which an instrument superficially appears to be
measuring a particular characteristic and relies on the subjective judgement
of the researcher.
Reliability, according to Leedy and Ormrod (2005:93), is the degree to which a
measuring instrument generates consistent results when the characteristic
being measured does not change. Rudestam and Newton (2001: 98) state that
reliability is concerned with the replication of the study under similar
circumstances. Reliability asks one question -with what accuracy does the

55
measurement, test instrument, inventory or questionnaire measure what it is
intended to measure?
3.3 METHODOLOGICAL APPROACHES
The specific methods chosen to approach a research problem depend on the
discipline of the researcher and the nature of the specific problem (Rudestam &
Newton, 2001: 23). There are three important contemporary methodological
research approaches, namely the positivist, post –positivist or critical realism
and the interpretive approach. As mentioned above, researchers adopt one of
these approaches and then formulate a strategy that is consistent with the
discipline and nature of the research problem (Grix, 2004: 78).
If these three approaches were set on a continuum, with reference to Diagram
11, as one moved from left to right (from positivist to interpretive positions), the
approach would change from attempting to explain something to seeking to
interpret or understand it (Grix, 2004:78).
Diagram 11: Key methodological approaches
Source: Adapted from Grix (2004:78)
3.3.1 Positivist approach
Positivism is based on a realist, foundational ontology that views the world as
existing independent of our knowledge of it (Grix, 2004:80; Rudestam &
Newton, 2001: 27). In simple terms, positivism is a school of thought that
maintains that all knowledge is derived from direct observation and logical
inferences based on direct observation. This by default leads to the use of
empirical and quantitative research (Rudestam & Newton, 2001:27).

56
3.3.2 Post-positivism or critical realism approach
Critical realism attempts to combine the “how” (which is linked to
interpretativism) and the “why” (which is linked to positivism) by closing the gap
between the two (Grix, 2004:85). A critical realist seeks not only to understand
but also to explain. Critical realism does not have a specific method or
technique attached to it but is compatible with a wide range of research
methods and suggests that the choice of which method to employ should
depend on the nature of the object of study and what is needed to be learned
about it (Grix, 2004:86).
3.3.3 The interpretative approach
The interpretive approach is based on understanding as opposed to explanation
as interpretativists do not believe in relying only on observation for
understanding (Grix, 2004:83). Interpretativists believe that researchers cannot
be divorced from the subject being researched as the researchers themselves
form part of the reality being researched, and “objective” or “value” free analysis
is, therefore, impossible as knowledge is theoretically and ramblingly laden and
a researcher is inevitably the sum total of his or her own personal and
subjective opinions, attitudes and values (Grix, 2004:84).
3.3.4 Models and modelling
Grix (2004: 20) states that a model is a representation of something, in the way
that a model aeroplane is a replica of a real aeroplane. A model is both a
descriptive and an exploratory device. A road map is an example of a
descriptive model.
A model, according to Frankfort-Nachmias and Nachmias (1992: 44), is a
representation of reality that defines certain aspects of the real world as being
crucial to the problem under investigation and expresses the significant
relationships among the aspects that enables the conceptualisation of
empirically testable suggestions regarding the nature of these relationships.
This suggests that a model is a good method of seeing the relationships
between concepts and the boxes and arrows used in modelling themselves
have no meaning other than showing the relationship between variables

57
allowing a reader to develop an abstract picture of the relationship more easily
than if it were done using text (Grix, 2004: 21).
3.4 QUANTITATIVE VERSUS QUALITATIVE RESEARCH
Qualitative research is usually associated with interpretativism and quantitative
research with positivism. As previously indicated by Diagram 11 research
methods can be placed on a continuum stretching from pure quantitative
(Positivism) to pure qualitative (Interpretativism) (Grix, 2004: 78). It is, however,
plausible to indicate whether research projects have a more quantitative or
qualitative nature, which in turn would impact on the process to follow and the
selection of the measuring instrument (Van Biljon 1999:37). A summary of the
main differences between qualitative and quantitative research is given in Table
3.4-1.
Table 3.4-1: Differences between qualitative and quantitative research
Quantitative Qualitative
• Test hypothesis that researcher begins
with. Hypotheses are stated explicitly and
are formulated beforehand.
• Capture and discover meaning once the
researcher becomes immersed in data.
Hypotheses are frequently undeclared or
stated in the form of a research goal.
• Concepts are in the form of distinct
variables. Concepts have an ambiguous
meaning.
• Concepts are in the form of themes,
motifs, generalisations, and taxonomies.
Concepts can be interpreted in a number
of ways.
• Measures are systematically created
before data collection is standardized.
The researcher remains largely aloof.
• Measures are created in an ad hoc
manner and are often specific to the
individual or researcher. The researcher
is involved in the events/phenomena.
• Data are in the form of numbers from
precise measurement.
• Data are in the form of words from
documents, observations and transcripts.
• Theory is largely causal and is deductive. • Theory can be causal or non-causal and
is often inductive.
• Procedures are standard and replication
is assumed.
• Research procedures are particular and
replication is very rare.
• Analysis proceeds by using statistics
tables or charts and discussing how and
what they show related to hypotheses.
• Analysis proceeds by extracting themes
or generalizations from evidence and
organizing data to present a coherent,
consistent picture.
Source: Adapted from Neuman (1994:317), Mouton and Marais (1992:159).

58
An important choice that researchers face is the research method to be used.
Leedy (1993: 145) believes that the answer to this question can be found in the
nature of the data, the problem of the research, the location of the data,
obtaining of the data and the intention with the data. If the data is verbal, the
methodology is qualitative, if it is numerical, the methodology is quantitative
(Van Biljon 1999:37).
3.4.1 Quantitative research
Quantitative research according to Grix (2004:117) is characterised by three
basic phases: finding variables for concepts, operationalising them in the study
and measuring them. In general, quantitative research is used to answer
questions about links among measured variables with the purpose of
explaining, predicting and controlling (Leedy & Ormrod, 2005:94).
A quantitative study usually ends with the confirmation or disconfirmation of the
hypotheses tested.
3.4.2 Qualitative research
Qualitative research involves a phenomenological perspective whereby
researchers aim to understand, report and evaluate the meaning of events for
people in particular situations, that is, how their social world is structured by the
participants in it. The focus of qualitative methodologies is on the way in which
participants (rather than the researcher) interpret their experiences and
construct reality (Leedy & Ormrod, 2005:95; Grix, 2004: 119; Rudestam &
Newton, 2001:91).
3.5 CHOOSING THE MOST APPROPRIATE RESEARCH METHOD
As referred to previously, the research method is related to the nature of the
data, the problem of the research, the location of the data, the collection of the
data and the intention with the data (Leedy, 1993: 145). The characteristics of
quantitative and qualitative approaches are detailed in Table 3.5-1.

59
Table 3.5-1: Distinguishing characteristics of quantitative and qualitative approaches
Question Quantitative Qualitative
What is the purpose of the
research?
• To explain and predict
• To confirm and validate
• To test theory
• To describe and explain
• To explore and interpret
• To build theory
What is the nature of the
research process?
• Focused
• Known variables
• Established guidelines
• Predetermined methods
• Somewhat context-free
• Detached view
• Holistic
• Unknown variables
• Flexible guidelines
• Emergent methods
• Context –bound
• Personal view
What are the data like, and
how are they collected?
• Numeric data
• Representative, large
sample
• Standardised
instruments
• Textual and/or image-
based data
• Informative, small
sample
• Loosely structured or
non-standardized
observations and
interviews
How are data analysed to
determine their meaning?
• Statistical analysis
• Stress on objectivity
• Deductive reasoning
• Search for themes and
categories
• Acknowledgment that
analysis is subjective
and potentially biased
• Inductive reasoning
How are the findings
communicated?
• Numbers
• Statistics, aggregated
data
• Formal voice, scientific
style.
• Words
• Narratives, individual
quotes
• Personal voice, literary
style
Source: Adapted from Leedy and Ormrod (2005:96).

60
This study is an investigation into a decision-making model that best closes the
gap between strategy and the capital investment procedure for Cadbury South
Africa. From the setting of the problem and with reference to Table 3.5-1 and
Table 3.4-1 it can be concluded that the research project is suited to a
quantitative research method as it supports deductive reasoning and analysis.
A deductive design begins with an explicit conceptual framework developed
from existing theory and models. The project requires the formulation of specific
research hypotheses leading to a theory building exercise. A questionnaire is
used to collect data; the hypotheses are accepted or rejected and casual
relationships between variables are established.
3.6 RESEARCH GOALS AND STRATEGIES
3.6.1 Research goals
The research goal provides a broad denotation of what a researcher wishes to
achieve with research. The researcher needs to determine whether the aim of
the research project is to describe, explain or to explore (Neuman 1994:18;
Jackson 1995:18).
3.6.1.1 Descriptive projects
The primary intent of descriptive projects is to depict accurately the
characteristics of a particular individual, group, situation, or organisation, tribe,
subculture, interaction or social objective. The outcome of a descriptive project
is a detailed picture of the subject. According to Neuman (1994:19), the goals of
descriptive projects may be to:
• Clarify a sequence, set of stages or steps.
• Document information that contributes prior beliefs about a subject.
• Provide an accurate profile of a group.
• Give a verbal or numerical picture.
• Describe a process, mechanism or relationship.
• Find information to stimulate new explanations.
• Present basic background information or a context.
• Create a sequence, set of stages or steps.

61
The description of some phenomena may range from a narrative type of
description as in historical analysis to a highly structured statistical analysis
(Van Biljon 1999:54; Neuman 1994: 19; Mouton & Marais 1992: 43).
3.6.1.2 Explanatory projects
Explanatory projects are built on exploratory and descriptive projects and go on
to discover the reason something occurs. The primary aim of explanatory
projects is to test a hypothesis of a cause and effect relationship between
variables. A given phenomenon is explained in terms of specific causes (Van
Biljon, 1999:55; Neuman, 1994:20; Mouton & Marais, 1992: 46). The goals of
explanatory projects may be to:
• Build and elaborate a theory so it becomes more complete.
• Provide evidence to support or refute an explanation.
• Extend a theory or principle into new areas or issues.
• Link different issues or topics under a common general statement.
• Determine the accuracy of a principle or theory.
• Find out which competing explanation is better.
• Advance knowledge about an underlying process.
3.6.1.3 Exploratory projects
The goal pursued in exploratory projects is the exploration of a relatively
unknown topic, situation or phenomenon. The goal of such a project may be to
• Develop new hypotheses about an existing phenomenon.
• Gain new insights into the phenomenon by becoming familiar with facts,
people and concerns involved.
• Undertake a pilot investigation and determine feasibility before a more
structured study of the phenomenon.
• Generate many ideas and develop tentative theories and conjectures.
• Determine priorities and develop techniques for future research.

62
Exploratory projects usually lead to insight and comprehension rather than a
collection of accurate and replicable data. The methods frequently used in
exploratory projects include in-depth interviews, the analysis of case studies
and the use of informants (Van Biljon, 1999:55; Neuman, 1994:20; Mouton &
Marais, 1992: 46).
3.6.1.4 The research goals of this project
The primary aim of this research project is to portray accurately the
characteristics of a particular group, situation, or object (Mouton & Marais,
1992:43) -in this case the decision-makers of Cadbury who are involved with
the capital budgeting process. This research project as a result follows the
descriptive path. A further goal is the matching of a capital evaluation technique
that enhances the strategy to the current capital expenditure procedure.
3.6.2 Research strategy
Mouton and Marais (1992:49) believe it is possible to distinguish between types
of research strategies, namely:
• Contextual research strategy that deals with projects such as historical
sciences, languages, arts, jurisprudence and theology
• General research strategy that deals with experimental studies, comparative
research and various types of surveys.
For the purpose of this research project, the focus was on a general research
strategy utilising a survey in a form of a questionnaire.
3.6.3 Survey research
Leedy and Ormrod (2005: 183) defines survey research as the acquiring of
information about one or more groups of people, regarding their characteristics,
opinions, attitudes, or previous experience, by asking them questions and
tabulating their answers. Survey research typically employs a face-to-face
interview, a telephone interview or a written questionnaire (Leedy & Ormrod,
2005:184). As previously indicated a questionnaire survey will be utilised for this
project.

63
3.6.3.1 Questionnaire design
Hussey and Hussey (1997:61) define questionnaires as lists of structured
questions with a view to eliciting reliable responses from a chosen sample with
the aim of finding out what a selected group of participants do, think or feel.
According to Leedy and Ormrod (2005:185) questionnaires have two main
advantages, firstly they are relatively cheap as they reduce the researcher’s
travel costs and telephone expenses. Secondly, questionnaires offer
respondent anonymity assuring, therefore, greater confidence in the accuracy of
the results.
Leedy and Ormrod (2005:185), however, point to two disadvantages of
questionnaires, the main one being the low return rate owing to the general
apathy of respondents to take the time to answer a questionnaire. The second
disadvantage is that the respondents’ answers might be flawed because of a
misinterpretation of the questions.
To minimise the extent of the disadvantages Leedy and Ormrod (2005: 190)
propose twelve guidelines for the development of a questionnaire.
1. Keep it short - the questionnaire should be brief as to extract only that
information pertaining to the particular research project.
2. Use simple clear unambiguous language. The questions should be designed
in such a way that they communicate exactly what the researcher wants to
know.
3. Check for unwarranted assumptions in the questions. Assumptions must be
carefully considered when designing a question.
4. Questions should be worded in such a manner that clues are not disclosed
about preferred or desirable responses.
5. Check for consistency. When a question being asked is such that some
respondents may give answers that are socially acceptable rather than true,
a “countercheck” question should be incorporated further down the list.
6. Determine in advance how responses will be coded.
7. Keep the respondent’s task simple - the questionnaire must be simple to
read and answer.

64
8. Provide clear instructions. The researcher must communicate exactly how
he/she wants people to respond.
9. Give a rationale for any items whose purpose may be unclear. The purpose
of each question should be made clear to the respondent.
10. The questionnaire should look attractive and professional.
11. Conduct a pilot test - the questionnaire should be given to friends or
colleagues to see whether they have difficulty in understanding any items.
12. Scrutinise the almost final product carefully to make sure that it addresses
the needs of the researcher, item by item. A questionnaire should be quality
tested several times for precision of expression, objectivity, relevance and
probability of favourable reception and return. It is important that each
question addresses the research problem as well as the sub-problems.
The questionnaire for this study was developed from the literature study in
Chapter 2 to facilitate the collection of information. The questions identified from
the literature and by the hypothesis were first linked to the main research
question and the hypothesis and are listed in ANNEXURE D. Multiple choice,
yes/no and open-ended questions were selected and assigned to each question
and countercheck questions were included.
The multiple-choice questions had two formats- selection of options presented
by the researcher and which could have more than one answer and a rating
scale based on the Likert scale, ranging from “strongly disagree”, “disagree”,
“agree” and “strongly agree” or when checking understanding from “not at all”,
“vaguely”, “working knowledge” and “thoroughly” (Leedy & Ormrod, 2005: 185).
The scale was particularly chosen to exclude a neutral response. A limitation of
this approach according to Leedy and Ormrod (2005:187) is the potential loss of
valuable information and as a means to overcome this, certain questions
required an open-ended response as well.
Before the questionnaire was finalised (ANNEXURE E) the questions presented
in ANNEXURE D were checked by a member of the Department of
Mathematical Sciences at the Nelson Mandela Metropole University against
suitability for statistical analysis.

65
3.6.4 The population
As mentioned in Chapter 1, the population selected are directors, senior
managers and middle managers involved with the capital expenditure decision-
making process in the Cadbury organisation with particular focus on Cadbury
South Africa. The population contains definite strata that appear in different
proportions within the population, hence proportional random stratified sampling
was utilised (Leedy & Ormrod, 2005: 205). The exception to this was the
Cadbury South Africa directors, who, because their busy schedules frequently
prevent meaningful interaction, were all, included in an effort to increase the
response rate.
The sample was determined by using the Cadbury organisational list and
managers who have access to the HOLT evaluator program. All managers not
directly involved with the capital expenditure process because of their lack of
access to the HOLT evaluator program were eliminated and 50 per cent of the
remainder were taken as a sample with the exception of the directors who were
included at 100 per cent. The population sample is presented in Table 3.6-1
Table 3.6-1: Population Sample
Level Location Proposed
Number
% Actual
number
%
Directors Local 7 16.2% 2 4.6%
Senior Local 6 14% 4 9.3%
Senior Group 10 23.3% 10 23.2%
Middle Local 15 34.8% 13 30.3%
Middle Group 5 12.6% 0 0%
Total 43 100% 29 67.4 %

66
3.7 GENERAL PROCEDURES
The methodology adopted in this research project was discussed earlier in this
chapter. The empirical data collection was done by means of questionnaires.
The secondary data used in this research project were obtained from various
local and international sources in various forms, such as articles, books, the
most predominant being international books originating in America and Europe.
The primary data used in this research project was acquired from observation
by way of questionnaires (see ANNEXURE E).
The questionnaire design has been discussed in section 3.6.3.1 above and a
pilot survey to test the questionnaire was conducted with three respondents,
one senior and two middle managers, to test the user-friendliness of the
questionnaire.
The actual survey in the form of an e-mail survey questionnaire (see
ANNEXURE E) was forwarded under a covering letter dated 27 October 2005
(ANNEXURE F) to respondents within the Cadbury South Africa area, excluding
directors. For directors and respondents from group an additional introduction
letter from the promoter (ANNEXURE G) was included.
The return date as requested in the covering letter (ANNEXURE F) was 10
November 2005. A total of 29 questionnaires were accepted for the study
representing a 67.4 per cent response rate, which for a questionnaire survey
that usually has a low response rate according to Leedy and Ormrod (2005:185)
can be taken as acceptable.
The worst respondents, the group middle managers at 0 per cent, (Table 3.6-1)
elicited follow-up phone calls and further e-mails with an extension to 14
November 2005 after which no further responses were received.

67
During the follow-up on outstanding questionnaires the following reasons and
excuses were given as to why questionnaires had not been completed and
returned:
• The email had been deleted by mistake.
• The respondent was too busy to reply.
• The respondent was away on business and had many other emails to reply
to.
• The respondent stated that he/she was too busy to open the email.
The questionnaires that originated from the actual survey were recorded on
computer disk and the data was processed and presented in tabular form by a
member of the Department of Mathematical Sciences at the Nelson Mandela
Metropolitan University. These results are presented in Chapter 5.
3.8 CONCLUSION
A formal systematic approach to research design is crucial to ensure that a
research project conforms to the principles of validity and reliability. The
research design decisions guide the researcher in effectively addressing the
research problem. A quantitative, descriptive approach strategy was the most
appropriate approach for this research project. Questionnaires were the main
method of data collection.

68
CHAPTER 4
4 EMPIRICAL RESULTS
4.1 INTRODUCTION
Empirical results are a core part of this research project, and the response to
the questionnaire will make a major contribution to the identification of those
topics or issues that form part of the hypotheses of the project.
4.2 GENERAL OBSERVATIONS ON THE DATA
The total response from the sample of 43 amounted to 29 questionnaires
(67.4%), of which all were usable. The largest group of respondents were from
Cadbury South Africa (66%) and the rest (34%) were from Cadbury Group
based in Birmingham in the United Kingdom. The UK respondents, however,
have a group function that requires them to assist with projects across the
Cadbury organisation. The data for this section is based on the responses to
questions 1 to 7 of the questionnaire (ANNEXURE E).
When the data were analysed, it was found that the questionnaire had been
completed almost equally by senior managers (48%) and middle managers
(45%). The smallest group of respondents were directors at 7 per cent of the
total and 28 per cent of the available population. The majority of the senior
management respondents were from Cadbury group (34%) and only 14 per
cent of local senior management completed the questionnaire. Only local
middle managers (45%) responded to the questionnaire. This data is presented
in Figure 4-1.
The respondents generally have a high level of experience with the Cadbury
Schweppes group, as 41 per cent have been with the organisation for more
than 13 years. Of the remaining 59 per cent, only 41 per cent have less than 5
years experience in the organisation. The average length of service for the
population is 13 years with a minimum service length of 2 years and a
maximum of 34 years. The respondents are generally highly skilled people, 72
per cent have a tertiary qualification and 21 per cent have a postgraduate
qualification (Honours or Masters).

69
Figure 4-1: Management level of respondents
The average age of the group is 43. The youngest respondent is 31 and the
oldest is 56 years old. The majority of respondents were male as there were
only three female respondents.
On average, each respondent examines 23 RAM forms a year with the
maximum being 200 (the capital expenditure compiler) and the minimum 1. If
the median is taken due to the skewing of the capex compiler’s excessively high
number of 200 then the middle managers’ median is 10.
Table 4.2-1 further defines the data.
Table 4.2-1: General observations of demographics of population
The capex compiler who reviewed 200 RAMs was removed to determine the average for
middle managers.
ItemPercentage
of total n=29
Local Group Average Age
Average service length
Average No. RAM's evaluated per annum
Director 7% 7% 0% 42 15 30Senior 48% 34% 14% 46 14 13Middle 45% 45% 0% 41 11 8
SPLIT BETWEEN LOCAL AND GROUP
7%0%
14%
34%
45%
0%
No. local Directors
No. Overseas Directors
No. local Senior
No. overseas Senior
No. local Middle
No overseas. Middle

70
4.3 STRATEGY INCORPORATION
As Table 4.3-1below illustrates, the majority of respondents claim to be aware
of the organisation’s strategy with all senior management and directors being
aware of the organisation’s strategy and 69 per cent of middle managers
claiming awareness. This implies that these decision-makers have a thorough
understanding of what projects fit into the organisation’s strategy when they
review a RAM.
From the general observations, the majority of respondents appear to be
steeped in the Cadbury culture and way of doing things as indicated by the
average length of service of 13 years. It is, therefore, no surprise that 61 per
cent of the respondents were of the opinion that the current capex procedure
adequately addresses strategy. The distribution amongst the management
levels indicated by Table 4.3-1.
When the respondents were asked if the current program (HOLT evaluator)
used to generate the answers for evaluation was easy to use only 33 per cent of
them agreed with the statement.
Table 4.3-1: Incorporation of strategy and understanding of strategy
The respondents were asked what their opinion was of a time period of strategy
and what the average time was that a project took from conception to approval
only. Table 4.3-2 below presents these findings.
Item Total Agree Directors Senior Middle
Knowledge of current strategy 86% 100% 100% 69%Incorporation of current strategy 61% 50% 64% 58%Ease of use of existing system. 33% 0% 38% 33%
Split among management levels that agree.

71
Table 4.3-2: Average periods of strategy and approval
4.4 IMPORTANCE OF FINANCIAL EVALUATION
The respondents were asked if projects could be approved based on strategy
only and 64 per cent replied ‘yes’. The split between management levels is
presented in Figure 4-2.
Figure 4-2: Management split of whether projects can be approved on strategy
The two directors appear to be equally divided as to whether projects can be
approved on strategy or not. It is interesting to note, however, that the younger
and better educated of the two is the ‘yes' respondent. The middle managers
are almost equally divided in their opinion.
The senior managers appear to have a larger discrepancy and further analysis
of the local and overseas split reflected by Figure 4-3 reveals that more
overseas senior managers are of the opinion that projects can be approved on
ItemTotal
averageDirectors Senior Middle
Time period of strategy 24 Months 12 Months 25 Months 30 MonthsTime taken from concept to approval 9 Months 8 Months 10 Months 9 Months
Split among management levels
0
2
4
6
8
10
12
Director Senior Middle
Management Level
Num
ber
of R
espo
nden
ts
Yes
No

72
strategy only, while local senior managers are equally divided. This could be
due to the fact that the overseas senior managers perform a group function and
are not attached to any particular manufacturing facility and hence might not
always have to live with the end results of their decisions.
Figure 4-3: Split among senior managers of a project being approved on strategy only.
The result above could also be influenced by the fact that lobbying of projects is
very high as demonstrated by the 93 per cent ‘yes’ answer to the question on
whether lobbying of projects occurred (Figure 4-4). This could indicate that by
the time a project is presented for approval the project leader has already won
support for a particular project and the decision is taken less on financial
evaluation and more on verbal justification, which could lead to the
belief/perception that projects are approved on strategy.
0
2
4
6
8
10
12
Total Yes No No comment
Answer
No
Res
pond
ents
Senior Overseas
Senior Local

73
Figure 4-4: Does lobbying of projects occur?
With regard to strategy approval, in chapter two, section 2.4, it was noted that
not all benefits of a project could be linked to tangible cash benefits and that this
prevented strategy from being approved as strategic driven projects often do
not have tangible benefits in terms of cash inflows. When the respondents were
asked if a project was only acceptable if it showed a cash inflow, the majority
(82 %) of them disagreed with the statement, indicating that the respondents
were of the opinion that projects are acceptable if they had no cash inflows. The
analysis of how the different management levels responded to this question is
represented by Figure 4-5.
Figure 4-5: How different management levels agree or disagree about cash inflows.
100%
75%
89%
77%
0%
25%
11%
23%
0%
20%
40%
60%
80%
100%
120%
Local Director Local Senior Overseas Senior Local Middle
Management Level
Per
cent
age
of R
espo
nden
ts
Disagree
Agree
93%
7%
0%
10%
20%
30%
40%
50%
60%
70%
80%
90%
100%
Yes No
Yes/No
Perc
enta
ge o
f res
pond
ents

74
4.5 TECHNIQUES USED IN THE CAPITAL BUDGETING PROCESS
When the respondents were asked to indicate which technique they used first in
evaluating a proposal, 79 per cent indicated Payback and 10 per cent indicated
that IRR are considered first. The remaining respondents regarded NPV (7%)
as what they examine first with only 3 per cent examining PI. The understanding
of the techniques indicates that all of the respondents understood the Payback
calculation in some form or another ranging from thoroughly to vaguely.
According to the results, profitability index (PI) after cash Payback was the next
most thoroughly understood technique although it had the lowest working
knowledge understanding. This difference between importance and
understanding could be due to an error in the questionnaire, in that PI was not
defined and the respondents could have misinterpreted it to mean profit
improvement (PI). Table 4.5-1 below illustrates these preferences regarding the
capital budgeting method used and the understanding that the respondents
have regarding the method.
Table 4.5-1: Preferences regarding the capital budgeting technique used and
understanding of technique
4.6 ACCURACY OF CASH INFLOWS
With regard to the expected benefits that a project can generate the
respondents were asked if the cash inflows were accurate and if these cash
flows were ever manipulated to meet financial measures. For the first question,
46 per cent of the respondents were of the opinion that the cash flows are
accurate while 54 per cent were not. This split was not as large as what was
expected. For the second question 72 per cent of the respondents felt that cash
flows are manipulated while 32 per cent were not. This split was what was
expected.
THOROUGHLY WORKING KNOWLEDGE VAGUELY NOT AT ALL
Cash Payback (PP) 79% 34% 62% 3% 0%Internal Rate of return (IRR) 10% 17% 62% 14% 7%Net Present Value (NPV) 7% 16% 61% 16% 7%Profitability index (PI) 3% 31% 41% 24% 3%
100%
UNDERSTANDINGITEM IMPORTANCE

75
There is an illogical discrepancy in the response to these two questions in that,
if the cash flows are manipulated then, they cannot also be accurate. The
answers were further split between different management levels, as can be
seen in Figure 4-6 and Figure 4-7 respectively. If these Figures are considered,
then the most evident difference between the two is that it is senior
management, and in particular the overseas senior management, who differ the
most between the two questions. This could be attributed to:
• The fact that this particular section of the population is not attached to any
specific manufacturing facility, or
• That to admit to inaccurate cash benefits might have some negative impact,
or
• Could be an error in the questionnaire process. (If the respondents
answered ‘no’ to the first question or ‘yes’ to the second, they were required
to expand their answer and the respondents might have been pressed for
time and hence chosen the easiest answer with the least work.)
Figure 4-6: Management split on whether cash flows are accurate.
1
2 2
7
1
2
7
4
0
1
2
3
4
5
6
7
8
Local Directors Local Senior Overseas Senior Local Middle
Management Levels
No. R
espo
nden
ts
Yes
No

76
Figure 4-7: Management split on whether cash flows are manipulated to meet financial
measures.
As mentioned above the respondents were asked to comment on either a ‘no’
or a ‘yes’ answer. For the question regarding the accuracy of cash flows for a
project, the most common reason given is that the forecasts are not accurate
and that they are only guidelines. The results are presented below.
• The cash flows are traditionally ambitious.
• Forecast accuracy is variable.
• Cash flow forecasting not a great strength of the organisation.
• They are only guidelines.
• Project selling volumes are rarely accurate.
• Sometimes the cash flows are manipulated to get an acceptable Payback.
• Accuracy is dependent on the competency of the individual preparing the
input information.
• Sales volumes are manipulated to meet pre-set expectations.
• There are no economic, market analysis, prior review or historical trending
as part of evaluation.
• There is a tendency to slant figures at the desired outcome.
• Forecasting is inaccurate.
• They are only guidelines.
• Depending on the variables, predicted cash flows are based on assumptions
and could vary.
1
3
7 7
1 1
2
3
0
1
2
3
4
5
6
7
8
Local Directors Local Senior Overseas Senior Local Middle
Management levels
No. R
espo
nden
ts
Yes
No

77
For the question regarding if cash flows are manipulated, the ‘yes’ answer
required clarification. The most common answer is ‘to meet Payback period’
and ‘by manipulating sales volumes’. The results are presented below.
• Assumption tolerances are being played with.
• To get the project approved.
• To get an acceptable return.
• To achieve an acceptable Payback.
• Number of years over which an asset is depreciated.
• Mainly by manipulating volumes.
• To get an acceptable Payback.
• Dependent on the competency of the individual preparing the input
information.
• Sales volumes are manipulated to meet pre-set expectations.
• Manipulate measurable costs to guarantee approval.
• To affect the Payback period and get a particular percentage gain in a given
year.
• Capital altered, subjective benefits are included.
• Sale volumes are manipulated.
• Depending on the variables, predicted cash flows are based on assumptions
and could vary.

78
4.7 PRESENTATION OF REMAINDER OF QUESTIONNAIRE’S RESULTS
This section covers the remainder of the questionnaire’s answers not included
in the previous sections.
Question 3: How soon should a project pay for itself?
Figure 4-8: Response to question 3
Question 9: Project Proposals originate from?
Figure 4-9: Response to question 9
20
9
00
5
10
15
20
25
1-3 Years 3-5 Years 5-10 Years
Nunber of years
No
of R
espo
nden
ts
5
12
2425
12
9
0
5
10
15
20
25
30
Shop Floor Junior Managers MiddleManagers
SeniorManagers
Directors Consultants
originators of proposals
No.
Res
pond
ents

79
Question 10: Only financial indicators should be used for project evaluation.
Figure 4-10: Response to question 10
Question 11: Can all benefits from a project be related to financial benefits?
Figure 4-11: Response to question 11
Question 14: To get a project approved the following must be altered.
Figure 4-12: Response to question 14
6
22
10
0
5
10
15
20
25
No. o
f Res
pond
ents
Strongly disagree
Disagree
Agree
Strongly agree
7
21
0
5
10
15
20
25
No. R
espo
nden
ts
Yes
No
21
6
10
3
0
5
10
15
20
25
Project spend Risk Factor Cash Inflows Another
No o
f res
pond
ents

80
The “other” referred to in Figure 4-12 were:
1. Write-Offs and restructuring
2. Quality
3. Political importance of a negative outcome.
Question 15: Is capital investment making an exact science?
Figure 4-13: Response to question 15
Question 16: Have you heard of the real option with regard to capital
investment?
Figure 4-14: Response to question 16.
1
28
0
5
10
15
20
25
30
Yes No
No
of R
espo
nden
ts
5
24
0
5
10
15
20
25
30
Yes No
No.
of
Res
pond
ents

81
Question 20: To replace equipment with the same technology is better than
introducing new technology.
Figure 4-15: Response to question 20
Question 21: Intangible benefits are not quantifiable.
Figure 4-16: Response to question 21
Question 25: Project cash inflows are precisely calculated and reliable.
Figure 4-17: Response to question 25
11
17
01
0
2
4
6
8
10
12
14
16
18
No. O
f Res
pond
ents
Strongly disagree
Disagree
Agree
Strongly agree
0
16
11
2
0
2
4
6
8
10
12
14
16
18
Strongly disagree Disagree Agree Strongly agree
No. O
f Res
pond
ents
3
19
6
00
2
4
6
8
10
12
14
16
18
20
No. O
f res
pond
ents
Strongly disagree
Disagree
Agree
Strongly agree

82
Question 26: More time should be spent on getting accurate investment costs
than on establishing cash inflows.
Figure 4-18: Response to question 26
Question 27: Should different project types have different discount factors?
Figure 4-19: Response to question 27
Question 30: Have you ever manipulated cash flows to get a project to fit the
financial indicators?
Figure 4-20: Response to question 30.
2
11
13
2
0
2
4
6
8
10
12
14
No o
f Res
pond
ents
Strongly disagree
Disagree
Agree
Strongly agree
21
6
0
5
10
15
20
25
Yes No
No. R
espo
nden
ts
12
16
0
2
4
6
8
10
12
14
16
18
Yes No
No. O
f Res
pond
ents

83
Question 31: Have you heard of the financial appraisal model with regard to
capital investment?
Figure 4-21: Response to question 31
Question 32: Are post implementation evaluations done on completed projects
with regard to expected financial benefits?
Figure 4-22: Response to question 32
Question 33: How soon after the project is the post evaluation done?
Figure 4-23: Response to question 33
6
23
0
5
10
15
20
25
Yes No
No. o
f Res
pond
ents
18
11
0
2
4
6
8
10
12
14
16
18
20
Yes No
No. o
f Res
pond
ents
23
2
01
0
5
10
15
20
25
No. o
f Res
pone
nts
1 year
2 year
5 year
10 year

84
Question 34 asked what corrective actions are taken if predicted financial
benefits for a project are not realized. In the responses below a √ is used to
indicate the number of similar responses:
• Nothing √ √ √ √ √ √ √ √ √ √
• Fortunately we still have to find out
• I don’t know √ √ √ √ √ √ √ √ √
• No tangible accountability, except loss of credibility with final decision-
makers, which increases time period of approval.
• Findings are converted into learning for future projects
• Not much. Generally the marketing people who estimated the benefits will
have moved on.
• Shooting of the innocent! Loss of credibility and sometimes some corrective
action.
• Not sure. Find some innocent people and fire them?
4.8 TESTING OF THE HYPOTHESES
The hypotheses testing has been approached on the basis of the following
principles:
1. The written survey respondents are likely to constitute the more committed
Cadbury managers because they answered the questionnaire.
2. No control can be exercised with regard to the percentage committed versus
percentage uncommitted from a sample population.
3. It should be appreciated that the findings are likely to be representative of
the activities of the more committed managers and one can only
contemplate the activities of the uncommitted managers.
4. A positive result is one that agrees with the hypotheses.

85
To represent each hypothesis in a radar diagram, where the positive results are
superimposed over the negative results, the collected data from the
questionnaires have been computed using the following process:
1. Compute data for each questionnaire to represent positions on each radar
diagram depending on the number of questions.
2. The questions are based on a Likert- type 4-point scale without a neutral
response, where the range is from “strongly disagree” to “strongly agree” or
other such combinations representing 1 to 4 and yes / no questions.
3. To establish the negative radar diagram the values from the questionnaires
are then computed as follows:
a. For Likert type questions: (1+2) x 100=%
b. No = Negative
4. To establish the positive radar diagram the values from the questionnaires
are then computed as follows:
a. For Likert type questions: (3+4) x 100=%
b. Yes = Positive
5. Draw both diagrams, superimpose the positive over the negative and
interpret the results.
Finally, when interpreting the written surveys with the aid of the radar charts the
following indicators are used:
− Minority: 30% and less
− Half: 50%
− Majority: 60% but less than 80%
− Most: 80% and more
− All: 100%

86
4.8.1 Hypothesis 1
Capital investment decisions are only accepted on financial criteria.
The salient findings of the survey can be summarised as follows:
Figure 4-24: Summary of responses to questions for hypothesis 1
Written survey
From the written survey, most of the respondents felt that:
• Projects should not only be approved on financial benefits.
• Capital investment-making decisions were not an exact science.
Question Positive % Negative %4 (1) 64 3910 (2) 97 311 (3) 75 2515 (4) 97 318 (5) 18 82
0
20
40
60
80
1001
2
34
5
Positive %
Negative %

87
Also from the written survey the majority of the managers were of the opinion
that:
• The current capital investment procedure adequately addresses strategy.
• Not all benefits can be converted to financial benefits.
Test
The findings of the written survey as depicted in Figure 4-24 support hypothesis
1: “Capital investment decisions are only accepted on financial criteria.”
4.8.2 Hypothesis 2
Although three financial measures are calculated and presented, Payback
is the only measure used as acceptance by most decision-makers.
The salient findings of the survey can be summarised as follows:
Figure 4-25: Summary of responses to questions for hypothesis 2
0
20
40
60
80
1003 (1)
5 (2)
12 (3)
16 (4)19 (5)
24 (6)
29 (7)
Positive %
Negative %
Question Positive % Negative %3 (1) 69 315 (2) 79 21
12 (3) 39.5 10.516 (4) 83 1719 (5) 7 9324 (6) 36 13.529 (7) 48 3
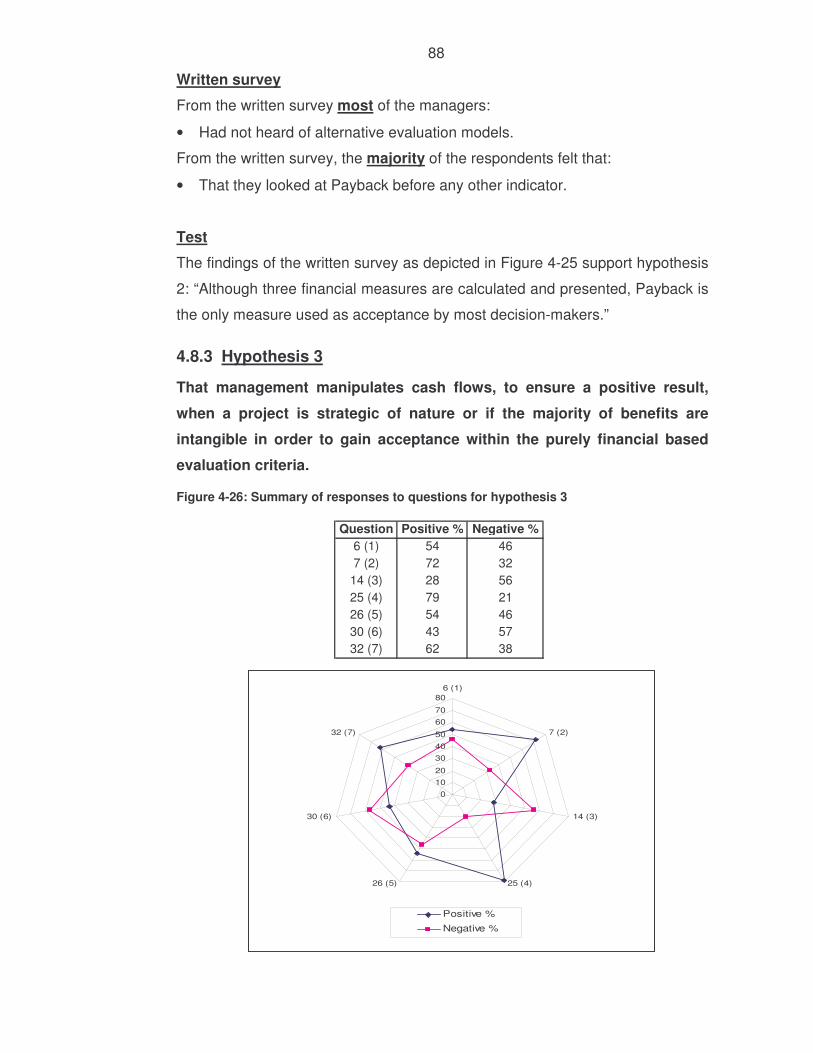
88
Written survey
From the written survey most of the managers:
• Had not heard of alternative evaluation models.
From the written survey, the majority of the respondents felt that:
• That they looked at Payback before any other indicator.
Test
The findings of the written survey as depicted in Figure 4-25 support hypothesis
2: “Although three financial measures are calculated and presented, Payback is
the only measure used as acceptance by most decision-makers.”
4.8.3 Hypothesis 3
That management manipulates cash flows, to ensure a positive result,
when a project is strategic of nature or if the majority of benefits are
intangible in order to gain acceptance within the purely financial based
evaluation criteria.
Figure 4-26: Summary of responses to questions for hypothesis 3
01020
304050
6070
806 (1)
7 (2)
14 (3)
25 (4)26 (5)
30 (6)
32 (7)
Positive %
Negative %
Question Positive % Negative %6 (1) 54 467 (2) 72 32
14 (3) 28 5625 (4) 79 2126 (5) 54 4630 (6) 43 5732 (7) 62 38

89
Written survey
From the written survey, half of the respondents felt that:
• The cash flows for a project are inaccurate.
• The establishment of cash inflows was important.
From the written survey, the majority of the respondents felt that:
• Cash inflows are manipulated
• Cash inflows are not precisely calculated or reliable.
• Projects are evaluated at the end of the project, but no corrective action is
taken
Test
The findings of the written survey as depicted in Figure 4-26 and from the
international literature support hypothesis 3: “That management manipulates
cash flows, to ensure a positive result, when a project is strategic of nature or if
the majority of benefits are intangible in order to gain acceptance within the
purely financial based evaluation criteria.”
4.9 CONCLUSION
The results of the empirical study were presented in tabular and graphical form
and the hypotheses were tested.
The results of the data can be summarised as follows
• Strategy does not appear to fit easily into the current capital budgeting
process.
• Cadbury management (senior, middle and director) are likely to be steeped
in Cadbury culture owing to long periods of service.
• Cadbury management seems to prefer using Payback when evaluating
projects.
• Payback times are relatively short - 3 years or less.
• Project cash inflows are unreliable and no action is taken if proved so.
• The HOLT Evaluator is not easy to use.
• The three hypotheses all tested positive.
Chapter 5 will present the conclusions and recommendations of the research
study.

90
CHAPTER 5
5 FINAL SUMMARY, RECOMMENDATIONS AND CONCLUSION
5.1 SUMMARY OF THE MOST IMPORTANT FINDINGS FROM THE
EMPIRICAL STUDIES.
The summary of the salient findings of this study is based on the facts
established from the theoretical and empirical analyses. Firstly, it was
established that investment decisions are amongst the most important that
organisations make and that the investment analysis process has been refined
to the point of being a “black box” which functions well most of the times, but
when faced with certain decisions, in particular strategic decisions, the “black
box” has limitations.
Firstly, from the theory, these limitations have been identified as:
• Inability to quantify the intangible.
• Use of discounted cash flow analysis (DCF) only promotes incremental type
projects because of the need to analyse the analysable.
• If the future is highly uncertain then the use of discount rates and projected
cash flows could be considered as highly unreliable and hence of little value.
• When a decision does not fit the “black box”, it enters the realm of executive
decision-making, which is inconsistent and not well understood, with a high
potential of delivery of poor decisions.
• Although DCF is academically preferred, the use of Payback is still
extensive.
Secondly, alternative models to the black box do exist and follow two
approaches namely:
• A management team approach, where tangible and intangible benefits are
evaluated and a decision is based on this more holistic information. This
approach however remains an all-or- nothing approach. Examples of this
approach are the financial appraisal profile model and the Samuel, Wilkes
and Brayshaw three-stage model.

91
• The second approach treats investment decisions as financial call options
and melds analytical rigour with strategic intuition, moving away from the all-
or- nothing approach to the ability to exercise options when best needed. An
example of this approach is the real option evaluation model. Both of these
approaches retain the use of DCF calculations.
Thirdly, Cadbury South Africa in utilising a model for investment decision-
making based on the “black box” model, suffers from the identified limitations of
the “black box” model and risk is poorly addressed.
The limitations of the Cadbury “black box” model specifically are:
• The manipulation of inputs into the model to incorporate strategic projects.
• Almost exclusive use of Payback by decision-makers.
• Strategic decisions are made by the poor and highly subjective executive
decision-making process.
• Inability to accurately capture intangible benefits.
5.1.1 Strategy
Strategic factors of an investment are invariably those factors that cannot be
valued in financial terms and are usually left out of the financial appraisal
calculation. These strategic factors, however, influence the long-term
performance of an organisation and include, manufacturing flexibility, creating a
competitive advantage, the ability to respond positively to customer needs and
environmental issues. The main problem of this research was around the
incorporation of these strategic factors into the capital investment procedure.
The secondary data, in particular Johnson and Scholes (2002: 10), define
strategy as: “ The direction and scope of an organisation over the long term,
which achieves advantage for the organisation through its configuration of
resources within a changing environment and to fulfil stakeholder expectation.”
It is interesting to note that the term long term that is referred to by Johnson
and Scholes (2002: 10) seems to be two years within the Cadbury organisation.
This appears at odds with the time of 9 months that it takes from conception to
approval, which is 38 per cent of the total time of a strategy as perceived by the
decision-makers.

92
If it were assumed that most manufacturers of confectionery machinery require
6 months to manufacture and, if sea- freighted, a further month is allowed for
delivery, then before the machine is installed and commissioned, 67% of the
available strategic time would have already elapsed. The assumed project is
compared to strategy time and approval time in Figure 5-1. The time of two
years may be considered strategic due to the influence of another factor. This
factor could be due to the almost exclusive use of Payback (79%) by Cadbury
decision-makers (directors, senior and middle managers) and that the Payback
acceptance criterion is set at two to three years, making two years a figure that
will guarantee project acceptance.
Figure 5-1: Comparison of strategy to assumed project
Source: Author’s own construction
5.1.2 Payback
Payback, although slated by academia as being unsophisticated, naïve, or
inferior, does provide information regarding the liquidity of a project and how
long it will take to recover a project’s initial cost. It also gives an indication of
time risk (The uncertainty of estimating future cash flows increases with time,
the longer a project’s life the greater the difficulty in estimating cash flows in the
later years. This uncertainty in itself creates a risk that the ultimate benefits
expected from a project may not materialise in that the longer the Payback
period, the greater the time risk involved. Payback is not necessarily wrong -
just one-dimensional in the information it provides.
24 Months
9 Months
19 Months
Months 5 Months 10 Months 15 Months 20 Months 25 Months 30 Months
Time period of strategy
Time taken from conceptto approval
Time period of assumedproject up untilinstallation only
Item
Duration in months

93
In South Africa another study, Hall (1998:13) also found that Payback (33.8%)
was the most popular tool followed by IRR (32.3%). As previously referred to in
chapter 2, table 2.3.6.2-2, Ryan (2002:12) found in her comparative results of
prior studies that Pike (1996), in his review of large UK companies, found the
most popular capital budgeting tool to be Payback.
A USA study by Scapens, Sale & Tikkas (Lumby, 1991: 492) found that
discounted cash flow (DCF) techniques generally were more generally used in
the USA than in the UK. They found that in their sample 84 per cent of USA
companies used DCF techniques, as opposed to only 54 per cent in the UK.
This indicates that there is a difference between UK and USA organisations in
the use of evaluation techniques. The UK organisations favour Payback and the
USA organisations favour DCF.
The results above have been combined with the Cadbury results in Figure 5-2.
It appears that Cadbury decision-makers place greater importance on Payback
than the other studies indicate. The difference between European organisations
and American organisations in this use of discounted cash flow techniques and
Payback is captured by the Cadbury/ Hall study and the Ryan study.
Figure 5-2: Comparison of Capital budgeting technique use from different studies.
Source: Author’s own construction
0%
10%
20%
30%
40%
50%
60%
70%
80%
90%
Cash Payback(PP)
Internal Rate ofreturn (IRR)
Net Present Value(NPV)
Profitability index(PI)
Capital Budgeting Techniques
Per
cent
age Cadbury Study
Hall Study
Ryan Study

94
Cadbury, as a UK company, where 79 per cent of its managers prefer to use
Payback appears to be within expectation. This is, however, higher than what
previous studies have found where the difference between IRR and Payback
was close.
Graham and Harvey (2001: 193) found in their research of capital budgeting
practice that Payback was more likely to be used by older managers and
managers with long tenure as well as managers without Masters in Business
administration (MBA) qualifications. This prior research supports the author’s
findings that the Cadbury managers with the greatest preference for Payback
are those with an average service of 13 years and who probably do not have
MBA’s (only three respondents out of the 29 possessed an MBA). Payback
according to academics is used by organisations that are capital constrained.
The findings of Graham and Harvey (2001:193) and this study suggest,
however, that lack of sophistication is the real reason.
5.1.3 Current Cadbury schemes for incorporating strategy
In order to facilitate strategic factors within the confines of the “black box model”
and the purely financial approval process, Cadbury managers appear to be
manipulating the inputs into the model.
This manipulation is taking the form of adjusting derived benefits and altering
the spending of the project. The practice, of altering spending could create a
possibility of delivering projects of poor quality.
It would appear though, that the decision-makers are aware of this manipulation
and are doubtful of cash inflows. Because no corrective action is taken, this
manipulation is excused and used as a mechanism to get strategic projects
approved.
This practice appears to be feeding itself, as strategy that is incorporated in this
manner leads to the belief that the process is effective. Although evaluation is
done, there are no consequences and poorly performing strategic projects are
in a sense “hidden”. A further compounding factor is the extensive use of
lobbying of projects that creates the opening for “politically strong” managers to

95
spotlight their preferred investments to the detriment of better projects. The use
of a “supply chain meeting” where capexes are approved in a nominal group
technique (see section 5.2.2 below) adds to the possibility that “politically
strong” managers can sway the meeting in favour of a particular investment.
The largest supporters of this practice are the senior managers. Middle
managers appear to be equally divided and directors were excluded because of
the small sample size. Figure 5-3 represents the basis on which this
conclusion was based and was derived from the responses to the questions
dealing with hypothesis three “ That management manipulates cash flows to
ensure a positive result when a project is strategic of nature or if the benefits
are intangible in order to gain acceptance within the purely financial based
evaluation criteria”. Figure 5-3 clearly indicates that senior managers are the
largest propagators of the current manipulation process.
Figure 5-3: Management support of manipulation
Source: Author’s own construction
0% 10% 20% 30% 40% 50% 60% 70% 80% 90% 100%
Senior
Middle
Total
Man
ag
em
en
t le
vel
Percentage
For Against

96
5.1.4 Risk
From the secondary data, current risk models may be conveniently divided into
those that aim at identifying the level of risk and those that, in some way,
consider risk. Identification of project risk is usually achieved by analysing the
financial data through the measurement of its sensitivity to variations and by
determining a project’s Payback period. Sensitivity analysis, simulation and
decision tree analysis are all models that show the identification of risk as an
influence on the financial data of a project. Risk is then taken into account
through an adjustment within the financial appraisal model used by either
reducing the required Payback period in line with the perceived increase in risk
or with respect to the DCF models, arbitrarily increasing the hurdle rate. This
subjective approach to risk is contrary to financial theory, which argues that
systematic and possibly unsystematic risk should be taken into account through
the cost of capital (from which the discount rate is determined). In directly
addressing risk, the secondary data refers to the capital asset pricing model
(CAPM) and the weighted average cost of capital (WACC).
Cadbury utilises WACC (weighted average cost of capital) as its method of risk
inclusion into its financial appraisal process and the setting of a hurdle rate.
These are fixed irrespective of the project size and risk profiles -the building of a
bicycle shed or a completely new facility all have to meet and use the same
discount factor and hurdle rate. The decision-makers are, however, aware of
the fact that risk profiles are different and can be varied, hence it can be
assumed that this is included in the calculation of the benefits as the RAM does
not allow for different risk profiles, once again hiding the true effects.

97
5.2 RECOMMENDATIONS
In this section, the characteristics of an ideal financial appraisal model, as well
as decision-making process are discussed and recommendations on the choice
of a model and implementation at Cadbury are made.
5.2.1 Required Characteristics of a financial decision-making model
From the literature and empirical research it can be concluded that strategic
benefits, although important, are one aspect of a three-dimensional investment
profile and deserve equal consideration with the financial and risk aspects.
To incorporate strategy successfully a model that treats strategic benefits as a
separate issue to financial appraisal and attempts to evaluate them in some
other way is needed. This model should show the following aspects:
• The incorporation of an orderly process to the finding of key strategic
benefits in each capital investment.
• The analysis and putting of value to the benefits, in order to highlight their
respective importance.
The key to unlocking of the most value of an organisation will only occur if the
model used can treat strategy as mentioned above as well as have the ability to
take the other dimensions of finance and risk into account. The model should,
however, be practical to use and adaptive to changing environments.
It would be naïve to assume that such a model will deliver faultless results,
unless the users effectively utilise it. If the old saying, ‘the tool is only as good
as the person who uses it’, is used as an analogy then attention should also be
placed on the decision-makers who should have the same dimensional ability
as the model.

98
5.2.2 Required decision-making
If the model described above is to be utilised effectively then the decision-
makers, need to alter their approach. The approach, like the model, needs to be
multi-disciplinary. The model described above has both subjective and
judgemental aspects that will require the views of managers to be expressed.
The model by nature of its multi-dimensions will require a group or management
team approach. Three generally accepted models of determining consensus or
near consensus opinion are: (Schultz, 2003: 175).
1. Nominal group technique where managers meet, exchange their views
and come up with a group judgemental value. The idea is that discussion will
take place until all managers are convinced to accept a single consensus
value through argument and persuasion. The danger of this approach is that
individual managers may be influenced by dominant group members and an
individual’s view will not be recorded (Schultz, 2003:175).
2. Pooling of individual values model where managers are asked
individually to supply their judgemental values. These values are then
combined in some way to arrive at a single value. Under this approach,
which is not reiterative, large variances in the judgemental values are
produced (Schultz, 2003:175).
3. The Delphi model where individual managers (experts), who form the
Delphi panel, are asked to supply their own judgmental values, opinions and
assumptions on certain issues. The responses obtained from the initial
request are then reviewed by a group facilitator and feedback is given to
managers for their further consideration and evaluation until a near
consensus value is reached- usually using some kind of weighted average
approach. Unlike the nominal group technique, methods other than face-to-
face group discussions are used. The Delphi model is especially suited to
intuitive judgements. In this approach, model managers never meet to
discuss their individual views but interact through a group facilitator using the
media of telephone, written statements or questionnaires. Responses are
thus anonymous. This addresses the danger of the nominal group technique
as dominant or “political” factors are removed (Schultz, 2003:175).

99
Cadbury currently utilises the nominal group technique for its decision-making
process and the high incidence (93%) of lobbying, indicates that the group is
manipulated by managers to achieve approval of their preferred projects.
The Delphi model would be better able to deliver investments more aligned with
strategy by removing the “political” influence of managers.
5.2.3 Current Cadbury decision model
The model currently in use by Cadbury is based on the “black box” model
described in chapter 2. This model consists of the following aspects.
5.2.3.1 Characteristics of current model
1. It is based on purely financial evaluation with only the following measures
displayed on the forms:
a. Cash Payback must be under three years.
b. IRR must be greater than 25 per cent.
c. Profitability Index must be greater than 100 per cent.
d. The above hurdles remain fixed irrespective of the size, value, and
duration of the project.
2. WACC is used to calculate the discount rate and remains fixed, irrespective
of project size or risk profile.
3. A dedicated computer program HOLT Evaluator is used to calculate the
three financial criteria.
4. Project duration is fixed at 10 years.
5. Project benefits are assumed correct and entered into the HOLT Evaluator.
6. Should a project not meet the requirements, a detailed report is needed to
justify why it should be accepted
5.2.3.2 Current Decision process
All capexes completed are first evaluated by a capex compiler who checks if
basic format meets the requirement of the Cadbury manual and then by the
financial department who check the calculations of the benefits. These capexes
are then submitted to a supply chain meeting where they have to be signed by
various sections of the supply chain. If accepted, they are submitted to the
board for final approval, depending on value they are either submitted to
regional, group, and finally main board, where a similar process as described

100
above occurs for each approval level. The supply chain meeting members are
mainly senior management.
5.2.4 Recommended implementation strategy
From the empirical evidence, it is apparent that Cadbury decision-makers are
locked into a particular way of performing capex evaluations and that this not an
ideal situation. The group responsible for the status quo are the senior
managers within the business. The recommendation is based on the following
assumptions and limitations:
• It is unlikely that there will be a large influx of new senior managers.
• A very different approach to capex evaluation will not easily find favour, due
to an old and established culture.
• Any implementation of a new model will take time.
• The current decision-making process will have to be adapted to suit the
situation.
• The HOLT Evaluator will have to remain a key component.
• Large disruption of the current process is not recommended as it could
affect the organisation’s profitability because of potential non-acceptance of
capital proposals.
If these limitations and assumptions are taken into account, then of the
available alternative models the Real Option model can be eliminated
immediately as its whole approach is too divergent from the current process
(highlighted in Table 5.2-1) and it is unlikely to gain immediate acceptance and
use. The model should, however, be introduced to the decision-makers, to allow
acceptance to grow slowly.
Table 5.2-1: Difference between Real Option and current process
Current Real options
Uses standard DCF calculations Uses complex option maths
All-or-nothing acceptance Staged, option approach.
Preference for use of Payback Payback not calculated or used
Relatively unsophisticated decision-
makers required
Sophisticated decision-makers required
who understand option mathematics and
identifying options.
Source: Author’s own construction

101
The financial appraisal profile model meets the characteristics described above,
and incorporates the three-dimensions of strategy, finance and risk well. It does
have certain characteristics in common with the current model. The differences
are again too large, (highlighted in Table 5.2-2) requiring too large an alteration
to the existing process to gain widespread acceptance and utilisation.
Table 5.2-2: Difference between Financial Appraisal Profile and current process
Current Financial Appraisal Profile
Uses standard DCF calculations Uses modified DCF calculations, in
particular NPVP
All –or- nothing acceptance All- or- nothing acceptance
Preference to use of Payback Variation of Payback calculated
Relatively unsophisticated decision-
makers required
Relatively unsophisticated decision-
makers required.
Risk fixed Unique risk calculated for each project.
Strategy not directly addressed Strategic index calculated.
Source: Author’s own construction
5.2.4.1 Recommended model
The recommended model is the Samuels, Wilkes and Brayshaw three-stage
model as it has the most similarities with the current process, as well as with the
ideal and can easily be added onto the existing process but will enhance
strategic decision-making. Table 5.2-3 indicates the similarities.
To refresh, the Samuels, Wilkes and Brayshaw 3 stage model (now referred to
as the 3 stage model) first evaluates whether an investment is aligned with
strategy, if not, it is rejected. Stage 2 consists of financial evaluation, which can
use NPV or the other DCF calculations. A difference is that only tangible
benefits need to be included and the discount rate can be obtained from
judgement and estimation. If the outcome is positive then the project is
accepted. Should the outcome be negative then the value of agreed intangible
benefits are weighed against the shortfall in NPV.

102
Two methods can be used; a point system where intangible benefits are listed
and a panel of experts (Delphi model) assign point scores to each benefit; or
the discount factor is lowered if the intangible benefits value can be
demonstrated (Refer to section 2.5.3.3).
Table 5.2-3: Similarities between Samuels, Wilkes and Brayshaw 3 stage model, current,
and ideal.
Current
Samuels, Wilkes and
Brayshaw three stage
model
Ideal
Uses standard DCF
calculations
Uses standard DCF
calculations
Addresses financial,
DCF preferred.
All- or- nothing
acceptance
All- or- nothing
acceptance
No preference
Preference to use of
Payback
Standard Payback can
be calculated
Payback not overriding
factor, but another
indicator.
Relatively
unsophisticated
decision-makers
required.
Relatively
unsophisticated
decision-makers
required.
Process needs to
generate answers that
can be effectively
evaluated by all types
of decision-makers.
Risk fixed Risk fixed or varied with
permission
Risk needs to match
investment
Strategy not directly
addressed
Strategy directly
addressed.
Strategy needs to be
included
Source: Author’s own construction
The major benefits of the 3-stage model are that it can be included into the
existing process and removes the “hidden” aspects of the old process.

103
5.2.5 Proposed process
The proposed process is that all projects are listed with a short description. The
list is submitted to the supply chain meeting where the projects are accepted or
rejected on strategic basis only. On completion of this stage, the remaining
projects undergo stage two where the projects can be evaluated using the
HOLT evaluator and the financially acceptable are forwarded to the directors for
final acceptance.
The financially unacceptable then undergo stage 3 where the intangible benefits
are listed and evaluated, using the Delphi model and are finally submitted to the
supply chain meeting for acceptance.
The process described above, utilising the three-stage model, should address
the following limitations of the old process and “black box” model:
• Inability to quantify the intangible. (Intangible included in stage 3)
• Use of discounted cash flow analysis (DCF) only promotes incremental type
projects due to the need to analyse the analysable. (Strategic projects can
be included by all projects first being accepted on strategy, as well as the
inclusion of intangible benefits)
• If the future is highly uncertain then the use of discount rates and projected
cash flows could be considered as highly unreliable and hence of little value.
(Discount rate can be adapted)
• When a decision does not fit the “black box”, it enters the realm of executive
decision-making, which is inconsistent and not well understood, with a high
potential of delivery of poor decisions. (The use of the Delphi model and
removal of the need to manipulate cash flows to fit into purely financial
evaluation.)
• Although DCF is academically preferred, the use of Payback is still
extensive. (Reliance on Payback removed)

104
The specific Cadbury limitations are addressed as follows.
• The manipulation of inputs into the model to incorporate strategic projects.
(The need to do so is removed as the suggested process incorporates
strategy)
• Almost exclusive use of Payback by decision-makers.
(Process indifferent)
• Strategic decisions are made by the poor and highly subjective executive
decision-making process. (The use of the Delphi model and removal of the
need to manipulate cash flows to fit into purely financial evaluation.)
• Inability to capture intangible benefits accurately. (Intangible included in
stage 3)
The recommended process meets the imposed assumptions and limitations as
indicated below:
• It is unlikely that there will be a large influx of new senior managers. (The
process is not reliant on a completely new approach and will not effect
existing managers negatively)
• A very different approach to capex evaluation will not easily find favour, due
to an old and established culture. (The proposed model is very similar to the
existing process - it enhances rather than replaces)
• Any implementation of a new model will take time. (The process is not time
dependent and lends itself to slow implementation)
• The current decision-making process will have to be adapted to suit the
situation. (The proposed model enhances rather than replaces).
• The HOLT evaluator will have to remain a key component. (This component
remains)
• Large disruption of the current process is not recommended as it could
affect the organisation’s profitability, owing to potential non-acceptance of
capital proposals. (The proposed model does not disrupt)
Based on the above, the 3-stage model and suggested process are
recommended as an alternative to the existing Cadbury model and process.

105
5.3 RECOMMENDATIONS FOR FURTHER RESEARCH
During the theoretical and empirical analysis the following where identified by
the researcher as possible areas requiring further research:
• Investigate what effect affirmative action is having on promotion levels within
the Cadbury organisation. This is based on the relative small age gap
between the management levels. The UK respondents were removed and
the average age for middle managers is 40, for senior managers, 48 and for
directors, 42. This could indicate that there is little movement through the
ranks as natural promotion is curtailed.
• Investigate how many of the approved projects actually deliver the expected
benefits.
• Investigate what should be done if projects do not deliver expected benefits.
• Investigate the nature of Cadbury culture.
• Investigate the nature and source of managers’ “political power”.
5.4 CONCLUSION
It is clear from the study that capital investment decision-making is a complex
and multi-dimensional topic and that it assists an organisation in creating value.
Furthermore, strategy is difficult to incorporate into capital investment decision-
making and the study identified models that can be used to achieve this
incorporation.
The study found that Cadbury does not effectively include strategy in its capital
investment process and that its decision-makers, manipulate the process to
include strategy.
An alternative model and process were identified and developed for Cadbury to
use to further ensure its success. This model and process, is represented by
Diagram 12 below.

106
Diagram 12: Proposed model for Cadbury
Source: Author’s own construction
Unsuccessful
projects rejected
Stage 1: Projects approved on strategy only
Stage 2: Projects evaluated using HOLT EVALUATOR
Successful
projects accepted
Successful
Projects pass to stage 2
Unsuccesful
Projects
Projects listed and described
Stage 3: Intangible benefits listed and evaluated using Delphi Model
Successful
Projects accepted
Unsuccessful
projects rejected

107
REFERENCES
Aggarwal, R. 1993. A brief overview of capital budgeting under uncertainty. In
R. Aggarwal (Ed.), Capital budgeting under uncertainty (pp. 9 – 41). Englewood
Cliffs, NJ: Prentice-Hall.
Amram, M. & Kulatilaka, N. 1999. Disciplined decisions. Aligning strategy with
the financial markets. Harvard Business Review, January-February, pp. 95-104.
Bierman, H. & Smidt, S. 1980. The capital budgeting decision. (5th ed.). New
York, NY: Macmillian.
Brealey, R. A. & Myers, S. C. 1991. Principles of corporate finance (4th ed.).
New York: McGraw-Hill.
Broyles, J. 2003. Financial management and real options. Chichester: John
Wiley & Sons.
Bourgeois, L. J. 1996. Strategic management. Orlando: The Dryden Press.
Buckley, A. 1996. International capital budgeting. Cornwall: T.J. Press
(Padstow).
Cadbury Schweppes. 2005. RAM process global. Author
Coetzee, L.C. 2005. Personal communication. Port Elizabeth: Cadbury South
Africa.
Copeland, T. E. & Keenan, P. T. 1998a. How much is flexibility worth. The
Mckinsey Quarterly, no. 2, 38-49.
Copeland, T. E. & Keenan, P. T. 1998b. Making real options real. The Mckinsey
Quarterly, no. 3, 128-141.

108
Dempsey, M. 1996. The development of a theory of corporate investment
decision making: An historical perspective with implications for future
development and teaching [Online]. Available from:
http://panoptic.csustan.edu/cpa96/txt/dempsey.txt (accessed: 2 August 2005).
Frankfort-Nachmias, C. & Nachmias, D. 1992. Research Methods in the social
sciences. (4th ed.). London: Edward Arnold.
Gitman, L.J. 2003. Principles of managerial finance (10th ed.). Boston: Pearson
Education.
Graham, J. R. & Harvey, C. R. 2001. The theory and practice of corporate
finance: Evidence from the field. Journal of Financial Economics, 29(60), 187-
243.
Grix, J. 2004. The foundations of research. New York, NY: Palgrave Macmillan.
Hall, J.H. 1998. An empirical investigation of the capital budgeting process
[Online]. Available from: http://ssrn.com/abstract=243295 (accessed: 12 August
2005).
Hayes, R.H & Garvin, D. 1982. Managing as if tomorrow mattered. Harvard
Business Review, May-June, pp. 71-79.
Hussey, J. & Hussey, R. 1997. Business research: A practical guide for
undergraduate and post graduate students. Bristol: Macmillian Press.
Horngren, C.T. & Foster, G. & Datar, S.M. 1997. Cost accounting a managerial
emphasis (9Th ed.). Upper Saddle River, NJ: Prentice-Hall.
Jackson, W. 1995. Doing social research methods. Scarborough: Prentice-Hall,
Canada.
Johnson, G. & Scholes, K. 2002. Exploring corporate strategy (6th ed.). Harlow,
Essex: Financial Times Prentice Hall.
109
Johnson, H. J. 1994. Strategic capital budgeting. Chicago, Illinois: Probus
Publishing.
Lawrence, J. A. & Pasternack, B. A. 2002. Applied management science.
Modelling, spreadsheet analysis, and communication for decision making (2nd
ed.). New York, NY: Wiley.
Leedy, P. 1993. Practical research, planning and decision (5th ed.). New York:
MacMillian.
Leedy, P.D. & Ormrod, J.E. 2005. Practical research. Planning and design
(8thed.). Upper Saddle River, NJ: Pearson Prentice Hall.
Leslie, K.J. & Michaels M.P. 1997. The real power of real options. The Mckinsey
Quarterly, no. 3, 97-108.
Levy, H. & Sarnat, M. 1982. Capital investment and financial decisions (2nd
ed.). Englewood Cliffs, NJ: Prentice Hall International.
Limes Consultancy. 2003. Capital investment appraisal [Online]. Available
from: http://www.thelimesconsultancy.com/capital_investment_appraisal.htm
(accessed: 22 September 2005).
Lovemore, F. 1996. Financial management made easy. Pretoria: J. L. van
Schaik .
Luehrman, T.A. 1998. Investment opportunities as real options: getting started
on the numbers. Harvard Business Review, July-August, pp. 51-67.
Luehrman, T.A. 1997. What’s it worth. A general managers guide to valuation
Harvard Business Review, May-June, pp. 132-142.
Lumby, L. 1991. Investment appraisal and financing decisions (4Th ed.).
London: Chapman & Hall

110
Managementor. 2000. Financial Appraisal Profile (FAP) incorporates risks and
strategic benefits in project appraisals as against traditional models [Online].
Available from:
http://www.themanagementor.com/Kmailer/finance/FAPmodel.asp (accessed:
22 September 2005).
Mauboussin, M.J. 1999. Get real. Using real options in security analysis
[Online]. Available from:
http://www.capatcolumbia.com/Articles/FoFinance/Fof10.pdf (accessed 28
September 2005).
Mekonnen Akalu, M. 2002. Evaluating the capacity of standard investment
appraisal methods: evidence from the practice [Online]. Available from:
http://ssrn.com/abstract=324841 (accessed: 12 August 2005).
Mouton, J. & Marais, H.C. 1992. Basic concepts in the methodology of the
social sciences. Pretoria: HSRC.
Neuman, W.L. 1994. Social research methods: Qualitative and quantitative
approaches (2nd ed.). Boston: Allyn and Bacon.
Northcott, D. 1992. Capital investment decision-making. London: Academic
Press.
Pike, R. H. & Wolfe, M. B. 1988. Capital budgeting for the 1990’s. London:
Charted Institute of Management Accountants.
Rudestam, K.E. & Newton, R.R. 2001. Surviving your dissertation. A
comprehensive guide to content and process (2nd ed.). Thousand Oaks, CA:
Sage.
Ryan, G. P. 2002. Capital budgeting practices of the fortune 1000: How have
things changed. Journal of Business and Management, 8(No. 4, Winter).

111
Samuels, J.M. & Wilkes, F.M. & Brayshaw, R.E. 1990. Management of
company finance (5Th ed.). London: Chapman and Hall.
Salvatore, D. 2001. Managerial economics in a global economy. Mason, Ohio:
South-Western.
Seitz, N.E. 1990. Capital budgeting and long term financing decisions. Orlando,
FL: Dryden Press.
Shrivastava, P. 1994. Strategic management. Ohio: South-Western
Publishing.
Schultz, H. 2003. Decision making in a global economy. In H. Schultz (Ed.),
Organisational behaviour. A contemporary South African perspective (pp 162-
180). Pretoria: Van Schaik.
Thomas, C.V. & DeLorenzo, M.A. & Bray, D.R. Capital budgeting for a new
dairy facility [Online]. Available from: Http://edis.ifas.ufl.edu/BODY_DS138
(accessed 7 November 2004).
Trigeorgis, L. & Mason, P. 2001. Valuing managerial flexibility. In E. S.
Schwartz, & L. Trigeorgis (Eds.), Real options and investment under
uncertainty: classical readings and recent contributions (pp. 48 – 60). London:
Massachusetts Institute of Technology Press.
Van Biljon, E.H.B. 1999. Supplier’s networks re-engineering by automotive
assemblers in the province of the Eastern Cape. Unpublished Dcom thesis,
University of Port Elizabeth.
Visser, K. 2004. Project Risk Management. In H. Styn & G. Basson & M.
Carruthers & Y. du Plessis & B. Prozesky-Kuschke & D. Kruger & D. Kruger &
S. van Eck & K. Visser, Project management. A multi-disciplinary approach. (pp.
299 – 332). Pretoria: Funda Project Management.

112
ANNEXURE A: HOW TO USE THE BLACK-SCHOLES OPTION PRICING
MODEL
Source: Adapted from Mauboussin (1999:27)
Before Fisher Black and Myron Scholes developed their model in 1973,
economists had tried for years to develop satisfactory models to price options.
In part, these would-be Nobel Prize winners were obstructed by the lack of
advanced mathematics in classical economics training. Fortunately, one does
not need to know how to derive the Black-Scholes model to use it. To
understand what value drivers make options valuable is not linked to knowledge
of the Black-Scholes formula.
In this Annexure, the generalized Black-Scholes formula is presented, leaving
the derivation of the equation to option textbooks. Following this presentation,
the formula is applied to a sample option.
Using the Black-Scholes Formula

113
To use the Black-Scholes method, the properties of an option are entered into
the appropriate formula. For example, if a call option has the following
properties:
Note that while the option can be immediately exercised for a gain of R 10 – by
paying R 40 to exercise an option and receiving a share worth R 50 – the option
will trade in the market place at R 16.74 this higher value comes from the “time
value” of the option, that is, from the possibility that the stock may be worth
even more than R 50 before the option expires in five years (Mauboussin,
1999:27).

114
ANNEXURE B: THE MATHEMATICS BEHIND THE BINOMIAL MODEL
Source: Adapted from Mauboussin (1999:29)
In its simplest form, the binomial model describes the process of price
movements where the asset value, in any period, can move to one of two
possible prices with associated probabilities. The model is based on a
replicating portfolio that combines risk-free borrowing (lending) with the
underlying asset to create the same cash flows as the option. As there is rarely
a market-priced underlying asset in real options valuation, it is important to be
careful to maintain as much of a financial market link as possible.
Here is a simple example. We value a European call option with a strike price of
R50, expected to expire in two periods, on an underlying asset of R50, which is
expected to follow a binomial process. We assume a 5 per cent risk-free rate.
The problem can be diagrammed as follows. (See Diagram 13) The actual
valuation can be done in three steps.
Diagram 13: Valuing a call option with a Binomial Model
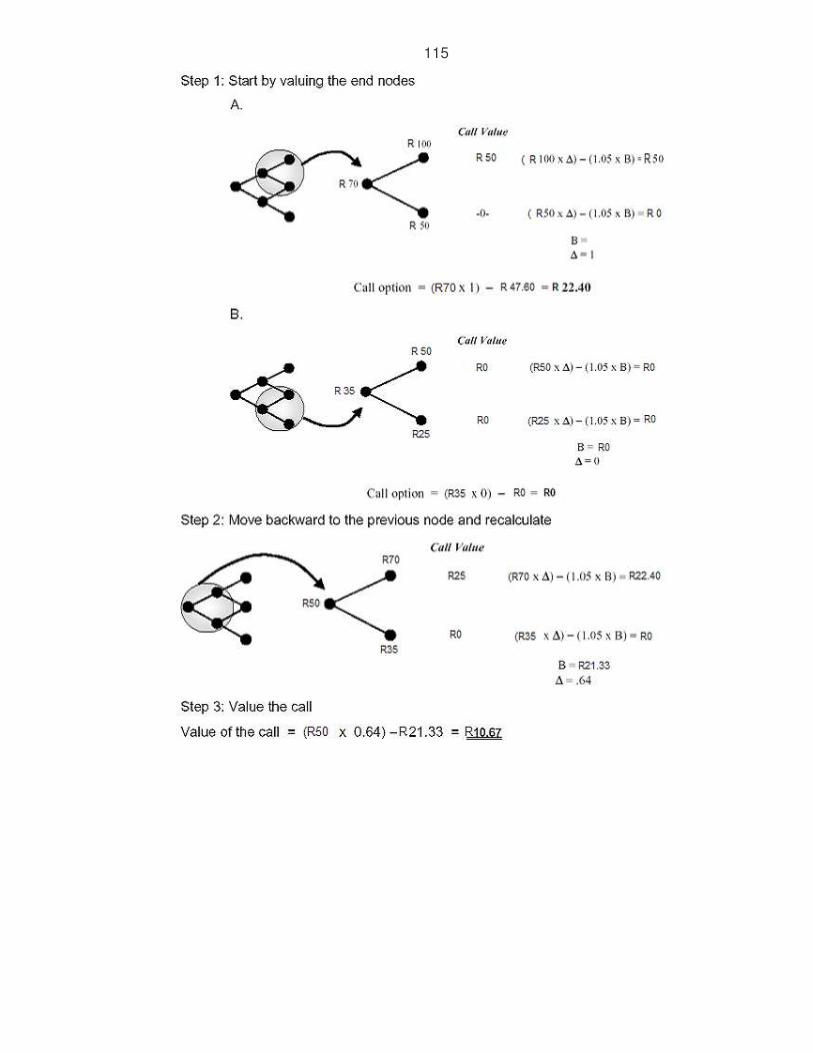
115

116
ANNEXURE C: USING THE FINANCIAL APPRAISAL MODEL
Source: Adapted from Limes Consultancy (2003:4)
Better Bet Inc. is considering the purchase of new manufacturing equipment
costing R 628,500. This equipment is expected to change the working practices
of its manufacturing department. This will help the company to render better
customer satisfaction. The company will gain a competitive advantage over its
rivals through this equipment (Flexibility) by being able to offer a continuous
supply of customised products. The installation of this equipment and revised
working practices will help the company to decrease its overall noise and dust
extraction levels and reduce its weekend operations. The cash flows that are
associated with this machine are in the range R 250,00 and the cost of capital is
9 per cent p.a. The machine has a useful life of 10 years.
Capital cost R 628,500.00
YearNet cash Inflows
Discount factor 9 %
PV of NetCash
inflows
Cum PV of
net cashInflows
1 250000 0.9174 229350 2293502 250000 0.8417 210425 4397753 250000 0.7722 193050 6328254 250000 0.7084 177100 8099255 250000 0.6499 162475 9724006 250000 0.5963 149075 11214757 250000 0.547 136750 12582258 250000 0.5019 125475 13837009 250000 0.4604 115100 149880010 250000 0.4224 105600 1604400
Totals 2500000 1604400Calculations:NPV= (PV of net cash inflows - capital cost of project)
.= R 1604400- R 628500 = R 975,900.00DPP=[2 + (R188725/R193050)] = 2.98 yearsDPPI = ( PV of net cash inflows/ capital cost of project).=R 1604400/ R 628500= 2.55MGR = [ (DPPI)^1/n - 1] x 100 = [(2.55)^1/10-1]x 100= 9.82%
Net cash Inflows from project
NPVP calculation

117
ANNEXURE D: QUESTIONNAIRE DEVELOPMENT

118

119
ANNEXURE E: QUESTIONNAIRE
Instructions
Please take the time to answer these questions truthfully. Where there are boxes tick the answer that best
applies and type your answers in the spaces provided. On completion, please save the document and
email to [email protected]. Your answers will be treated as confidential.
Demographics
1) Position/ job title:
2) Length of service with Cadbury:
3) Age:
4) Gender:
5) Highest level of education obtained:
6) No. Of projects evaluated on average per annum:
7) Level in the organisation:
Questions
1) The current RAM policy and process adequately addresses strategic driven CAPEX.
Strongly disagree Disagree Agree Strongly Agree
2) Do you know what the organisation’s strategy is?
3) How soon should a project pay for itself?
4) Can projects be approved on strategy only?
5) Which key financial performance indicator do you examine first?
If other please comment on which and why
6) Are the predicted cash flows for a project accurate?
If no please comment on why not!
Yes No
1-3 Years 3-5 years 5-10 years
Yes No
PI IRR NPV Cash Payback Other
Yes No

120
7) Are the cash flows sometimes manipulated to meet acceptable financial measures/ratios?
If yes, what do you think is done?
8) How long should a financial decision take?
9) Project proposals originate from?
10) Only financial indicators should be used for project evaluation.
Strongly disagree Disagree Agree Strongly Agree
11) Can all benefits from a project be translated to financial benefits?
If yes please comment on how
12) How well do you understand IRR.
Not at all Vaguely Working knowledge Thoroughly
13) Does lobbying of projects occur?
Yes No
1 - 2 weeks 1 month More than a month
Shop Floor
Junior managers
Middle managers
Senior managers
Directors
Consultants
Yes No
Yes No

121
14) To get a project approved the following may be altered.
If other please comment on what
15) Is capital investment decision-making an exact science?
If yes why?
16) Have you heard of the real option model with regards to capital investment?
17) In your experience what is the average time that a project takes from conception to approval?
18) Projects are only acceptable if they show cash inflow.
Strongly disagree Disagree Agree Strongly Agree
19) Payback is the easiest of financial indicators to understand and use.
Strongly disagree Disagree Agree Strongly Agree
20) To replace equipment with the same technology is better than introducing new technology.
Strongly disagree Disagree Agree Strongly Agree
21) Intangible benefits are not quantifiable.
Strongly disagree Disagree Agree Strongly Agree
22) Is the HOLT Evaluator easy to use?
Project spend Risk factor Cash inflows Other
Yes No
Yes No
Yes No

122
23) How long do you spend analysing the RAM before signing?
24) How well do you understand PI?
25) Project cash inflows are precisely calculated and are reliable.
26) More time should be spent on getting accurate investment costs than, establishing cash inflows.
27) Should different project types have different discount factors?
28) What is the time period of strategic driven decisions?
29) How well do you understand Payback?
30) Have you ever-manipulated cash flows to get a project to fit the financial indicators.
If yes what were your reasons
31) Have you heard of the Financial Appraisal Model with regard to capital investment?
32) Are post implementation evaluations done on completed projects with regard to
expected financial benefits?
Not at all Vaguely Working knowledge Thoroughly
Strongly disagree Disagree Agree Strongly Agree
Strongly disagree Disagree Agree Strongly Agree
Yes No
Not at all Vaguely Working knowledge Thoroughly
Yes No
Yes No
Yes No

123
33) How soon after the project is the post evaluation done?
34) What corrective actions are taken if predicted financial benefits for a project are not realized.
35) How well do you understand NPV?
Thank you for your time!
1 Year 2 years 5 years 10 years
Not at all Vaguely Working knowledge Thoroughly

124
ANNEXURE F: COVERING LETTER
27 October 2005
Survey on the capital budgeting process
Dear Colleague,
I am currently engaged in post-graduate studies, the topic of my study being
“Developing a decision-making model that best closes the gap between strategy and
the capital investment procedure for Cadbury South Africa”
The main purpose of the survey is to evaluate how the current capital budgeting
process addresses strategy. For this purpose, a number of respondents, including you
have been selected to participate in the survey.
As a result of your involvement in and experience with the current capital budgeting
process, your views and opinions concerning existing practices will be of major
importance, not only in respect of this study but also as a further contribution to the
improvement of the capital budgeting process.
Enclosed, please find the questionnaire. It would be greatly appreciated if you could
spare a few moments of your valuable time to contribute to the study by completing the
questionnaire and returning it to me by e-mail, not later than 10 November 2005.
All data obtained will be treated in the strictest confidence and the findings of the study
will be made available on request to participants after completion of the study.
Should you require any further information concerning the study as a whole or this
survey in particular, please do not hesitate to contact me at:
Telephone: 041 392 2256 (Work)
041 3609735 (Home)
072 2008482 (Cell)
e-mail: [email protected]
Thank you for your time and willingness to participate.
Yours sincerely
Brendan Wilson
(MBA student)

125
6 ANNEXURE G: LETTER FROM PROMOTER
NMMU Business School
Second Avenue Campus
P O Box 77000.
Port Elizabeth. 6031
Tel. +27 (0)41 5043736
Fax. +27 (0)41 5043891
27 October 2005
TO WHOM IT MAY CONCERN
I have pleasure in introducing Mr Brendan Wilson to you. He is currently a master’s
student in this department and is far advanced in his research towards a master’s
degree in business administration. His research topic is in the realm of Project
Management and the title of his thesis is “Developing a decision-making model that
best closes the gap between strategy and the capital investment procedure for
Cadbury South Africa”
He has virtually completed the literature survey for the thesis and now needs to
collect data from samples of respondents within the Cadbury Organisation. This data
is of cardinal importance for the success of the project and he has constructed a
questionnaire as a collection instrument.
It is hoped that, once the study has been completed, the findings will be able to
contribute significantly to the theory and practice of evaluating projects in an
increasingly turbulent environment.
As Mr Wilson’s promoter for his master’s research, I would like to appeal to you to
please assist him in his data collection by completing and returning his questionnaire.
By devoting a little of your valuable time to this research, you will be making an
important contribution to an expansion of knowledge in an increasingly important field
of management.

126
I thank you in anticipation.
Yours sincerely
Dr Shaun Krause


