Developer Guide - An introduction to application...
100
Red Hat Enterprise Linux 6 Developer Guide An introduction to application development tools in Red Hat Enterprise Linux 6 Dave Brolley William Cohen Roland Grunberg Aldy Hernandez Karsten Hopp Jakub Jelinek
Transcript of Developer Guide - An introduction to application...
Red Hat Enterprise Linux 6
Developer GuideAn introduction to application development
tools in Red Hat Enterprise Linux 6
Dave Brolley
William Cohen
Roland Grunberg
Aldy Hernandez
Karsten Hopp
Jakub Jelinek

Developer Guide
Jeff Johnston
Benjamin Kosnik
Aleksander Kurtakov
Chris Moller
Phil Muldoon
Andrew Overholt
Charley Wang
Kent Sebastian
Red Hat Enterprise Linux 6 Developer GuideAn introduction to application development tools in Red HatEnterprise Linux 6Edition 0
Author Dave Brolley [email protected] William Cohen [email protected] Roland Grunberg [email protected] Aldy Hernandez [email protected] Karsten Hopp [email protected] Jakub Jelinek [email protected] Jeff Johnston [email protected] Benjamin Kosnik [email protected] Aleksander Kurtakov [email protected] Chris Moller [email protected] Phil Muldoon [email protected] Andrew Overholt [email protected] Charley Wang [email protected] Kent Sebastian [email protected] Don Domingo [email protected] Jacquelynn East [email protected]
Copyright © 2010 Red Hat, Inc. and others.
The text of and illustrations in this document are licensed by Red Hat under a Creative CommonsAttribution–Share Alike 3.0 Unported license ("CC-BY-SA"). An explanation of CC-BY-SA is availableat http://creativecommons.org/licenses/by-sa/3.0/. In accordance with CC-BY-SA, if you distribute thisdocument or an adaptation of it, you must provide the URL for the original version.
Red Hat, as the licensor of this document, waives the right to enforce, and agrees not to assert,Section 4d of CC-BY-SA to the fullest extent permitted by applicable law.
Red Hat, Red Hat Enterprise Linux, the Shadowman logo, JBoss, MetaMatrix, Fedora, the InfinityLogo, and RHCE are trademarks of Red Hat, Inc., registered in the United States and other countries.
Linux® is the registered trademark of Linus Torvalds in the United States and other countries.
Java® is a registered trademark of Oracle and/or its affiliates.
XFS® is a trademark of Silicon Graphics International Corp. or its subsidiaries in the United Statesand/or other countries.
MySQL® is a registered trademark of MySQL AB in the United States, the European Union and othercountries.
All other trademarks are the property of their respective owners.
1801 Varsity Drive Raleigh, NC 27606-2072 USA Phone: +1 919 754 3700 Phone: 888 733 4281 Fax: +1 919 754 3701

Developer Guide
This document describes the different features and utilities that make Red Hat Enterprise Linux 6an ideal enterprise platform for application development. It focuses on Eclipse as an end-to-endintegrated development environment (IDE), but also includes command-line tools and other utilitiesoutside Eclipse.
v
Preface vii1. Document Conventions .................................................................................................. vii
1.1. Typographic Conventions .................................................................................... vii1.2. Pull-quote Conventions ....................................................................................... viii1.3. Notes and Warnings ............................................................................................ ix
2. Getting Help and Giving Feedback .................................................................................. ix2.1. Do You Need Help? ............................................................................................. ix2.2. We Need Feedback! ............................................................................................. x
1. Introduction to Eclipse 11.1. Understanding Eclipse Projects ..................................................................................... 11.2. Help In Eclipse ............................................................................................................ 31.3. Development Toolkits ................................................................................................... 5
2. The Eclipse Integrated Development Environment (IDE) 72.1. User Interface .............................................................................................................. 72.2. Useful Hints ............................................................................................................... 11
2.2.1. The quick access menu ................................................................................... 112.2.2. libhover Plug-in ................................................................................................ 17
3. Libraries and Runtime Support 213.1. Version Information ..................................................................................................... 213.2. Compatibility .............................................................................................................. 21
3.2.1. API Compatibility ............................................................................................. 223.2.2. ABI Compatibility ............................................................................................. 223.2.3. Policy .............................................................................................................. 223.2.4. Static Linking ................................................................................................... 23
3.3. Library and Runtime Details ........................................................................................ 233.3.1. The GNU C Library ......................................................................................... 233.3.2. The GNU C++ Standard Library ....................................................................... 263.3.3. Boost .............................................................................................................. 283.3.4. Qt ................................................................................................................... 313.3.5. KDE Development Framework .......................................................................... 323.3.6. Python ............................................................................................................ 343.3.7. Java ................................................................................................................ 353.3.8. Ruby ............................................................................................................... 363.3.9. Perl ................................................................................................................. 37
4. Compiling and Building 394.1. GNU Compiler Collection (GCC) ................................................................................. 39
4.1.1. GCC Status and Features ................................................................................ 394.1.2. Language Compatibility .................................................................................... 404.1.3. Object Compatibility and Interoperability ............................................................ 424.1.4. Backwards Compatibility Packages ................................................................... 434.1.5. Previewing RHEL6 compiler features on RHEL5 ................................................ 434.1.6. Running GCC .................................................................................................. 434.1.7. GCC Documentation ........................................................................................ 50
4.2. Distributed Compiling .................................................................................................. 504.3. Autotools .................................................................................................................... 50
4.3.1. Autotools Plug-in for Eclipse ............................................................................. 514.3.2. Configuration Script ......................................................................................... 514.3.3. Autotools Documentation ................................................................................. 52
4.4. Eclipse Built-in Specfile Editor .................................................................................... 52
5. Debugging 535.1. Installing Debuginfo Packages .................................................................................... 53
Developer Guide
vi
5.2. GDB .......................................................................................................................... 535.2.1. Simple GDB .................................................................................................... 545.2.2. Running GDB .................................................................................................. 555.2.3. Conditional Breakpoints ................................................................................... 575.2.4. Forked Execution ............................................................................................. 585.2.5. Threads .......................................................................................................... 585.2.6. GDB Variations and Environments .................................................................... 585.2.7. GDB Documentation ........................................................................................ 58
5.3. Variable Tracking at Assignments ................................................................................ 595.4. Python Pretty-Printers ................................................................................................ 59
6. Profiling 616.1. Profiling In Eclipse ...................................................................................................... 616.2. Valgrind ..................................................................................................................... 62
6.2.1. Valgrind Tools .................................................................................................. 626.2.2. Using Valgrind ................................................................................................. 636.2.3. Valgrind Plug-in for Eclipse ............................................................................. 636.2.4. Valgrind Documentation ................................................................................... 64
6.3. OProfile ..................................................................................................................... 646.3.1. OProfile Tools .................................................................................................. 646.3.2. Using OProfile ................................................................................................. 656.3.3. OProfile Plug-in For Eclipse ............................................................................ 656.3.4. OProfile Documentation ................................................................................... 66
6.4. SystemTap ................................................................................................................ 666.4.1. SystemTap Compile Server .............................................................................. 676.4.2. SystemTap Support for Unprivileged Users ........................................................ 676.4.3. SSL and Certificate Management ..................................................................... 686.4.4. SystemTap Documentation ............................................................................... 68
6.5. Eclipse-Callgraph ....................................................................................................... 696.5.1. Launching a Profile With Eclipse-Callgraph ....................................................... 696.5.2. The Callgraph View ......................................................................................... 71
6.6. Performance Counters for Linux (PCL) Tools and perf .................................................. 746.6.1. Perf Tool Commands ....................................................................................... 756.6.2. Using Perf ....................................................................................................... 75
6.7. ftrace ......................................................................................................................... 776.7.1. Using ftrace ..................................................................................................... 776.7.2. ftrace Documentation ....................................................................................... 78
A. Revision History 79
Index 81

vii
PrefaceThis book describes the some of the more commonly-used programming resources in Red HatEnterprise Linux 6. Each phase of the application development process is described as a separatechapter, enumerating tools that accomplish different tasks for that particular phase.
Note that this is not a comprehensive listing of all available development tools in Red Hat EnterpriseLinux 6. In addition, each section herein does not contain detailed documentation of each tool. Rather,this book provides a brief overview of each tool, with a short description of updates to the tool in RedHat Enterprise Linux 6 along with (more importantly) references to more detailed information.
In addition, this book focuses on Eclipse as an end-to-end integrated development platform. This wasdone to highlight the Red Hat Enterprise Linux 6 version of Eclipse and several Eclipse plug-ins.
1. Document ConventionsThis manual uses several conventions to highlight certain words and phrases and draw attention tospecific pieces of information.
In PDF and paper editions, this manual uses typefaces drawn from the Liberation Fonts1 set. TheLiberation Fonts set is also used in HTML editions if the set is installed on your system. If not,alternative but equivalent typefaces are displayed. Note: Red Hat Enterprise Linux 5 and later includesthe Liberation Fonts set by default.
1.1. Typographic ConventionsFour typographic conventions are used to call attention to specific words and phrases. Theseconventions, and the circumstances they apply to, are as follows.
Mono-spaced Bold
Used to highlight system input, including shell commands, file names and paths. Also used to highlightkeycaps and key combinations. For example:
To see the contents of the file my_next_bestselling_novel in your currentworking directory, enter the cat my_next_bestselling_novel command at theshell prompt and press Enter to execute the command.
The above includes a file name, a shell command and a keycap, all presented in mono-spaced boldand all distinguishable thanks to context.
Key combinations can be distinguished from keycaps by the hyphen connecting each part of a keycombination. For example:
Press Enter to execute the command.
Press Ctrl+Alt+F2 to switch to the first virtual terminal. Press Ctrl+Alt+F1 toreturn to your X-Windows session.
The first paragraph highlights the particular keycap to press. The second highlights two keycombinations (each a set of three keycaps with each set pressed simultaneously).
If source code is discussed, class names, methods, functions, variable names and returned valuesmentioned within a paragraph will be presented as above, in mono-spaced bold. For example:
1 https://fedorahosted.org/liberation-fonts/
Preface
viii
File-related classes include filesystem for file systems, file for files, and dir fordirectories. Each class has its own associated set of permissions.
Proportional Bold
This denotes words or phrases encountered on a system, including application names; dialog box text;labeled buttons; check-box and radio button labels; menu titles and sub-menu titles. For example:
Choose System → Preferences → Mouse from the main menu bar to launch MousePreferences. In the Buttons tab, click the Left-handed mouse check box and clickClose to switch the primary mouse button from the left to the right (making the mousesuitable for use in the left hand).
To insert a special character into a gedit file, choose Applications → Accessories→ Character Map from the main menu bar. Next, choose Search → Find… from theCharacter Map menu bar, type the name of the character in the Search field and clickNext. The character you sought will be highlighted in the Character Table. Double-click this highlighted character to place it in the Text to copy field and then click the
Copy button. Now switch back to your document and choose Edit → Paste from thegedit menu bar.
The above text includes application names; system-wide menu names and items; application-specificmenu names; and buttons and text found within a GUI interface, all presented in proportional bold andall distinguishable by context.
Mono-spaced Bold Italic or Proportional Bold Italic
Whether mono-spaced bold or proportional bold, the addition of italics indicates replaceable orvariable text. Italics denotes text you do not input literally or displayed text that changes depending oncircumstance. For example:
To connect to a remote machine using ssh, type ssh [email protected] ata shell prompt. If the remote machine is example.com and your username on thatmachine is john, type ssh [email protected].
The mount -o remount file-system command remounts the named filesystem. For example, to remount the /home file system, the command is mount -oremount /home.
To see the version of a currently installed package, use the rpm -q packagecommand. It will return a result as follows: package-version-release.
Note the words in bold italics above — username, domain.name, file-system, package, version andrelease. Each word is a placeholder, either for text you enter when issuing a command or for textdisplayed by the system.
Aside from standard usage for presenting the title of a work, italics denotes the first use of a new andimportant term. For example:
Publican is a DocBook publishing system.
1.2. Pull-quote ConventionsTerminal output and source code listings are set off visually from the surrounding text.
Output sent to a terminal is set in mono-spaced roman and presented thus:

Notes and Warnings
ix
books Desktop documentation drafts mss photos stuff svnbooks_tests Desktop1 downloads images notes scripts svgs
Source-code listings are also set in mono-spaced roman but add syntax highlighting as follows:
package org.jboss.book.jca.ex1;
import javax.naming.InitialContext;
public class ExClient{ public static void main(String args[]) throws Exception { InitialContext iniCtx = new InitialContext(); Object ref = iniCtx.lookup("EchoBean"); EchoHome home = (EchoHome) ref; Echo echo = home.create();
System.out.println("Created Echo");
System.out.println("Echo.echo('Hello') = " + echo.echo("Hello")); }}
1.3. Notes and WarningsFinally, we use three visual styles to draw attention to information that might otherwise be overlooked.
Note
Notes are tips, shortcuts or alternative approaches to the task at hand. Ignoring a note shouldhave no negative consequences, but you might miss out on a trick that makes your life easier.
Important
Important boxes detail things that are easily missed: configuration changes that only apply tothe current session, or services that need restarting before an update will apply. Ignoring a boxlabeled 'Important' will not cause data loss but may cause irritation and frustration.
Warning
Warnings should not be ignored. Ignoring warnings will most likely cause data loss.
2. Getting Help and Giving Feedback
2.1. Do You Need Help?If you experience difficulty with a procedure described in this documentation, visit the Red HatCustomer Portal at http://access.redhat.com. Through the customer portal, you can:

Preface
x
• search or browse through a knowledgebase of technical support articles about Red Hat products.
• submit a support case to Red Hat Global Support Services (GSS).
• access other product documentation.
Red Hat also hosts a large number of electronic mailing lists for discussion of Red Hat software andtechnology. You can find a list of publicly available mailing lists at https://www.redhat.com/mailman/listinfo. Click on the name of any mailing list to subscribe to that list or to access the list archives.
2.2. We Need Feedback!If you find a typographical error in this manual, or if you have thought of a way to make this manualbetter, we would love to hear from you! Please submit a report in Bugzilla: http://bugzilla.redhat.com/against the product Red_Hat_Enterprise_Linux.
When submitting a bug report, be sure to mention the manual's identifier: doc-Developer_Guide
If you have a suggestion for improving the documentation, try to be as specific as possible whendescribing it. If you have found an error, please include the section number and some of thesurrounding text so we can find it easily.
Chapter 1.
1
Introduction to EclipseEclipse is a powerful development environment that provides tools for each phase of the developmentprocess. It is integrated into a single, fully configurable user interface for ease of use, featuring apluggable architecture which allows for extension in a variety of ways.
Eclipse integrates a variety of disparate tools into a unified environment to create a rich developmentexperience. The Valgrind plug-in, for example, allows programmers to perform memory profiling(normally done through the command line) through the Eclipse user interface. This functionality is notexclusive only to Eclipse.
Being a graphical application, Eclipse is a welcome alternative to developers who find the commandline interface intimidating or difficult. In addition, Eclipse's built-in Help system provides extensivedocumentation for each integrated feature and tool. This greatly decreases the initial time investmentrequired for new developers to become fluent in its use.
The traditional (i.e. mostly command-line based) Linux tools suite (gcc, gdb, etc) and Eclipse offertwo distinct approaches to programming. Most traditional Linux tools are far more flexible, subtle,and (in aggregate) more powerful than their Eclipse-based counterparts. These traditional Linuxtools, on the other hand, are more difficult to master, and offer more capabilities than are required bymost programmers or projects. Eclipse, by contrast, sacrifices some of these benefits in favor of anintegrated environment, which in turn is suitable for users who prefer their tools accessible in a single,graphical interface.
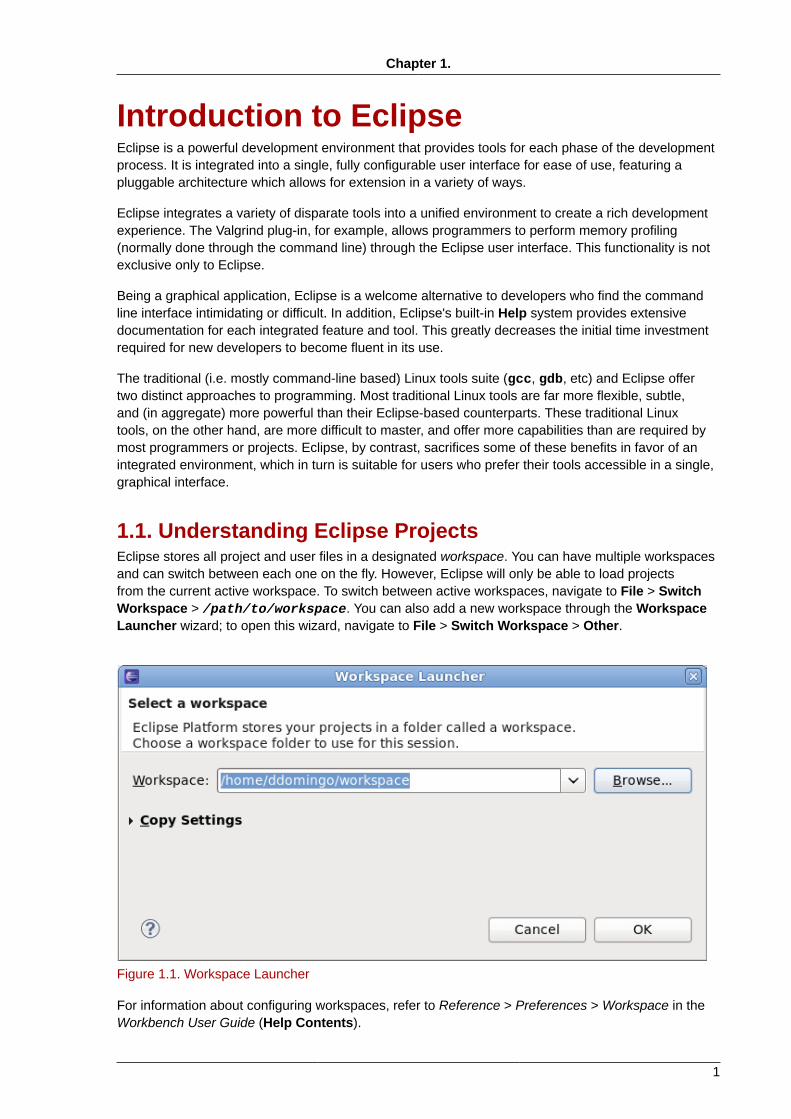
1.1. Understanding Eclipse ProjectsEclipse stores all project and user files in a designated workspace. You can have multiple workspacesand can switch between each one on the fly. However, Eclipse will only be able to load projectsfrom the current active workspace. To switch between active workspaces, navigate to File > SwitchWorkspace > /path/to/workspace. You can also add a new workspace through the WorkspaceLauncher wizard; to open this wizard, navigate to File > Switch Workspace > Other.
Figure 1.1. Workspace Launcher
For information about configuring workspaces, refer to Reference > Preferences > Workspace in theWorkbench User Guide (Help Contents).

Chapter 1. Introduction to Eclipse
2
A project can be imported directly into Eclipse if it contains the necessary Eclipse metafiles. Eclipseuses these files to determine what kind of perspectives, tools, and other user interface configurationsto implement.
As such, when attempting to import a project that has never been used on Eclipse, it may benecessary to do so through the New Project wizard instead of the Import wizard. Doing so will createthe necessary Eclipse metafiles for the project, which you can also include when you commit theproject.
Figure 1.2. New Project Wizard
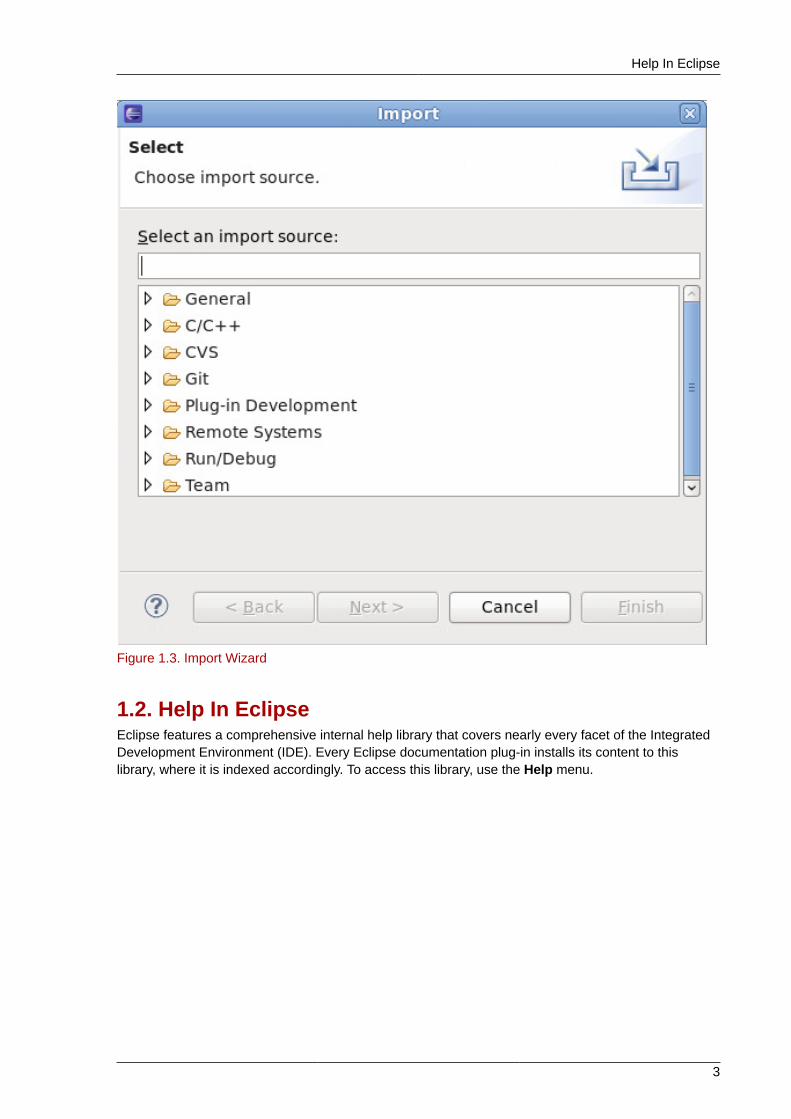
The Import wizard is suitable mostly for projects that were created or previously edited in Eclipse, i.e.projects that contain the necessary Eclipse metafiles.
Help In Eclipse
3
Figure 1.3. Import Wizard
1.2. Help In EclipseEclipse features a comprehensive internal help library that covers nearly every facet of the IntegratedDevelopment Environment (IDE). Every Eclipse documentation plug-in installs its content to thislibrary, where it is indexed accordingly. To access this library, use the Help menu.
Chapter 1. Introduction to Eclipse
4
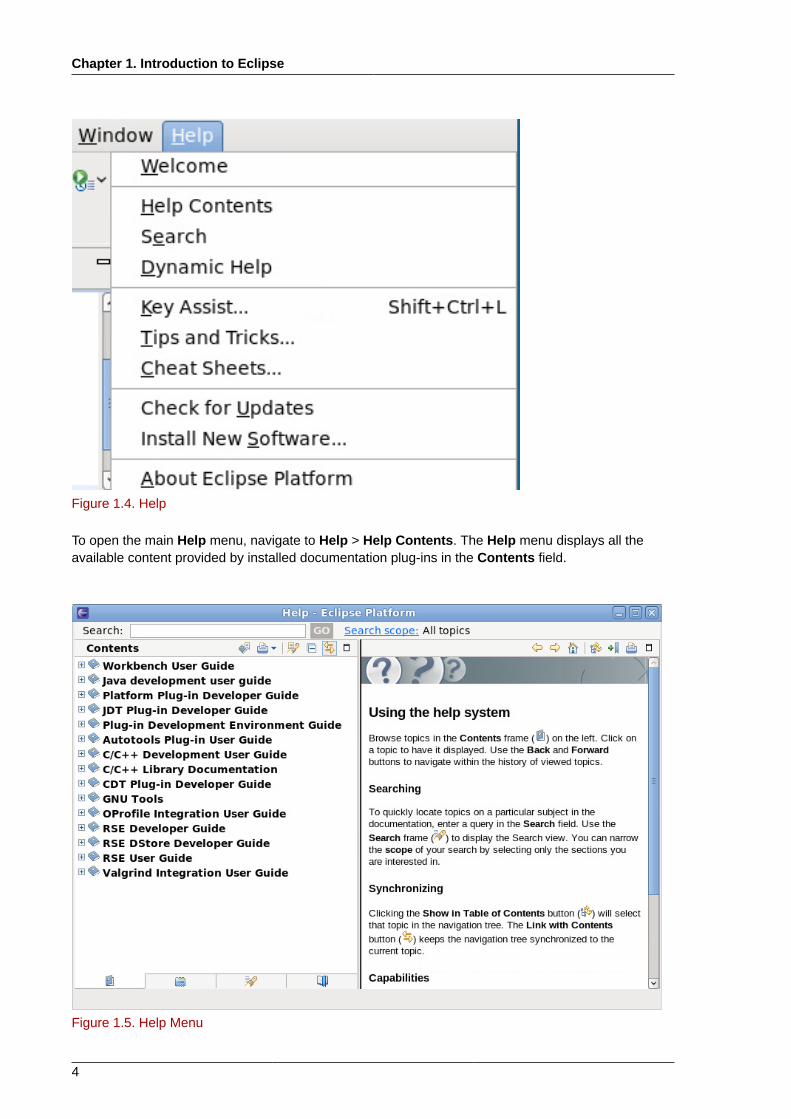
Figure 1.4. Help
To open the main Help menu, navigate to Help > Help Contents. The Help menu displays all theavailable content provided by installed documentation plug-ins in the Contents field.
Figure 1.5. Help Menu

Development Toolkits
5
The tabs at the bottom of the Contents field provides different options for accessing Eclipsedocumentation. You can navigate through each "book" by section/header or by simply searchingvia the Search field. You can also bookmark sections in each book and access them through theBookmarks tab.
The Workbench User Guide documents all facets of the Eclipse user interface extensively. It containsvery low-level information on the Eclipse workbench, perspectives, and different concepts useful inunderstanding how Eclipse works. The Workbench User Guide is an ideal resource for users with littleto intermediate experience with Eclipse or IDEs in general. This documentation plug-in is installed bydefault.
The Eclipse help system also includes a dynamic help feature. This feature opens a new windowin the workbench that displays documentation relating to a selected interface element. To activatedynamic help, navigate to Help > Dynamic Help.
Figure 1.6. Dynamic Help
The rightmost window in Figure 1.6, “Dynamic Help” displays help topics related to the Outline view,which is the selected user interface element.
1.3. Development ToolkitsRed Hat Enterprise Linux 6 supports the primary Eclipse development toolkits for C/C++ (CDT) andJava (JDT). These toolkits provide a set of integrated tools specific to their respective languages.Both toolkits supply Eclipse GUI interfaces with the required tools for editing, building, running, anddebugging source code.
Each toolkit provides custom editors for their respective language. Both CDT and JDT also providemultiple editors for a variety of file types used in a project. For example, the CDT supplies differenteditors specific for C/C++ header files and source files, along with a Makefile editor.
Toolkit-supplied editors provide error parsing for some file types (without requiring a build), althoughthis may not be available on projects where cross-file dependencies exist. The CDT source file
Chapter 1. Introduction to Eclipse
6
editor, for example, provides error parsing in the context of a single file, but some errors may onlybe visible when a complete project is built. Other common features among toolkit-supplied editorsare colorization, code folding, and automatic indentation. In some cases, other plug-ins provideadvanced editor features such as automatic code completion, hover help, and contextual search; agood example of such a plug-in is libhover, which adds these extended features to C/C++ editors(refer to Section 2.2.2, “libhover Plug-in” for more information).
User interfaces for most (if not all) steps in creating a project's target (inary, file, library, etc) areprovided by the build functionalities of each toolkit. Each toolkit also provides Eclipse with the meansto automate as much of the build process as possible, helping you concentrate more on writing codethan building it. Both toolkits also add useful UI elements for finding problems in code preventing abuild; for example, Eclipse sends compile errors to the Problems view. For most error types, Eclipseallows you to navigate directly to an error's cause (file and code segment) by simply clicking on itsentry in the Problems view.
As is with editors, other plug-ins can also provide extended capabilities for building a project — theAutotools plug-in, for example, allows you to add portability to a C/C++ project, allowing otherdevelopers to build the project in a wide variety of environments (for more information, refer toSection 4.3, “Autotools”).
For projects with executable/binary targets, each toolkit also supplies run/debug functionalities toEclipse. In most projects, "run" is simply executed as a "debug" action without interruptions. Bothtoolkits tie the Debug view to the Eclipse editor, allowing breakpoints to be set. Conversely, triggeredbreakpoints open their corresponding functions in code in the editor. Variable values can also beexplored by clicking their names in the code.
For some projects, build integration is also possible. With this, Eclipse automatically rebuilds a projector installs a "hot patch" if you edit code in the middle of a debugging session. This allows a morestreamlined debug-and-correct process, which some developers prefer.
The Eclipse Help menu provides extensive documentation on both CDT and JDT. For moreinformation on either toolkit, refer to the Java Development User Guide or C/C++ Development UserGuide in the Eclipse Help Contents.
Chapter 2.
7
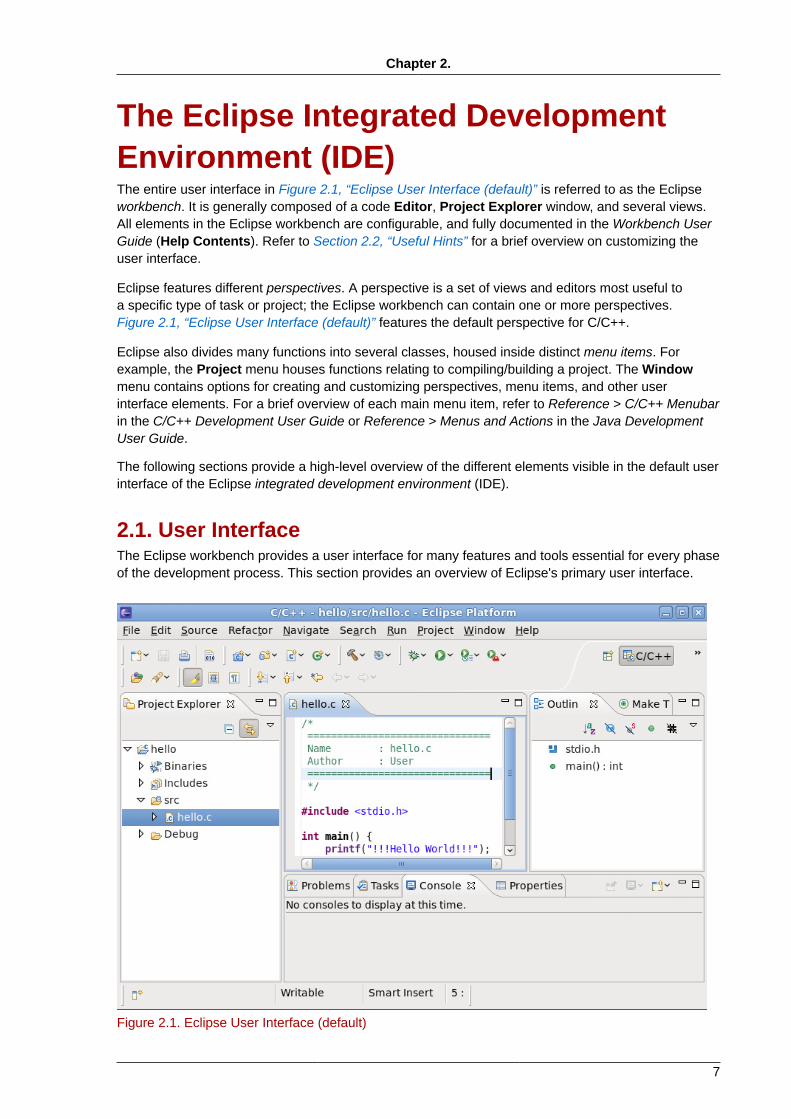
The Eclipse Integrated DevelopmentEnvironment (IDE)The entire user interface in Figure 2.1, “Eclipse User Interface (default)” is referred to as the Eclipseworkbench. It is generally composed of a code Editor, Project Explorer window, and several views.All elements in the Eclipse workbench are configurable, and fully documented in the Workbench UserGuide (Help Contents). Refer to Section 2.2, “Useful Hints” for a brief overview on customizing theuser interface.
Eclipse features different perspectives. A perspective is a set of views and editors most useful toa specific type of task or project; the Eclipse workbench can contain one or more perspectives.Figure 2.1, “Eclipse User Interface (default)” features the default perspective for C/C++.
Eclipse also divides many functions into several classes, housed inside distinct menu items. Forexample, the Project menu houses functions relating to compiling/building a project. The Windowmenu contains options for creating and customizing perspectives, menu items, and other userinterface elements. For a brief overview of each main menu item, refer to Reference > C/C++ Menubarin the C/C++ Development User Guide or Reference > Menus and Actions in the Java DevelopmentUser Guide.
The following sections provide a high-level overview of the different elements visible in the default userinterface of the Eclipse integrated development environment (IDE).
2.1. User InterfaceThe Eclipse workbench provides a user interface for many features and tools essential for every phaseof the development process. This section provides an overview of Eclipse's primary user interface.
Figure 2.1. Eclipse User Interface (default)
Chapter 2. The Eclipse Integrated Development Environment (IDE)
8
Figure 2.1, “Eclipse User Interface (default)” displays the default workbench for C/C++ projects. Toswitch between available perspectives in a workbench, press Ctrl+F8. For some hints on perspectivecustomization, refer to Section 2.2, “Useful Hints”. The figures that follow describe each basic elementvisible in the default C/C++ perspective.
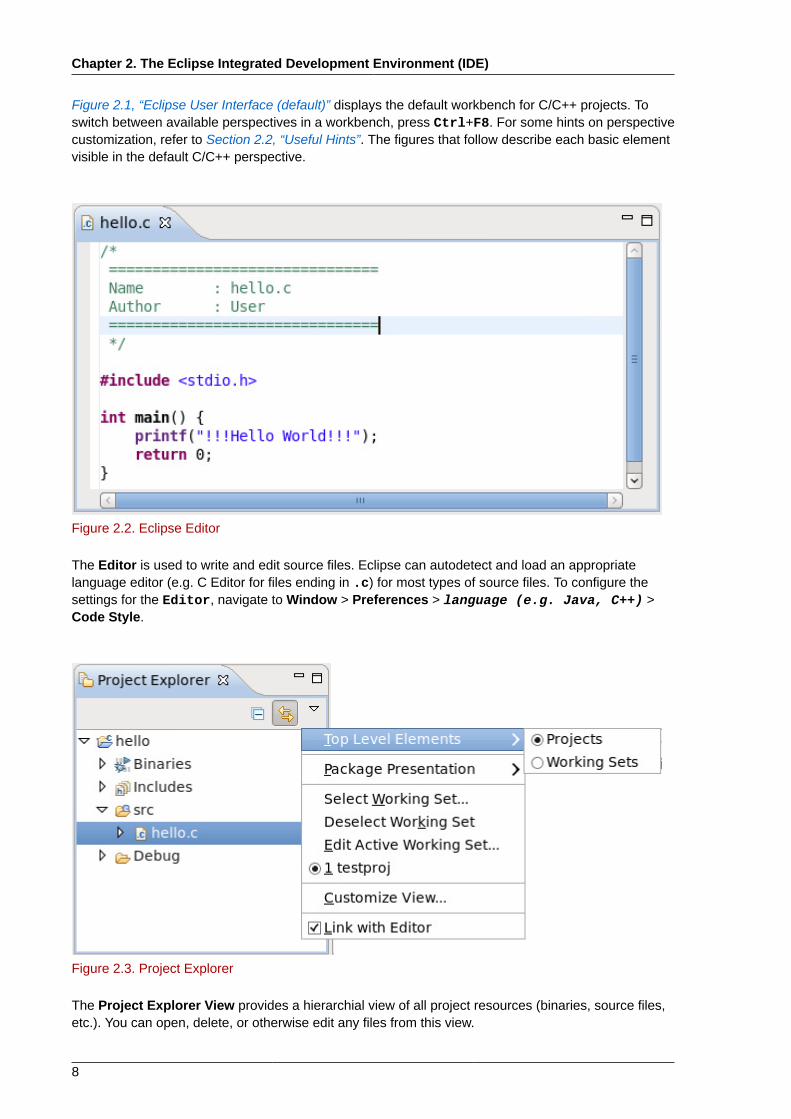
Figure 2.2. Eclipse Editor
The Editor is used to write and edit source files. Eclipse can autodetect and load an appropriatelanguage editor (e.g. C Editor for files ending in .c) for most types of source files. To configure thesettings for the Editor, navigate to Window > Preferences > language (e.g. Java, C++) >Code Style.
Figure 2.3. Project Explorer
The Project Explorer View provides a hierarchial view of all project resources (binaries, source files,etc.). You can open, delete, or otherwise edit any files from this view.
User Interface
9
The View Menu button in the Project Explorer View allows you to configure whether projects orworking sets are the top-level items in the Project Explorer View. A working set is a group of projectsarbitrarily classified as a single set; working sets are handy in organizing related or linked projects.
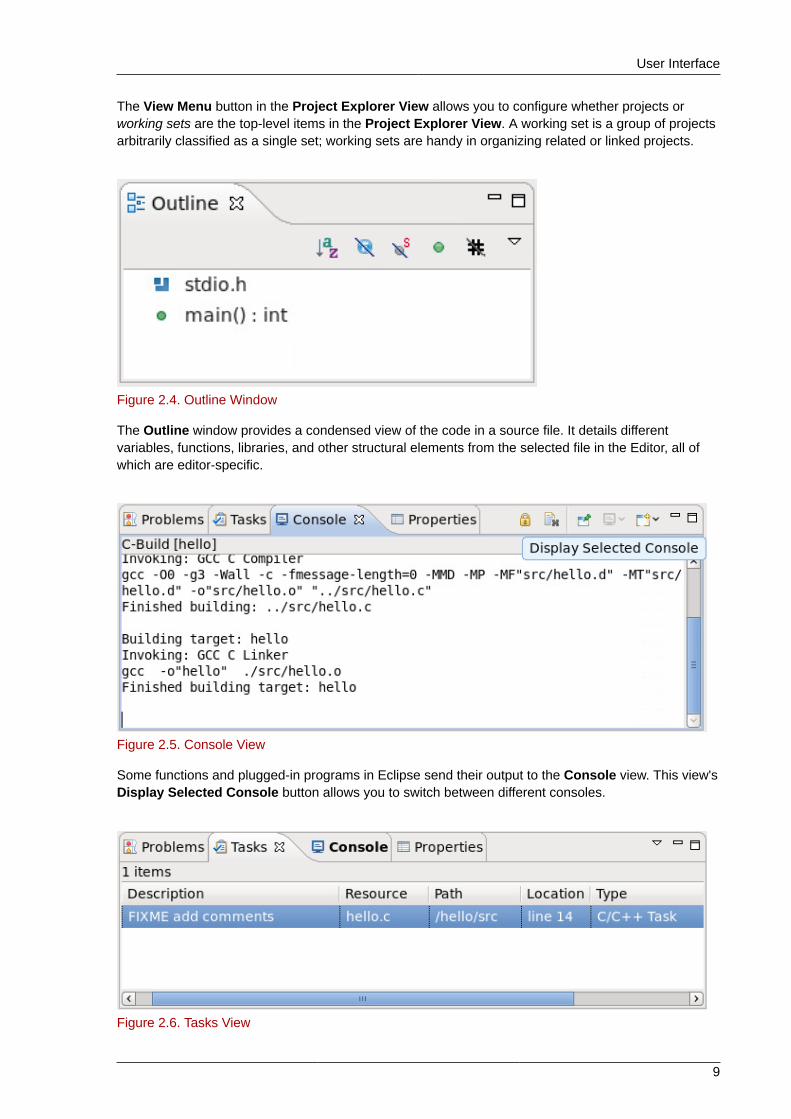
Figure 2.4. Outline Window
The Outline window provides a condensed view of the code in a source file. It details differentvariables, functions, libraries, and other structural elements from the selected file in the Editor, all ofwhich are editor-specific.
Figure 2.5. Console View
Some functions and plugged-in programs in Eclipse send their output to the Console view. This view'sDisplay Selected Console button allows you to switch between different consoles.
Figure 2.6. Tasks View
Chapter 2. The Eclipse Integrated Development Environment (IDE)
10
The Tasks view allows you to track specially-marked reminder comments in the code. This viewshows the location of each task comment and allows you to sort them in several ways.
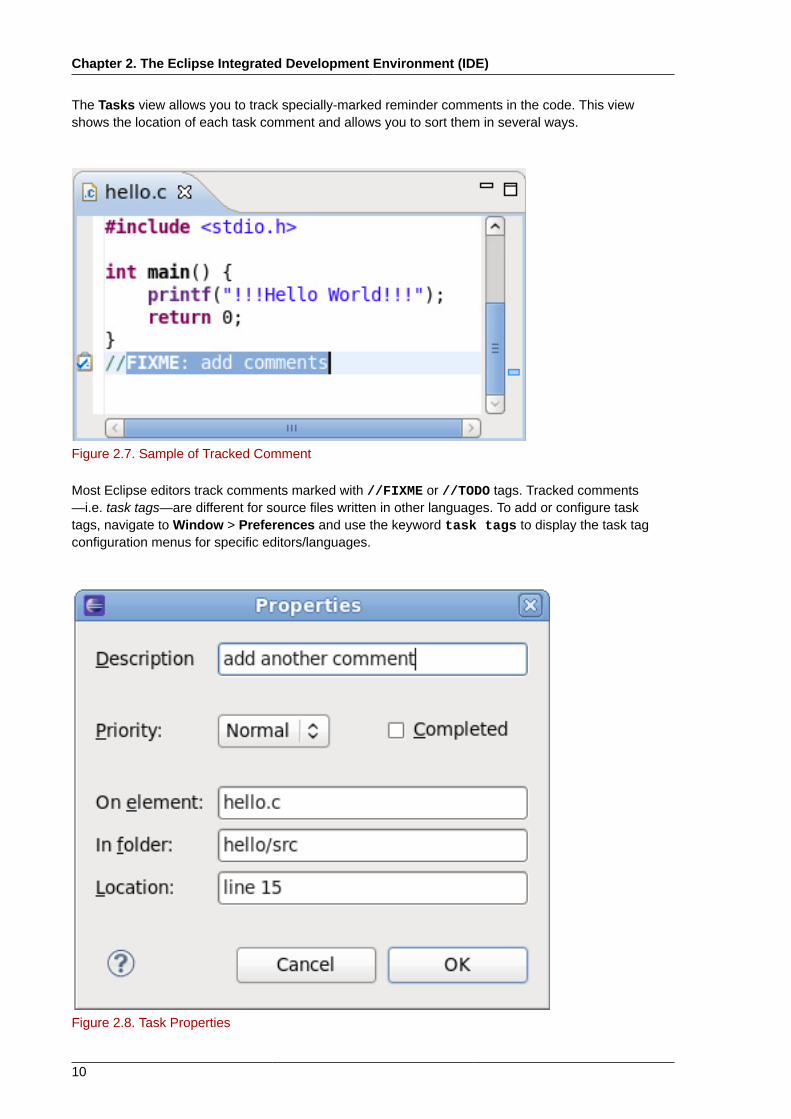
Figure 2.7. Sample of Tracked Comment
Most Eclipse editors track comments marked with //FIXME or //TODO tags. Tracked comments—i.e. task tags—are different for source files written in other languages. To add or configure tasktags, navigate to Window > Preferences and use the keyword task tags to display the task tagconfiguration menus for specific editors/languages.
Figure 2.8. Task Properties

Useful Hints
11
Alternatively, you can also use Edit > Add Task to open the task Properties menu (Figure 2.8, “TaskProperties”). This will allow you to add a task to a specific location in a source file without using a tasktag.
Figure 2.9. Problems View
The Problems view displays any errors or warnings that occurred during the execution of specificactions such as builds, cleans, or profile runs. To display a suggested "quick fix" to a specific problem,select it and press Ctrl+1.
2.2. Useful HintsMany Eclipse users learn useful tricks and troubleshooting techniques throughout their experiencewith the Eclipse user interface. This section highlights some of the more useful hints that users newto Eclipse may be interested in learning. The Tips and Tricks section of the Workbench User Guidecontains a more extensive list of Eclipse tips.
2.2.1. The quick access menuOne of the most useful Eclipse tips is to use the quick access menu. Typing a word in the quickaccess menu will present a list of Views, Commands, Help files and other actions related to that word.To open this menu, press Ctrl+3.

Chapter 2. The Eclipse Integrated Development Environment (IDE)
12
Figure 2.10. Quick Access Menu
In Figure 2.10, “Quick Access Menu”, clicking Views > Project Explorer will select the ProjectExplorer window. Clicking any item from the Commands, Menus, New, or Preferences categories torun the selected item. This is similar to navigating to or clicking the respective menu options or taskbaricons. You can also navigate through the quick access menu using the arrow keys.
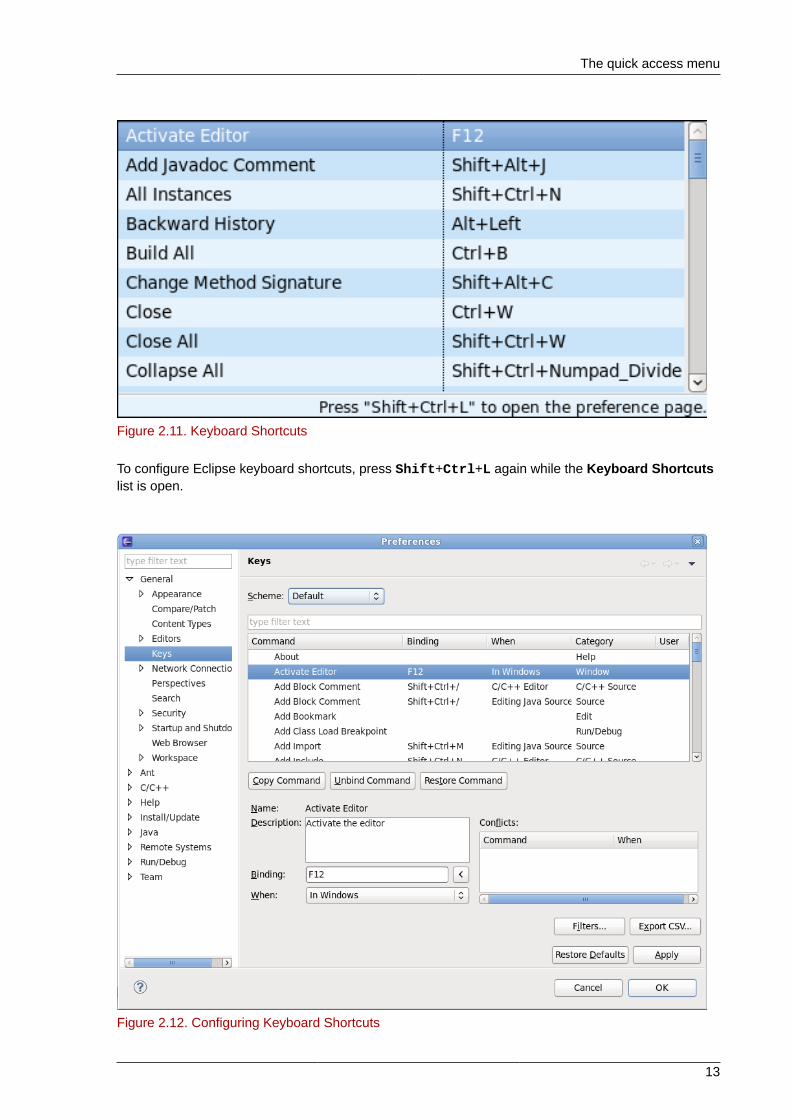
It is also possible to view a complete list of all keyboard shortcut commands; to do so, pressShift+Ctrl+L.
The quick access menu
13
Figure 2.11. Keyboard Shortcuts
To configure Eclipse keyboard shortcuts, press Shift+Ctrl+L again while the Keyboard Shortcutslist is open.
Figure 2.12. Configuring Keyboard Shortcuts
Chapter 2. The Eclipse Integrated Development Environment (IDE)
14
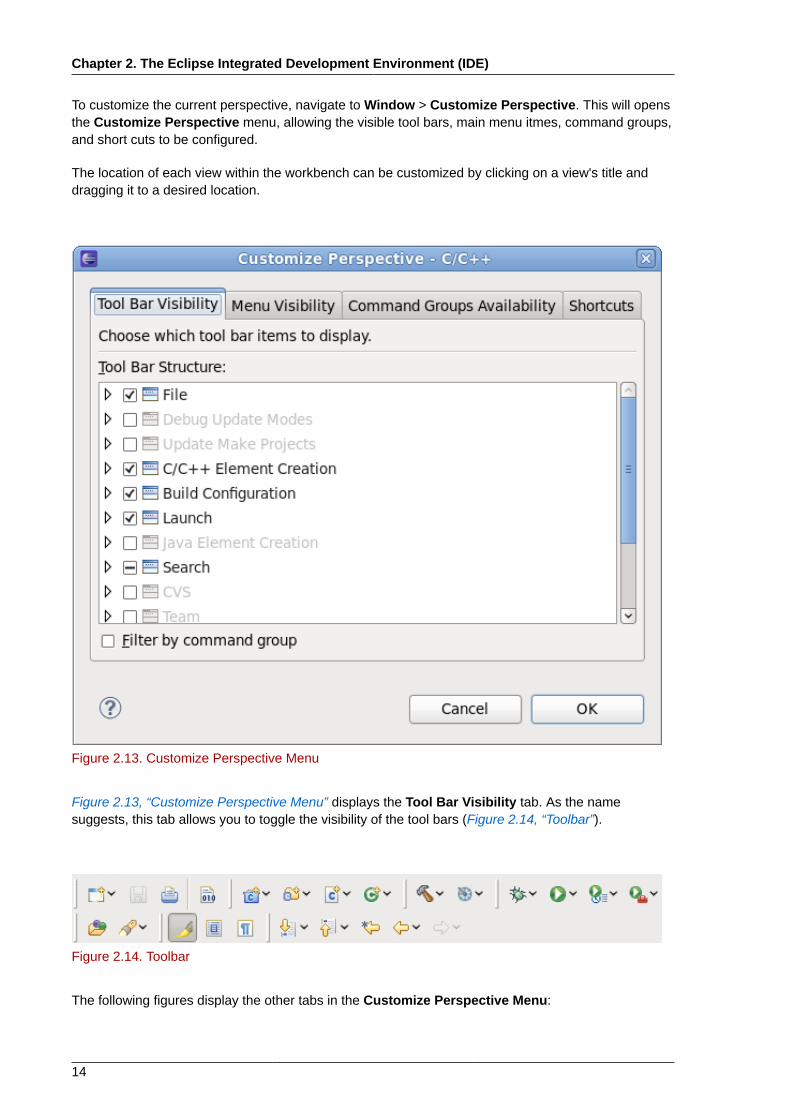
To customize the current perspective, navigate to Window > Customize Perspective. This will opensthe Customize Perspective menu, allowing the visible tool bars, main menu itmes, command groups,and short cuts to be configured.
The location of each view within the workbench can be customized by clicking on a view's title anddragging it to a desired location.
Figure 2.13. Customize Perspective Menu
Figure 2.13, “Customize Perspective Menu” displays the Tool Bar Visibility tab. As the namesuggests, this tab allows you to toggle the visibility of the tool bars (Figure 2.14, “Toolbar”).
Figure 2.14. Toolbar
The following figures display the other tabs in the Customize Perspective Menu:

The quick access menu
15
Figure 2.15. Menu Visibility Tab
The Menu Visibility tab configures what functions are visible in each main menu item. For a briefoverview of each main menu item, refer to Reference > C/C++ Menubar in the C/C++ DevelopmentUser Guide or Reference > Menus and Actions in the Java Development User Guide.
Chapter 2. The Eclipse Integrated Development Environment (IDE)
16
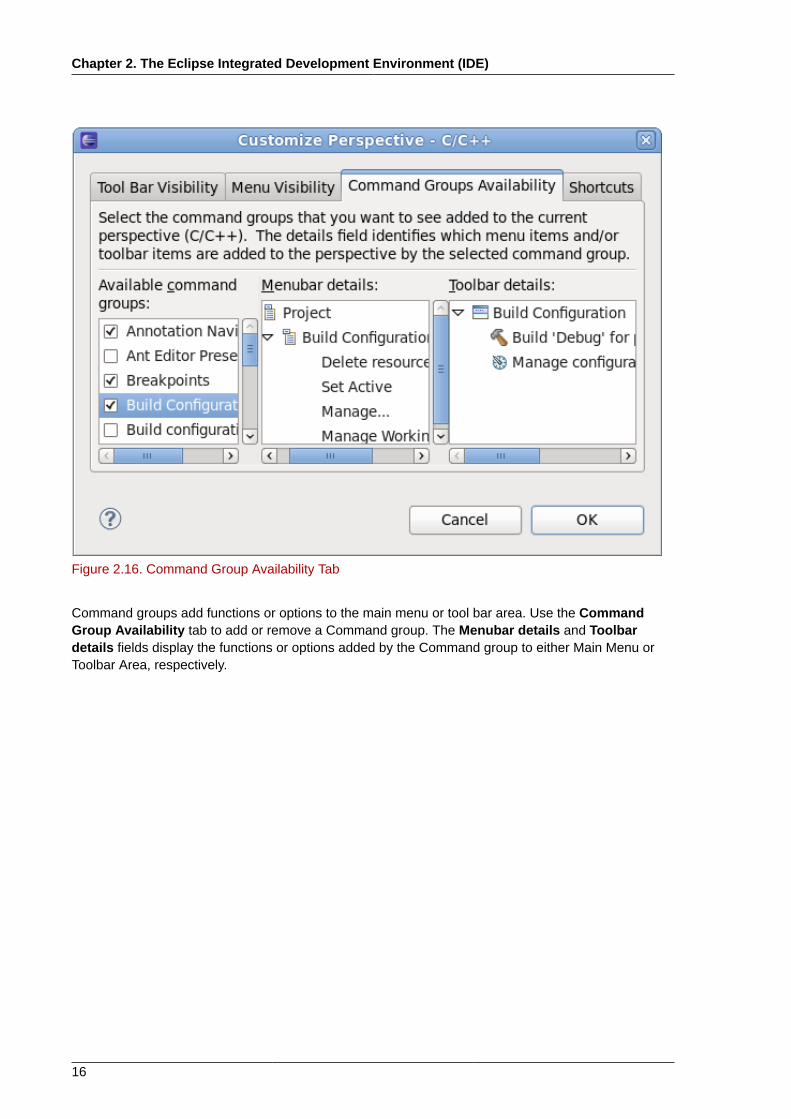
Figure 2.16. Command Group Availability Tab
Command groups add functions or options to the main menu or tool bar area. Use the CommandGroup Availability tab to add or remove a Command group. The Menubar details and Toolbardetails fields display the functions or options added by the Command group to either Main Menu orToolbar Area, respectively.

libhover Plug-in
17
Figure 2.17. Shortcuts Tab
The Shortcuts tab configures what menu items are available under the following submenus:
• File > New
• Window > Open Perspective
• Window > Show View
2.2.2. libhover Plug-inThe libhover plug-in for Eclipse provides plug-and-play hover help support for the GNU C Libraryand GNU C++ Standard Library. This allows developers to refer to existing documentation on glibcand libstdc++ libraries within the Eclipse IDE in a more seamless and convenient manner via hoverhelp and code completion.
For C++ library resources, libhover needs to index the file using the CDT indexer. Indexing parsesthe given file in context of a build; the build context determines where header files come from andhow types, macros, and similar items are resolved. To be able to index a C++ source file, libhoverusually requires you to perform an actual build first, although in some cases it may already knowwhere the header files are located.
The libhover plug-in may need indexing for C++ sources because a C++ member function nameis not enough information to look up its documentation. For C++, the class name and parametersignature of the function is also required to determine exactly which member is being referenced. Thisis because C++ allows different classes to have members of the same name, and even within a class,members may have the same name but with different method signatures.
Chapter 2. The Eclipse Integrated Development Environment (IDE)
18
In addition, C++ also has type definitions and templated classes to deal with. Such informationrequires parsing an entire file and its associated include files; libhover can only do this viaindexing.
C functions, on the other hand, can be referenced in their documentation by name alone. As such,libhover does not need to index C source files in order to provide hover help or code completion.Simply choose an appropriate C header file to be included for a selection.
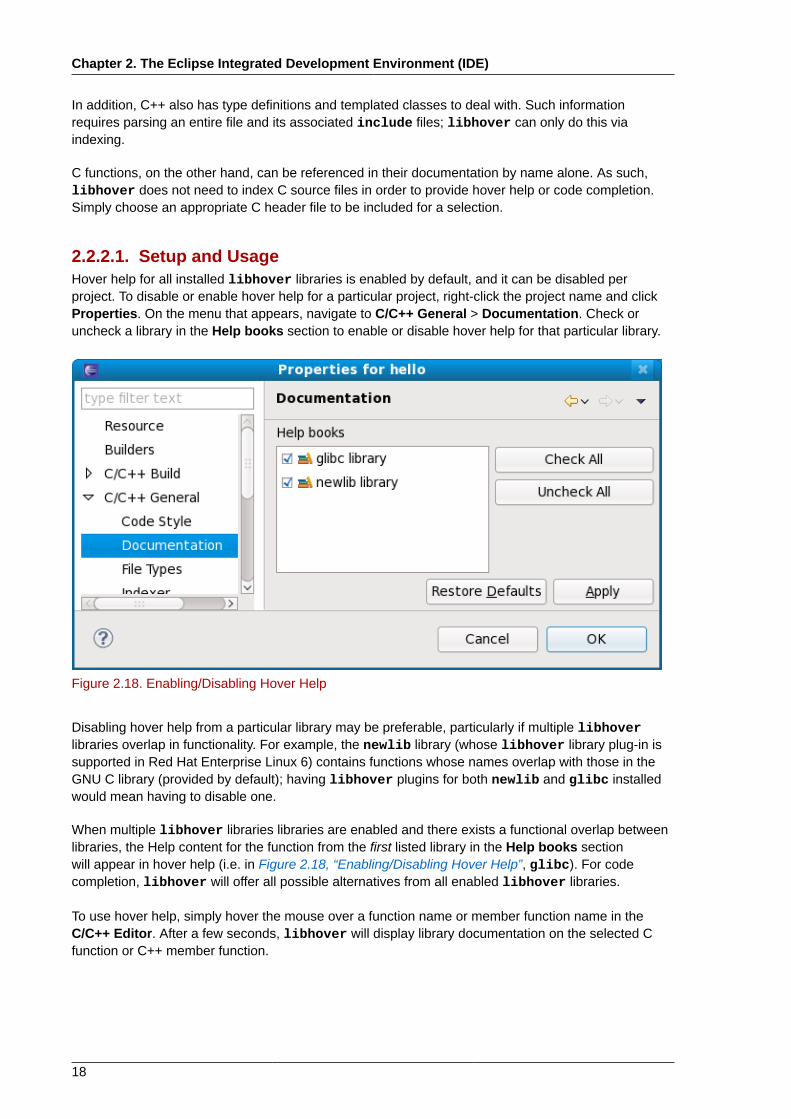
2.2.2.1. Setup and UsageHover help for all installed libhover libraries is enabled by default, and it can be disabled perproject. To disable or enable hover help for a particular project, right-click the project name and clickProperties. On the menu that appears, navigate to C/C++ General > Documentation. Check oruncheck a library in the Help books section to enable or disable hover help for that particular library.
Figure 2.18. Enabling/Disabling Hover Help
Disabling hover help from a particular library may be preferable, particularly if multiple libhoverlibraries overlap in functionality. For example, the newlib library (whose libhover library plug-in issupported in Red Hat Enterprise Linux 6) contains functions whose names overlap with those in theGNU C library (provided by default); having libhover plugins for both newlib and glibc installedwould mean having to disable one.
When multiple libhover libraries libraries are enabled and there exists a functional overlap betweenlibraries, the Help content for the function from the first listed library in the Help books sectionwill appear in hover help (i.e. in Figure 2.18, “Enabling/Disabling Hover Help”, glibc). For codecompletion, libhover will offer all possible alternatives from all enabled libhover libraries.
To use hover help, simply hover the mouse over a function name or member function name in theC/C++ Editor. After a few seconds, libhover will display library documentation on the selected Cfunction or C++ member function.

libhover Plug-in
19
Figure 2.19. Using Hover Help
To use code completion, select a string in the code and press Ctrl+Space. This will display allpossible functions given the selected string; click on a possible function to view its description.
Figure 2.20. Using Code Completion

20

Chapter 3.
21
Libraries and Runtime SupportRed Hat Enterprise Linux 6 supports the development of custom applications in a wide variety ofprogramming languages using proven, industrial-strength tools. This chapter describes the runtimesupport libraries provided in Red Hat Enterprise Linux 6.
3.1. Version InformationThe following table compares the version information for runtime support packages in supportedprogramming languages between Red Hat Enterprise Linux 6 and Red Hat Enterprise Linux 5.
This is not an exhaustive list. Instead, this is a survey of standard language runtimes, and keydependencies for software developed on Red Hat Enterprise Linux 6.
Table 3.1. Language and Runtime Library Versions
Package Name 6 5 4
glibc 2.12 2.5 2.3
libstdc++ 4.4 4.1 3.4
boost 1.41 1.33 1.32
java 1.5 (IBM), 1.6 (IBM,OpenJDK)
1.4, 1.5, and 1.6 1.4
python 2.6 2.4 2.3
php 5.3 5.1 4.3
ruby 1.8 1.8 1.8
httpd 2.2 2.2 2.0
postgresql 8.4 8.1 7.4
mysql 5.1 5.0 4.1
nss 3.12 3.12 3.12
openssl 1.0.0 0.9.8e 0.9.7a
libX11 1.3 1.0
firefox 3.6 3.6 3.6
kdebase 4.3 3.5 3.3
gtk2 2.18 2.10 2.04
3.2. CompatibilityCompatibility specifies the portability of binary objects and source code across different instances of acomputer operating environment. There are two types of compatibility:
Source CompatibilitySource compatibility specifies that code will compile and execute in a consistent and predictableway across different instances of the operating environment. This type of compatibility is definedby conformance with specified Application Programming Interfaces (APIs).
Binary CompatibilityBinary Compatibility specifies that compiled binaries in the form of executables and DynamicShared Objects (DSOs) will run correctly across different instances of the operating environment.

Chapter 3. Libraries and Runtime Support
22
This type of compatibility is defined by conformance with specified Application Binary Interfaces(ABIs).
3.2.1. API CompatibilitySource compatibility enables a body of application source code to be compiled and operate correctlyon multiple instances of an operating environment, across one or more hardware architectures, aslong as the source code is compiled individually for each specific hardware architecture.
Source compatibility is defined by an Application Programming Interface (API), which is a set ofprogramming interfaces and data structures provided to application developers. The programmingsyntax of APIs in the C programming language are defined in header files. These header filesspecify data types and programmatic functions. They are available to programmers for use in theirapplications, and are implemented by the operating system or libraries. The syntax of APIs areenforced at compile time, or when the application source code is compiled to produce executablebinary objectcode.
APIs are classified as:
• De facto standards not formally specified but implied by a particular implementation.
• De jure standards formally specified in standards documentation.
In all cases, application developers should seek to ensure that any behavior they depend on isdescribed in formal API documentation, so as to avoid introducing dependencies on unspecifiedimplementation specific semantics or even introducing dependencies on bugs in a particularimplementation of an API. For example, new releases of the GNU C library are not guaranteed to becompatible with older releases if the old behavior violated a specification.
Red Hat Enterprise Linux by and large seeks to implement source compatibility with a variety ofde jure industry standards developed for Unix operating environments. While Red Hat EnterpriseLinux does not fully conform to all aspects of these standards, the standards documents do providea defined set of interfaces, and many components of Red Hat Enterprise Linux track compliance withthem (particularly glibc, the GNU C Library, and gcc, the GNU C/C++/Java/Fortran Compiler). Thereare and will be certain aspects of the standards which are not implemented as required on Linux.
3.2.2. ABI CompatibilityBinary compatibility enables a single compiled binary to operate correctly on multiple instances ofan operating environment that share a common hardware architecture (whether that architecturesupport is implemented in native hardware or a virtualization layer), but a different underlying softwarearchitecture.
Binary compatibility is defined by an Application Binary Interface (ABI). The ABI is a set of runtimeconventions adhered to by all tools which deal with a compiled binary representation of a program.Examples of such tools include compilers, linkers, runtime libraries, and the operating system itself.The ABI includes not only the binary file formats, but also the semantics of library functions which areused by applications.
3.2.3. PolicyIdeally you should rebuild and repackage your applications for each major release. This will allow youtake advantage of new optimizations in the compiler, as well as new features available in the latesttools.
However, we understand there are times when it is useful to build one set of binaries that can bedeployed on multiple major releases at once. This is especially useful with old code bases that are not

Static Linking
23
compliant to the latest revision of the language standards available in more recent Red Hat EnterpriseLinux releases.
As such, Red Hat advises that you refer to the Red Hat Enterprise Linux 6 Application CompatibilitySpecification4 for guidance. This document outlines Red Hat policy and recommendations regardingbackwards compatibility, particularly for specific packages.
3.2.4. Static LinkingStatic linking is emphatically discouraged for all Red Hat Enterprise Linux releases. Static linkingcauses far more problems than it solves, and should be avoided at all costs.
The main drawback of static linking is that it is only guaranteed to work on the system it was built, andeven so, only until the next release of glibc or libstdc++ (in the case of C++). There is no forward orbackward compatibility with a static build. Furthermore, any security fixes (or general-purpose fixes) insubsequent updates to the libraries will not be avilable unless the affected statically linked executablesare re-linked.
Additional reasons to avoid static linking include:
• Larger memory footprint.
• Slower application startup time.
• Reduced glibc features with static linking.
• Security measures like load address randomization cannot be used.
• Dynamic loading of shared objects outside of glibc is not supported.
The above are only a handful of reasons why static linking should be avoided. For additional reasons,see: Static Linking Considered Harmful5.
3.3. Library and Runtime Details
3.3.1. The GNU C LibraryThe glibc package contains the GNU C Library. This defines all functions specified by the ISO Cstandard, POSIX specific features, some Unix derivatives, and GNU-specific extensions. The mostimportant set of shared libraries in the GNU C Library are the standard C and math libraries.
The GNU C Library defines its functions through specific header files, which you can declare in sourcecode. Each header file contains definitions of a group of related facilities; for example, the stdio.hheader file defines I/O-specific facilities, while math.h defines functions for computing mathematicaloperations.
3.3.1.1. GNU C Library UpdatesThe Red Hat Enterprise Linux 6 version of the GNU C Library features the following improvementsover its Red Hat Enterprise Linux 5 version:
• Added locales, including:
4 https://www.redhat.com/f/pdf/rhel/RHEL6_App_Compatibility_WP.pdf5 http://www.akkadia.org/drepper/no_static_linking.html

Chapter 3. Libraries and Runtime Support
24
• bo_CN
• bo_IN
• shs_CA
• ber_DZ
• ber_MA
• en_NG
• fil_PH
• fur_IT
• fy_DE
• ha_NG
• ig_NG
• ik_CA
• iu_CA
• li_BE
• li_NL
• nds_DE
• nds_NL
• pap_AN
• sc_IT
• tk_TM
• Added new interfaces, namely:
• preadv
• preadv64
• pwritev
• pwritev64
• malloc_info
• mkostemp
• mkostemp64
• Added new Linux-specific interfaces, namely:
• epoll_pwait

The GNU C Library
25
• sched_getcpu
• accept4
• fallocate
• fallocate64
• inotify_init1
• dup3
• epoll_create1
• pipe2
• signalfd
• eventfd
• eventfd_read
• eventfd_write
• Added new checking functions, namely:
• asprintf
• dprintf
• obstack_printf
• vasprintf
• vdprintf
• obstack_vprintf
• fread
• fread_unlocked
• open*
• mq_open
For a more detailed list of updates to the GNU C Library, refer to /usr/share/doc/glibc-version/NEWS . All changes as of version 2.6 apply to the GNU C Library in Red HatEnterprise Linux 6. Some of these changes have also been backported to Red Hat Enterprise Linux 5versions of glibc.
3.3.1.2. GNU C Library DocumentationThe GNU C Library is fully documented in the GNU C Library manual; to access this manual locally,install glibc-devel and run info libc. An upstream version of this book is also available here:
http://www.gnu.org/software/libc/manual/html_mono/libc.html
Chapter 3. Libraries and Runtime Support
26
3.3.2. The GNU C++ Standard LibraryThe libstdc++ package contains the GNU C++ Standard Library, which is an ongoing project toimplement the ISO 14882 Standard C++ library.
Installing the libstdc++ package will provide just enough to satisfy link dependencies (i.e. onlyshared library files). To make full use of all available libraries and header files for C++ development,you must install libstdc++-devel as well. The libstdc++-devel package also contains a GNU-specific implementation of the Standard Template Library (STL).
As the C++ language and runtime implementation has remained stable throughout Red Hat EnterpriseLinuxes 4, 5, and 6, no compatibility libraries are needed for libstdc++. However, combatabilitylibraries compat-libstdc++-296 for Red Hat Enterprise Linux 2.1 and compat-libstdc++-33for Red Hat Enterprise Linux 3 are provided for support.
3.3.2.1. GNU C++ Standard Library UpdatesThe Red Hat Enterprise Linux 6 version of the GNU C++ Standard Library features the followingimprovements over its Red Hat Enterprise Linux 5 version:
• Added support for elements of ISO C++ TR1, namely:
• <tr1/array>
• <tr1/complex>
• <tr1/memory>
• <tr1/functional>
• <tr1/random>
• <tr1/regex>
• <tr1/tuple>
• <tr1/type_traits>
• <tr1/unordered_map>
• <tr1/unordered_set>
• <tr1/utility>
• <tr1/cmath>
• Added support for elements of the upcoming ISO C++ standard, C++0x. These elements include:
• <array>
• <chrono>
• <condition_variable>
• <forward_list>
• <functional>
• <initalizer_list>

The GNU C++ Standard Library
27
• <mutex>
• <random,
• <ratio>
• <regex>
• <system_error>
• <thread>
• <tuple>
• <type_traits
• <unordered_map>
• <unordered_set>
• Added support for the -fvisibility command.
• Added the following extensions:
• __gnu_cxx::typelist
• __gnu_cxx::throw_allocator
For more information about updates to libstdc++ in Red Hat Enterprise Linux 6, refer to the C++Runtime Library section of the following documents:
• GCC 4.2 Release Series Changes, New Features, and Fixes: http://gcc.gnu.org/gcc-4.2/changes.html
• GCC 4.3 Release Series Changes, New Features, and Fixes: http://gcc.gnu.org/gcc-4.3/changes.html
• GCC 4.4 Release Series Changes, New Features, and Fixes: http://gcc.gnu.org/gcc-4.4/changes.html
3.3.2.2. GNU C++ Standard Library DocumentationTo use the man pages for library components, install the libstdc++-docs package. This will provideman page information for nearly all resources provided by the library; for example, to view informationabout the vector container, use its fully-qualified component name:
man std::vector
This will display the following information (abbreviated):
std::vector(3) std::vector(3)
NAME std::vector -
A standard container which offers fixed time access to individual elements in any order.
Chapter 3. Libraries and Runtime Support
28
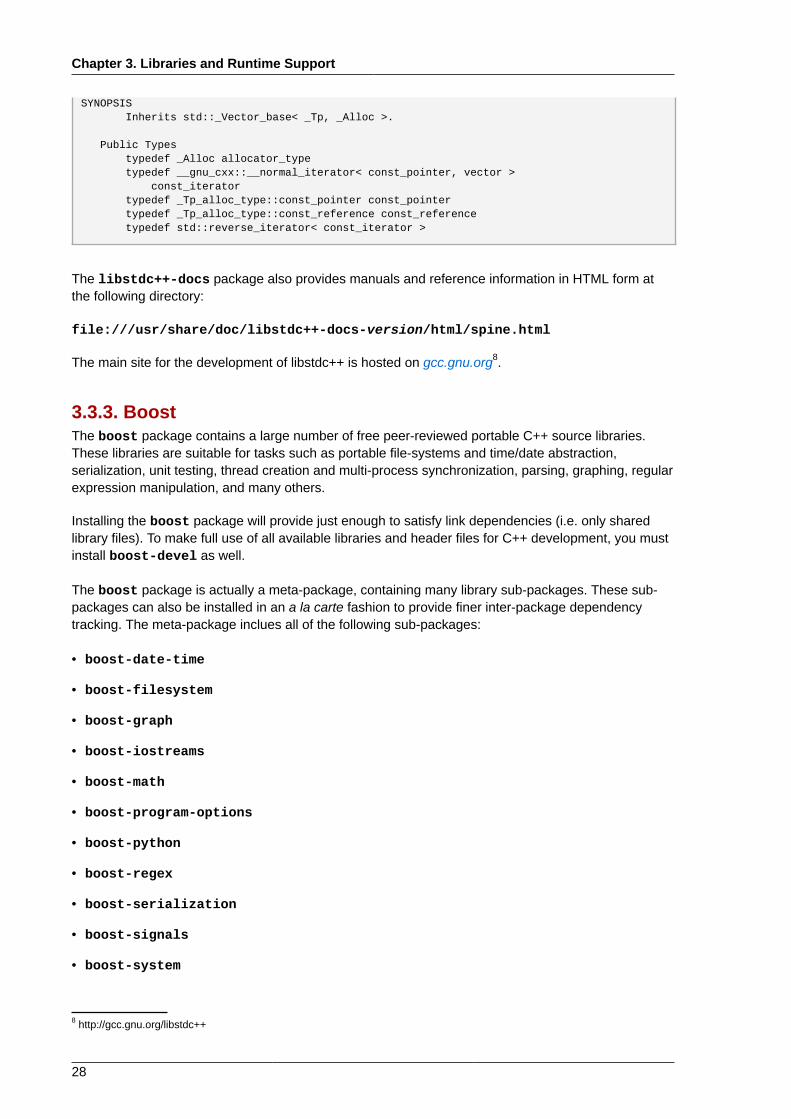
SYNOPSIS Inherits std::_Vector_base< _Tp, _Alloc >.
Public Types typedef _Alloc allocator_type typedef __gnu_cxx::__normal_iterator< const_pointer, vector > const_iterator typedef _Tp_alloc_type::const_pointer const_pointer typedef _Tp_alloc_type::const_reference const_reference typedef std::reverse_iterator< const_iterator >
The libstdc++-docs package also provides manuals and reference information in HTML form atthe following directory:
file:///usr/share/doc/libstdc++-docs-version/html/spine.html
The main site for the development of libstdc++ is hosted on gcc.gnu.org8.
3.3.3. BoostThe boost package contains a large number of free peer-reviewed portable C++ source libraries.These libraries are suitable for tasks such as portable file-systems and time/date abstraction,serialization, unit testing, thread creation and multi-process synchronization, parsing, graphing, regularexpression manipulation, and many others.
Installing the boost package will provide just enough to satisfy link dependencies (i.e. only sharedlibrary files). To make full use of all available libraries and header files for C++ development, you mustinstall boost-devel as well.
The boost package is actually a meta-package, containing many library sub-packages. These sub-packages can also be installed in an a la carte fashion to provide finer inter-package dependencytracking. The meta-package inclues all of the following sub-packages:
• boost-date-time
• boost-filesystem
• boost-graph
• boost-iostreams
• boost-math
• boost-program-options
• boost-python
• boost-regex
• boost-serialization
• boost-signals
• boost-system
8 http://gcc.gnu.org/libstdc++

Boost
29
• boost-test
• boost-thread
• boost-wave
Not included in the meta-package are packages for static linking or packages that depend on theunderlying Message Passing Interface (MPI) support.
MPI support is provided in two forms: one for the default Open MPI implementation 10 , and another forthe alternate MPICH2 implementation. The selection of the underlying MPI library in use is up to theuser and depends on specific hardware details and user preferences. For more details, please consulthttps://fedoraproject.org/wiki/Packaging:MPI for information on MPI Packaging conventions. Pleasenote that these packages can be installed in parallel, as installed files have unique directory locations.
For Open MPI:
• boost-openmpi
• boost-openmpi-devel
• boost-graph-openmpi
• boost-openmpi-python
For MPICH2:
• boost-mpich2
• boost-mpich2-devel
• boost-graph-mpich2
• boost-mpich2-python
If static linkage cannot be avoided, the boost-static package will install the necessary staticlibraries. Both thread-enabled and single-threaded libraries are provided.
3.3.3.1. Boost UpdatesThe Red Hat Enterprise Linux 6 version of Boost features many packaging improvements and newfeatures.
Several aspects of the boost package have changed. As noted above, the monolithic boostpackage has been augmented by smaller, more discrete sub-packages. This allows for more controlof dependencies by users, and for smaller binary packages when packaging a custom application thatuses Boost.
In addition, both single-threaded and multi-threaded versions of all libraries are packaged. The multi-threaded versions include the mt suffix, as per the usual Boost convention.
Boost also features the following new libraries:
• Foreach
10 MPI support is not available on IBM System Z machines (where Open MPI is not available).
Chapter 3. Libraries and Runtime Support
30
• Statechart
• TR1
• Typeof
• Xpressive
• Asio
• Bitmap
• Circular Buffer
• Function Types
• Fusion
• GIL
• Interprocess
• Intrusive
• Math/Special Functions
• Math/Statistical Distributions
• MPI
• System
• Accumulators
• Exception
• Units
• Unordered
• Proto
• Flyweight
• Scope Exit
• Swap
• Signals2
• Property Tree
Many of the existing libraries have been improved, bug-fixed, and otherwise enhanced.
3.3.3.2. Boost DocumentationThe boost-doc package provides manuals and reference information in HTML form located in thefollowing directory:
file:///usr/share/doc/boost-doc-version/index.html

Qt
31
The main site for the development of Boost is hosted on boost.org11.
3.3.4. QtThe qt package provides the Qt (pronounced "cute") cross-platform application developmentframework used in the development of GUI programs. Aside from being a popular "widget toolkit", Qtis also used for developing non-GUI programs such as console tools and servers. Qt was used in thedevelopment of notable projects such as Google Earth, KDE, Opera, OPIE, VoxOx, Skype, VLC mediaplayer and VirtualBox. It is produced by Nokia's Qt Development Frameworks division, which cameinto being after Nokia's acquisition of the Norwegian company Trolltech, the original producer of Qt, onJune 17, 2008.
Qt uses standard C++ but makes extensive use of a special pre-processor called the Meta ObjectCompiler (MOC) to enrich the language. Qt can also be used in other programming languages vialanguage bindings. It runs on all major platforms and has extensive internationalization support. Non-GUI Qt features include SQL database access, XML parsing, thread management, network support,and a unified cross-platform API for file handling.
Distributed under the terms of the GNU Lesser General Public License (among others), Qt is freeand open source software. The Red Hat Enterprise Linux 6 version of Qt supports a wide range ofcompilers, including the GCC C++ compiler and the Visual Studio suite.
3.3.4.1. Qt UpdatesSome of the improvements the Red Hat Enterprise Linux 6 version of Qt include:
• Advanced user experience
• Advanced Graphics Effects:options for opacity, drop-shadows, blur, colorization, and othersimilar effects
• Animation and State Machine:create simple or complex animations without the hassle ofmanaging complex code
• Gesture and multi-touch support
• Support for new platforms
• Windows 7, Mac OSX 10.6, and other desktop platforms are now supported
• Added support for mobile development; Qt is optimized for the upcoming Maemo 6 platform,and will soon be ported to Maemo 5. In addition, Qt now supports the Symbian platform, withintegration for the S60 framework.
• Added support for Real-Time Operating Systems such as QNX and VxWorks
• Improved performance, featuring added support for hardware-accelerated rendering (along withother rendering updates)
• Updated cross-platform IDE
For more details on updates to Qt included in Red Hat Enterprise Linux 6, refer to the following links:
• http://doc.qt.nokia.com/4.6/qt4-6-intro.html
11 http://boost.org
Chapter 3. Libraries and Runtime Support
32
• http://doc.qt.nokia.com/4.6/qt4-intro.html
3.3.4.2. Qt CreatorQt Creator is a cross-platform IDE tailored to the needs of Qt developers. It includes the followinggraphical tools:
• An advanced C++ code editor
• Integrated GUI layout and forms designer
• Project and build management tools
• Integrated, context-sensitive help system
• Visual debugger
• Rapid code navigation tools
For more information about Qt Creator, refer to the following link:
http://qt.nokia.com/products/appdev/developer-tools/developer-tools#qt-tools-at-a
3.3.4.3. Qt Library DocumentationThe qt-doc package provides HTML manuals and references located in /usr/share/doc/qt4/html/. This package also provides the Qt Reference Documentation, which is an excellent startingpoint for development within the Qt framework.
You can also install further demos and examples from qt-demos and qt-examples. To get anoverview of the capabilities of the Qt framework, refer to /usr/bin/qtdemo-qt4 (provided by qt-demos).
For more information on the development of Qt, refer to the following online resources:
• Qt Developer Blogs: http://labs.trolltech.com/blogs/
• Qt Developer Zone: http://qt.nokia.com/developer/developer-zone
• Qt Mailing List: http://lists.trolltech.com/
3.3.5. KDE Development FrameworkThe kdelibs-devel package provides the KDE libraries, which build on Qt to provide a frameworkfor making application development easier. The KDE development framework also helps provideconsistency accross the KDE desktop environment.
3.3.5.1. KDE4 ArchitectureThe KDE development framework's architecture in Red Hat Enterprise Linux 6 uses KDE4, which isbuilt on the following technologies:
PlasmaPlasma replaces KDesktop in KDE4. Its implementation is based on the Qt Graphics ViewFramework, which was introduced in Qt 4.2. For more information about Plasma, refer to http://techbase.kde.org/Development/Architecture/KDE4/Plasma.
KDE Development Framework
33
SonnetSonnet is a multilingual spell-checking application that supports automatic language detection,primary/backup dictionaries, and other useful features. It replaces kspell2 in KDE4.
KIOThe KIO library provides a framework for network-transparent file handling, allowing users toeasily access files through network-transparent protocols. It also helps provides standard filedialogs.
KJS/KHTMLKJS and KHTML are fully-fledged JavaScript and HTML engines used by different applicationsnative to KDE4 (such as konqueror).
SolidSolid is a hardware and network awareness framework that allows you to develop applicationswith hardware interaction features. Its comprehensive API provides the necessary abstractionto support cross-platform application development. For more information, refer to http://techbase.kde.org/Development/Architecture/KDE4/Solid.
PhononPhonon is a multimedia framework that helps you develop applications with multimediafunctionalities. It facilitates the usage of media capabilities within KDE. For more information, referto http://techbase.kde.org/Development/Architecture/KDE4/Phonon.
TelepathyTelepathy provides a real-time communication and collaboration framework withinKDE4. Its primary function is to tighten integration between different componentswithin KDE. For a brief overview on the project, refer to http://community.kde.org/Real-Time_Communication_and_Collaboration.
AkonadiAkonadi provides a framework for centralizing storage of Parallel Infrastructure Management(PIM) components. For more information, refer to http://techbase.kde.org/Development/Architecture/KDE4/Akonadi.
Online Help within KDE4KDE4 also features an easy-to-use Qt-based framework for adding online help capabilities toapplications. Such capabilities include tooltips, hover-help information, and khelpcenter manuals.For a brief overview on online help within KDE4, refer to http://techbase.kde.org/Development/Architecture/KDE4/Providing_Online_Help.
KXMLGUIKXMLGUI is a framework for designing user interfaces using XML. This framework allows youto design UI elements based on "actions" (defined by the developer) without having to revisesource code. For more information, refer to http://developer.kde.org/documentation/library/kdeqt/kde3arch/xmlgui.html.
StrigiStrigi is a desktop search daemon compatible with many desktop environments and operatingsystems. It uses its own jstream system which allows for deep indexing of files. For moreinformation on the development of Strigi, refer to http://www.vandenoever.info/software/strigi/.

Chapter 3. Libraries and Runtime Support
34
KNewStuff2KNewStuff2 is a collaborative data sharing library used by many KDE4 applications. For moreinformation, refer to http://techbase.kde.org/Projects/KNS2.
3.3.5.2. kdelibs DocumentationThe kdelibs-apidocs package provides HTML documentation for the KDE development frameworkin /usr/share/doc/HTML/en/kdelibs4-apidocs/. The following links also provide details onKDE-related programming tasks:
• http://techbase.kde.org/
• http://techbase.kde.org/Development/Tutorials
• http://techbase.kde.org/Development/FAQs
• http://api.kde.org
3.3.6. PythonThe python package adds support for the Python programming language. This package provides theobject and cached bytecode files needed to enable runtime support for basic Python programs. It alsocontains the python interpreter and the pydoc documentation tool. The python-devel packagecontains the libraries and header files needed for developing Python extensions.
Red Hat Enterprise Linux also ships with numerous python-related packages. By convention, thenames of these packages have a python prefix or suffix. Such packages are either library extensionsor python bindings to an existing library. For instance, dbus-python is a Python language binding forD-Bus.
Note that both cached bytecode (*.pyc/*.pyo files) and compiled extension modules (*.so files) areincompatible between Python 2.4 (used in Red Hat Enterprise Linux 5) and Python 2.6 (used in RedHat Enterprise Linux 6). As such, you will need to rebuild any extension modules you use that are notpart of Red Hat Enterprise Linux.
3.3.6.1. Python UpdatesThe Red Hat Enterprise Linux 6 version of Python features various language changes. For informationabout these changes, refer to the following project resources:
• What's New in Python 2.5: http://docs.python.org/whatsnew/2.5.html
• What's New in Python 2.6: http://docs.python.org/whatsnew/2.6.html
Both resources also contain advice on porting code developed using previous Python versions.
3.3.6.2. Python DocumentationFor more information about Python, refer to man python. You can also install python-docs, whichprovides HTML manuals and references in the following location:
file:///usr/share/doc/python-docs-version/html/index.html
For details on library and language components, use pydoc component_name. For example, pydocmath will display the following information about the math Python module:

Java
35
Help on module math:
NAME math
FILE /usr/lib64/python2.6/lib-dynload/mathmodule.so
DESCRIPTION This module is always available. It provides access to the mathematical functions defined by the C standard.
FUNCTIONS acos[...] acos(x) Return the arc cosine (measured in radians) of x.
acosh[...] acosh(x) Return the hyperbolic arc cosine (measured in radians) of x.
asin(...) asin(x) Return the arc sine (measured in radians) of x.
asinh[...] asinh(x) Return the hyperbolic arc sine (measured in radians) of x.
The main site for the Python development project is hosted on python.org13.
3.3.7. JavaThe java-1.6.0-openjdk package adds support for the Java programming language. Thispackage provides the java interpreter. The java-1.6.0-openjdk-devel package contains thejavac compiler, as well as the libraries and header files needed for developing Java extensions.
Red Hat Enterprise Linux also ships with numerous java-related packages. By convention, the namesof these packages have a java prefix or suffix.
3.3.7.1. Java DocumentationFor more information about Java, refer to man java. Some associated utilities also have their ownrespective man pages.
You can also install other Java documentation packages for more details about specific Java utilities.By convention, such documentation packages have the javadoc suffix (e.g. dbus-java-javadoc).
The main site for the development of Java is hosted on http://www.java.com. The main site for thelibrary runtime of Java is hosted on http://icedtea.classpath.org.
13 http://python.org

Chapter 3. Libraries and Runtime Support
36
3.3.8. RubyThe ruby package provides the Ruby interpreter and adds support for the Ruby programminglanguage. The ruby-devel package contains the libraries and header files needed for developingRuby extensions.
Red Hat Enterprise Linux also ships with numerous ruby-related packages. By convention, thenames of these packages have a ruby or rubygem prefix or suffix. Such packages are either libraryextensions or Ruby bindings to an existing library. For instance, ruby-dbus is a Ruby languagebinding for D-Bus.
Examples of ruby-related packages include:
• ruby-flexmock
• rubygem-flexmock
• rubygems
• ruby-irb
• ruby-libguestfs
• ruby-libs
• ruby-qmf
• ruby-qpid
• ruby-rdoc
• ruby-ri
• ruby-saslwrapper
• ruby-static
• ruby-tcltk
For information about updates to the Ruby language in Red Hat Enterprise Linux 6, refer to thefollowing resources:
• file:///usr/share/doc/ruby-version/NEWS
• file:///usr/share/doc/ruby-version/NEWS-version
3.3.8.1. gem2rpmWhen packaging architecture-dependent gems, the gem2rpm tool may not work as expected on a RedHat Enterprise Linux 6 default ruby environment. For information on how to work around this, refer tohttp://fedoraproject.org/wiki/Packaging/Ruby#Ruby_Gems.
3.3.8.2. Ruby DocumentationFor more information about Ruby, refer to man ruby. You can also install ruby-docs, which providesHTML manuals and references in the following location:
file:///usr/share/doc/ruby-docs-version/
Perl
37
The main site for the development of Ruby is hosted on http://www.ruby-lang.org. The http://www.ruby-doc.org site also contains Ruby documentation.
3.3.9. PerlThe perl package adds support for the Perl programming language. This package provides Perl coremodules, the Perl Language Interpreter, and the PerlDoc tool.
Red Hat also provides various perl modules in package form; these packages are named with theperl-* prefix. These modules provide stand-alone applications, language extensions, Perl libraries,and external library bindings.
3.3.9.1. Perl UpdatesRed Hat Enterprise Linux 6.0 ships with perl-5.10.1. If you are running an older system, rebuild oralter external modules and applications accordingly in order to ensure optimum performance.
For a full list of the differences between the Perl versions refer to the following documents:
• Perl 5.10 delta: http://perldoc.perl.org/perl5100delta.html
• Perl 5.10.1 delta: http://perldoc.perl.org/perl5101delta.html
3.3.9.2. InstallationPerl's capabilities can be extended by installing additional modules. These modules come in thefollowing forms:
Official Red Hat RPMThe official module packages can be installed with yum or rpm from the Red Hat Enterprise Linuxrepositories. They are installed to /usr/share/perl5 and either /usr/lib/perl5 for 32bitarchitectures or /usr/lib64/perl5 for 64bit architectures.
Modules from CPANUse the cpan tool provided by the perl-CPAN package to install modules directly from the CPANwebsite. They are installed to /usr/local/share/perl5 and either /usr/local/lib/perl5for 32bit architectures or /usr/local/lib64/perl5 for 64bit architectures.
Third party module packageThird party modules are installed to /usr/share/perl5/vendor_perl and either /usr/lib/perl5/vendor_perl for 32bit architectures or /usr/lib64/perl5/vendor_perl for 64bitarchitectures.
Custom module package / manually installed moduleThese should be placed in the same directories as third party modules. That is, /usr/share/perl5/vendor_perl and either /usr/lib/perl5/vendor_perl for 32bit architectures or /usr/lib64/perl5/vendor_perl for 64bit architectures.
Warning
If an official version of a module is already installed, installing its non-official version can createconflicts in the /usr/share/man directory.

Chapter 3. Libraries and Runtime Support
38
3.3.9.3. Perl DocumentationThe perldoc tool provides documentation on language and core modules. To learn more about amodule, use perldoc module_name. For example, perldoc CGI will display the following informationabout the CGI core module:
NAME CGI - Handle Common Gateway Interface requests and responses
SYNOPSIS use CGI;
my $q = CGI->new;
[...]
DESCRIPTION CGI.pm is a stable, complete and mature solution for processing and preparing HTTP requests and responses. Major features including processing form submissions, file uploads, reading and writing cookies, query string generation and manipulation, and processing and preparing HTTP headers. Some HTML generation utilities are included as well.
[...]
PROGRAMMING STYLE There are two styles of programming with CGI.pm, an object-oriented style and a function-oriented style. In the object-oriented style you create one or more CGI objects and then use object methods to create the various elements of the page. Each CGI object starts out with the list of named parameters that were passed to your CGI script by the server.
[...]
For details on Perl functions, use perldoc -f function_name. For example, perldoc -f split wildisplay the following indormation about the split function:
split /PATTERN/,EXPR,LIMITsplit /PATTERN/,EXPRsplit /PATTERN/split Splits the string EXPR into a list of strings and returns that list. By default, empty leading fields are preserved, and empty trailing ones are deleted. (If all fields are empty, they are considered to be trailing.)
In scalar context, returns the number of fields found. In scalar and void context it splits into the @_ array. Use of split in scalar and void context is deprecated, however, because it clobbers your subroutine arguments.
If EXPR is omitted, splits the $_ string. If PATTERN is also omitted, splits on whitespace (after skipping any leading whitespace). Anything matching PATTERN is taken to be a delimiter separating the fields. (Note that the delimiter may be longer than one character.)
[...]
Current PerlDoc documentation can be found on perldoc.perl.org19.
Core and external modules are documented on the Comprehensive Perl Archive Network20.
19 http://perldoc.perl.org/20 http://www.cpan.org/
Chapter 4.
39
Compiling and BuildingRed Hat Enterprise Linux 6 includes many packages used for software development, inluding tools forcompiling and building source code. This chapter discusses several of these packages and tools usedto compile source code.
4.1. GNU Compiler Collection (GCC)The GNU Compiler Collection (GCC) is a set of tools for compiling a variety of programminglanguages (including C, C++, ObjectiveC,ObjectiveC++, Fortran, and Ada) into highly optimizedmachine code. These tools include various compilers (like gcc and g++), run-time libraries (likelibgcc, libstdc++, libgfortran, and libgomp), and miscellaneous other utilities.
4.1.1. GCC Status and FeaturesGCC for Red Hat Enterprise Linux 6 is based on the 4.4.x release series and includes several bugfixes, enhancements, and backports from upcoming releases (including the GCC 4.5). However, GCC4.5 was not considered sufficiently mature for an enterprise distribution when RHEL6 features werefrozen.
This standardization means that as updates to the 4.4 series become available (4.4.1, 4.4.2, ect),they will be incorporated into the compiler included with RHEL6 as updates. Red Hat may importadditional backports and enhancements from upcoming releases outside the 4.4 series that won'tbreak compatibility within the Enterprise Linux release. Occassionally, code that was not compliantto standards may fail to compile or its functionality may change in the process of fixing bugs ormaintaining standards compliant behavior.
Since the previous release of Red Hat Enterprise Linux, GCC has had three major releases: 4.2.x,4.3.x, and 4.4.x. A selective summary of the expansive list of changes follows.
• The inliner, dead code elimination routines, compile time, and memory usage codes are nowimproved. This release also features a new register allocator, instruction scheduler, and softwarepipeliner.
• Version 3.0 of the OpenMP specification is now supported for the C, C++, and Fortran compilers.
• Experimental support for the upcoming ISO C++ standard (C++0x) is included. This has supportfor auto/inline namespaces, character types, and scoped enumerations. To enable this, use thecompiler options -std=c++0x (which disables GNU extensions) or -std=gnu++0x.
For a more detailed list of the status of C++0x improvements, refer to:
http://gcc.gnu.org/gcc-4.4/cxx0x_status.html
• GCC now incorporates the Variable Tracking at Assignments (VTA) infrastructure. This allows GCCto better track variables during optimizations so that it can produce improved debugging information(i.e. DWARF) for the Gnome Debugger, SystemTap, and other tools. For a brief overview of VTA,refer to Section 5.3, “Variable Tracking at Assignments”.
With VTA you can debug optimized code drastically better than with previous GCC releases, andyou do not have to compile with -O0 to provide a better debugging experience.
• Fortran 2008 is now supported, while support for Fortran 2003 is extended.
For a more detailed list of improvements in GCC, refer to:

Chapter 4. Compiling and Building
40
• Updates in the 4.2 Series: http://gcc.gnu.org/gcc-4.2/changes.html
• Updates in the 4.3 Series: http://gcc.gnu.org/gcc-4.3/changes.html
• Updates in the 4.4 Series: http://gcc.gnu.org/gcc-4.4/changes.html
In addition to the changes introduced via the GCC 4.4 rebase, the Red Hat Enterprise Linux 6 versionof GCC also features several fixes and enhancements backported from upstream sources (i.e. version4.5 and beyond). These improvements include the following (among others):
• Improved DWARF3 debugging for debugging optimized C++ code.
• Fortran optimization improvements.
• More accurate instruction length information for ix86, Intel 64 and AMD64, and s390.
• Intel Atom support
• POWER7 support
• C++ raw string support, u/U/u8 string literal support
4.1.2. Language CompatibilityApplication Binary Interfaces specified by the GNU C, C++, Fortran and Java Compiler include:
• Calling conventions. These specify how arguments are passed to functions and how results arereturned from functions.
• Register usage conventions. These specify how processor registers are allocated and used.
• Object file formats. These specify the representation of binary object code.
• Size, layout, and alignment of data types. These specify how data is laid out in memory.
• Interfaces provided by the runtime environment. Where the documented semantics do not changefrom one version to another they must be kept available and use the same name at all times.
The default system C compiler included with Red Hat Enterprise Linux 6 is largely compatible with theC99 ABI standard. Deviations from the C99 standard in GCC 4.4 are tracked online3.
In addition to the C ABI, the Application Binary Interface for the GNU C++ Compiler specifies thebinary interfaces needed to support the C++ language, such as:
• Name mangling and demangling
• Creation and propagation of exceptions
• Formatting of run-time type information
• Constructors and destructors
• Layout, alignment, and padding of classes and derived classes
• Virtual function implementation details, such as the layout and alignment of virtual tables
3 http://gcc.gnu.org/gcc-4.4/c99status.html

Language Compatibility
41
The default system C++ compiler included with Red Hat Enterprise Linux 6 conforms to the C++ ABIdefined by the Itanium C++ ABI (1.86)4.
Although every effort has been made to keep each version of GCC compatibile with previous releases,some incompatibilities do exist.
ABI incompatibilities between RHEL6 and RHEL5The following is a list of known incompatibilities between the Red Hat Enterprise Linux 6 and 5toolchains.
• Passing/returning structs with flexible array members by value changed in some cases on Intel 64and AMD64.
• Passing/returning of unions with long double members by value changed in some cases on Intel 64and AMD64.
• Passing/returning structs with complex float member by value changed in some cases on Intel 64and AMD64.
• Passing of 256-bit vectors on x86, Intel 64 and AMD64 platforms changed when -mavx is used.
• There have been multiple changes in passing of _Decimal{32,64,128} types and aggregatescontaining those by value on several targets.
• Packing of packed char bitfields changed in some cases.
ABI incompatibilities between RHEL5 and RHEL4The following is a list of known incompatibilities between the Red Hat Enterprise Linux 5 and 4toolchains.
• There have been changes in the library interface specified by the C++ ABI for thread-safeinitialization of function-scope static variables.
• On Intel 64 and AMD64, the medium model for building applications where data segmentexceeds 4GB, was redesigned to match the latest ABI draft at the time. The ABI change results inincompatibility among medium model objects.
The compiler flag -Wabi can be used to get diagnostics indicating where these constructs appear insource code, though it will not catch every single case. This flag is especially useful for C++ code towarn whenever the compiler generates code that is known to be incompatible with the vendor-neutralC++ ABI.
Excluding the incompatibilities listed above, the GCC C and C++ language ABIs are mostly ABIcompatible. The vast majority of source code will not encounter any of the known issues, and can beconsidered compatible.
Compatible ABIs allow the objects created by compiling source code to be portable to other systems.In particular, for Red Hat Enterprise Linux, this allows for upward compatibility. Upward compatibility isdefined as the ability to link shared libraries and objects, created using a version of the compilers in aparticular RHEL release, with no problems. This includes new objects compiled on subsequent RHELreleases.
4 http://www.codesourcery.com/cxx-abi/
Chapter 4. Compiling and Building
42
The C ABI is considered to be stable, and has been so since at least RHEL3 (again, barring anyincompatibilities mentioned in the above lists). Libraries built on RHEL3 and later can be linked toobjects created on a subsequent environment (RHEL4, RHEL5, and RHEL6).
The C++ ABI is considered to be stable, but less stable than the C ABI, and only as of RHEL4(corresponding to GCC version 3.4 and above.). As with C, this is only an upward compatibility.Libraries built on RHEL4 and above can be linked to objects created on a subsequent environment(RHEL5, and RHEL6).
To force GCC to generate code compatible with the C++ ABI in RHEL releases prior to RHEL4, somedevelopers have used the -fabi-version=1 option. This practice is not recommended. Objectscreated this way are indistinguishable from objects conforming to the current stable ABI, and can belinked (incorrectly) amongst the different ABIs, especially when using new compilers to generate codeto be linked with old libraries that were built with tools prior to RHEL4.
Warning
The above incompatibilities make it incredibly difficult to maintain ABI shared library sanitybetween releases, especially if when developing custom libraries with multiple dependenciesoutside of the core libraries. Therefore, if shared libraries are developed, it is highly recommendthat a new version is built for each Red Hat Enterprise Linux release.
4.1.3. Object Compatibility and InteroperabilityTwo items that are important are the changes and enhancements in the underlying tools used by thecompiler, and the compatibility between the different versions of a language's compiler.
Changes and new features in tools like ld (distributed as part of the binutils package) or in thedynamic loader (ld.so, distributed as part of the glibc package) can subtly change the object filesthat the compiler produces. These changes mean that object files moving to the current release of RedHat Enterprise Linux from previous releases may loose functionality, behave differently at runtime, orotherwise interoperate in a diminished capacity. Known problem areas include:
• ld --build-id
In RHEL6 this is passed to ld by default, whereas RHEL5 ld doesn't recognize it.
• as .cfi_sections support
In RHEL6 this directive allows .debug_frame, .eh_frame or both to be emitted from .cfi*directives. In RHEL5 only .eh_frame is emitted.
• as, ld, ld.so, and gdb STB_GNU_UNIQUE and %gnu_unique_symbol support
In RHEL6 more debug information is generated and stored in object files. This information relieson new features detailed in the DWARF standard, and also on new extensions not yet standardized.In RHEL5, tools like as, ld, gdb, objdump, and readelf may not be prepared for this newinformation and may fail to interoperate with objects created with the newer tools. In addition,RHEL5 produced object files do not support these new features; these object files may be handledby RHEL6 tools in a sub-optimal manner.
An outgrowth of this enhanced debug information is that the debuginfo packages that ship withsystem libraries allow you to do useful source level debugging into system libraries if they areinstalled. Refer to Section 5.1, “Installing Debuginfo Packages” for more information on debuginfopackages.

Backwards Compatibility Packages
43
Object file changes, such as the ones listed above, may interfere with the portable use of prelink.
4.1.4. Backwards Compatibility PackagesSeveral packages are provided to serve as an aid for those moving source code or executables fromolder versions of Red Hat Enterprise Linux to the current release. These packages are intended tobe used as a temporary aid in transitioning sources to newer compilers with changed behavior, oras a convenient way to otherwise isolate differences in the system environment from the compileenvironment.
Note
Please be advised that Red Hat may remove these packages in future Red Hat Enterprise Linuxreleases.
The following packages provide compatibility tools for compiling Fortran or C++ source code on thecurrent release of Red Hat Enterprise Linux 6 as if one was using the older compilers on Red HatEnterprise Linux 4:
• compat-gcc-34
• compat-gcc-34-c++
• compat-gcc-34-g77
The following package provides a compatibility runtime library for Fortran exectuables compiled onRed Hat Enterprise Linux 5 to run without recompilation on the current release of Red Hat EnterpriseLinux 6:
• compat-libgfortran-41
Please note that backwards compatibility library packages are not provided for all supported systemlibraries, just the system libraries pertaining to the compiler and the C/C++ standard libraries.
For more information about backwards compatibility library packages, refer to the ApplicationCompatibility section of the Red Hat Enterprise Linux 6 Migration Guide.
4.1.5. Previewing RHEL6 compiler features on RHEL5On Red Hat Enterprise Linux 5, we have included the package gcc44 as an update. This is a backportof the RHEL6 compiler to allow users running RHEL5 to compile their code with the RHEL6 compilerand experiment with new features and optimizations before upgrading their systems to the next majorrelease. The resulting binary will be forward compatible with RHEL6, so one can compile on RHEL5with gcc44 and run on RHEL5, RHEL6, and above.
The RHEL5 gcc44 compiler will be kept reasonably in step with the GCC 4.4.x that we ship withRHEL6 to ease transition. Though, to get the latest features, it is recommended RHEL6 is used fordevelopment. The gcc44 is only provided as an aid in the conversion process.
4.1.6. Running GCCTo compile using GCC tools, first install binutils and gcc; doing so will also install severaldependencies.

Chapter 4. Compiling and Building
44
In brief, the tools work via the gcc command. This is the main driver for the compiler. It can be usedfrom the command line to pre-process or compile a source file, link object files and libraries, or performa combination thereof. By default, gcc takes care of the details and links in the provided libgcclibrary.
The compiler functions provided by GCC are also integrated into the Eclipse IDE as part of the CDT.This presents many advantages, particularly for developers who prefer a graphical interface andfully integrated environment. For more information about compiling in Eclipse, refer to Section 1.3, “Development Toolkits”.
Conversely, using GCC tools from the command-line interface consumes less system resources. Thisalso allows finer-grained control over compilers; GCC's command-line tools can even be used outsideof the graphical mode (runlevel 5).
4.1.6.1. Simple C UsageBasic compilation of a C language program using GCC is easy. Start with the following simpleprogram:
hello.c
#include <stdio.h>
int main (){ printf ("Hello world!\n"); return 0;}
The following procedure illustrates the compilation process for C in its most basic form.
Procedure 4.1. Compiling a 'Hello World' C Program1. Compile hello.c into an executable with:
gcc hello.c -o hello
Ensure that the resulting binary hello is in the same directory as hello.c.
2. Run the hello binary, i.e. hello.
4.1.6.2. Simple C++ UsageBasic compilation of a C++ language program using GCC is similar. Start with the following simpleprogram:
hello.cc
#include <iostream>
using namespace std;
int main(void){ cout << "Hello World!" << endl; return 0;

Running GCC
45
}
The following procedure illustrates the compilation process for C++ in its most basic form.
Procedure 4.2. Compiling a 'Hello World' C++ Program1. Compile hello.cc into an executable with:
g++ hello.cc -o hello
Ensure that the resulting binary hello is in the same directory as hello.cc.
2. Run the hello binary, i.e. hello.
4.1.6.3. Simple Multi-File UsageTo use basic compilation involving multiple files or object files, start with the following two source files:
one.c
#include <stdio.h>void hello(){ printf("Hello world!\n");}
two.c
extern void hello();
int main(){ hello(); return 0;}
The following procedure illustrates a simple, multi-file compilation process in its most basic form.
Procedure 4.3. Compiling a Program with Muiltiple Source Files1. Compile one.c into an executable with:
gcc -c one.c -o one.o
Ensure that the resulting binary one.o is in the same directory as one.c.
2. Compile two.c into an executable with:
gcc -c two.c -o two.o
Ensure that the resulting binary two.o is in the same directory as two.c.
3. Compile the two object files one.o and two.o into a single executable with:
gcc one.o two.o -o hello
Ensure that the resulting binary hello is in the same directory as one.o and two.o.
4. Run the hello binary, i.e. hello.
Chapter 4. Compiling and Building
46
4.1.6.4. Recommended Optimization OptionsDifferent projects require different optimization options. There is no one-size-fits-all approach when itcomes to optimization, but here are a few guidelines to keep in mind.
Instruction selection and tuningIt is very important to chose the correct architecture for instruction scheduling. By default GCCproduces code is optimized for the most common processors, but if the CPU on which your code willrun is known, the corresponding -mtune= option to optimize the instruction scheduling, and -march=option to optimize the instruction selection should be used.
The option -mtune= optimizes instruction scheduling to fit your architecture by tuning everythingexcept the ABI and the available instruction set. This option will not chose particular instructions,but instead will tune your program in such a way that executing on a particular architecture will beoptimized. For example, if an Intel Core2 CPU will predominantly be used, choose -march=core2.If the wrong choice is made, the program will still run, but not optimally on the given architecture. Thearchitecture on which the program will most likely run should always be chosen.
The option -march= optimizes instruction selection. As such, it is important to choose correctly aschoosing incorrectly will cause your program to fail. This option selects the instruction set used whengenerating code. For example, if the program will be run on an AMD K8 core based CPU, choose -march=k8. Specifying the architecture with this option will imply -mtune=.
The -mtune= and -march= commands should only be used for tuning and selecting instructionswithin a given architecture, not to generate code for a different architecture (also known as cross-compiling). For example, this is not to be used to generate PowerPC code from an Intel 64 andAMD64 platform.
For a complete list of the available options for both -march= and -mtune=, refer to the GCCdocumention available here: GCC 4.4.4 Manual: Hardware Models and Configurations5
General purpose optimization flagsThe compiler flag -O2 is a good middle of the road option to generate fast code. It produces the bestoptimized code when the resulting code size is not large. Use this when unsure what would best suit.
When code size is not an issue, -O3 is preferrable. This option produces code that is slightly largerbut runs faster because of a more frequent inline of functions. This is ideal for floating point intensivecode.
The other general purpose optimization flag is -Os. This flag also optimizes for size, and producesfaster code in situations where a smaller footprint will increase code locality, thereby reducing cachemisses.
Use -frecord-gcc-switches when compiling objects. This records the options used to buildobjects into objects themselves. After an object is built, it determines which set of options were usedto build it. The set of options are then recorded in a section called .GCC.command.line within theobject and can be examined with the following:
$ gcc -frecord-gcc-switches -O3 -Wall hello.c -o hello$ readelf --string-dump=.GCC.command.line hello
5 http://gcc.gnu.org/onlinedocs/gcc-4.4.4/gcc/Submodel-Options.html#Submodel-Options

Running GCC
47
String dump of section '.GCC.command.line': [ 0] hello.c [ 8] -mtune=generic [ 17] -O3 [ 1b] -Wall [ 21] -frecord-gcc-switches
It is very important to test and try different options with a representative data set. Often, differentmodules or objects can be compiled with different optimization flags in order to produce optimalresults. Refer to Section 4.1.6.5, “Using Profile Feedback to Tune Optimization Heuristics.” foradditional optimization tuning.
4.1.6.5. Using Profile Feedback to Tune Optimization Heuristics.During the transformation of a typical set of source code into an executable, tens of hundreds ofchoices must be made about the importance of speed in one part of code over another, or code sizeas opposed to code speed. By default, these choices are made by the compiler using reasonableheuristics, tuned over time to produce the optimum runtime performance. However, GCC also hasa way to teach the compiler to optimize executables for a specific machine in a specific productionenvironment. This feature is called profile feedback.
Profile feedback is used to tune optimizations such as:
• Inlining
• Branch prediction
• Instruction scheduling
• Inter-procedural constant propagation
• determining of hot or cold functions
Profile feedback compiles a program first to generate a program that is run and analyzed and then asecond time to optimize with the gathered data.
Procedure 4.4. Using Profile Feedback1. Step One
The application must be instrumented to produce profiling information by compiling it with -fprofile-generate.
2. Step TwoRun the application to accumulate and save the profiling information.
3. Step ThreeRecompile the application with -fprofile-use.
Step three will use the profile information gathered in step one to tune the compiler's heuristics whileoptimizing the code into a final executable.
Procedure 4.5. Compiling a Program with Profiling Feedback1. Compile source.c to include profiling instrumentation:
gcc source.c -fprofile-generate -O2 -o executable
2. Run executable to gather profiling information:
./executable

Chapter 4. Compiling and Building
48
3. Recompile and optimize source.c with profiling information gathered in step one:
gcc source.c -fprofile-use -O2 -o executable
Multiple data collection runs, as seen in step two, will accumulate data into the profiling file insteadof replacing it. This allows the executable in step two to be run multiple times with additionalrepresentative data in order to collect even more information.
The executable must run with representative levels of both the machine being used and a respectivedata set large enough for the input needed. This ensures optimal results are achieved.
By default, GCC will generate the profile data into the directory where step one was performed. Togenerate this information elsewhere, compile with -fprofile-dir=DIR where DIR is the preferredoutput directory.
Warning
The format of the compiler feedback data file changes between compiler versions. It is imperativethat the program compilation is repeated with every new version of the compiler.
4.1.6.6. Using 32-bit compilers on a 64-bit hostOn a 64-bit host, GCC will build executables that can only run on 64-bit hosts. However, GCC can beused to build executables that will run both on 64-bit hosts and on 32-bit hosts.
To build 32-bit binaries on a 64-bit host, first install 32-bit versions of any supporting libraries theexecutable may need. This must at least include supporting libraries for glibc and libgcc, andpossibly for libstdc++ if the program is a C++ program. On Intel 64 and AMD64, this can be donewith:
yum install glibc-devel.i686 libgcc.i686 libstdc++-devel.i686
There may be cases where it is useful to to install additional 32-bit libraries that a program may need.For example, if a program uses the db4-devel libraries to build, the 32-bit version of these librariescan be installed with:
yum install db4-devel.i686
Note
The .i686 suffix on the x86 platform (as opposed to x86-64) specifies a 32-bit version of thegiven package. For PowerPC architectures, the suffix is ppc (as opposed to ppc64).
After the 32-bit libraries have been installed, the -m32 option can be passed to the compiler andlinker to produce 32-bit executables. Provided the supporting 32-bit libraries are installed on teh 64-bitsystem, this executable will be able to run on both 32-bit systems and 64-bit systems.
Procedure 4.6. Compiling a 32-bit Program on a 64-bit Host1. On a 64-bit system, compile hello.c into a 64-bit executable with:
gcc hello.c -o hello64
2. Ensure that the resulting executable is a 64-bit binary:

Running GCC
49
$ file hello64hello64: ELF 64-bit LSB executable, x86-64, version 1 (GNU/Linux), dynamically linked (uses shared libs), for GNU/Linux 2.6.18, not stripped$ ldd hello64linux-vdso.so.1 => (0x00007fff242dd000)libc.so.6 => /lib64/libc.so.6 (0x00007f0721514000)/lib64/ld-linux-x86-64.so.2 (0x00007f0721893000)
The command file on a 64-bit executable will include ELF 64-bit in its output, and ldd willlist /lib64/libc.so.6 as the main C library linked.
3. On a 64-bit system, compile hello.c into a 32-bit executable with:
gcc -m32 hello.c -o hello32
4. Ensure that the resulting executable is a 32-bit binary:
$ file hello32hello32: ELF 32-bit LSB executable, Intel 80386, version 1 (GNU/Linux), dynamically linked (uses shared libs), for GNU/Linux 2.6.18, not stripped$ ldd hello32linux-gate.so.1 => (0x007eb000)libc.so.6 => /lib/libc.so.6 (0x00b13000)/lib/ld-linux.so.2 (0x00cd7000)
The command file on a 32-bit executable will include ELF 32-bit in its output, and ldd willlist /lib/libc.so.6 as the main C library linked.
If you have not installed the 32-bit supporting libraries you will get an error similar to this for C code:
$ gcc -m32 hello32.c -o hello32/usr/bin/ld: crt1.o: No such file: No such file or directorycollect2: ld returned 1 exit status
A similar error would be triggered on C++ code:
$ g++ -m32 hello32.cc -o hello32-c++In file included from /usr/include/features.h:385, from /usr/lib/gcc/x86_64-redhat-linux/4.4.4/../../../../include/c++/4.4.4/x86_64-redhat-linux/32/bits/os_defines.h:39, from /usr/lib/gcc/x86_64-redhat-linux/4.4.4/../../../../include/c++/4.4.4/x86_64-redhat-linux/32/bits/c++config.h:243, from /usr/lib/gcc/x86_64-redhat-linux/4.4.4/../../../../include/c++/4.4.4/iostream:39, from hello32.cc:1:/usr/include/gnu/stubs.h:7:27: error: gnu/stubs-32.h: No such file or directory
These errors indicate that the supporting 32-bit libraries have not been properly installed as explainedat the beginning of this section.
It is important to note that even if 32-bit binaries can run on 64-bit systems, it is preferrable to have64-bit binaries unless otherwise needed. In order to run 32-bit binaries on 64-bit systems, the systemmust import additional 32-bit shared libraries that must be loaded in tandem with the 64-bit libraries(for example glibc). This causes additional memory usage on such systems. It is always preferrable tohave 64-bit binaries for 64-bit systems and 32-bit binaries for 32-bit systems.

Chapter 4. Compiling and Building
50
Also important is to note that building with -m32 will in not adapt or convert a program to resolve anyissues arising from 32/64-bit incompatibilities. For tips on writing portable code and converting from32-bits to 64-bits, see the paper entitled Porting to 64-bit GNU/Linux Systems in the Proceedings ofthe 2003 GCC Developers Summit6.
4.1.7. GCC DocumentationFor more information about GCC compilers, refer to the man pages for cpp, gcc, g++, gcj, andgfortran.
the following online user manuals are also available:
• GCC 4.4.4 Manual7
• GCC 4.4.4 GNU Fortran Manual8
• GCC 4.4.4 GCJ Manual9
• GCC 4.4.4 CPP Manual10
• GCC 4.4.4 GNAT Reference Manual11
• GCC 4.4.4 GNAT User's Guide12
• GCC 4.4.4 GNU OpenMP Manual13
The main site for the development of GCC is gcc.gnu.org14.
4.2. Distributed CompilingRed Hat Enterprise Linux 6 also supports distributed compiling. This involves transforming onecompile job into many smaller jobs; these jobs are distributed over a cluster of machines, whichspeeds up build time (particularly for programs with large codebases). The distcc package providesthis capability.
To set up distributed compiling, install the following packages:
• distcc
• distcc-server
For more information about distributed compiling, refer to the man pages for distcc and distccd.The following link also provides detailed information about the development of distcc:
http://code.google.com/p/distcc
4.3. AutotoolsGNU Autotools is a suite of command-line tools that allow developers to build applications on differentsystems, regardless of the installed packages or even Linux distribution. These tools aid developersin creating a configure script. This script runs prior to builds and creates the top-level Makefilesneeded to build the application. The configure script may perform tests on the current system,create additional files, or run other directives as per parameters provided by the builder.
6 http://www.linux.org.uk/~ajh/gcc/gccsummit-2003-proceedings.pdf14 http://gcc.gnu.org
Autotools Plug-in for Eclipse
51
The Autotools suite's most commonly-used tools are:
autoconfGenerates the configure script from an input file (e.g. configure.ac)
automakeCreates the Makefile for a project on a specific system
autoscanGenerates a preliminary input file (i.e. configure.scan), which can be edited to create a finalconfigure.ac to be used by autoconf
All tools in the Autotools suite are part of the Development Tools group package. You can installthis package group to install the entire Autotools suite, or simply use yum to install any tools in thesuite as you wish.
4.3.1. Autotools Plug-in for EclipseThe Autotools suite is also integrated into the Eclipse IDE via the Autotools plug-in. This plug-inprovides an Eclipse graphical user interface for Autotools, which is suitable for most C/C++ projects.
As of Red Hat Enterprise Linux 6, this plug-in only supports two templates for new C/C++ projects:
• An empty project
• A "hello world" application
The empty project template is used when importing projects into the C/C++ Development Toolkit thatalready support Autotools. Future updates to the Autotools plug-in will include additional graphical userinterfaces (e.g. wizards) for creating shared libraries and other complex scenarios.
The Red Hat Enterprise Linux 6 version of the Autotools plug-in also does not integrate git ormercurial into Eclipse. As such, Autotools projects that use git repositories will need to bechecked out outside the Eclipse workspace. Afterwards, you can specify the source location for suchprojects in Eclipse. Any repository manipulation (e.g. commits, updates) will need to be done via thecommand line.
4.3.2. Configuration ScriptThe most crucial function of Autotools is the creation of the configure script. This script testssystems for tools, input files, and other features it can use in order to build the project 15. Theconfigure script generates a Makefile which allows the make tool to build the project based on thesystem configuration.
To create the configure script, create an input file and feed it to an Autotools utility to createtheconfigure script. This input file is typically configure.ac or Makefile.am; the former isusually processed by autoconf, while the latter is fed to automake.
If a Makefile.am input file is available, the automake utility creates a Makefile template (i.e.Makefile. in), which may refer to information collected at configuration time. For example, theMakefile may need to link to a particular library if and only if that library is already installed. Whenthe configure script runs, automake will use the Makefile. in templates to create a Makefile.
15 For information about tests that configure can perform, refer to the following link:http://www.gnu.org/software/autoconf/manual/autoconf.html#Existing-Tests

Chapter 4. Compiling and Building
52
If a configure.ac file is available instead, then autoconf will automatically create the configurescript based on the macros invoked by configure.ac. To create a preliminary configure.ac, usethe autoscan utility and edit the file accordingly.
4.3.3. Autotools DocumentationRed Hat Enterprise Linux 6 includes man pages for autoconf, automake, autoscan and most toolsincluded in the Autotools suite. In addition, the Autotools community provides extensive documentationon autoconf and automake on the following websites:
• http://www.gnu.org/software/autoconf/manual/autoconf.html
• http://www.gnu.org/software/autoconf/manual/automake.html
The following is an online book describing the use of Autotools. Although the above onlinedocumentation is the recommended and most up to date information on Autotools, this book is a goodalternative and introduction.
• http://sourceware.org/autobook/
For information on how to create Autotools input files, refer to:
• http://www.gnu.org/software/autoconf/manual/autoconf.html#Making-configure-Scripts
• http://www.gnu.org/software/autoconf/manual/automake.html#Invoking-Automake
The following upstream example also illustrates the use of Autotools in a simple hello program:
• http://www.gnu.org/software/hello/manual/hello.html
The Autotools Plug-in For Eclipse whitepaper also provides more detail on the Red Hat EnterpriseLinux 6 release of the Autotools plug-in. This whitepaper also includes a "by example" case study towalk you through a typical use-case for the plug-in. Refer to the following link for more information:
http://docs.redhat.com/docs/en-US/Red_Hat_Enterprise_Linux/6/html/Autotools_Plug-In_for_Eclipse/index.html
4.4. Eclipse Built-in Specfile EditorThe Specfile Editor Plug-in for Eclipse provides useful features to help developers manage .specfiles. This plug-in allows users to leverage several Eclipse GUI features in editing .spec files, such asauto-completion, highlighting, file hyperlinks, and folding.
In addition, the Specfile Editor Plug-in also integrates the rpmlint tool into the Eclipse interface.rpmlint is a command-line tool that helps developers detect common RPM package errors. Thericher visualization offered by the Eclipse interface helps developers quickly detect, view, and correctmistakes reported by rpmlint.
The Specfile Editor for Eclipse is provided by the eclipse-rpm-editor package. For moreinformation about this plug-in, refer to Specfile Editor User Guide in the Eclipse Help Contents.
Chapter 5.
53
DebuggingUseful, well-written software generally goes through different phases of application development,and mistakes can occur in each phase. Some phases come with their own set of mechanisms todetect certain mistakes; during compilation, for example, most compilers perform elementary semanticanalysis, making sure objects such as variables and functions are adequately described.
The error-checking mechanisms of each application development phase helps catch simple andobvious mistakes in code. The debugging phase helps catch more subtle errors; ones that fell throughthe cracks during routine code inspection.
5.1. Installing Debuginfo PackagesRed Hat Enterprise Linux also provides -debuginfo packages for all architecture-dependent RPMsincluded in the operating system. A -debuginfo package contains accurate debugging informationfor its corresponding package. To install the -debuginfo package of a package (i.e. typicallypackagename-debuginfo), use the following command:
debuginfo-install packagename
Note
Attempting to debug a package without having its -debuginfo equivalent installed may fail,although GDB will try to provide any helpful diagnostics it can.
5.2. GDBFundamentally, like most debuggers, GDB manages the execution of compiled code in a very closelycontrolled environment. This environment makes possible the following fundamental mechanismsnecessary to the operation of GDB:
• Inspect and modify memory within the code being debugged (e.g. reading and setting variables).
• Control the execution state of the code being debugged, principally whether it's running or stopped.
• Detect the execution of particular sections of code (e.g. stop running code when it reaches aspecified area of interest to the programmer).
• Detect access to particular areas of memory (e.g. stop running code when it accesses a specifiedvariable).
• Execute portions of code (from an otherwise stopped program) in a controlled manner.
• Detect various programmatic asynchronous events such as signals.
The operation of these mechanisms rely mostly on information produced by a compiler. For example,to view the value of a variable, GDB has to know:
• The location of the variable in memory
• The nature of the variable
This means that displaying a double-precision floating point value requires a very different processfrom displaying a string of characters. For something complex like a structure, GDB has to know
Chapter 5. Debugging
54
not only the characteristics of each individual elements in the structure, but the morphology of thestructure as well.
GDB requires the following items in order to fully function:
Debug InformationMuch of GDB's operations rely on a program's debug information. While this information generallycomes from compilers, much of it is necessary only while debugging a program, i.e. it is notused during the program's normal execution. For this reason, compilers do not always make thatinformation available by default — GCC, for instance, must be explicitly instructed to provide thisdebugging information with the -g flag.
To make full use of GDB's capabilities, it is highly advisable to make the debug informationavailable first to GDB. GDB can only be of very limited use when run against code with noavailable debug information.
Source CodeOne of the most useful features of GDB (or any other debugger) is the ability to associate eventsand circumstances in program execution with their corresponding location in source code. Thislocation normally refers to a specific line or series of lines in a source file. This, of course, wouldrequire that a program's source code be available to GDB at debug time.
5.2.1. Simple GDBGDB literally contains dozens of commands. This section describes the most fundamental ones.
br (breakpoint)The breakpoint command instructs GDB to halt execution upon reaching a specified point in theexecution That point can be specified a number of ways, but the most common are just as the linenumber in the source file, or the name of a function. Any number of breakpoints can be in effectsimultaneously. This is frequently the first command issued after starting GDB.
r (run)The run command starts the execution of the program. If run is executed with any arguments,those arguments are passed on to the executable as if the program has been started normally.Users normally issue this command after setting breakpoints.
Before an executable is started, or once the executable stops at, for example, a breakpoint, the stateof many aspects of the program can be inspected. The following commands are a few of the morecommon ways things can be examined.
p (print)The print command displays the value of the argument given, and that argument can be almostanything relevant to the program. Usually, the argument is simply the name of a variable of anycomplexity, from a simple single value to a structure. An argument can also be an expression validin the current language, including the use of program variables and library functions, or functionsdefined in the program beingtested.
bt (backtrace)The backtrace displays the chain of function calls used up until the exectuion was terminated.This is useful for investigating serious bugs (such as segmentation faults) with elusive causes.
l (list)When execution is stopped, the list command shows the line in the source code correspondingto where the program stopped.

Running GDB
55
The execution of a stopped program can be resumed in a number of ways. The following are the mostcommon.
c (continue)The continue command simply restarts the execution of the program, which will continue toexecute until it encounters a breakpoint, runs into a specified or emergent condition (e.g. an error),or terminates.
n (next)Like continue, the next command also restarts execution; however, in addition to the stoppingconditions implicit in the continue command, next will also halt execution at the next sequentialline of code in the current source file.
s (step)Like next, the step command also halts execution at each sequential line of code in the currentsource file. However, if execution is currently stopped at a source line containing a function call,GDB stops execution after entering the function call (rather than executing it).
fini (finish)Like the aforementioned commands, the finish command resumes executions, but halts whenexecution returns from a function.
Finally, two essential commands:
q (quit)This terminates the execution.
h (help)The help command provides access to its extensive internal documentation. The commandtakes arguments: help breakpoint (or h br), for example, shows a detailed descriptionof the breakpoint command. Refer to the help output of each command for more detailedinformation.
5.2.2. Running GDBThis section will describe a basic execution of GDB, using the following simple program:
hello.c
#include <stdio.h> char hello[] = { "Hello, World!" };
int main() { fprintf (stdout, "%s\n", hello); return (0); }
The following procedure illustrates the debugging process in its most basic form.
Procedure 5.1. Debugging a 'Hello World' Program1. Compile hello.c into an executable with the debug flag set, as in:
gcc -g -o hello hello.c

Chapter 5. Debugging
56
Ensure that the resulting binary hello is in the same directory as hello.c.
2. Run gdb on the hello binary, i.e. gdb hello.
3. After several introductory comments, gdb will display the default GDB prompt:
(gdb)
4. Some things can be done even before execution is started. The variable hello is global, so it canbe seen even before the main procedure starts:
gdb) p hello $1 = "Hello, World!" (gdb) p hello[0] $2 = 72 'H' (gdb) p *hello $3 = 72 'H' (gdb)
Note that the print targets hello[0] and *hello require the evaluation of an expression, asdoes, for example, *(hello + 1):
(gdb) p *(hello + 1) $4 = 101 'e'
5. Next, list the source:
(gdb) l 1 #include <stdio.h> 2 3 char hello[] = { "Hello, World!" }; 4 5 int 6 main() 7 { 8 fprintf (stdout, "%s\n", hello); 9 return (0); 10 }
The list reveals that the fprintf call is on line 8. Apply a breakpoint on that line and resumethe code:
(gdb) br 8 Breakpoint 1 at 0x80483ed: file hello.c, line 8. (gdb) r Starting program: /home/moller/tinkering/gdb-manual/hello
Breakpoint 1, main () at hello.c:8 8 fprintf (stdout, "%s\n", hello);
6. Finally, use the “next” command to step past the fprintf call, executing it:
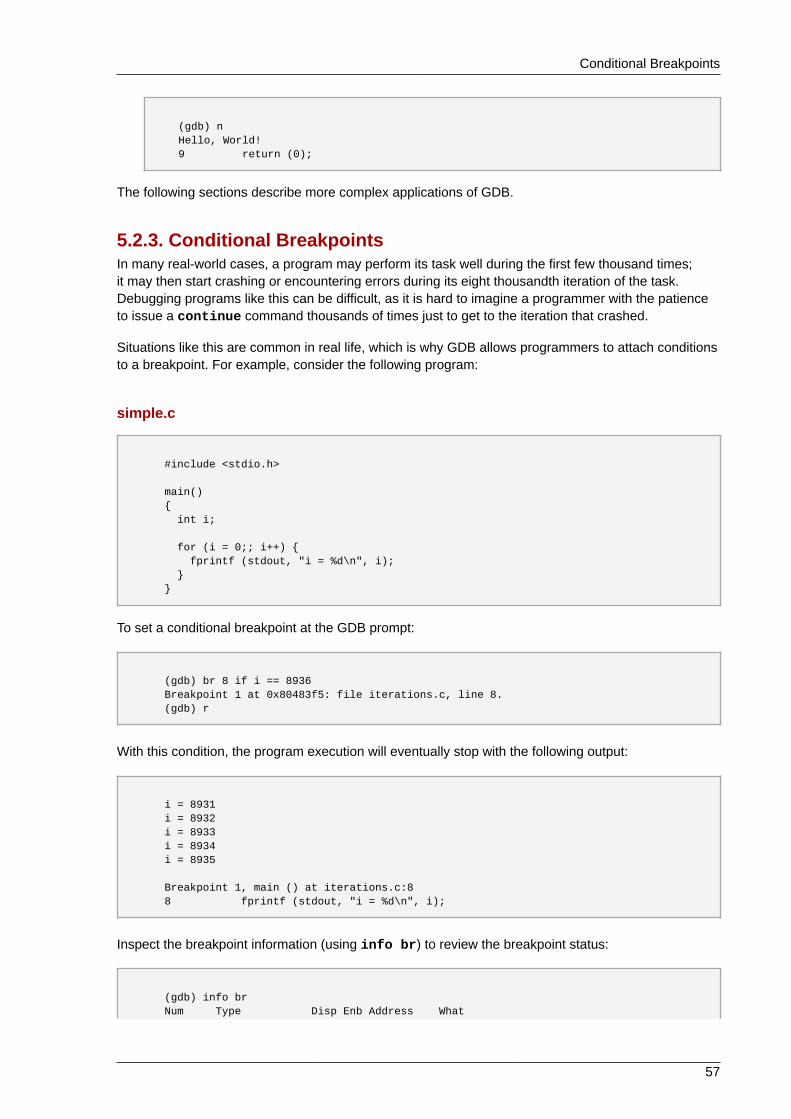
Conditional Breakpoints
57
(gdb) n Hello, World! 9 return (0);
The following sections describe more complex applications of GDB.
5.2.3. Conditional BreakpointsIn many real-world cases, a program may perform its task well during the first few thousand times;it may then start crashing or encountering errors during its eight thousandth iteration of the task.Debugging programs like this can be difficult, as it is hard to imagine a programmer with the patienceto issue a continue command thousands of times just to get to the iteration that crashed.
Situations like this are common in real life, which is why GDB allows programmers to attach conditionsto a breakpoint. For example, consider the following program:
simple.c
#include <stdio.h> main() { int i;
for (i = 0;; i++) { fprintf (stdout, "i = %d\n", i); } }
To set a conditional breakpoint at the GDB prompt:
(gdb) br 8 if i == 8936 Breakpoint 1 at 0x80483f5: file iterations.c, line 8. (gdb) r
With this condition, the program execution will eventually stop with the following output:
i = 8931 i = 8932 i = 8933 i = 8934 i = 8935 Breakpoint 1, main () at iterations.c:8 8 fprintf (stdout, "i = %d\n", i);
Inspect the breakpoint information (using info br) to review the breakpoint status:
(gdb) info br Num Type Disp Enb Address What

Chapter 5. Debugging
58
1 breakpoint keep y 0x080483f5 in main at iterations.c:8 stop only if i == 8936 breakpoint already hit 1 time
5.2.4. Forked ExecutionAmong the more challenging bugs that can confront programmers is where one program (theparent) makes an independent copy of itself (a fork) that creates a child process which, in turn, fails.Debugging the parent process may or may not be useful—the only way to get to the bug may be bydebugging the child process, but doing a gdb child isn't always possible.
To address this, GDB allows programmers to continue following the parent process after a fork, or tofollow a child process.
Note
This capability is not supported by all architectures for which GDB is built, but even under thosecircumstances using GDB to follow a fork can still be possible. In such architectures, GDB canattach itself to a process that is already running, allowing a second instance of GDB to attach to aforked child process.
5.2.5. ThreadsIn most cases, a forked program immediately uses one of the variations of the exec function to starta completely independent executable. In the same manner, threads use multiple paths of execution,occurring simultaneously in the same executable. This can provide a whole new range of debuggingchallenges, such as setting a breakpoint for a particular thread that won't interrupt the execution of anyother thread. GDB supports threaded debugging (but not in all architectures for which GDB can bebuilt).
5.2.6. GDB Variations and EnvironmentsGDB normally uses a command-line interface, a CLI, but it also includes what's called a “machineinterface,” the MI. Internally, Eclipse invokes GDB using the MI but a number of other applicationssimilarly use MI to provide different user interfaces.
Emacs, oddly enough, also supports GDB. It offers a collection of major modes that provide aninterface to GDB. For more information on this, refer to info emacs; additional information on this isalso available from the following link:
http://www.gnu.org/software/emacs/manual/html_mono/emacs.html#GDB-Graphical-Interface
5.2.7. GDB DocumentationGDB is a very mature application, literally decades in the making, and is extremely well documented.The most convenient way to access that documentation, and the way most likely to providedocumentation on the version of GDB actually installed, is through info gdb; this provides accessto the GDB info file included in the GDB installation. In addition, man gdb offers more concise GDBinformation.
Red Hat also provides extensive GDB documentation on the following link:
http://sources.redhat.com/gdb/current/onlinedocs/gdb.html

Variable Tracking at Assignments
59
Note
Not all documented characteristics will apply to all instances of GDB because it is still in activedevelopment, and as such the capabilities vary (to some extent) depending on the platform andtarget for which it is built.
5.3. Variable Tracking at AssignmentsVariable Tracking at Assignments (VTA) is a new infrastructure included in GCC used to improvevariable tracking during optimizations. This allows GCC to produce more precise, meaningful, anduseful debugging information for GDB, SystemTap, and other debugging tools.
When GCC compiles code with optimizations enabled, variables are renamed, moved around, or evenremoved altogether. As such, optimized compiling can cause a debugger to report that some variableshave been "optimized out". With VTA enabled, optimized code is internally annotated to ensure thatoptimization passes to transparently keep track of each variable's value, regardless of whether thevariable is moved or removed.
VTA's benefits are more pronounced when debugging applications with inlined functions. WithoutVTA, optimization could completely remove some arguments of an inlined function, preventing thedebugger from inspecting its value. With VTA, optimization will still happen, and appropriate debugginginformation will be generated for any missing arguments.
VTA is enabled by default when compiling code with optimizations and debugging information enabled.To disable VTA during such builds, add the -fno-var-tracking-assignments. In addition, theVTA infrastructure includes the new gcc option -fcompare-debug. This option tests code compiledby GCC with debug information and without debug information: the test passes if the two binariesare identical. This test ensures that executable code is not affected by any debugging options, whichfurther ensures that there are no hidden bugs in the debug code. Note that -fcompare-debug addssignificant cost in compilation time. Refer to man gcc for details about this option.
For more information about the infrastructure and development of VTA, refer to A Plan to Fix LocalVariable Debug Information in GCC, available at the following link:
http://gcc.gnu.org/wiki/Var_Tracking_Assignments
A slide deck version of this whitepaper is also available at http://people.redhat.com/aoliva/papers/vta/slides.pdf.
5.4. Python Pretty-PrintersThe GDB command print outputs comprehensive debugging information for a target application.GDB aims to provide as much debugging data as it can to users; however, this means that for highlycomplex programs the amount of data can become very cryptic.
In addition, GDB does not provide any tools that help decipher GDB print output. GDB does noteven empower users to easily create tools that can help decipher program data. This makes thepractice of reading and understanding debugging data quite arcane, particularly for large, complexprojects.
For most developers, the only way to customize GDB print output (and make it more meaningful)is to revise and recompile GDB. However, very few developers can actually do this. Further, thispractice will not scale well, particularly if the developer needs to also debug other programs that areheterogenous and contain equally complex debugging data.

Chapter 5. Debugging
60
To address this, the Red Hat Enterprise Linux 6 version of GDB is now compatible with Python pretty-printers. This allows the retrieval of more meaningful debugging data by leaving the introspection,printing, and formatting logic to a third-party Python script.
Compatibility with Python pretty-printers gives you the chance to truly customize GDB output as yousee fit. This makes GDB a more viable debugging solution to a wider range of projects, since you nowhave the flexibility to adapt GDB output as needed, and with greater ease. Further, developers withintimate knowledge of a project and a specific programming language are best qualified in decidingwhat kind of output is meaningful, allowing them to improve the usefulness of that output.
The Python pretty-printers implementation allows users to automatically inspect, format, and printprogram data according to specification. These specifications are written as rules implemented viaPython scripts. This offers the following benefits:
SafeTo pass program data to a set of registered Python pretty-printers, the GDB development team addedhooks to the GDB printing code. These hooks were implemented with safety in mind: the built-inGDB printing code is still intact, allowing it to serve as a default fallback printing logic. As such, ifno specialized printers are available, GDB will still print debugging data the way it always did. Thisensures that GDB is backwards-compatible; users who have no need of pretty-printers can stillcontinue using GDB.
Highly CustomizableThis new "Python-scripted" approach allows users to distill as much knowledge as required intospecific printers. As such, a project can have an entire library of printer scripts that parses programdata in a unique manner specific to its user's needs. There is no limit to the number of printers a usercan build for a specific project; what's more, being able to customize debugging data script by scriptoffers users an easier way to re-use and re-purpose printer scripts — or even a whole library of them.
Easy to LearnThe best part about this approach is its lower barrier to entry. Python scripting is quite easy to learn(in comparison, at least) and has a large library of free documentation available online. In addition,most programmers already have basic to intermediate experience in Python scripting, or in scripting ingeneral.
The GDB and Python Pretty-Printers whitepaper provides more details on this feature. This whitepaperalso includes details and examples on how to write your own Python pretty-printer as well as how toimport it into GDB. Refer to the following link for more information:
http://docs.redhat.com/docs/en-US/Red_Hat_Enterprise_Linux/6/html/GDB_and_Python_Pretty_Printers/

Chapter 6.
61
ProfilingDevelopers profile programs to focus attention on the areas of the program that have the largestimpact on performance. The types of data collected include what section of the program consumes themost processor time, and where memory is allocated. Profiling collects data from the actual programexecution. Thus, the quality of the data collect is influenced by the actual tasks being performed by theprogram. The tasks performed during profiling should be represenative of actual use; this ensures thatproblems arising from realistic use of the program are addressed during development.
Red Hat Enterprise Linux 6 includes a number of different tools (Valgrind, OProfile, perf, andSystemTap) to collect profiling data. Each tool is suitable for performing specific types of profile runs,as described in the following sections.
6.1. Profiling In EclipseTo launch a profile run, navigate to Run > Profile. This will open the Profile As dialogue, from whichyou can select a tool for a profile run.
Figure 6.1. Profile As
To configure each tool for a profile run, navigate to Run > Profile Configuration. This will open theProfile Configuration menu.
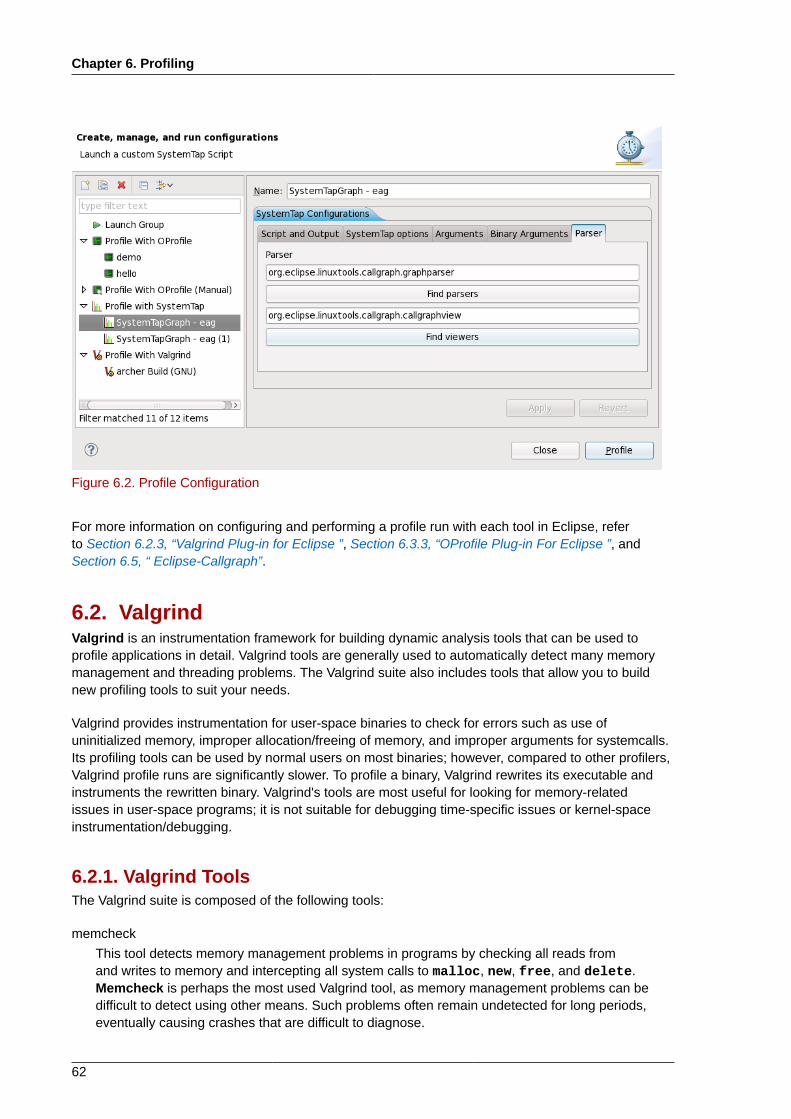
Chapter 6. Profiling
62
Figure 6.2. Profile Configuration
For more information on configuring and performing a profile run with each tool in Eclipse, referto Section 6.2.3, “Valgrind Plug-in for Eclipse ”, Section 6.3.3, “OProfile Plug-in For Eclipse ”, andSection 6.5, “ Eclipse-Callgraph”.
6.2. ValgrindValgrind is an instrumentation framework for building dynamic analysis tools that can be used toprofile applications in detail. Valgrind tools are generally used to automatically detect many memorymanagement and threading problems. The Valgrind suite also includes tools that allow you to buildnew profiling tools to suit your needs.
Valgrind provides instrumentation for user-space binaries to check for errors such as use ofuninitialized memory, improper allocation/freeing of memory, and improper arguments for systemcalls.Its profiling tools can be used by normal users on most binaries; however, compared to other profilers,Valgrind profile runs are significantly slower. To profile a binary, Valgrind rewrites its executable andinstruments the rewritten binary. Valgrind's tools are most useful for looking for memory-relatedissues in user-space programs; it is not suitable for debugging time-specific issues or kernel-spaceinstrumentation/debugging.
6.2.1. Valgrind ToolsThe Valgrind suite is composed of the following tools:
memcheckThis tool detects memory management problems in programs by checking all reads fromand writes to memory and intercepting all system calls to malloc, new, free, and delete.Memcheck is perhaps the most used Valgrind tool, as memory management problems can bedifficult to detect using other means. Such problems often remain undetected for long periods,eventually causing crashes that are difficult to diagnose.

Using Valgrind
63
cachegrindCachegrind is a cache profiler that accurately pinpoints sources of cache misses in code byperforming a detailed simulation of the I1, D1 and L2 caches in the CPU. It shows the numberof cache misses, memory references, and instructions accruing to each line of source code;Cachegrind also provides per-function, per-module, and whole-program summaries, and caneven show counts for each individual machine instructions.
callgrindLike cachegrind, callgrind can model cache behavior. However, the main purpose ofcallgrind is to record callgraphs data for the executed code.
massifMassif is a heap profiler; it measures how much heap memory a program uses, providinginformation on heap blocks, heap administration overheads, and stack sizes. Heap profilersare useful in finding ways to reduce heap memory usage. On systems that use virtual memory,programs with optimized heap memory usage are less likely to run out of memory, and may befaster as they require less paging.
helgrindIn programs that use the POSIX pthreads threading primitives, Helgrind detects synchronisationerrors. Such errors are:
• Misuses of the POSIX pthreads API
• Potential deadlocks arising from lock ordering problems
• Data races (i.e. accessing memory without adequate locking)
Valgrind also allows you to develop your own profiling tools. In line with this, Valgrind includes thelackey tool, which is a sample that can be used as a template for generating your own tools.
6.2.2. Using ValgrindThe valgrind package and its dependencies install all the necessary tools for performing a Valgrindprofile run. To profile a program with Valgrind, use:
valgrind --tool=toolname program
Refer to Section 6.2.1, “Valgrind Tools” for a list of arguments for toolname. In addition to the suiteof Valgrind tools, none is also a valid argument for toolname; this argument allows you to run aprogram under Valgrind without performing any profiling. This is useful for debugging or benchmarkingValgrind itself.
You can also instruct Valgrind to send all of its information to a specific file. To do so, use the option --log-file=filename. For example, to check the memory usage of the executable file hello andsend profile information to output, use:
valgrind --tool=memcheck --log-file=output hello
Refer to Section 6.2.4, “Valgrind Documentation” for more information on Valgrind, along with otheravailable documentation on the Valgrind suite of tools.
6.2.3. Valgrind Plug-in for EclipseThe Valgrind plug-in for Eclipse (documented herein) integrates several Valgrind tools into Eclipse.This allows Eclipse users to seamlessly include profiling capabilities into their workflow. At present, theValgrind plug-in for Eclipse supports three Valgrind tools:
Chapter 6. Profiling
64
• Memcheck
• Massif
• Cachegrind
The Valgrind plug-in for Eclipse is provided by the eclipse-valgrind package. For moreinformation about this plug-in, refer to Valgrind Integration User Guide in the Eclipse Help Contents.
6.2.4. Valgrind DocumentationFor more extensive information on Valgrind, refer to man valgrind. Red Hat Enterprise Linux 6 alsoprovides a comprehensive Valgrind Documentation book, available as PDF and HTML in:
• file:///usr/share/doc/valgrind-version/valgrind_manual.pdf
• file:///usr/share/doc/valgrind-version/html/index.html
The Valgrind Integration User Guide in the Eclipse Help Contents also also provides detailedinformation on the setup and usage of the Valgrind plug-in for Eclipse. This guide is provided by theeclipse-valgrind package.
6.3. OProfileOProfile is a system-wide Linux profiler, capable of running at low overhead. It consists of a kerneldriver and a daemon for collecting raw sample data, along with a suite of tools for parsing that datainto meaningful information. OProfile is generally used by developers to determine which sections ofcode consume the most amount of CPU time, and why.
During a profile run, OProfile uses the processor's performance monitoring hardware. Valgrind rewritesthe binary of an application, and in turn instruments it. OProfile, on the other hand,simply profiles arunning application as-is. It sets up the performance monitoring hardware to take a sample every xnumber of events (e.g. cache misses or branch instructions). Each sample also contains informationon where it occurred in the program.
OProfile's profiling methods consume less resources than Valgrind. However, OProfile requires rootprivileges. OProfile is useful for finding "hot-spots" in code, and looking for their causes (e.g. poorcache performance, branch mispredictions).
Using OProfile involves starting the OProfile daemon (oprofiled), running the program to beprofiled, collecting the system profile data, and parsing it into a more understandable format. OProfileprovides several tools for every step of this process.
6.3.1. OProfile ToolsThe most useful OProfile commands include the following:
opcontrolThis tool is used to start/stop the OProfile daemon and configure a profile session.
opreportThe opreport command outputs binary image summaries, or per-symbol data, from OProfileprofiling sessions.
opannotateThe opannotate command outputs annotated source and/or assembly from the profile data of anOProfile session.
Using OProfile
65
oparchiveThe oparchive command generates a directory populated with executable, debug, and OProfilesample files. This directory can be moved to another machine (via tar), where it can be analyzedoffline.
opgprofLike opreport, the opgprof command outputs profile data for a given binary image from anOProfile session. The output of opgprof is in gprof format.
For a complete list of OProfile commands, refer to man oprofile. For detailed information oneach OProfile command, refer to its corresponding man page. Refer to Section 6.3.4, “OProfileDocumentation” for other available documentation on OProfile.
6.3.2. Using OProfileThe oprofile package and its dependencies install all the necessary utilities for performing anOProfile profile run. To instruct the OProfile to profile all the application running on the system andto group the samples for the shared libraries with the application using the library, run the followingcommand as root:
opcontrol --no-vmlinux --separate=library --start
You can also start the OProfile daemon without collecting system data. To do so, use the option --start-daemon instead. The --stop option halts data collection, while the --shutdown terminatesthe OProfile daemon.
Use opreport, opannotate, or opgprof to display the collected profiling data. By default, the datacollected by the OProfile daemon is stored in /var/lib/oprofile/samples/.
6.3.3. OProfile Plug-in For EclipseThe OProfile suite of tools provide powerful call profiling capabilities; as a plug-in, these capabilitiesare well ported into the Eclipse user interface. The OProfile Plug-in provides the following benefits:
Targeted ProfilingThe OProfile Plug-in will allow Eclipse users to profile a specific binary, include related sharedlibraries/kernel modules, and even exclude binaries. This produces very targeted, detailed usageresults on each binary, function, and symbol, down to individual line numbers in the source code.
User Interface Fully Integrated into CDTThe plug-in displays enriched OProfile results through Eclipse, just like any other plug-in. Double-clicking on a source line in the results brings users directly to the corresponding line in the Eclipseeditor. This allows users to build, profile, and edit code through a single interface, making profilinga convenient experience for Eclipse users. In addition, profile runs are launched and configured thesame way as C/C++ applications within Eclipse.
Fully Customizable Profiling OptionsThe Eclipse interface allows users to configure their profile run using all options available in theOProfile command-line utility. The plug-in supports event configuration based on processor debuggingregisters (i.e. counters), as well as interrupt-based profiling for kernels or processors that don't supporthardware counters.

Chapter 6. Profiling
66
Ease of UseThe OProfile Plug-in provides generally useful defaults for all options, usable for a majority of profilingruns. In addition, it also features a "one-click profile" that executes a profile run using these defaults.Users can profile applications from start to finish, or select specific areas of code through a manualcontrol dialog.
The OProfile plug-in for Eclipse is provided by the eclipse-oprofile package. For moreinformation about this plug-in, refer to OProfile Integration User Guide in the Eclipse Help Contents(also provided by eclipse-profile).
6.3.4. OProfile DocumentationFor a more extensive information on OProfile, refer to man oprofile. Red Hat EnterpriseLinux 6 also provides two comprehensive guides to OProfile in file:///usr/share/doc/oprofile-version/:
OProfile ManualA comprehensive manual with detailed instructions on the setup and use of OProfile is found atfile:///usr/share/doc/oprofile-version/oprofile.html
OProfile InternalsDocumentation on the internal workings of OProfile, useful for programmers interestedin contributing to the OProfile upstream, can be found at file:///usr/share/doc/oprofile-version/internals.html
The OProfile Integration User Guide in the Eclipse Help Contents also provides detailed informationon the setup and usage of the OProfile plug-in for Eclipse. This guide is provided by the eclipse-oprofile package.
6.4. SystemTapSystemTap is a useful instrumentation platform for probing running processes and kernel activity onthe Linux system. To execute a probe:
1. Write SystemTap scripts that specify which system events (e.g. virtual file system reads, packettransmissions) should trigger specified actions (e.g. print, parse, or otherwise manipulate data).
2. SystemTap translates the script into a C program, which it compiles into a kernel module.
3. SystemTap loads the kernel module to perform the actual probe.
SystemTap scripts are useful for monitoring system operation and diagnosing system issues withminimal intrusion into the normal operation of the system. You can quickly instrument running systemtest hypotheses without having to recompile and re-install instrumented code. To compile a SystemTapscript that probes kernel-space, SystemTap uses information from three different kernel informationpackages:
• kernel-variant-devel-version
• kernel-variant-debuginfo-version
• kernel-variant-debuginfo-common-version
These kernel information packages must match the kernel to be probed. In addition, to compileSystemTap scripts for multiple kernels, the kernel information packages of each kernel must also beinstalled.

SystemTap Compile Server
67
The following sections describe new SystemTap features available in the Red Hat Enterprise Linux 6release.
6.4.1. SystemTap Compile ServerSystemTap in Red Hat Enterprise Linux 6 supports a compile server and client deployment. With thissetup, the kernel information packages of all client systems in the network are installed on just onecompile server host (or a few). When a client system attempts to compile a kernel module from aSystemTap script, it remotely accesses the kernel information it needs from the centralized compileserver host.
A properly configured and maintained SystemTap compile server host offers the following benefits:
• The system administrator can verify the integrity of kernel information packages before making thepackages available to users.
• The identity of a compile server can be authenticated using the Secure Socket Layer (SSL). SSLprovides an encrypted network connection that prevents eavesdropping or tampering duringtransmission.
• Individual users can run their own servers and authorize them for their own use as trusted.
• System administrators can authorize one or more servers on the network as trusted for use by allusers.
• A server that has not been explicitly authorized is ignored, preventing any server impersonationsand similar attacks.
6.4.2. SystemTap Support for Unprivileged UsersFor security purposes, users in an enterprise setting are rarely given privileged (i.e. root or sudo)access to their own machines. In addition, full SystemTap functionality should also be restricted toprivileged users, as this can provide the ability to completely take control of a system.
SystemTap in Red Hat Enterprise Linux 6 features a new option to the SystemTap client: --unprivileged. This option allows an unprivileged user to run stap. Of course, several restrictionsapply to unprivileged users that attempt to run stap.
Note
An unprivileged user is a member of the group stapusr but is not a member of the groupstapdev (and is not root).
Before loading any kernel modules created by unprivileged users, SystemTap verifies the integrityof the module using standard digital (cryptographic) signing techniques. Each time the --unprivileged option is used, the server checks the script against the constraints imposed forunprivileged users. If the checks are successful, the server compiles the script and signs the resultingmodule using a self-generated certificate. When the client attempts to load the module, staprun firstverifies the signature of the module by checking it against a database of trusted signing certificatesmaintained and authorized by root.
Once a signed kernel module is successfully verified, staprun is assured that:
• The module was created using a trusted systemtap server implementation.

Chapter 6. Profiling
68
• The module was compiled using the --unprivileged option.
• The module meets the restrictions required for use by an unprivileged user.
• The module has not been tampered with since it was created.
6.4.3. SSL and Certificate ManagementSystemTap in Red Hat Enterprise Linux 6 implements authentication and security via certificates andpublic/private key pairs. It is the responsibility of the system administrator to add the credentials (i.e.certificates) of compile servers to a database of trusted servers. SystemTap uses this database toverify the identity of a compile server that the client attempts to access. Likewise, SystemTap alsouses this method to verify kernel modules created by compile servers using the --unprivilegedoption.
6.4.3.1. Authorizing Compile Servers for ConnectionThe first time a compile server is started on a server host, the compile server automatically generatesa certificate. This certificate verifies the compile server's identity during SSL authentication and modulesigning.
In order for clients to access the compile server (whether on the same server host or from a clientmachine), the system administrator must add the compile server's certificate to a database of trustedservers. Each client host intending to use compile servers maintains such a database. This allowsindividual users to customize their database of trusted servers, which can include a list of compileservers authorized for their own use only.
6.4.3.2. Authorizing Compile Servers for Module Signing (forUnprivileged Users)Unprivileged users can only load signed, authorized SystemTap kernel modules. For modules tobe recognized as such, they have to be created by a compile server whose certificate appears in adatabase of trusted signers; this database must be maintained on each host where the module will beloaded.
6.4.3.3. Automatic AuthorizationServers started using the stap-server initscript are automatically authorized to receive connectionsfrom all clients on the same host.
Servers started by other means are automatically authorized to receive connections from clients onthe same host run by the user who started the server. This was implemented with convenience inmind; users are automatically authorized to connect to a server they started themselves, provided thatboth client and server are running on the same host.
Whenever root starts a compile server, all clients running on the same host automatically recognizethe server as authorized. However, Red Hat advises that you refrain from doing so.
Similarly, a compile server initiated through stap-server is automatically authorized as a trustedsigner on the host in which it runs. If the compile server was initiated through other means, it is notautomatically authorized as such.
6.4.4. SystemTap DocumentationFor more detailed information about SystemTap, refer to the following books (also provided by RedHat):
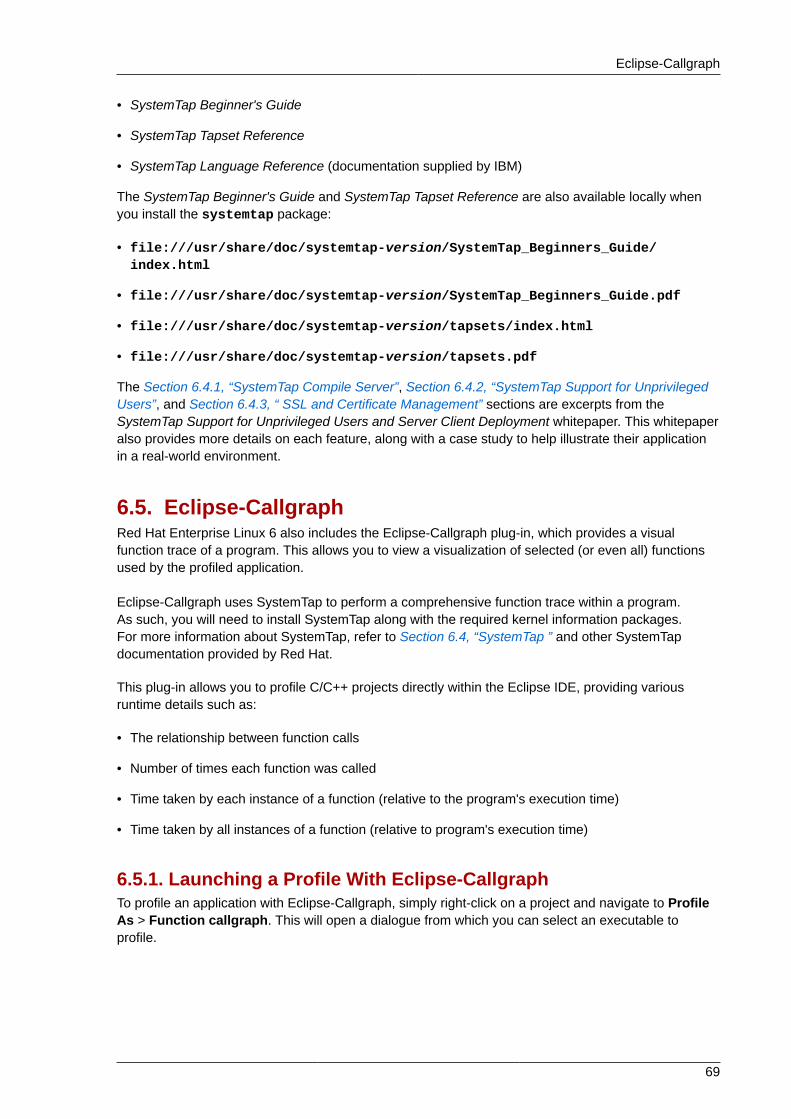
Eclipse-Callgraph
69
• SystemTap Beginner's Guide
• SystemTap Tapset Reference
• SystemTap Language Reference (documentation supplied by IBM)
The SystemTap Beginner's Guide and SystemTap Tapset Reference are also available locally whenyou install the systemtap package:
• file:///usr/share/doc/systemtap-version/SystemTap_Beginners_Guide/index.html
• file:///usr/share/doc/systemtap-version/SystemTap_Beginners_Guide.pdf
• file:///usr/share/doc/systemtap-version/tapsets/index.html
• file:///usr/share/doc/systemtap-version/tapsets.pdf
The Section 6.4.1, “SystemTap Compile Server”, Section 6.4.2, “SystemTap Support for UnprivilegedUsers”, and Section 6.4.3, “ SSL and Certificate Management” sections are excerpts from theSystemTap Support for Unprivileged Users and Server Client Deployment whitepaper. This whitepaperalso provides more details on each feature, along with a case study to help illustrate their applicationin a real-world environment.
6.5. Eclipse-CallgraphRed Hat Enterprise Linux 6 also includes the Eclipse-Callgraph plug-in, which provides a visualfunction trace of a program. This allows you to view a visualization of selected (or even all) functionsused by the profiled application.
Eclipse-Callgraph uses SystemTap to perform a comprehensive function trace within a program.As such, you will need to install SystemTap along with the required kernel information packages.For more information about SystemTap, refer to Section 6.4, “SystemTap ” and other SystemTapdocumentation provided by Red Hat.
This plug-in allows you to profile C/C++ projects directly within the Eclipse IDE, providing variousruntime details such as:
• The relationship between function calls
• Number of times each function was called
• Time taken by each instance of a function (relative to the program's execution time)
• Time taken by all instances of a function (relative to program's execution time)
6.5.1. Launching a Profile With Eclipse-CallgraphTo profile an application with Eclipse-Callgraph, simply right-click on a project and navigate to ProfileAs > Function callgraph. This will open a dialogue from which you can select an executable toprofile.

Chapter 6. Profiling
70
Figure 6.3. Eclipse-Callgraph Profile
After selecting an executable to profile, Eclipse-Callgraph will ask which files to probe. By default, allsource files in the project will be selected.
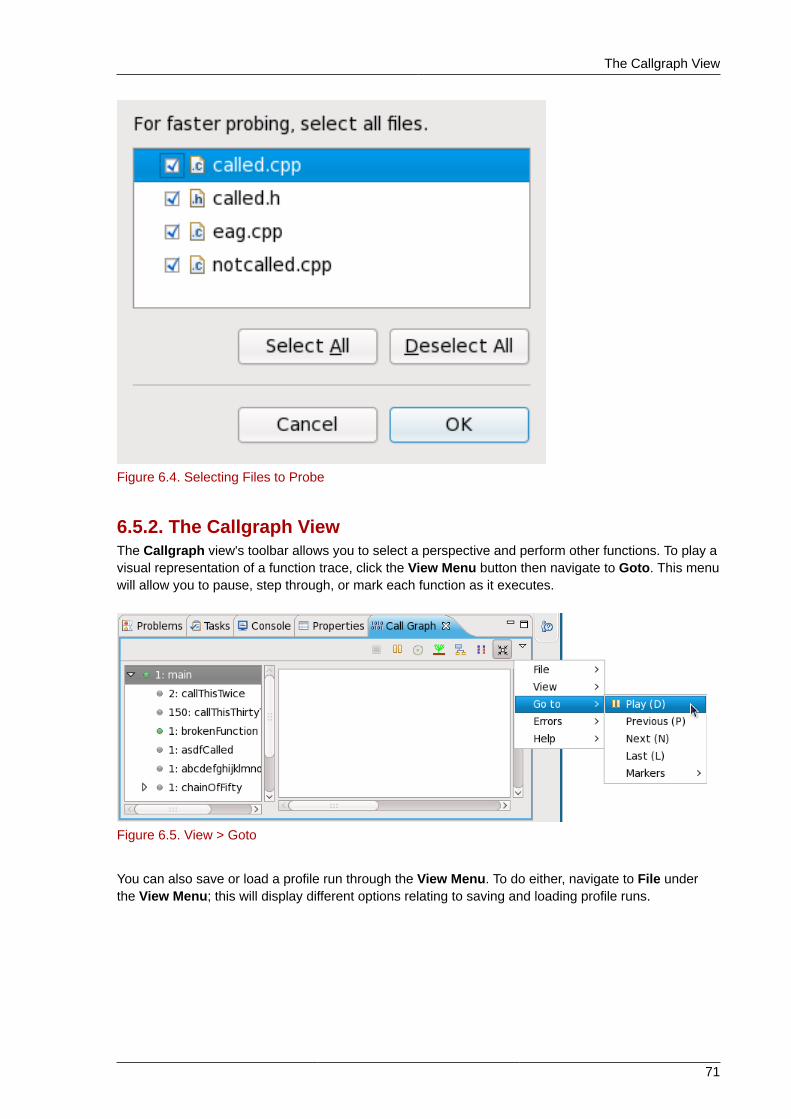
The Callgraph View
71
Figure 6.4. Selecting Files to Probe
6.5.2. The Callgraph ViewThe Callgraph view's toolbar allows you to select a perspective and perform other functions. To play avisual representation of a function trace, click the View Menu button then navigate to Goto. This menuwill allow you to pause, step through, or mark each function as it executes.
Figure 6.5. View > Goto
You can also save or load a profile run through the View Menu. To do either, navigate to File underthe View Menu; this will display different options relating to saving and loading profile runs.
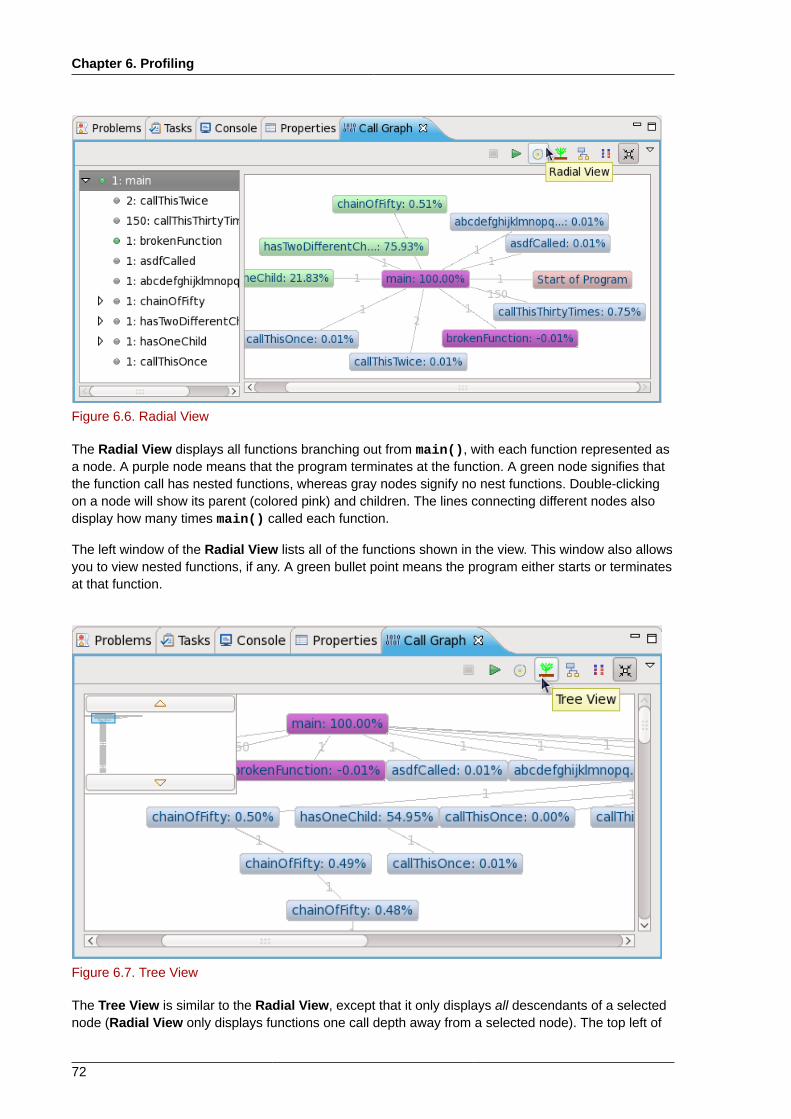
Chapter 6. Profiling
72
Figure 6.6. Radial View
The Radial View displays all functions branching out from main(), with each function represented asa node. A purple node means that the program terminates at the function. A green node signifies thatthe function call has nested functions, whereas gray nodes signify no nest functions. Double-clickingon a node will show its parent (colored pink) and children. The lines connecting different nodes alsodisplay how many times main() called each function.
The left window of the Radial View lists all of the functions shown in the view. This window also allowsyou to view nested functions, if any. A green bullet point means the program either starts or terminatesat that function.
Figure 6.7. Tree View
The Tree View is similar to the Radial View, except that it only displays all descendants of a selectednode (Radial View only displays functions one call depth away from a selected node). The top left of
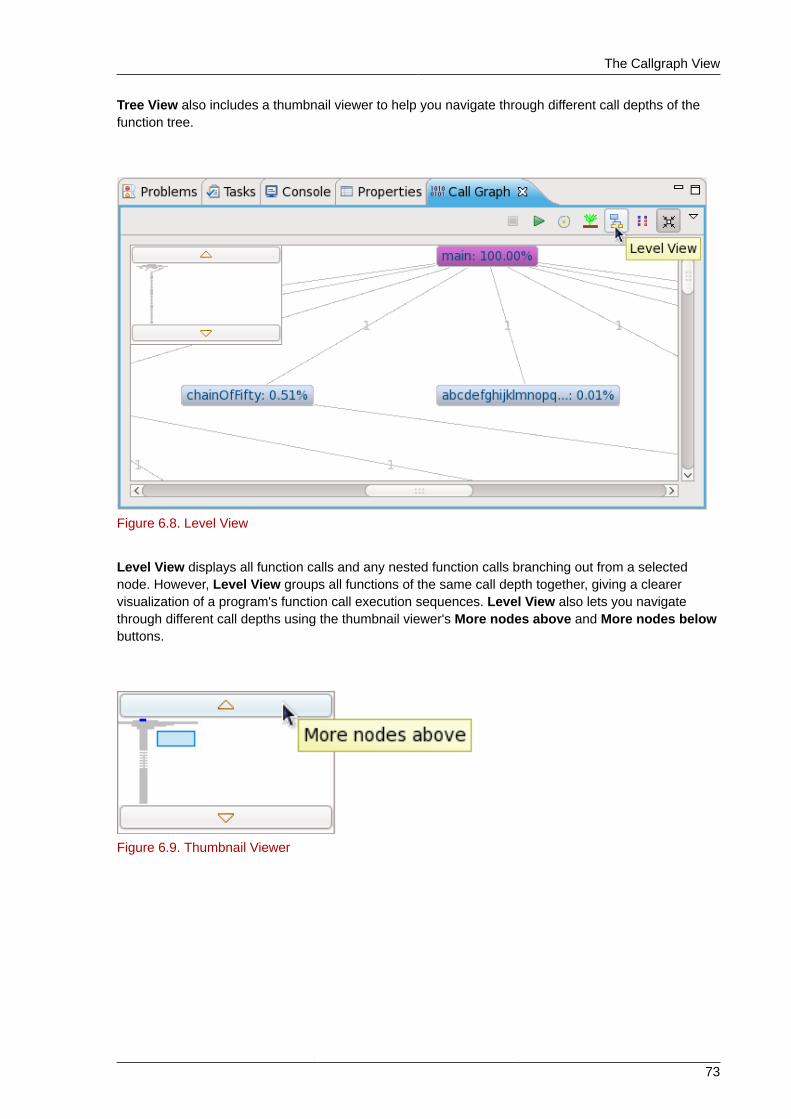
The Callgraph View
73
Tree View also includes a thumbnail viewer to help you navigate through different call depths of thefunction tree.
Figure 6.8. Level View
Level View displays all function calls and any nested function calls branching out from a selectednode. However, Level View groups all functions of the same call depth together, giving a clearervisualization of a program's function call execution sequences. Level View also lets you navigatethrough different call depths using the thumbnail viewer's More nodes above and More nodes belowbuttons.
Figure 6.9. Thumbnail Viewer
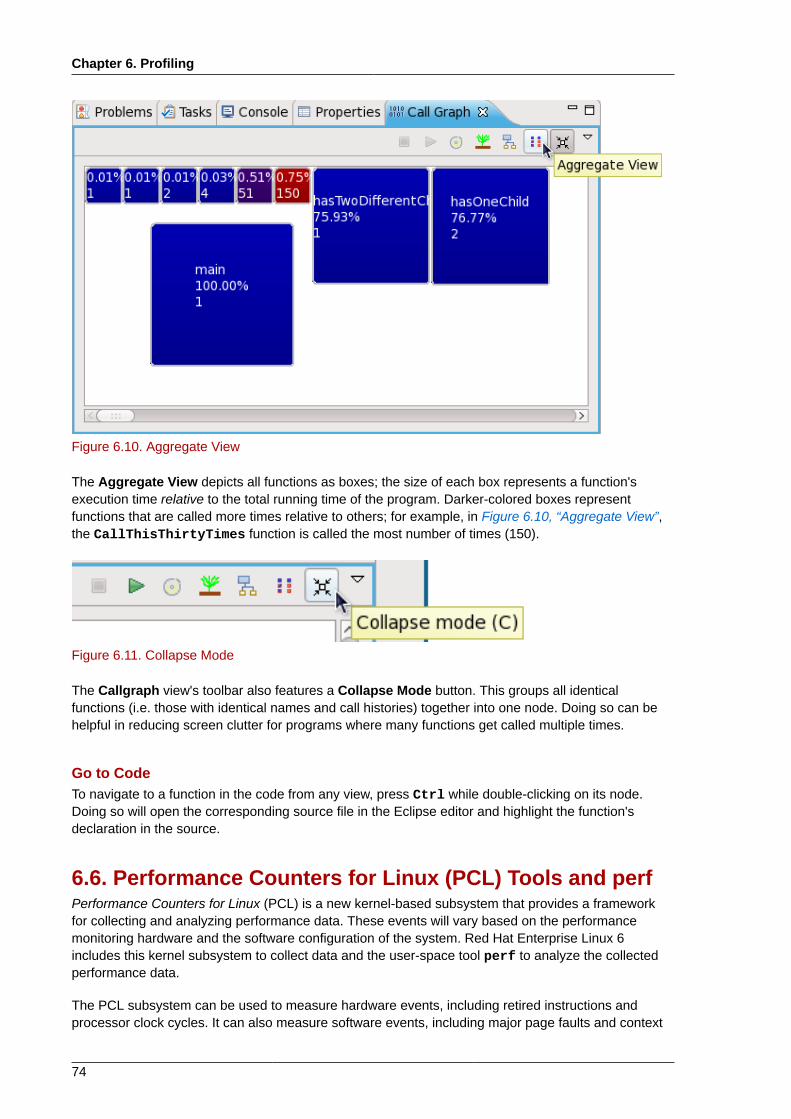
Chapter 6. Profiling
74
Figure 6.10. Aggregate View
The Aggregate View depicts all functions as boxes; the size of each box represents a function'sexecution time relative to the total running time of the program. Darker-colored boxes representfunctions that are called more times relative to others; for example, in Figure 6.10, “Aggregate View”,the CallThisThirtyTimes function is called the most number of times (150).
Figure 6.11. Collapse Mode
The Callgraph view's toolbar also features a Collapse Mode button. This groups all identicalfunctions (i.e. those with identical names and call histories) together into one node. Doing so can behelpful in reducing screen clutter for programs where many functions get called multiple times.
Go to CodeTo navigate to a function in the code from any view, press Ctrl while double-clicking on its node.Doing so will open the corresponding source file in the Eclipse editor and highlight the function'sdeclaration in the source.
6.6. Performance Counters for Linux (PCL) Tools and perfPerformance Counters for Linux (PCL) is a new kernel-based subsystem that provides a frameworkfor collecting and analyzing performance data. These events will vary based on the performancemonitoring hardware and the software configuration of the system. Red Hat Enterprise Linux 6includes this kernel subsystem to collect data and the user-space tool perf to analyze the collectedperformance data.
The PCL subsystem can be used to measure hardware events, including retired instructions andprocessor clock cycles. It can also measure software events, including major page faults and context

Perf Tool Commands
75
switches. For example, PCL counters can compute the Instructions Per Clock (IPC) from a process'scounts of instructions retired and processor clock cycles. A low IPC ratio indicates the code makespoor use of the CPU. Other hardware events can also be used to diagnose poor CPU performance.
Performance counters can also be configured to record samples. The relative frequency of samplescan be used to identify which regions of code have the greatest impact on performance.
6.6.1. Perf Tool CommandsUseful perf commands include the following:
perf statThis perf command provides overall statistics for common performance events, includinginstructions executed and clock cycles consumed. Options allow selection of events other than thedefault measurement events.
perf recordThis perf command records performance data into a file which can be later analyzed using perfreport.
perf reportThis perf command reads the performance data from a file and analyzes the recorded data.
perf listThis perf command lists the events available on a particular machine. These events will varybased on the performance monitoring hardware and the software configuration of the system.
Use perf help to obtain a complete list of perf commands. To retrieve man page information oneach perf command, use perf help command.
6.6.2. Using PerfUsing the basic PCL infrastructure for collecting statistics or samples of program execution is relativelystraightforward. This section provides simple examples of overall statistics and sampling.
To collect statistics on make and its children, use the following command:
perf stat -- make all
The perf command will collect a number of different hardware and software counters. It will then printthe following information:
Performance counter stats for 'make all':
244011.782059 task-clock-msecs # 0.925 CPUs 53328 context-switches # 0.000 M/sec 515 CPU-migrations # 0.000 M/sec 1843121 page-faults # 0.008 M/sec 789702529782 cycles # 3236.330 M/sec 1050912611378 instructions # 1.331 IPC 275538938708 branches # 1129.203 M/sec 2888756216 branch-misses # 1.048 % 4343060367 cache-references # 17.799 M/sec 428257037 cache-misses # 1.755 M/sec
263.779192511 seconds time elapsed

Chapter 6. Profiling
76
The perf tool can also record samples. For example, to record data on the make command and itschildren, use:
perf record -- make all
This will print out the file in which the samples are stored, along with the number of samples collected:
[ perf record: Woken up 42 times to write data ][ perf record: Captured and wrote 9.753 MB perf.data (~426109 samples) ]
You can then analyze perf.data to determine the relative frequency of samples. The report outputincludes the command, object, and function for the samples. Use perf report to output an analysisof perf.data. For example, the following command produces a report of the executable thatconsumes the most time:
perf report --sort=comm
The resulting output:
# Samples: 1083783860000## Overhead Command# ........ ...............# 48.19% xsltproc 44.48% pdfxmltex 6.01% make 0.95% perl 0.17% kernel-doc 0.05% xmllint 0.05% cc1 0.03% cp 0.01% xmlto 0.01% sh 0.01% docproc 0.01% ld 0.01% gcc 0.00% rm 0.00% sed 0.00% git-diff-files 0.00% bash 0.00% git-diff-index
The column on the left shows the relative frequency of the samples. This output shows that makespends most of this time in xsltproc and the pdfxmltex. To reduce the time for the make tocomplete, focus on xsltproc and pdfxmltex. To list of the functions executed by xsltproc, run:
perf report -n --comm=xsltproc
This would generate:
comm: xsltproc# Samples: 472520675377## Overhead Samples Shared Object Symbol# ........ .......... ............................. ......# 45.54%215179861044 libxml2.so.2.7.6 [.] xmlXPathCmpNodesExt

ftrace
77
11.63%54959620202 libxml2.so.2.7.6 [.] xmlXPathNodeSetAdd__internal_alias 8.60%40634845107 libxml2.so.2.7.6 [.] xmlXPathCompOpEval 4.63%21864091080 libxml2.so.2.7.6 [.] xmlXPathReleaseObject 2.73%12919672281 libxml2.so.2.7.6 [.] xmlXPathNodeSetSort__internal_alias 2.60%12271959697 libxml2.so.2.7.6 [.] valuePop 2.41%11379910918 libxml2.so.2.7.6 [.] xmlXPathIsNaN__internal_alias 2.19%10340901937 libxml2.so.2.7.6 [.] valuePush__internal_alias
6.7. ftraceThe ftrace framework provides users with several tracing capabilities, accessible through aninterface much simpler than SystemTap's. This framework uses a set of virtual files in the debugfs filesystem; these files enable specific tracers. The ftrace function tracer simply outputs each functioncalled in the kernel in real time; other tracers within the ftrace framework can also be used toanalyze wakeup latency, task switches, kernel events, and the like.
You can also add new tracers for ftrace, making it a flexible solution for analyzing kernel events.The ftrace framework is useful for debugging or analyzing latencies and performance issues thattake place outside of user-space. Unlike other profilers documented in this guide, ftrace is a built-infeature of the kernel.
6.7.1. Using ftraceThe Red Hat Enterprise Linux 6 kernels have been configured with the CONFIG_FTRACE=y option.This option provides the interfaces needed by ftrace. To use ftrace, mount the debugfs filesystem as follows:
mount -t debugfs nodev /sys/kernel/debug
All the ftrace utilities are located in /sys/kernel/debug/tracing/. View the /sys/kernel/debug/tracing/available_tracers file to find out what tracers are available for your kernel:
cat /sys/kernel/debug/tracing/available_tracers
power wakeup irqsoff function sysprof sched_switch initcall nop
To use a specific tracer, write it to /sys/kernel/debug/tracing/current_tracer. Forexample, wakeup traces and records the maximum time it takes for the highest-priority task to bescheduled after the task wakes up. To use it:
echo wakeup > /sys/kernel/debug/tracing/current_tracer
To start or stop tracing, write to /sys/kernel/debug/tracing/tracing_on, as in:
echo 1 > /sys/kernel/debug/tracing/tracing_on (enables tracing)
echo 0 > /sys/kernel/debug/tracing/tracing_on (disables tracing)
The results of the trace can be viewed from the following files:
/sys/kernel/debug/tracing/traceThis file contains human-readable trace output.
/sys/kernel/debug/tracing/trace_pipeThis file contains the same output as /sys/kernel/debug/tracing/trace, but is meant tobe piped into a command. Unlike /sys/kernel/debug/tracing/trace, reading from this fileconsumes its output.
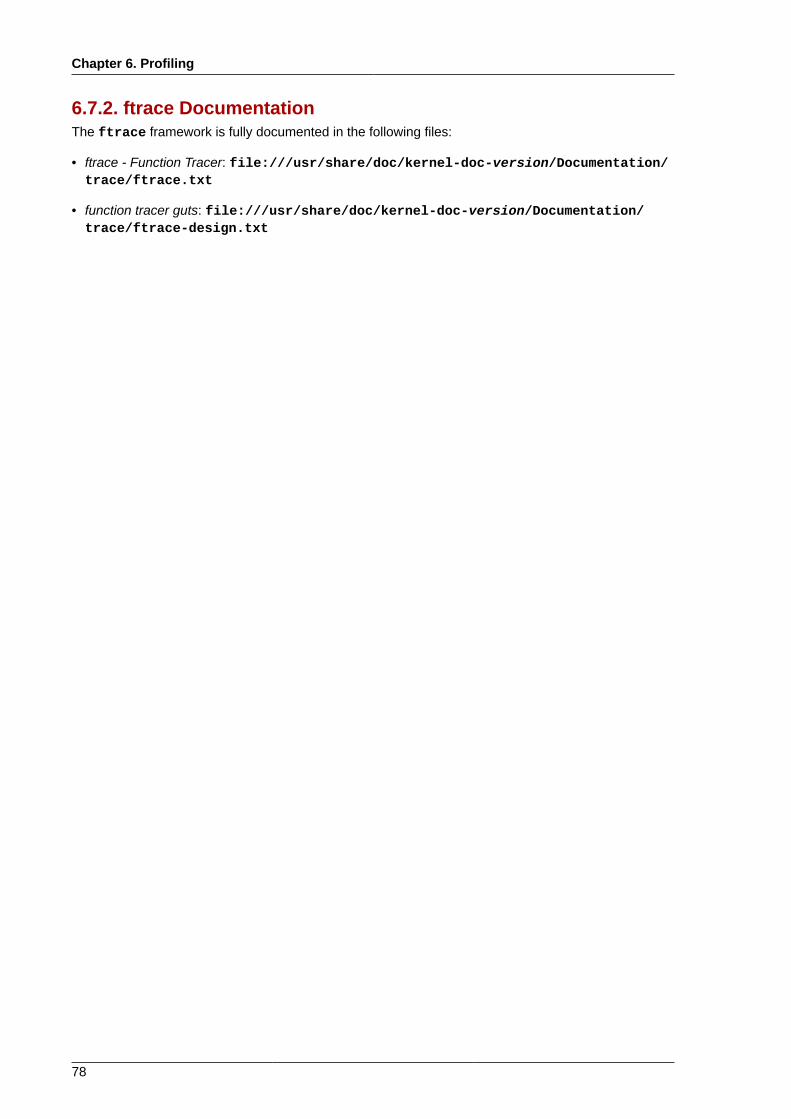
Chapter 6. Profiling
78
6.7.2. ftrace DocumentationThe ftrace framework is fully documented in the following files:
• ftrace - Function Tracer: file:///usr/share/doc/kernel-doc-version/Documentation/trace/ftrace.txt
• function tracer guts: file:///usr/share/doc/kernel-doc-version/Documentation/trace/ftrace-design.txt

79
Appendix A. Revision HistoryRevision 1.0 Thu Oct 08 2009 Don Domingo [email protected]
draft push

80
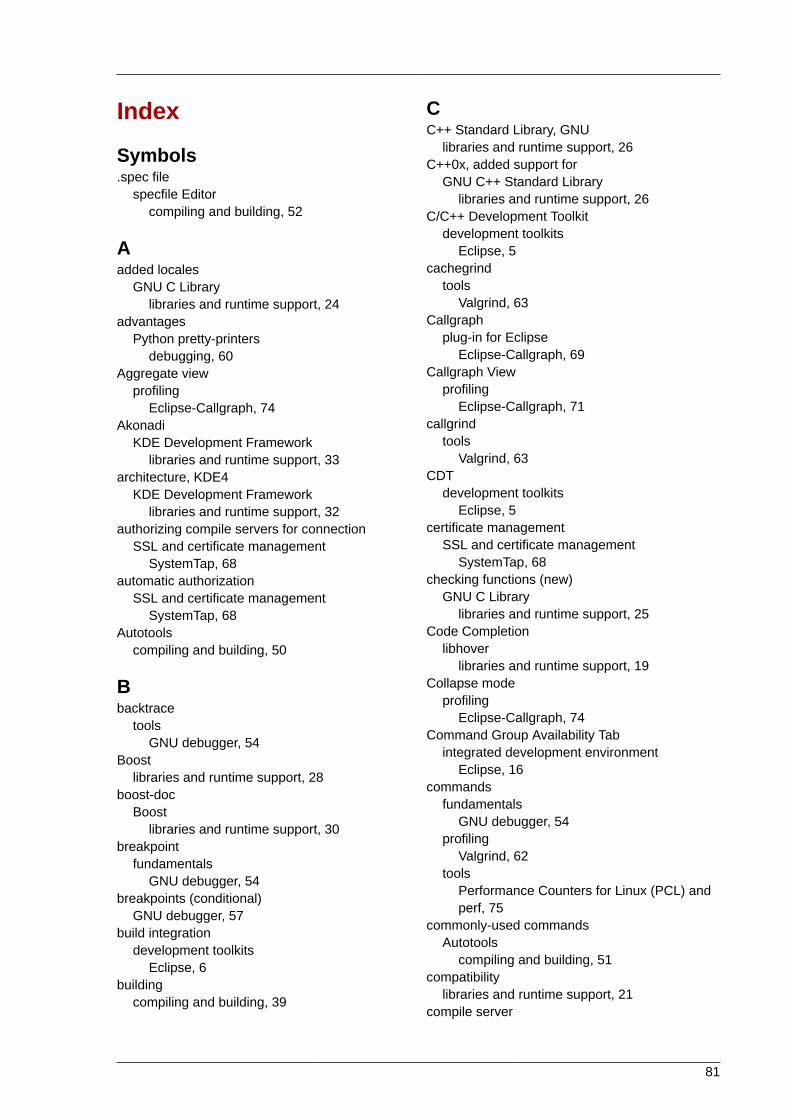
81
Index
Symbols.spec file
specfile Editorcompiling and building, 52
Aadded locales
GNU C Librarylibraries and runtime support, 24
advantagesPython pretty-printers
debugging, 60Aggregate view
profilingEclipse-Callgraph, 74
AkonadiKDE Development Framework
libraries and runtime support, 33architecture, KDE4
KDE Development Frameworklibraries and runtime support, 32
authorizing compile servers for connectionSSL and certificate management
SystemTap, 68automatic authorization
SSL and certificate managementSystemTap, 68
Autotoolscompiling and building, 50
Bbacktrace
toolsGNU debugger, 54
Boostlibraries and runtime support, 28
boost-docBoost
libraries and runtime support, 30breakpoint
fundamentalsGNU debugger, 54
breakpoints (conditional)GNU debugger, 57
build integrationdevelopment toolkits
Eclipse, 6building
compiling and building, 39
CC++ Standard Library, GNU
libraries and runtime support, 26C++0x, added support for
GNU C++ Standard Librarylibraries and runtime support, 26
C/C++ Development Toolkitdevelopment toolkits
Eclipse, 5cachegrind
toolsValgrind, 63
Callgraphplug-in for Eclipse
Eclipse-Callgraph, 69Callgraph View
profilingEclipse-Callgraph, 71
callgrindtools
Valgrind, 63CDT
development toolkitsEclipse, 5
certificate managementSSL and certificate management
SystemTap, 68checking functions (new)
GNU C Librarylibraries and runtime support, 25
Code Completionlibhover
libraries and runtime support, 19Collapse mode
profilingEclipse-Callgraph, 74
Command Group Availability Tabintegrated development environment
Eclipse, 16commands
fundamentalsGNU debugger, 54
profilingValgrind, 62
toolsPerformance Counters for Linux (PCL) andperf, 75
commonly-used commandsAutotools
compiling and building, 51compatibility
libraries and runtime support, 21compile server

Index
82
SystemTap, 67compiling a C Hello World program
usageGCC, 44
compiling a C++ Hello World programusage
GCC, 45compiling and building
Autotools, 50commonly-used commands, 51configuration script, 51documentation, 52plug-in for Eclipse, 51templates (supported), 51
distributed compiling, 50GNU Compiler Collection, 39
documentation, 50required packages, 43usage, 43
introduction, 39required packages, 50specfile Editor, 52
plug-in for Eclipse, 52conditional breakpoints
GNU debugger, 57configuration script
Autotoolscompiling and building, 51
configuring keyboard shortcutsintegrated development environment
Eclipse, 13connection authorization (compile servers)
SSL and certificate managementSystemTap, 68
Console Viewuser interface
Eclipse, 9Contents (Help Contents)
Help systemEclipse, 4
continuetools
GNU debugger, 55Customize Perspective Menu
integrated development environmentEclipse, 14
Ddebugfs file system
profilingftrace, 77
debuggingdebuginfo-packages, 53
installation, 53
GNU debugger, 53fundamental mechanisms, 53GDB, 53requirements, 54
introduction, 53Python pretty-printers, 59
advantages, 60debugging output (formatted), 59documentation, 60pretty-printers, 59
variable tracking at assignments (VTA), 59debugging a Hello World program
usageGNU debugger, 55
debugging output (formatted)Python pretty-printers
debugging, 59debuginfo-packages
debugging, 53default
user interfaceEclipse, 7
development toolkitsEclipse, 5
distributed compilingcompiling and building, 50
documentationAutotools
compiling and building, 52Boost
libraries and runtime support, 30GNU C Library
libraries and runtime support, 25GNU C++ Standard Library
libraries and runtime support, 27GNU Compiler Collection
compiling and building, 50GNU debugger, 58Java
libraries and runtime support, 35KDE Development Framework
libraries and runtime support, 34OProfile
profiling, 66Perl
libraries and runtime support, 38profiling
ftrace, 78Python
libraries and runtime support, 34Python pretty-printers
debugging, 60Qt
libraries and runtime support, 32

83
Rubylibraries and runtime support, 36
SystemTapprofiling, 68
Valgrindprofiling, 64
DTK (development toolkits)development toolkits
Eclipse, 5Dynamic Help
Help systemEclipse, 5
EEclipse
development toolkits, 5build integration, 6C/C++ Development Toolkit, 5CDT, 5DTK (development toolkits), 5hot patch, 6Java Development Toolkit, 5JDT, 5
Help system, 3Contents (Help Contents), 4Dynamic Help, 5Menu (Help Menu), 4Workbench User Guide, 5
integrated development environment, 7Command Group Availability Tab, 16configuring keyboard shortcuts, 13Customize Perspective Menu, 14IDE (integrated development environment),7Keyboard Shortcuts Menu, 13menu (Main Menu), 7Menu Visibility Tab, 15perspectives, 7Quick Access Menu, 12Shortcuts Tab, 17Tool Bar Visibility, 14useful hints, 11user interface, 7workbench, 7
introduction, 1libhover
libraries and runtime support, 17profiling, 61projects, 1
New Project Wizard, 2technical overview, 1workspace (overview), 1Workspace Launcher, 1
user interface
Console View, 9default, 7Editor, 8Outline Window, 9Problems View, 11Project Explorer, 8quick fix (Problems View), 11Tasks Properties, 10Tasks View, 9tracked comments, 10View Menu (button), 9
Eclipse-Callgraphplug-in for Eclipse, 69
Callgraph, 69profiling, 69
profilingAggregate view, 74Callgraph View, 71Collapse mode, 74Go to Code, 74Level view, 73Radial view, 72SystemTap, 69Thumbnail viewer, 73Tree view, 72usage, 69
Editoruser interface
Eclipse, 8Emacs and GDB
GNU debugger, 58execution (forked)
GNU debugger, 58
Ffeedback
contact information for this manual, xfinish
toolsGNU debugger, 55
forked executionGNU debugger, 58
formatted debugging outputPython pretty-printers
debugging, 59framework (ftrace)
profilingftrace, 77
ftraceprofiling, 77
debugfs file system, 77documentation, 78framework (ftrace), 77usage, 77

Index
84
function tracerprofiling
ftrace, 77fundamental commands
fundamentalsGNU debugger, 54
fundamental mechanismsGNU debugger
debugging, 53fundamentals
GNU debugger, 54
Ggcc
GNU Compiler Collectioncompiling and building, 39
GCC Cusage
compiling a C Hello World program, 44GCC C++
usagecompiling a C++ Hello World program, 45
GDBGNU debugger
debugging, 53gem2rpm
Rubylibraries and runtime support, 36
glibclibraries and runtime support, 23
GNU C Librarylibraries and runtime support, 23
GNU C++ Standard Librarylibraries and runtime support, 26
GNU Compiler Collectioncompiling and building, 39
GNU debuggerconditional breakpoints, 57debugging, 53documentation, 58Emacs and GDB, 58execution (forked), 58forked execution, 58fundamentals, 54
breakpoint, 54commands, 54halting an executable, 55inspecting the state of an executable, 54starting an executable, 54
interfaces (CLI and machine), 58thread and threaded debugging, 58tools, 54
backtrace, 54continue, 55
finish, 55help, 55list, 54next, 55print, 54quit, 55step, 55
usage, 55debugging a Hello World program, 55
variations and environments, 58Go to Code
profilingEclipse-Callgraph, 74
Hhalting an executable
fundamentalsGNU debugger, 55
header filesGNU C Library
libraries and runtime support, 23helgrind
toolsValgrind, 63
helpgetting help, ixtools
GNU debugger, 55Help system
Eclipse, 3hints
integrated development environmentEclipse, 11
host (compile server host)compile server
SystemTap, 67hot patch
development toolkitsEclipse, 6
Hover Helplibhover
libraries and runtime support, 18
IIDE (integrated development environment)
integrated development environmentEclipse, 7
indexinglibhover
libraries and runtime support, 17inspecting the state of an executable
fundamentalsGNU debugger, 54

85
installationdebuginfo-packages
debugging, 53integrated development environment
Eclipse, 7interfaces (added new)
GNU C Librarylibraries and runtime support, 24
interfaces (CLI and machine)GNU debugger, 58
introductioncompiling and building, 39debugging, 53Eclipse, 1libraries and runtime support, 21profiling, 61
SystemTap, 66ISO 14482 Standard C++ library
GNU C++ Standard Librarylibraries and runtime support, 26
ISO C++ TR1 elements, added support forGNU C++ Standard Library
libraries and runtime support, 26
JJava
libraries and runtime support, 35Java Development Toolkit
development toolkitsEclipse, 5
JDTdevelopment toolkits
Eclipse, 5
KKDE Development Framework
libraries and runtime support, 32KDE4 architecture
KDE Development Frameworklibraries and runtime support, 32
kdelibs-develKDE Development Framework
libraries and runtime support, 32kernel information packages
profilingSystemTap, 66
Keyboard Shortcuts Menuintegrated development environment
Eclipse, 13KHTML
KDE Development Frameworklibraries and runtime support, 33
KIO
KDE Development Frameworklibraries and runtime support, 33
KJSKDE Development Framework
libraries and runtime support, 33KNewStuff2
KDE Development Frameworklibraries and runtime support, 34
KXMLGUIKDE Development Framework
libraries and runtime support, 33
LLevel view
profilingEclipse-Callgraph, 73
libhoverlibraries and runtime support, 17
librariesruntime support, 21
libraries and runtime supportBoost, 28
boost-doc, 30documentation, 30message passing interface (MPI), 29meta-package, 28MPICH2, 29new libraries, 29Open MPI, 29sub-packages, 28updates, 29
C++ Standard Library, GNU, 26compatibility, 21glibc, 23GNU C Library, 23
added new interfaces, 24checking functions (new), 25documentation, 25header files, 23interfaces (added new), 24Linux-specific interfaces (added), 24locales (added), 24updates, 23
GNU C++ Standard Library, 26C++0x, added support for, 26documentation, 27ISO 14482 Standard C++ library, 26ISO C++ TR1 elements, added support for,26libstdc++-devel, 26libstdc++-docs, 27Standard Template Library, 26updates, 26
introduction, 21
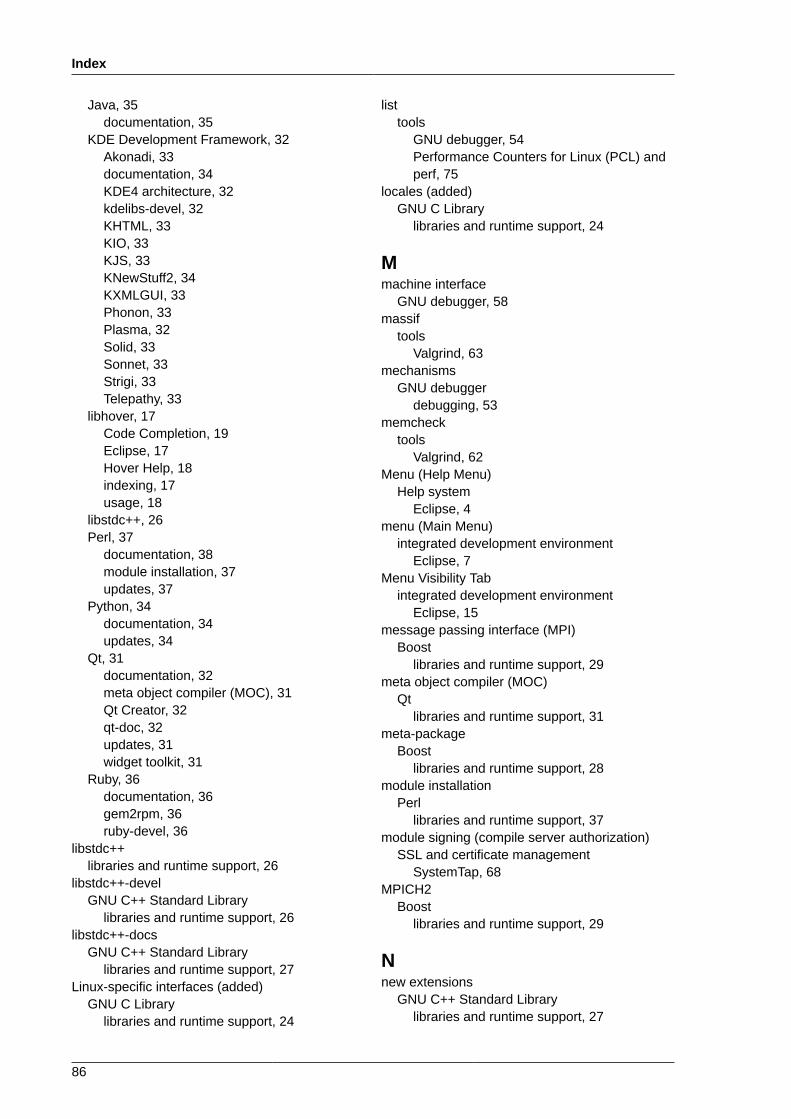
Index
86
Java, 35documentation, 35
KDE Development Framework, 32Akonadi, 33documentation, 34KDE4 architecture, 32kdelibs-devel, 32KHTML, 33KIO, 33KJS, 33KNewStuff2, 34KXMLGUI, 33Phonon, 33Plasma, 32Solid, 33Sonnet, 33Strigi, 33Telepathy, 33
libhover, 17Code Completion, 19Eclipse, 17Hover Help, 18indexing, 17usage, 18
libstdc++, 26Perl, 37
documentation, 38module installation, 37updates, 37
Python, 34documentation, 34updates, 34
Qt, 31documentation, 32meta object compiler (MOC), 31Qt Creator, 32qt-doc, 32updates, 31widget toolkit, 31
Ruby, 36documentation, 36gem2rpm, 36ruby-devel, 36
libstdc++libraries and runtime support, 26
libstdc++-develGNU C++ Standard Library
libraries and runtime support, 26libstdc++-docs
GNU C++ Standard Librarylibraries and runtime support, 27
Linux-specific interfaces (added)GNU C Library
libraries and runtime support, 24
listtools
GNU debugger, 54Performance Counters for Linux (PCL) andperf, 75
locales (added)GNU C Library
libraries and runtime support, 24
Mmachine interface
GNU debugger, 58massif
toolsValgrind, 63
mechanismsGNU debugger
debugging, 53memcheck
toolsValgrind, 62
Menu (Help Menu)Help system
Eclipse, 4menu (Main Menu)
integrated development environmentEclipse, 7
Menu Visibility Tabintegrated development environment
Eclipse, 15message passing interface (MPI)
Boostlibraries and runtime support, 29
meta object compiler (MOC)Qt
libraries and runtime support, 31meta-package
Boostlibraries and runtime support, 28
module installationPerl
libraries and runtime support, 37module signing (compile server authorization)
SSL and certificate managementSystemTap, 68
MPICH2Boost
libraries and runtime support, 29
Nnew extensions
GNU C++ Standard Librarylibraries and runtime support, 27
87
new librariesBoost
libraries and runtime support, 29New Project Wizard
projectsEclipse, 2
nexttools
GNU debugger, 55
Oopannotate
toolsOProfile, 64
oparchivetools
OProfile, 65opcontrol
toolsOProfile, 64
Open MPIBoost
libraries and runtime support, 29opgprof
toolsOProfile, 65
opreporttools
OProfile, 64OProfile
profiling, 64documentation, 66usage, 65
tools, 64opannotate, 64oparchive, 65opcontrol, 64opgprof, 65opreport, 64
oprofiledOProfile
profiling, 64Outline Window
user interfaceEclipse, 9
Pperf
profilingPerformance Counters for Linux (PCL) andperf, 74
usage
Performance Counters for Linux (PCL) andperf, 75
Performance Counters for Linux (PCL) and perfprofiling, 74
subsystem (PCL), 74tools, 75
commands, 75list, 75record, 75report, 75stat, 75
usage, 75perf, 75
Perllibraries and runtime support, 37
perspectivesintegrated development environment
Eclipse, 7Phonon
KDE Development Frameworklibraries and runtime support, 33
PlasmaKDE Development Framework
libraries and runtime support, 32plug-in for Eclipse
Autotoolscompiling and building, 51
Eclipse-Callgraph, 69profiling
Valgrind, 63specfile Editor
compiling and building, 52pretty-printers
Python pretty-printersdebugging, 59
printtools
GNU debugger, 54Problems View
user interfaceEclipse, 11
Profile AsEclipse
profiling, 61Profile Configuration Menu
Eclipseprofiling, 62
profilingEclipse, 61
Profile As, 61Profile Configuration Menu, 62
ftrace, 77introduction, 61OProfile, 64

Index
88
oprofiled, 64Performance Counters for Linux (PCL) andperf, 74plug-in for Eclipse
Eclipse-Callgraph, 69SystemTap, 66Valgrind, 62
Project Exploreruser interface
Eclipse, 8projects
Eclipse, 1Python
libraries and runtime support, 34Python pretty-printers
debugging, 59
QQt
libraries and runtime support, 31Qt Creator
Qtlibraries and runtime support, 32
qt-docQt
libraries and runtime support, 32Quick Access Menu
integrated development environmentEclipse, 12
quick fix (Problems View)user interface
Eclipse, 11quit
toolsGNU debugger, 55
RRadial view
profilingEclipse-Callgraph, 72
recordtools
Performance Counters for Linux (PCL) andperf, 75
reporttools
Performance Counters for Linux (PCL) andperf, 75
required packagescompiling and building, 50GNU Compiler Collection
compiling and building, 43profiling
SystemTap, 66requirements
GNU debuggerdebugging, 54
Rubylibraries and runtime support, 36
ruby-develRuby
libraries and runtime support, 36runtime support
libraries, 21
Sscripts (SystemTap scripts)
profilingSystemTap, 66
setuplibhover
libraries and runtime support, 18Shortcuts Tab
integrated development environmentEclipse, 17
signed modulesSSL and certificate management
SystemTap, 68unprivileged user support
SystemTap, 67Solid
KDE Development Frameworklibraries and runtime support, 33
SonnetKDE Development Framework
libraries and runtime support, 33specfile Editor
compiling and building, 52SSL and certificate management
SystemTap, 68Standard Template Library
GNU C++ Standard Librarylibraries and runtime support, 26
starting an executablefundamentals
GNU debugger, 54stat
toolsPerformance Counters for Linux (PCL) andperf, 75
steptools
GNU debugger, 55Strigi
KDE Development Frameworklibraries and runtime support, 33
sub-packages
89
Boostlibraries and runtime support, 28
subsystem (PCL)profiling
Performance Counters for Linux (PCL) andperf, 74
supported templatesAutotools
compiling and building, 51SystemTap
compile server, 67host (compile server host), 67
profiling, 66documentation, 68Eclipse-Callgraph, 69introduction, 66kernel information packages, 66required packages, 66scripts (SystemTap scripts), 66
SSL and certificate management, 68automatic authorization, 68connection authorization (compile servers),68module signing (compile serverauthorization), 68
unprivileged user support, 67signed modules, 67
TTasks Properties
user interfaceEclipse, 10
Tasks Viewuser interface
Eclipse, 9technical overview
projectsEclipse, 1
TelepathyKDE Development Framework
libraries and runtime support, 33templates (supported)
Autotoolscompiling and building, 51
thread and threaded debuggingGNU debugger, 58
Thumbnail viewerprofiling
Eclipse-Callgraph, 73Tool Bar Visibility
integrated development environmentEclipse, 14
toolsGNU debugger, 54
OProfile, 64Performance Counters for Linux (PCL) andperf, 75profiling
Valgrind, 62Valgrind, 62
tracked commentsuser interface
Eclipse, 10Tree view
profilingEclipse-Callgraph, 72
Uunprivileged user support
SystemTap, 67unprivileged users
unprivileged user supportSystemTap, 67
updatesBoost
libraries and runtime support, 29GNU C Library
libraries and runtime support, 23GNU C++ Standard Library
libraries and runtime support, 26Perl
libraries and runtime support, 37Python
libraries and runtime support, 34Qt
libraries and runtime support, 31usage
GNU Compiler Collectioncompiling and building, 43
GNU debugger, 55fundamentals, 54
libhoverlibraries and runtime support, 18
Performance Counters for Linux (PCL) andperf, 75profiling
Eclipse-Callgraph, 69ftrace, 77OProfile, 65
Valgrindprofiling, 63
useful hintsintegrated development environment
Eclipse, 11user interface
integrated development environmentEclipse, 7

Index
90
VValgrind
profiling, 62commands, 62documentation, 64plug-in for Eclipse, 63tools, 62usage, 63
toolscachegrind, 63callgrind, 63helgrind, 63massif, 63memcheck, 62
variable tracking at assignments (VTA)debugging, 59
variations and environmentsGNU debugger, 58
View Menu (button)user interface
Eclipse, 9View, Callgraph
profilingEclipse-Callgraph, 71
Wwidget toolkit
Qtlibraries and runtime support, 31
workbenchintegrated development environment
Eclipse, 7Workbench User Guide
Help systemEclipse, 5
workspace (overview)projects
Eclipse, 1Workspace Launcher
projectsEclipse, 1