Devaluation of indian currency and its implications
67
-
Upload
pradip-malge -
Category
Economy & Finance
-
view
4.155 -
download
1
Transcript of Devaluation of indian currency and its implications


FIRST SEMINAR
ON
PRESENTED BY
PRADEEP L M
PGS12AGR5751
MAJOR ADVISERDR.G N KULKARNI
(ASSO.PROF.DEPT OF AGRIL ECONOMICS ,AC DHARWAD)

CONTENTS
• Introduction
• Brief history of Indian rupee
• History of devaluation
• Exchange rate mechanism
• Causes of devaluation of Indian rupee
• Implications of devaluation of Indian rupee
• Policy options with RBI to control devaluation of rupee
• Role of GOI to control rupee devaluation
• Conclusion

INTRODUCTION
• Devaluation means decreasing the value of nation's currency relative to gold or the currencies of other
nations.
• In common modern usage, it specifically implies an official lowering of the value of a country's currency
within a fixed exchange rate system, by which the monetary authority formally sets a new fixed rate
with respect to a foreign currency.
• For example, Rs 25= 1 $.
Rs. 30 = 1$
• Devaluation is usually undertaken as a means of correcting a deficit in the balance of payments.
• Almost all the countries of the world have devalued their currencies at one time or the other with a view
to achieving certain economic objectives
• During the great depression of 1930 devaluation was carried by most countries of the world for the
correcting their over-valuation

Main objectives of devaluation
1. To encourage exports
2. To Discourage the imports
3. To correct the balance of payment

History of the rupee
India was one of the first issuers of coins (6th Century BC)
The word rūpya is derived from sanskrit which means "a coin of silver“
The silver coin remained in use during the Mayura,Mughal Era, Maratha Era as well as
in British India.
Acute shortage of silver during the First Word war, led to the introduction of paper currency
Among the earliest issues of paper rupees include; the Bank of Hindustan (1770–
1832), the General Bank of Bengal and Bihar (1773–75), and the Bengal Bank (1784–91).

The rupee was subdivided into 16 annas.
Each anna was subdivided into either 4 paisas.
So One rupee was equal to 16 Annas, 64 Paises.
In 1957, decimalization occurred and the rupee was divided into 100 Naye Paise.
After a few years, the initial "Naye" was dropped.
Stainless steel coinage of 10, 25 and 50 paise, was introduced in 1988 and of one
rupee in 1992.

Udaya Kumar Dharmalingam, the man who designed the rupee symbol
Launched on 8 July 2011

HISTORY OF RUPEE DEVALUATION
• In early controlled exchange rate
regime, with respect to USD, the rupee
exchange rate was around Rs 4.00 in the
1950s, Rs 5.00 in the 60s, Rs 7.00 in the
70s, and Rs 8.00in the 80s.
• In the era of 90s, the rupee moved to Rs
20s and Rs 40 in the next decade of 2000.
• During this period, the Government had
declared two major devaluation in the year
of 1996 and 1991.
• The rupee was devalued first in 1966 by
57% from Rs 4.76 to Rs 7.50 against the
US dollar.
• In the year 1991, the rupee was again
devalued by 19.5% from Rs 20.5 to Rs
24.5 against the US dollar

The 1966 devaluation was the result of the first major financial crisis the
government faced due to:
•Continued trade deficits
•The Indo-Pakistani War of 1965
•US and other countries friendly towards Pakistan to withdraw foreign aid to
India
•The drought of 1965/1966 which resulted in a sharp rise in prices.
.

1991 Economic crisis
The trade deficit in 1991 was US $9.44 billion
The current account deficit was US $9.7 billion
The gulf war led to much higher imports due to rise in oil prices.
Cost pull inflation
Political and economical instability
Depleting foreign exchange reserve

2013 Devaluation
India's Currency, The Rupee, Has Plummeted To A Record Low Against The Dollar.
(Indian Rupee = American Dollar)
* 2013 (Aug 28)


YearExchange rate
(INR per USD)
1947 4.79
1966 7.5
1975 8.39
1980 7.86
1985 12.38
1990 17.01
1995 32.42
2000 43.5

2005 (Jan) 43.47
2006 (Jan) 45.19
2007 (Jan) 39.42
2008 (October) 48.88
2009 (October) 46.37
2010 (January 22) 46.21
2011 (April) 44.17
2011 (September 21) 48.24
2011 (November 17) 55.39

2012 (June 22) 57.15
2013 (May 15) 54.73
2013 (Aug 28) 68.83
2013 (Dec 6) 61.68

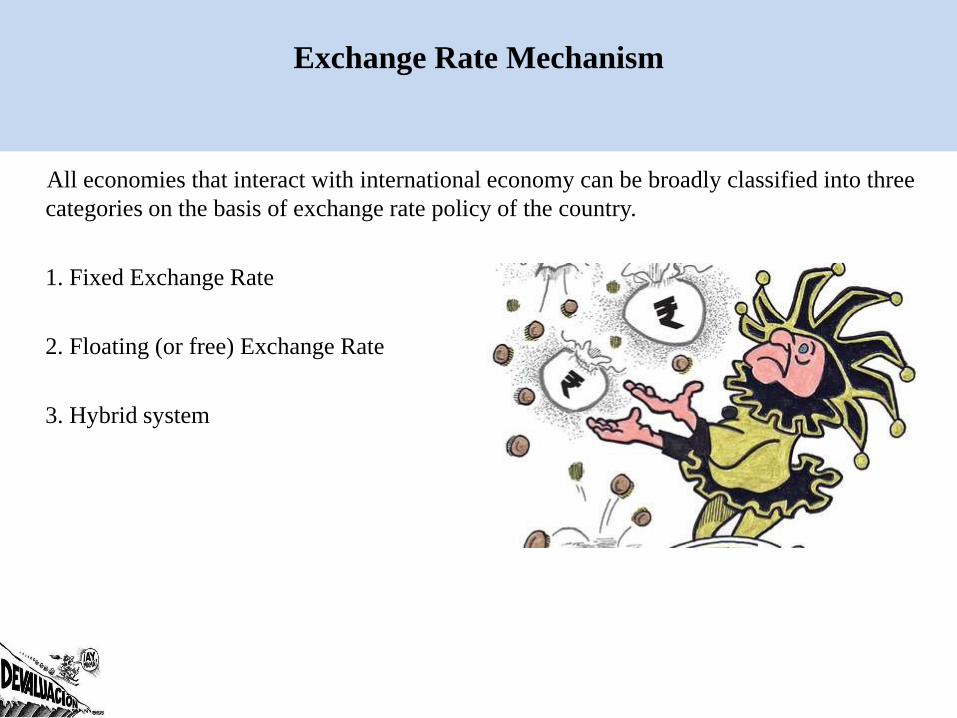
Exchange Rate Mechanism
All economies that interact with international economy can be broadly classified into three
categories on the basis of exchange rate policy of the country.
1. Fixed Exchange Rate
2. Floating (or free) Exchange Rate
3. Hybrid system

Fixed exchange rate
• Economies peg the value of their currency with some other prominent currency like US dollar.
• This of exchange rate regime is maintained by generally smaller economies like Nepal and Bhutan (pegged to Indian Rupee) or several African nations.

Floating exchange rate
• Exchange rate is
determined by demand
and supply of the
currency.
• Economies like
US, UK, Japan etc

Hybrid system
• Most midsized economy
like India practices a mix of
both these regimes

Indian rupee and its exchange rate historically

Exchange rate of the Indian rupee

How does government control exchange rate?
• control is exercised by
actively participating in
international currency
market through its
central bank (Reserve
Bank of India or RBI in
our case)

Continue…………
• Suppose there is huge demand of rupee in India which is driving the value
of rupee.
• Also, let’s assume that RBI is comfortable only in range of Rs 50 to Rs. 60
per US dollar.
• This rapid surge in th e demand of rupee which might be because of
a. Indian export is far more than its import,
b. foreign investors want to invest in India
c. large number of Indians earning abroad are remitting their money back
home
All these together pushing the exchange rate below Rs. 50 per dollar.

Contd……….
• The RBI will then step in the market and will offer Rs.50 for each dollar.
• Soon other traders will have to arrive at this rate, if they want to participate
• Since RBI has the ability to print currency notes, it can keep the lower
limit of exchange rate fixed at this value
• When demand for rupee is subsided, RBI will step back and let market
determine the exchange rate.
• In the process, RBI will have accumulated a pool of dollars; this is called
forex reserve or foreign exchange reserve
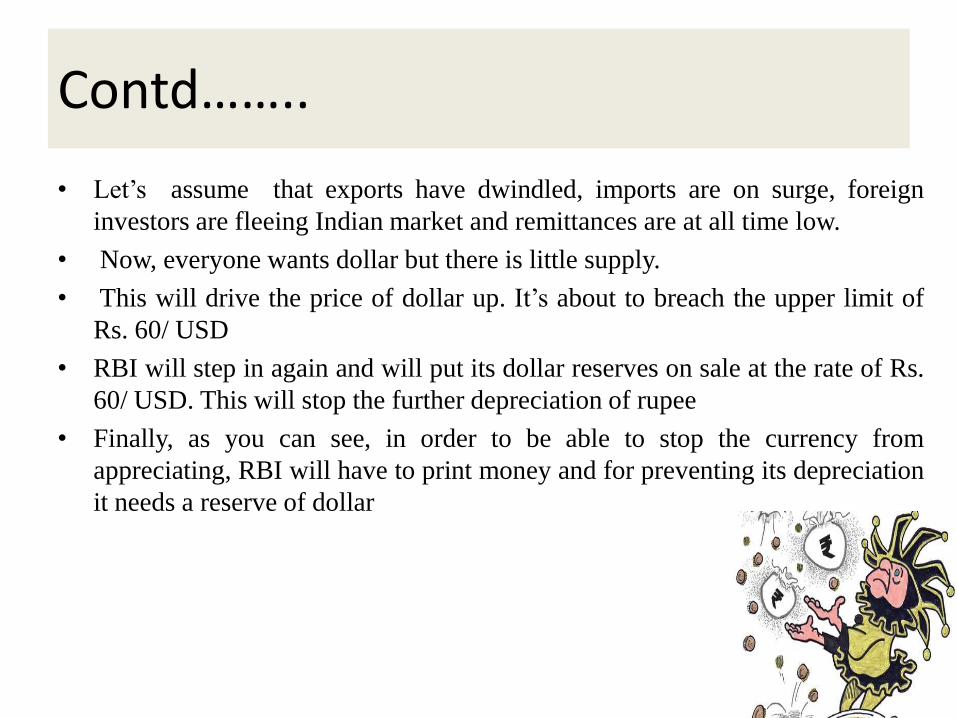
Contd……..
• Let’s assume that exports have dwindled, imports are on surge, foreign
investors are fleeing Indian market and remittances are at all time low.
• Now, everyone wants dollar but there is little supply.
• This will drive the price of dollar up. It’s about to breach the upper limit of
Rs. 60/ USD
• RBI will step in again and will put its dollar reserves on sale at the rate of Rs.
60/ USD. This will stop the further depreciation of rupee
• Finally, as you can see, in order to be able to stop the currency from
appreciating, RBI will have to print money and for preventing its depreciation
it needs a reserve of dollar


MAJOR REASONS BEHIND FALL IN THE VALUE OF INDIAN
RUPEE
• Demand Supply Rule
• Dollar gaining strength against the other currencies
• Mounting Current Account Deficit
• Increased import
• Inflation
• Corruption and Political Instability
• Mounting Demand of Dollar
• High Government Deficit
• Mounting Trade Deficit:
• Outflows of Foreign Capital:
• Lower Inflows of Foreign Capital
• Oil Prices
• Rupee Speculation

A graphical representation of the causes and repercussions of the
Rupee downfall

Mounting current account deficit
• Current account deficit indicates the
status on trade between a country and
the rest of the world
• The deficit was registered $74bn during
the year in 2011-12 and to $87.8 in
2013
• Which was $46bn in the year 2010-11
• Gold imports, hefty oils bills and
decreasing exports due to global
slowdown leads to higher current
account deficit
• The euro zone, one of India's major
trading partners is under a severe
economic crisis leads to reduced exports
• Thus India record a CAD of around
4.9%, depleting its forex reserves and
depreciating the rupee
source: Directorate General of Commercial Intelligence and Statistics

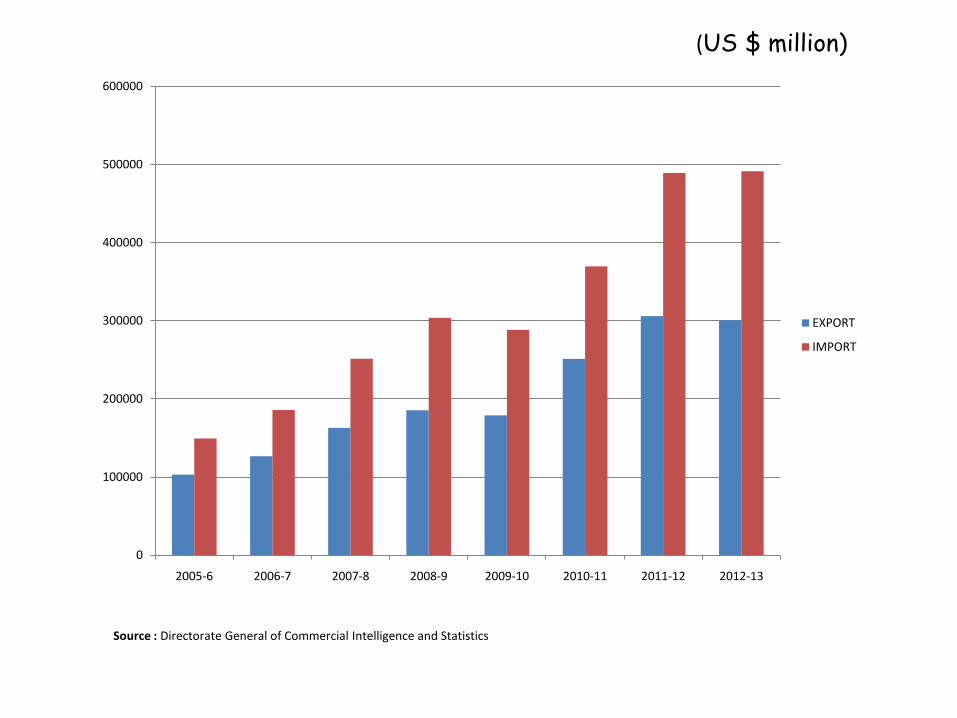
Export -import
YEAR EXPORT IMPORT
2005-6 103090.5 149166.0
2006-7 126414.1 185735.2
2007-8 162904.3 251439.2
2008-9 185295.0 303696.3
2009-10 178751.4 288372.9
2010-11 251136.2 369769.1
2011-12 305963.9 489319.5
2012-13 300570.6 491487.2
Source : Directorate General of Commercial Intelligence and Statistics
(US $ million)
0
100000
200000
300000
400000
500000
600000
2005-6 2006-7 2007-8 2008-9 2009-10 2010-11 2011-12 2012-13
EXPORT
IMPORT
(US $ million)
Source : Directorate General of Commercial Intelligence and Statistics
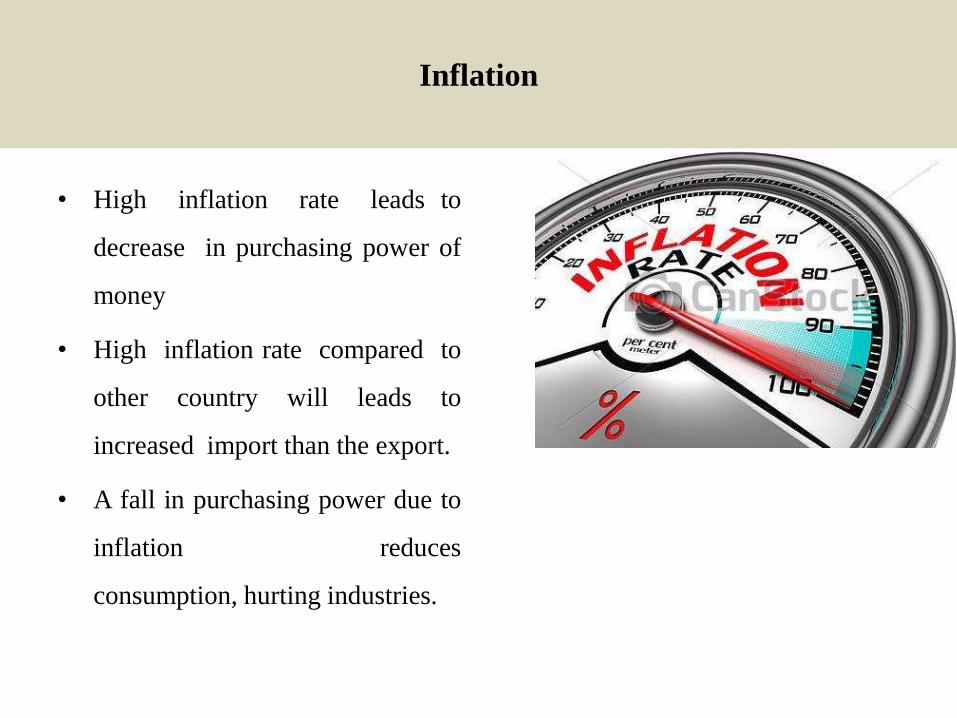
Inflation
• High inflation rate leads to
decrease in purchasing power of
money
• High inflation rate compared to
other country will leads to
increased import than the export.
• A fall in purchasing power due to
inflation reduces
consumption, hurting industries.

Corruption and Political Instability
• A series of corruptions cases are
being observed which has
reduced confidence among
investors.
• Lack of firm initiative by
government on issues like
allowing FDI in retail.

Mounting Demand of Dollar
• Due to instability in European markets
• Oil, gold and metals are all of a sudden
being dumped in favor of the dollar
• Shift of FII’ (foreign institutional
investors) from the Indian markets

Trade deficit
• India imports more than it
exports
• India's trade deficit in the 2011-
12 fiscal years is seen at USD
185 billion,

Mounting trade deficit
year Export Import Trade balance

Outflows of foreign capital:
• This is burning issue in Indian
economy at present.
• Due to global uncertainty and various
economy crises like Europe sovereign
debt problems,
• FII withdrew over $4 billion from
India in 2011; against an inflow of
$1.35 billion in 2010

Lower inflows of foreign capital
• Further the uncertainty and delay in our
commitment to economic reforms, retrospective
taxes, and policy paralysis within the government
have created a fear in mind set of global investor
resulting into decline of foreign investment
• RBI figures exhibit that they stood at $62 billion
in financial year 2007-08,
• Dropped to $28 billion during the year of global
crisis 2008-09,
• then bounced back to $70.1 billion in 2009-10,
• $64.4 billion in 2010-11
• And close to $60 billion during the first 11
months (April-February) of 2011-12


Rupee Speculation
• It refers to the flow of funds (or capital) from
one country to another in order to earn a
short-term profit on interest rate differences
and/or anticipated exchange rate shifts.
• Once currency traders and speculators realize
that India's central bank is unable to manage
its exchange rate, and reduce the adverse
impact on its currency, they may enter the
market in a big way to sell the rupee.
• As a result, the rupee may devalue more than
it should.

Implications of devaluation
• Increased export and less import
• Impact on foreign investors
• Higher inflation
• Increase in cost of borrowing:
• Increase in fiscal burden
• Increase in the import bill
• Impact on importers and prices of goods
• On thermal coal imports
• On fertilizer imports
• On companies and consumers

Increased export and less import
• Fall in the value of rupee makes
exports cheaper and imports
expensive.
• The various sectors like petroleum
and petroleum products, engineering
goods drugs and pharmaceuticals –
which have import inputs of as much
as 75-77 percent, 19-21 percent and
17-19 percent , respectively (as per
report of associated chambers of
commerce and industry of India) lead
to a strict dent on their income due to
fall in the value of rupee.

Impact on foreign investors
• When foreign investors
invest in Indian stock
market, they make a loss if
it depreciates and may earn
profit if rupee appreciates

Higher inflation
High inflation and uncertainty about
future inflation discourage investments
and savings.
As high inflation raises uncertainty in
the economy, it also leads to lower equity
values.

Increase in cost of borrowing
• Interest rate differentials in
domestic and global markets
encourage the industry to raise
money through foreign markets
however a fall in the rupee value
would negate the benefits of
doing so.

Increase in fiscal burden
The central government fiscal burden might
increase as the hike in the prices of imported
crude oil and fertilizer might warrant for a
higher subsidy provision to be made for these
commodities.

Impact on
Effect On Rupee depreciates Rupee appreciates
Importers Imports become costlier and
hence importers lose
Imports become cheaper and
hence importers gain
Exporters Realization from exports
increase and hence exporters
gain
Fall in export realization to the
extent of forex difference and
hence exporters lose
Foreign travel Trip becomes costlier Trip becomes cheaper

Increase in the import bill
Case A: Import bill valuation using
prevailing exchange rates for the
Respective months
Case B: Import bill valuation using April
2011exchange rates for the respective
months
Month Month Value of
Import(Rs. Crore)
Month Month Value of
Import(Rs. Crore)
April 2011
(Rs 44.4/USD)
160536.6 April 2011
(Rs(44.4/USD)
160536.6
December 2011
Rs 52.8/USD)
226535.0 December 2011
Rs 44.4/USD)
190495.8
Increase in Import
Bill
65999.0 Increase in Import
Bill
29959.2
Note: Exchange rate during the April (44.4) and December (52.8)
Source: ASSOCHAM’s calculation

Import bill of crude oil
Case A: Import bill valuation using
prevailing exchange rates for the
Respective months
Case B: Import bill valuation using
April 2011exchange rates for the
respective months
Month Month Value of
Import(Rs.
Crore)
Month Month Value of
Import(Rs. Crore)
April 2011 57700.0 April 2011 57700.00
December 2011 63376.7 December 2011 53294.10
Increase in Import
Bill
5676.70 Decrease in Import
Bill
4405.90
Note: Exchange rate during the April (44.4) and December (52.8)
Source: ASSOCHAM’s calculation

Impact on DAP fertilizer price
Commodity Period Price $/mt Exchange
Rate
Price Rs
Fertilizers
(tonnes)
April
2011
610 45.0 27450
Nov
2011
631 45.0 28395
Difference 21 0.0 945
Source: ASSOCHAM’s calculation
Commodity Period Price
$/mt
Exchang
e Rate
Price Rs
Fertilizers(t
onnes)
May
2011
610 45.0 27450
Oct
2011
631 52.7 64241
Difference 21 4.3 3658.3
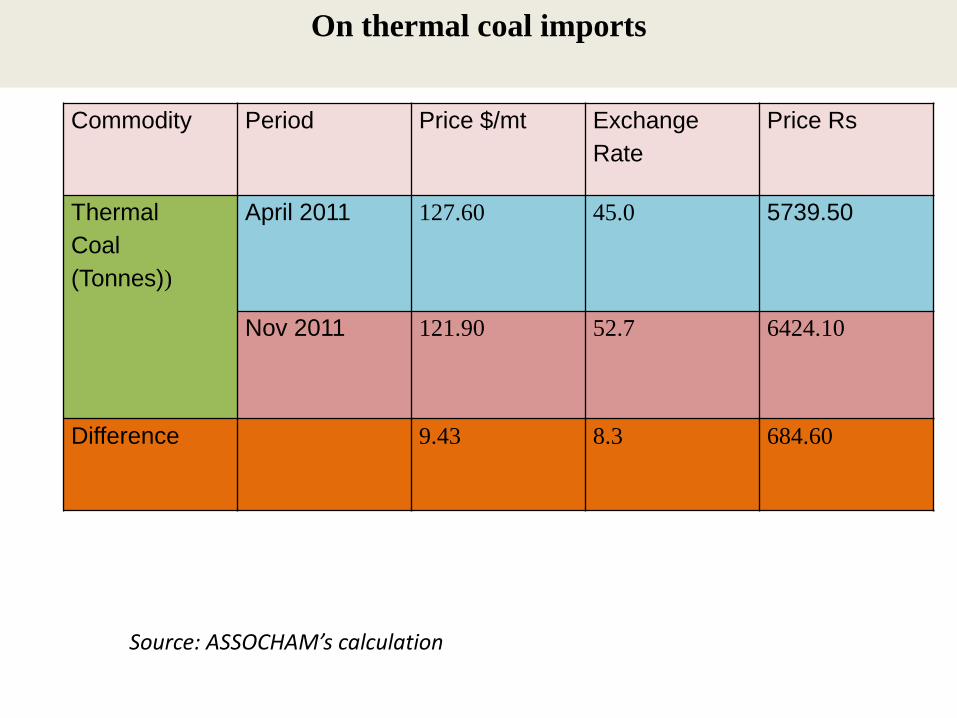
On thermal coal imports
Commodity Period Price $/mt Exchange
Rate
Price Rs
Thermal
Coal
(Tonnes))
April 2011 127.60 45.0 5739.50
Nov 2011 121.90 52.7 6424.10
Difference 9.43 8.3 684.60
Source: ASSOCHAM’s calculation

Impact on Common Man
Imported goods:
Fuel price:
Tourism:
Students studying abroad

Impact on infrastructure
• Around 15 per cent of the borrowings of
infrastructure companies have been in dollar
terms
• Increased the price of construction equipment
and building materials results in enhanced
project execution cost.
• Increasing costs of inputs like steel and cement
are also affecting infrastructure building.
• Fresh investments in infrastructure could also get
over priced

Impact on Agriculture
Sugar :
• India, the world’s second-biggest producer of
the sweetener.
• A softening rupee will be advantage for exporters
from India.
Wheat:
• India is world’s largest producer of wheat.
• Fall in the rupee will lift margins for Indian wheat
exporters.
Rice & Edible oil:
• India is the world’s second-biggest rice producer
• Fall in the rupee will lift margins for Indian rice
exporters.
Contd………….
• India is the world’s top buyer of edible oil.
• imported oils like palm and soy have risen in local markets.
Pulses:
• Despite holding the tag of the world’s biggest producer of lentils, India is also the
largest importer of lentils as rising domestic consumption outpaces harvests.
Cotton:
• Fall in the rupee will lift margins for Indian rice exporters.

Impact on real estate
• Real estate sector is a second largest
employment generator after agriculture as
demands of property declining it not only affect
economy.
• increases the project cost and time frame
followed by the increased in the prices of raw
material, transportation, wages and salary of
labor, engineers, import of construction
equipment etc , outsourced services in form of
design consultancy, architects
• Higher Inflation rate and weak economic
condition make unfavorable climate for investor.
On banking sector
If an Indian company defaults on its dollar debt
and goes bankrupt then it will have a contagion
effect on all the banks that have lent to that
company.
The other adverse affect is that the liabilities on
NRE and foreign currency deposits may increase
because of the depreciation in rupee.
A positive impact for banks of the currency
depreciation this year is that RBI raised interest
rate ceilings on foreign currency deposits of
Indian banks

Devaluation is good or bad ?
• it creates an imbalance on the
Balance of Payments especially for
import driven economies
• country like India which imports
majority of essential commodities
like Oil, pays much more in terms
of the value in INR imports get
expensive thereby increasing the
CAD. This will further devaluate
the currency
• This is a welcome change for a
company which is into the export of
goods or services

Conditions for the success of devaluation
1. More than unity elasticity of demand for exports and imports
2. Sufficient supply of exports
3. Stable international price level
4. Non-competetive devaluation
5. Counter-devaluation measures
6. Spirit of sacrifice by the people

Solution?

1 .Allow free flow of foreign investment for the development of infrastructure
and manufacturing sector.
2. Restrain / discourage import of non essential and luxury items
e.g. auto sector imports..
3. Restrain /discourage export of agricultural produce and basic minerals
e.g. iron ore.
4. Promote aggressively exports of manufactured goods like China
5. Promote migration of skilled personnel / work force from India..
6. Facilitate the voluntary return of the funds parked outside India.
What Indian Government Can do, to Bring back Positive Vibrations in Indian Economy?

Contd……
7. Reduce / cut unnecessarily expenditure of governmentinstitutions
8. Government should observe restraint in offeringfinancial aid to other countries.
9.To balance demand & supply
10.Proper implementation of monetary policy and fiscal
policy in our country
11.Stability in imports & exports etc.

Policy options with RBI to control devaluation of rupee
• Raising Policy rates
• Using FOREX Reserves
• Easing Capital Controls
• Administrative measures

conclusion
Even after taking few measures by government , rupee depreciation
has abated but it still remains under pressure.
Both domestic and global conditions are indicating that the
downward pressure on Rupee to remain in future.
Thus, RBI should continue its policy mix of controlled intervention in
forex markets and administrative measures to curb volatility in Rupee.
Apart from RBI, government should take some measures to bring FDI
and create a healthy environment for economic growth.

We invented money and we use it, yet wecannot understand its laws or control itsactions. It has a life of its own”
-Lionel Trilling