Deutsche EuroShop | Company Presentation | 04/17
43
04.2017 COMPANY PRESENTATION
-
Upload
deutsche-euroshop-ag -
Category
Investor Relations
-
view
91 -
download
2
Transcript of Deutsche EuroShop | Company Presentation | 04/17

04.2017
COMPANY PRESENTATION
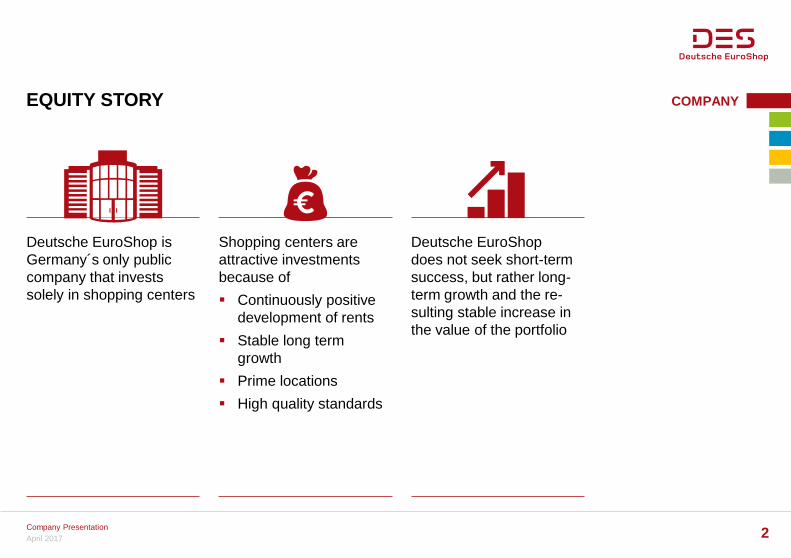
EQUITY STORY COMPANY
Company Presentation 2 April 2017
Deutsche EuroShop is Germany´s only public company that invests solely in shopping centers
Shopping centers are attractive investments because of Continuously positive
development of rents Stable long term
growth Prime locations High quality standards
Deutsche EuroShop does not seek short-term success, but rather long-term growth and the re-sulting stable increase in the value of the portfolio

AT A GLANCE
1 100%-view
Lettable space Approx. 1,067,000 sqm
Retail shops Approx. 2,700
Market value Approx. €5.1 billion1
Rents per year €280 million1
Occupancy rate 99%
Avg. lettable space per DES-center: inner city 39,000 sqm est. Locations 97,000 sqm
COMPANY
April 2017 Company Presentation 3
21 shopping centers on high street and in established locations – 17 in Germany and one each in Austria, Czech Republic, Hungary and Poland
2016 portfolio valuation: approx. 5.24% net initial yield (before transaction costs)
Professional center management by ECE, the European market leader in this industry

KEY FIGURES1
1 2016: Preliminary results
2 2013 – 2016, Compound Annual Growth Rate (CAGR) 3 Proposal
COMPANY
REVENUE EBIT FFO
€m €m €m
NUMBER OF SHARES DIVIDEND PER SHARE NAV PER SHARE (EPRA)
mn € €
188.0
200.8 202.9 205.1
2013 2014 2015 2016
165.8 177.5 176.3 178.6
2013 2014 2015 2016
112.0 120.5 123.4 129.9
2013 2014 2015 2016
+5.1%2
53.95 53.95 53.95 53.95
2013 2014 2015 2016
1.25 1.30
1.35
2013 2014 2015 2016
30.59 33.17 39.58
43.24
2013 2014 2015 2016
1.403
+0%2 +3.8%2 +12.2%2
April 2017 Company Presentation 4
+2.5%2 +2.9%2

0%
1%
2%
3%
2006 2007 2008 2009 2010 2011 2012 2013 2014 2015 2016
German inflation avg. 1.4% DES´ like-for-like revenue avg. 1.7%
LEASE SYSTEM
1 Status: 31 Dec. 2016 2 excl. VAT 3 Source: GfK Geomarketing
10 years lease No break-up option Turnover-linked rents Minimum rents are CPI-linked Avg. retail space rent per sqm and year: €250 Avg. turnover per sqm and year (productivity) in DES shopping centers: €4,1931,2
(avg. German retail: €3,456, avg. German shopping centers: €3,912)1,2,3
Rent-to-sales-ratio: 7 – 11% Weighted maturity of rental contracts: 5.7 years1
LIKE-FOR-LIKE REVENUE
COMPANY
April 2017 Company Presentation 5

TARGETS
April 2017 Company Presentation 6
COMPANY
Long term net asset value enhancement
Main focus on NAV and dividend
“Buy & hold”-strategy, Continuous growth
Stable and attractive dividends
Dividend yield: currently 3.7%
Investment-focus: At least 75% Germany and up to 25% Europe
Portfolio extension By acquisition of new shopping
centers By increasing existing amounts
of holdings By expansion of portfolio centers

MAP OF THE PORTFOLIO SHOPPING CENTERS
Germany 17 centers
Austria 1 center
Poland 1 center
Hungary 1 center
April 2017 Company Presentation 7
Czech Republic 1 center

-1
0
1
2
3
4
5
6
7
2005
Q4
2006
Q2
2006
Q4
2007
Q2
2007
Q4
2008
Q2
2008
Q4
2009
Q2
2009
Q4
2010
Q2
2010
Q4
2011
Q2
2011
Q4
2012
Q2
2012
Q4
2013
Q2
2013
Q4
2014
Q2
2014
Q4
2015
Q2
2015
Q4
2016
Q2
2016
Q4
2018
Q4
2020
Q4
Norderstedt 6.1% Passau
5.5%
A10 6.5%
Billstedt 6.0%
Magdeburg 5.9%
Dresden 5.4%
Source: JLL
GERMAN PRIME SHOPPING CENTER YIELDS 2005-2020E
SHOPPING CENTERS
April 2017 Company Presentation 8
German shopping center prime yields
Euro Swap Rate
Forecast
Compression Decompression Polarisation Compression
%
Neunkirchen 5.0%

ACQUISITION OF OLYMPIA BRNO
FINANCIALS
April 2017 Company Presentation 9
Deutsche EuroShop acquires 100% of the shares in Olympia SPV from Rockspring and ECE European Prime Shopping Centre Fund I (50% each)
Expected closing in H1 2017
Total investment: approx. €382 million, net purchase price excl. debt of SPV and excl. acquisition costs: approx. €207 million
financing by long term debt (approx. €217 million, 57%) and proceeds of capital increase (approx. €165 million, 43%)
Expected annualised rents 2017: €20.1 million
Expected NOI yield: 5.1%, expected net initial yield: 5.0%
The SPV will be fully consolidated

ACQUISITION OF SAARPARK-CENTER NEUNKIRCHEN SHOPPING CENTERS
April 2017 Company Presentation
Deutsche EuroShop acquired a 50% participation in the Saarpark-Center SPV from BAT Custodian
Effective from 1 Oct. 2016
Total investment: approx. €113 million (50%), net purchase price excl. debt of SPV: €79 million
(preliminary) financing by utilisation of a credit line, later long term debt
Expected annualised rents effective from 2017: €12.8 million (100%)
Expected NOI yield: 5.0% (corresponds to an expected net initial yield of 4.7%, but DES incurs no transfer tax)
The SPV is treated as joint venture (at-equity)
10

GERMANY
A10 Center
Main-Taunus-Zentrum
Altmarkt- Galerie
Rhein-Neckar-Zentrum
Location Wildau/Berlin Sulzbach/Frankfurt Dresden Viernheim/Mannheim
Investment 100% 52.0% 100% 100%
Lettable space sqm 124,700 124,000 77,000 69,500
Parking 4,000 4,500 500 3,800
Number of shops Approx. 200 Approx. 170 Approx. 200 Approx. 110
Occupancy rate 100% 100% 99% 99%
Catchment area
Approx. 1.1 m. inhabitants
Approx. 3.1 m. inhabitants
Approx. 2.1 m. inhabitants
Approx. 1.5 m. inhabitants
Visitors 2015 6.90 m. 8.20 m. 14.80 m. 7.80 m.
Opening/ refurbishment 1996/2011 1964/2004/2011 2002/2011 1972/2002
SHOPPING CENTERS
April 2017 Company Presentation 11

GERMANY
Herold- Center
Allee- Center
Billstedt- Center
Phoenix- Center
Location Norderstedt Magdeburg Hamburg Hamburg
Investment 100% 50.0% 100% 50.0%
Lettable space sqm 54,200 51,300 42,600 43,300
Parking 850 1,300 1,500 1,400
Number of shops Approx. 140 Approx. 150 Approx. 110 Approx. 130
Occupancy rate 96% 98% 98% 99%
Catchment area
Approx. 0.5 m. inhabitants
Approx. 0.8 m. inhabitants
Approx. 1.0 m. inhabitants
Approx. 0.6 m. inhabitants
Visitors 2015 11.50 m. 9.50 m. 10.10 m. 9.20 m.
Opening/ refurbishment 1971/1995/2003 1998/2006 1969/1977/1996 2004/2016
SHOPPING CENTERS
April 2017 Company Presentation 12

Saarpark- Center Forum
Allee- Center
City- Galerie
Location Neunkirchen Wetzlar Hamm Wolfsburg
Investment 50.0% 65.0% 100% 100%
Lettable space sqm 35,600 34,300 34,000 30,800
Parking 1,600 1,700 1,300 800
Number of shops Approx. 130 Approx. 110 Approx. 90 Approx. 100
Occupancy rate 99% 99% 99% 100%
Catchment area
Approx. 0.6 m. inhabitants
Approx. 0.5 m. inhabitants
Approx. 0.7 m. inhabitants
Approx. 0.5 m. inhabitants
Visitors 2015 7.10 m. 7.60 m. 6.80 m. 7.70 m.
Opening/ refurbishment 1989/1999/2009 2005 1992/2003/2009 2001/2006
GERMANY SHOPPING CENTERS
April 2017 Company Presentation 13

Rathaus- Center
City- Arkaden
City- Point
Stadt- Galerie
Location Dessau Wuppertal Kassel Passau
Investment 100% 100% 100% 75.0%
Lettable space sqm 30,100 28,600 27,700 27,700
Parking 850 650 220 500
Number of shops Approx. 90 Approx. 80 Approx. 60 Approx. 90
Occupancy rate 98% 99% 100% 100%
Catchment area
Approx. 0.5 m. inhabitants
Approx. 0.8 m. inhabitants
Approx. 0.8 m. inhabitants
Approx. 1.2 m. inhabitants
Visitors 2015 5.60 m. 8.90 m. 8.60 m. 8.20 m.
Opening/ refurbishment 1995 2001/2004 2002/2009/2015 2008
GERMANY SHOPPING CENTERS
April 2017 Company Presentation 14

Stadt- Galerie
Location Hameln
Investment 100%
Lettable space sqm 26,000
Parking 500
Number of shops Approx. 100
Occupancy rate 99%
Catchment area
Approx. 0.4 m. inhabitants
Visitors 2015 5.70 m.
Opening/ refurbishment 2008
GERMANY SHOPPING CENTERS
April 2017 Company Presentation 15

Olympia Galeria
Bałtycka City
Arkaden Árkád
Location
Brno, Czech Republic
Gdansk, Poland
Klagenfurt, Austria
Pécs, Hungary
Investment 100% 74.0% 50.0% 50.0%
Lettable space sqm
85,000 48,700 36,900 35,400
Parking 4,000 1,050 880 850
Number of shops Approx. 200 Approx. 195 Approx. 120 Approx. 130
Occupancy rate 98% 100% 100% 97%
Catchment area
Approx. 1.2 m. inhabitants
Approx. 1.1 m. inhabitants
Approx. 0.4 m. inhabitants
Approx. 1.0 m. inhabitants
Visitors 2015 8.0 m. 9.80 m. 5.60 m. 12.40 m.
Opening/ refurbishment 1999/2014-16 2007 2006 2004
EUROPE SHOPPING CENTERS
April 2017 Company Presentation 16

OUR TENANTS1
1 Selection of our well known tenants
SHOPPING CENTERS
April 2017 Company Presentation 17

TENANTS STRUCTURE TOP 10 TENANTS1
1 in % of total rents as at 31 Dec. 2016 2 excluding Kaufhof 3 perfumeries only
SHOPPING CENTERS
2016 2015
Metro Group2 4.7% 4.5%
H&M 3.6% 3.4%
New Yorker 2.4% 2.3%
Peek & Cloppenburg 2.2% 2.1%
Deichmann 2.0% 1.8%
Douglas3 2.0% 2.1%
C&A 1.9% 1.5%
REWE 1.7% 1.6%
dm-drogerie markt 1.4% 1.2%
Thalia 1.3% 1.0%
Total 23.2% 21.5%
77%
23%
Other tenants
Company Presentation 18
Low level of dependence on the top 10 tenants
April 2017

MATURITY DISTRIBUTION OF RENTAL CONTRACTS1
1 as % of rental income as at 31 Dec. 2016
SHOPPING CENTERS
2022 et sqq: 72%
2021: 18%
2020: 4%
2019: 3%
2018: 2%
2017: 1%
Company Presentation 19
Long-term contracts base rental income Weighted maturity 5.7 years
April 2017

SECTOR MIX1
1 as % of rental space as at 31 Dec. 2016
Balanced sector diversification
Fashion 51.8%
Non-food/ electronics
18.8%
Department stores 10.5%
Food 6.8%
Health & beauty 6.1%
Catering 4.4%
Services 1.6%
SHOPPING CENTERS
April 2017 Company Presentation 20

KEY FIGURES 20161
FINANCIALS € million 01.01. – 31.12.2017 01.01. – 31.12.2016 Change Revenue 205.1 202.9 1% Net operating income 184.7 183.5 1% EBIT 178.6 176.3 1% Net finance costs -13.9 -2.1 >100% Measurement gains/losses 116.8 220.6 -47% EBT 281.5 394.7 -29% Consolidated profit 221.8 309.3 -28% FFO per share (€) 2.41 2.29 5% EPRA Earnings per share (€, undiluted) 2.29 2.18 5%
€ million 31.12.2016 31.12.2015 Change Total equity2 2,224.1 2,061.0 8% Financial liabilities 1,445.6 1,407.6 3% Other debt (incl. Deferred taxes) 428.2 383.0 12% Total assets 4,114.5 3,851.6 7% Net financial liabilities 1,381.5 1,336.9 3% Equity ratio2 54.5% 53.5% LTV ratio 34.2% 35.5% Gearing2 83.6% 86.9%
April 2017 Company Presentation 21
1 Preliminary results 2 Incl. non controlling interests

5.40 5.64
5.80 5.89 5.92 5.98 5.97 5.87
5.46 5.24
5.14 5.37 5.52 5.61 5.64 5.70 5.69
5.53
5.13 4.94
2007 2008 2009 2010 2011 2012 2013 2014 2015 2016
Net operating yield in % Net initial yield in %
VALUATION1 – INVESTMENT PROPERTIES 2016
1 External appraisers: since 2015: JLL
SENSITIVITY ANALYSIS
in € thousand Basis change of -25bps change of +25bps Rent increase rates 1.39% -101,100 +148,000
Discount rate 5.97% +69,000 -69,200
Capitalization rate 5.21% +114,200 -106,600
Cost ratio 10.17% +10,400 -9,000
FINANCIALS
Company Presentation 22 April 2017

LOAN STRUCTURE INCL. CONVERTIBLE BONDS1,2
1 as of 30 Dec. 2016 2 excl. at-equity consolidated loans
FINANCIALS Interest lockin Duration
Principle amounts (€ million)
Share of total loan
avg. interest rate
Up to 1 year 274.1 19.0% 1.26%
1 to 5 years 3.8 578.5 40.2% 4.34%
5 to 10 years 6.9 524.8 36.4% 3.14%
Over 10 years 11.0 63.0 4.4% 5.25%
Total 20161 5.1 1,440.4 100% 3.67%
4.16
3.88 3.76 3.69 3.67
0
2
4
6
8
3.50
4.00
4.50
2012 2013 2014 2015 2016
avg. interest rates weighted maturities
yrs %
21 German Banks Weighted maturity
of fixed interest periods 5.1 years1
Company Presentation 23 April 2017
1

in € million
End of fixed interest periods respectively
expiring loans Avg. interest
rate DES‘
share
2017-2019 0
2020 35.0 4.00% 50%
2021 63.3 4.59% 50%
2022 0
MATURITIES UNTIL 20221,2
1 as of 31 Dec. 2016 2 excl. at-equity consolidated loans
in € million
end of fixed interest periods respectively
expiring loans avg. interest
rate
regular redemption
payments total
maturities
2017 98.7 1.75% 16.5 115.2
2018 72.1 4.60% 17.8 89.9
2019 123.1 4.73% 14.7 137.8
2020 134.1 4.52% 10.1 144.2
2021 198.3 4.48% 8.2 206.5
2022 217.8 3.26% 7.8 225.7
844.1
FINANCIALS
Company Presentation 24 April 2017
At-equity consolidated loans1
Phoenix-Center, Hamburg, Saarpark-Center, Neunkirchen
Saarpark-Center, Neunkirchen
Convertible Bond

GERMAN CONSUMER PRICE INDEX
Source: Destatis
April 2017 25
FINANCIALS
Company Presentation
99.0
100.0
101.0
102.0
103.0
104.0
105.0
106.0
107.0
108.0
109.0
106.0
107.0
108.0
109.0
2016 17
+1.6% in Mar. 17

1.66 2.08 2.23 2.29 2.41
2.38-2.423
2012 2013 2014 2015 2016 2017
FORECAST
FINANCIALS
April 2017 26
1 Compound Annual Growth Rate (CAGR) 2012 - 2016 2 Excl. capital gain 3 Undiluted 4 Preliminary Figures 5 Will be updated with publication of the Annual Report 2016
95.1 113.4 125.0 127.0 134.5
133 -136
151.6 165.8 177.5 176.3 178.6
175-179
178.2 188.0 200.8 202.9 205.1
201-205
REVENUE
EBIT
EBT EXCLUDING VALUATION2
FFO PER SHARE
+19%
+25%
+10%
+7%
+1%
-1%
+2%
+3%
+1% +7%
+9% +1%
+6%
+5%
€m
€m
€m
€
+5%
+7%
CAGR1: +4%
CAGR1: +4%
CAGR1: +9%
CAGR1: +10%
Company Presentation
4 5

0.96 0.96 1.00
1.05 1.05 1.05 1.05 1.10 1.10
1.20 1.25
1.30 1.35
1.407,8 1.458
1.508
19.26
23.73
28.08
23.50 24.30 23.67
28.98
24.80
31.64 31.83 36.20
40.46 38.67 37.73
10.00
15.00
20.00
25.00
30.00
35.00
40.00
45.00
0.90
1.00
1.10
1.20
1.30
1.40
1.50
1.60
2004 2005 2006 2007 2008 2009 2010 2011 2012 2013 2014 2015 2016 2017 2018 2019
DIVIDEND & PERFORMANCE
1 respectively paid for the previous FY 2 2017: as of 30 March 2017 3 as of 31 Dec. 2016 4 EPRA/NAREIT Europe 5 German government bonds index 7 to be paid on 29 June 2017 8 proposal
TREND OF SHARE
Dividend1 Share price2
PERFORMANCE3
DES DAX EPRA4 REX5 OEF
1 year (2016) -1.2% +6.9% -5.0% +2.3% +2.8%
3 years +34.1% = +10.3% p.a. +6.3% p.a. +13.0% p.a. +3.3% p.a. +2.9% p.a.
5 years +86.0% = +13.2% p.a. +14.2% p.a. +15.3% p.a. +2.8% p.a. +2.3% p.a.
Since IPO (2001) +280.9%= +8.7% p.a. +3.7% p.a. +7.9% p.a. +4.6% p.a. +3.3% p.a.
SHARE
April 2017 Company Presentation 27

FFO PAYOUT RATIO
* FFO per share: forecast Dividend per share: proposal without Olympia Center Brno
SHARE
April 2017 Company Presentation 28
0%
10%
20%
30%
40%
50%
60%
70%
80%
90%
100%
0.00 €
0.20 €
0.40 €
0.60 €
0.80 €
1.00 €
1.20 €
1.40 €
1.60 €
1.80 €
2.00 €
2.20 €
2.40 €
2.60 €
2011 2012 2013 2014 2015 2016* 2017*
FFO Dividend Payout ratio
0.00 €
0.20 €
0.40 €
0.60 €
0.80 €
1.00 €
1.20 €
1.40 €
1.60 €
1.80 €
2.00 €
2.20 €
2.40 €
2.60 €
2014 2015 2016* 2017*
Principal payments Capex

SHAREHOLDER STRUCTURE1
1 Status: 14 March 2017
Institutional Investors
45.7%
Private Investors
24.3%
Alexander Otto 17.6% BlackRock 5.9%
US 12%
Germany 64%
NL 4%
FI 1%
UK 8%
FR 5%
Other 2%
NO 2% CH 2%
14,000 shareholders Free float 82.4% SHARE
April 2017 Company Presentation 29
Johannes Schorr 3.5%
State Street 3.0%

ANALYSTS‘ CONSENSUS1
1 Aggregated by DES 2 According to Bloomberg as of March. 2017
avg./in € 2017 2018
EBIT (€ million) 184.1 189.4
FFO per share 2.42 2.45
NAV per share 43.20 44.89
Dividend 1.45 1.50
Price target 43.52
Status: 16 March 2017 22 analysts: one of the
best covered real estate companies in Europe2
SELL UNDERPERFORM NEUTRAL OUTPERFORM BUY
ABN Amro
Green Street Advisors
BofA Merrill Lynch
Commerzbank Deutsche Bank GSC Research J.P. Morgan
Cazenove M.M. Warburg Oddo BHF
Equinet
Kempen & Co Kepler Cheuvreux Metzler Natixis NORD/LB Societe Generale
0%
50%
100%
Q2
04Q
3 04
Q4
04Q
1 05
Q2
05Q
3 05
Q4
05Q
1 06
Q2
06Q
3 06
Q4
06Q
1 07
Q2
07Q
3 07
Q4
07Q
1 08
Q2
08Q
3 08
Q4
08Q
1 09
Q2
09Q
3 09
Q4
09Q
1 10
Q2
10Q
3 10
Q4
10Q
1 11
Q2
11Q
3 11
Q4
11Q
1 12
Q2
12Q
3 12
Q4
12Q
1 13
Q2
13Q
3 13
Q4
13Q
1 14
Q2
14Q
3 14
Q4
14Q
1 15
Q2
15Q
3 15
Q4
15Q
1 16
Q2
16Q
3 16
Q4
16Q
1 17
negative neutral positive
SHARE
April 2017 Company Presentation 30
Baader Bank Bankhaus Lampe Berenberg Bank DZ Bank HSBC Independent
Research

10 REASONS TO INVEST
SHARE
The only public company in Germany to invest solely in shopping centers
Prime locations
Proven, conservative strategy
Shareholder-friendly dividend policy
Stable cash flow with long term visibility
01 02 03 04 05
Experienced management team
Excellent track record
Centers almost 100% let
Solidity combined with growth potential
Inflation-protected rental agreements
06 07 08 09 10
April 2017 Company Presentation 31

KEY DATA OF THE SHARE
APPENDIX
Listed since 02.01.2001
Nominal capital €58,404,996.00
Outstanding shares 58,404,996
Class of shares Registered shares
Dividend 2016 (proposal) €1.40
52W High €42.61
52W Low €35.87
Share price (30 March 2017) €37.73
Market capitalisation €2.20 billion
Avg. turnover per day last 12 months (XETRA) 143,700 shares
Indices MDAX, EPRA, GPR, MSCI Small Cap, EURO STOXX, STOXX Europe 600
Official market Prime Standard Frankfurt and XETRA
OTC market Berlin-Bremen, Dusseldorf, Hamburg, Hanover, Munich and Stuttgart
ISIN DE 000 748 020 4
Ticker DEQ, Reuters: DEQGn.DE
Market maker Oddo Seydler
April 2017 Company Presentation 32

KEY DATA OF THE CONVERTIBLE BOND 1.75% 2017
1 Originally €35.10, adjusted on 21 June 2013,19 June 2014, 19 June 2015 and 16 June 2016
APPENDIX
Amount €100 million
Principal amount €100,000 per Bond
Issue date 20 Nov. 2012
Maturity date 20 Nov. 2017
Coupon 1.75%
Price (31 March 2017) 121.95%
Interest payment date payable semi-annually in arrear on 21 May and 21 November in each year
Conversion price €30.621
Dividend protection Conversion Price adjustment for any dividends paid (full dividend protection)
ISIN DE 000 A1R 0W0 5
Listing Open Market (Freiverkehr) segment of the Frankfurt Stock Exchange
April 2017 Company Presentation 33

RETAIL TURNOVER 20161
APPENDIX
April 2017 Company Presentation 34
Retail sector % change
in 2016 rent-to-sales
ratio in % % of
sales % of
space Department stores -0.8 6.1 7.8 13.5 Food -1.5 7.5 9.2 6.5 Fashion textiles -0.9 12.2 29.7 38.9 Shoes & leather goods -1.9 14.7 5.7 7.0 Sports -2.9 9.3 4.1 4.8 Health & beauty -0.1 7.1 11.8 5.9 General retail -1.6 11.0 8.6 9.3 Electronics 0.8 4.2 13.5 8.1 Services -0.1 4.8 5.0 1.7 Food catering -0.1 13.2 4.6 4.3 Total -0.75 9.2 100.0 100.0
Retail turnover development on a like-for-like basis: Germany -0.75%, abroad +1.3% DES-Portfolio overall: -0.5%
Absolute turnover development: Germany -0.1%, abroad +1.1% DES-Portfolio overall: +0.0%
1 German centers on a like-for-like basis (turnover: €2.1 billion)

GFK CONSUMER CLIMATE INDICATOR1
1 as at: March2017, source: GfK
APPENDIX
April 2017 Company Presentation 35

ONLINE VS. STATIONARY RETAIL?
Source: GfK
TURNOVER DISTRIBUTION OF A FASHION RETAILER
Pure online purchases
Order in shop, dispatch by post
Order online, pickup in shop (click & collect)
Online search, purchase in shop
Pure shop purchases
Stationary retail transforms from “Point of Purchase” to “Touch Point” (product experience) New store concepts (flagship store, show room, multi-channel store, pick-up store),
click & collect, augmented reality, online goes offline, mobile services “Location, location, location” newly interpreted: “Convenience, attractivity & likeability“
April 2017 Company Presentation 36
APPENDIX

CROSS CHANNEL!
Source: EY
AN EXAMPLE FOR A MODERN CUSTOMER JOURNEY
April 2017 Company Presentation 37
APPENDIX
Impulse Research Consultation Transaction Payment Delivery Return After sales Customer loyalty
Preparation of Purchase Transaction Service
The cross-channel customer combines stationary and online channels The one-channel customer uses only one channel

THE CUSTOMER JOURNEY IN OUR SHOPPING CENTERS
Source: ECE
April 2017 Company Presentation 38
APPENDIX
„Love2shop“ app center website social media
„Easy to Park“ card QR code car finder
3D wayfinding systems indoor navigation InfoGate
gift-wrapping and packaging services personal shopper guest card
cell phone charging stations quiet zones/lounge areas Selfie photo boxes free Wi-Fi
same day delivery service prepaid parking cards

ECOMMERCE: GROWTH WITHOUT END?
Source: GfK
PROGRESSION OF ONLINE RETAIL TO MARKET MATURITY
April 2017 Company Presentation 39
APPENDIX

OUR PARTNER:
APPENDIX
ECE develops, plans, builds, leases and manages large commercial real estate in the sectors shopping, office, industries since 1965
originally ECE was an abbreviation for the German word Einkaufscenterentwicklung (Shopping center development)
100% privately owned by the Otto family Active in 14 European countries European market leader in the shopping center business Assets under management:
− 199 shopping centers − 7.3 million sqm overall sales area − approx. 21,000 retail businesses − 4.6 million daily visitors − €31 billion assets under management
Many investors rely on ECE:
April 2017 Company Presentation 40
Austria Bulgaria Czech Republic Denmark Germany Hungary Italy
Lithuania Poland Qatar Russia Slovakia Spain Turkey

ENVIRONMENT
Climate protection is one of the most important issues for Deutsche EuroShop. We believe that sustainability and profitability, the shopping experience and environmental awareness are not opposing forces. Long-term thinking is part of our strategy. This includes playing our part in environmental protection
In 2016, all our German shopping centers had contracts with suppliers that use renewable energy sources, such as hydroelectric power, for their electricity needs. The “EnergieVision” organisation certified the green electricity for our centers in Germany with the renowned “ok-power” accreditation in 2016. We also plan to switch our centers in other countries over to green electricity wherever possible within the next few years
The German centers used a total of around 62.5 million kWh of green electricity in 2016. This represented 100% of the electricity requirements in these shopping centers. Based on conservative calculations, this meant a reduction of around 22,445 tonnes in carbon dioxide emissions, which equates to the annual CO2 emissions of more than 1,000 two-person households. The use of heat exchangers and energy-saving light bulbs allows us to further reduce energy consumption in our shopping centers
Deutsche EuroShop, through its shopping centers, also supports a range of activities at local and regional level in the areas of ecology, society and economy
APPENDIX
April 2017 Company Presentation 41

FINANCIAL CALENDAR
APPENDIX
2017
Company Presentation 42 April 2017
03.04. Roadshow Munich, Baader Bank
03.04. Roadshow Zurich, Berenberg
28.04. Publication of the Annual Report 2016
11.05. Quarterly Statement 3M 2017
16.05. Roadshow Helsinki, M.M. Warburg
19.05. equinet ESN Conference, Frankfurt
19.05. Warburg Highlights, Hamburg
01.06. Kepler Cheuvreux German Property Day, Paris
07.06. Kempen & Co European Property Seminar, Amsterdam
15.06. Roadshow London, Green Street Advisors
15.06. Roadshow Warsaw, Berenberg
16.06. Roadshow Edinburgh, JP Morgan Cazenove
22.06. Deutsche Bank dbAccess Conference, Berlin
28.06. Annual General Meeting, Hamburg
15.08. Half-year Financial Report 2016
05.-06.09. DES Real Estate Summer, Brno
12.-13.09. BoA Merrill Lynch Global RE Conf., New York
18.09. Goldman Sachs & Berenberg German Conf., Munich
19.09. Baader Investment Conf., Munich
29.09. Societe Generale Pan European RE Conf., London
04.-06.10. Expo Real, Munich
15.11. Quarterly Statement 9M 2017
16.11. Natixis European Mid Caps Conf., Paris
17.11. Roadshow Amsterdam, Societe Generale
17.11. Roadshow Brussels, Kempen & Co
21.11. DZ Bank Equity Conf., Frankfurt
06.-07.12. Berenberg European Conf., Pennyhill
11.-12.12. HSBC Global RE Conf., Cape Town

CONTACT
This presentation is a FSC certified product
APPENDIX
NICOLAS LISSNER Manager Investor & Public Relations
OLAF BORKERS Chief Financial Officer
WILHELM WELLNER Chief Executive Officer
PATRICK KISS Head of Investor & Public Relations
Deutsche EuroShop AG Investor & Public Relations Heegbarg 36 22391 Hamburg
Tel. +49 (40) 41 35 79 – 20/ – 22 Fax +49 (40) 41 35 79 – 29 E-Mail: [email protected] Web: www.deutsche-euroshop.com
ir-mall.com
facebook.com/euroshop
flickr.com/desag
slideshare.net/desag
twitter.com/des_ag
youtube.com/DeutscheEuroShop
Important Notice: Forward-Looking Statements
Statements in this presentation relating to future status or circum-stances, including statements regarding management’s plans and objectives for future operations, sales and earnings figures, are forward-looking statements of goals and expectations based on estimates, assumptions and the anticipated effects of future events on current and developing circumstances and do not necessarily predict future results.
Many factors could cause the actual results to be materially different from those that may be expressed or implied by such statements. Deutsche EuroShop does not intend to update these forward-looking statements and does not assume any obligation to do so.
April 2017 Company Presentation 43