Determining w/c ratio in hardened concrete: an inter ...
29
17 April 2019 1 Determining w/c ratio in hardened concrete: an inter-laboratory trial by the Applied Petrography Group Steering Committee: R. Fox, A.B. Poole, R. Barnes, H. Wong, M. Eden, J. Ferrari, B. Wells. Summary In 2017, the Applied Petrography Group in London organised a pan-European inter-laboratory collaboration to measure the water/cement (w/c) ratio in hardened concrete by microscopy to evaluate and compare meth- ods used by participating laboratories. Determination of w/c ratio in hardened concrete is a critical measure of concrete quality and is sometimes a subject of dispute in concrete strength and durability issues. Five sep- arate prism samples with measured w/c ratios ranging from 0.35 to 0.55, but otherwise identical in mix de- sign were prepared. Thick slices were cut from these samples and distributed. Initially, 14 laboratories across Europe agreed to participate but the w/c ratios were withheld. These laboratories used a range of methods that could be broadly divided into visual assessment methods, measurement of fluorescent intensity and backscattered electron microscopy. Some laboratories made the w/c ratio determinations by more than one method or operator. Consequently, 100 individual w/c ratio determinations were collected from 11 of the participating laboratories. Comparing the results it was found that there was little significant difference be- tween visual assessment and quantitative fluorescent methods. Overall, 58% of results were within ±0.05 of the target value and 81% of results were within ±0.10 of the target value. 1. Introduction The Applied Petrography Group at a meeting in London in 2015 began discussions concerning the organisa- tion of an inter-laboratory collaboration to measure and to compare the w/c ratio in hardened concrete by mi- croscopical methods between participating laboratories. In October 2016 the steering committee agreed that five separate test concrete samples should be prepared for this trial. Since this was an initial and exploratory trial of the methods in current use it was decided that a simplified concrete mix design should be used containing no chemical or mineral additions. The same mix design should be used for each sample with the only variable for the five samples being the w/c ratio which ranged from 0.35 to 0.55. These samples were prepared by the Tarmac Technical Centre at Lutterworth, UK in May, 2017. It was fully appreciated that these laboratory prepared samples would be very simplified versions of normal modern concretes and consequently the results obtained by participating laboratories would only be compa- rable with other laboratories using the same trial samples and any extrapolation of their results to the deter- mination of the w/c ratio of normal concretes should be treated with extreme caution. 1.1. Background The Applied Petrography Group (APG) is affiliated to the Engineering Group of the Geological Society of London and set up a calibration trial steering (CTS) sub-committee to organise, oversee the trial and produce a report on conclusion of this initial trial. The sub-committee was chaired by Mr Richard Fox and Dr Alan Poole was the Secretary. There were some changes to the sub-committee membership before stabilising as shown under the title heading. They were empowered to seek expert advice as necessary and have received numerous comments from APG members, following the presentation of a first draft to members.
Transcript of Determining w/c ratio in hardened concrete: an inter ...

17 April 2019
1
Determining w/c ratio in hardened concrete: an inter-laboratory trial by the
Applied Petrography Group
Steering Committee: R. Fox, A.B. Poole, R. Barnes, H. Wong, M. Eden, J. Ferrari, B. Wells.
Summary
In 2017, the Applied Petrography Group in London organised a pan-European inter-laboratory collaboration
to measure the water/cement (w/c) ratio in hardened concrete by microscopy to evaluate and compare meth-
ods used by participating laboratories. Determination of w/c ratio in hardened concrete is a critical measure
of concrete quality and is sometimes a subject of dispute in concrete strength and durability issues. Five sep-
arate prism samples with measured w/c ratios ranging from 0.35 to 0.55, but otherwise identical in mix de-
sign were prepared. Thick slices were cut from these samples and distributed. Initially, 14 laboratories across
Europe agreed to participate but the w/c ratios were withheld. These laboratories used a range of methods
that could be broadly divided into visual assessment methods, measurement of fluorescent intensity and
backscattered electron microscopy. Some laboratories made the w/c ratio determinations by more than one
method or operator. Consequently, 100 individual w/c ratio determinations were collected from 11 of the
participating laboratories. Comparing the results it was found that there was little significant difference be-
tween visual assessment and quantitative fluorescent methods. Overall, 58% of results were within ±0.05 of
the target value and 81% of results were within ±0.10 of the target value.
1. Introduction
The Applied Petrography Group at a meeting in London in 2015 began discussions concerning the organisa-
tion of an inter-laboratory collaboration to measure and to compare the w/c ratio in hardened concrete by mi-
croscopical methods between participating laboratories.
In October 2016 the steering committee agreed that five separate test concrete samples should be prepared
for this trial. Since this was an initial and exploratory trial of the methods in current use it was decided that a
simplified concrete mix design should be used containing no chemical or mineral additions. The same mix
design should be used for each sample with the only variable for the five samples being the w/c ratio which
ranged from 0.35 to 0.55. These samples were prepared by the Tarmac Technical Centre at Lutterworth, UK
in May, 2017.
It was fully appreciated that these laboratory prepared samples would be very simplified versions of normal
modern concretes and consequently the results obtained by participating laboratories would only be compa-
rable with other laboratories using the same trial samples and any extrapolation of their results to the deter-
mination of the w/c ratio of normal concretes should be treated with extreme caution.
1.1. Background
The Applied Petrography Group (APG) is affiliated to the Engineering Group of the Geological Society of
London and set up a calibration trial steering (CTS) sub-committee to organise, oversee the trial and produce
a report on conclusion of this initial trial. The sub-committee was chaired by Mr Richard Fox and Dr Alan
Poole was the Secretary. There were some changes to the sub-committee membership before stabilising as
shown under the title heading. They were empowered to seek expert advice as necessary and have received
numerous comments from APG members, following the presentation of a first draft to members.

17 April 2019
2
1.2. Objectives
Three objectives of this initial, exploratory first trial were identified by the CTS committee as follows:
(a) An investigation of the validity of optical fluorescence microscopy, visual assessment methods and
backscattered electron microscopy for determining the w/c ratio in simplified hardened concretes.
(b) An examination of the precision of the results obtained for each of the five trial specimens through a
normal range of w/c ratios.
(c) To compare the results obtained by the participating laboratories and to estimate inter-laboratory pre-
cision in determining the w/c ratio of hardened concrete.
1.3 Participating laboratories
Initially contact was made with 29 laboratories across the UK and Europe to enquire whether they would be
interested in participating in this trial. 14 laboratories agreed to participate and samples were dispatched to
the following:
Dr Maarten Broekmans, NGU (Norway)
Dr Alan Bromley (UK)
Dr Oguzhan Copuroglu, Delft University (Netherlands)
Mr Mike Eden, Sandberg (UK)
Dr Isabel Fernandes, University of Lisbon (Portugal)
Mr James Ferrari, RSK Ltd (UK)
Dr Gisli Guðmundsson, Mannvit (Iceland)
Dr Rachel Hardie, Heath & Hardie Geosciences (UK)
Dr Ulla Jakobsen, Danish Technological Institute (Denmark)
Mr Kiket Makoubi, Petroclays Materials Ltd. (UK)
Ms Alice Mitchinson, SLR Consulting (Ireland)
Mr Phil Raybould, Enterprise Petrography (UK)
Mr James Strongman, Petrolab Ltd. (UK)
Dr Hong Wong, Imperial College London (UK)
In order to maintain confidentiality each laboratory was allotted a unique laboratory reference number. Par-
ticipants were asked to report their findings and methodology on a pro-forma drafted by the Secretary (Ap-
pendix 3).
By June 2018, 11 of these laboratories had submitted their sets of 5 results, and some had presented more
than one set, either by using more than one analytical method, or by using several different petrographers to
produce the w/c ratio results submitted. This multiplicity of individual results and the method used to obtain
each result set are summarised in the next Section (see Table 2). In total, 20 complete sets of results, or 100
individual w/c ratio determinations were obtained.
2. Methodology
2.1 Specimen preparation
Taking account of all the initial discussions and the practical matters associated with the preparation of the
specimens it was agreed that in this first initial and exploratory trial, the sets of specimens should be a sim-
plified concrete mix, with CEM I Portland cement, 10 mm maximum size coarse aggregate and that no
chemical admixtures or mineral additives should be included. It was agreed that the mix design for all the
specimens should be standardised, with the only variable being the water/cement ratio.
Five concrete mixes were prepared and tested (Table 1). Details of the mix design were discussed by APG
members, but the final mix design was developed in close consultation with Michael Thomas (Tarmac Tech-
nical Centre, Lutterworth) who had carried out preliminary mix trials. Their exact w/c ratios were known

17 April 2019
3
only to the Chairman and Secretary of the CTS committee throughout the trial. CEM I 52.5N Portland ce-
ment was supplied by Tarmac/CRH, Tunstead. The average Bogue composition was 73.3% C3A, 11.5%
C2S, 7.3% C3A and 9.8% C4AF.
Coarse aggregate was Tunstead crushed limestone (4/10 mm) and fine aggregate was Alrewas natural quartz
sand (0/4 mm) (Fig. 1). The contents of water and cement were varied to achieve the target w/c ratio. Aggre-
gate to cement ratio was kept constant at 3.99 for all mixes. Aggregate absorption to saturated-surface dry
condition was considered in the mix design. The mixes were proportioned to have sufficient workability to
be cast without excessive voidage or honeycombing at w/c 0.35, but sufficient cohesion and segregation re-
sistance at w/c 0.55.
The laboratories of Tarmac Ltd., Lutterworth generously agreed to produce the sets of test specimens and
after undertaking trial mixes (observed by Dr I. Heritage and Dr A. Poole) a set of 5 prism specimens with
w/c ratios of 0.35, 0.40, 0.45, 0.5 and 0.55 were cast on the 16th May 2017 (Fig. 2). The 5 specimen prisms
were nominally 75 75 300 mm in size. The prisms were covered in polythene membrane for the first 24
hours, then demoulded and stored for 28 days at 20°C, 80% RH.
The detailed method statement for sample preparation and mix design data for each specimen was provided
by Tarmac and are appended to this report in Appendix 1 and Appendix 2 respectively. Photographs of the
fresh concrete mix and cast prism are provided in Appendix 2.
Table 1 Mix proportions at saturated-surface dry condition adjusted for yield (see Appendix 2 for details).
Mix
ID w/c
Free water
(kg/m3)
CEM I
(kg/m3)
Fine aggregate
(kg/m3)
Coarse aggregate
(kg/m3)
Theoretical
density(kg/m3)
A 0.35 157 450 898 898 2403
C 0.40 176 440 876 876 2369
E 0.45 192 428 853 853 2325
B 0.50 207 414 825 825 2271
D 0.55 230 417 831 831 2307
Fig. 1 Coarse and fine aggregates used (Photo: Alan Poole, 16th May 2017).

17 April 2019
4
Fig. 2 Preparation of concrete prisms at Tarmac Ltd., Lutterworth (Photo: Alan Poole, 16th May 2017).
After 28 days of curing, the prisms were sealed in polythene, packed in plastic containers and dispatched
(27th June 2017) to Sandberg Clapham laboratory where each prism was sliced transversely into 14 sub-spec-
imens each 17 mm thick. The first 5 mm at each end of each prism was discarded. The prisms were identi-
fied by the letters A, B, C, D and E but the identifications were randomised with respect to their w/c ratios
(Table 1). The slices were numbered 1-14, wrapped in cling film and sealed individually in polythene bags to
prevent drying and carbonation.
The 14 sets of 5 sub-specimens were then stored in a humidity cabinet until dispatch (28th July 2017) to Im-
perial College London, where they were photographed (back & front), repacked and distributed to participat-
ing laboratories. Figure 3 shows an example photographs (flatbed scanner) of the sub-specimens from set #3.
Fig. 3 Example photographs of the as received sub-specimens (set #3 from each prism). Cross-section of each
specimen was approximately 75 75 mm.

17 April 2019
5
2.2 Methods for determining w/c ratio
Each participating laboratory was required to measure w/c ratio using their routine, in-house methodology.
The methods employed fall into three main groups as follows:
a) Determining w/c ratio by visual assessment of cement paste characteristics.
b) Determining w/c ratio by visual (qualitative) or quantitative assessment of microporosity using fluo-
rescence microscopy.
c) Determining w/c ratio by measuring the unreacted cement, hydration products and capillary porosity
using quantitative backscattered electron microscopy.
The above techniques are described in the following sections of this report. It is important to note that trial
concretes would not have been affected by deterioration since placement and were simple concretes without
cement replacement materials and admixtures.
2.2.1 Visual assessment (VA)
The basis of this technique is that variations in free w/c ratio lead to variations in micro-texture, degree of
cement hydration and microporosity in cement paste in concrete that can be readily observed petrograph-
ically using thin sections. The principal parameters used to assess w/c ratio by this method are as follows:
Physical appearance of cement paste: The effects of very high w/c ratios of 0.65 or more are usually
obvious in the hand specimen and might include weak and friable cement paste, segregation and ex-
cessive bleeding. Very low w/c ratios may result in dark-coloured cement paste due to an increased
abundance of unhydrated cement.
Portlandite: As a general rule increases in w/c ratio result in increased cement hydration and in-
creased amount of portlandite in cement hydrates.
Cement hydration: As a general rule increases in w/c ratio result in corresponding increases in the
degree of cement hydration and reduced quantities of unhydrated cement.
Microporosity: As a general rule increases in w/c ratio result in increases in the microporosity of the
cement paste.
An important principal of this method is that no one parameter can be viewed in isolation. This is because
there are many factors that might lead to one or more of the parameters listed above being unreliable if used
to determine w/c ratio. Such factors might include:
Water reducing admixture (plasticiser): Especially at high dosages, plasticisers can reduce the de-
gree of cement hydration and can also influence microporosity.
Low temperature curing: Low temperature curing can affect rates of cement hydration and can lead
to increased quantities of unhydrated cement and the formation of unusually coarsely crystalline
portlandite.
Curing duration: Curing affects the degree of cement hydration, which in turn affects the amounts of
porlandite, unreacted cement and microporosity, irrespective of w/c ratio.
The above list is by no means exhaustive. It is important to note that an experienced petrographer should be
able to recognise conflicts between the degree of cement hydration and microporosity that could lead to un-
certainty in the petrographic assessment of w/c ratio. It is also important to note that this method is highly
dependent on the experience of the petrographer carrying out the method.
The use of reference concretes of different types made with known w/c ratios can greatly assist in w/c ratio
measurement by this method.

17 April 2019
6
2.2.2 Fluorescence microscopy (FM-V)
The principal of this method is that the microporosity of the cement paste in reference concretes of similar
type to the unknown concrete and made with differing w/c ratios is compared with the microporosity of the
cement paste in the unknown concrete [1-5]. The comparison can be made in two ways:
Visual comparison of fluorescent intensity using fluorescence microscopy. (FM-V)
Quantitative measurement of fluorescent intensity using fluorescence microscopy. (FM-Q)
Visual comparison of fluorescence microscopy is one of the most commonly applied techniques in the UK
and this technique was employed by the majority of the labs using the fluorescence method in this trial.
Quantitative measurement of fluorescence intensity has the potential to be more precise than visual assess-
ment as very small differences in fluorescence intensity can be detected that may not be visible to the human
eye.
The method of thin section preparation is especially critical to the precise application of this method as it is
highly sensitive to very small variations in thin section preparation methodology. Using automated methods
of thin section preparation, however, in conjunction with quantitative measurement of fluorescent intensity,
much higher degrees of precision are likely to be achievable than by the methods adopted by many of the
participants in this trial.
It is important to note that this method is especially sensitive to factors other than w/c ratio that can influence
microporosity and some experience is required in assessing whether or not this technique is appropriate for a
given type of concrete.
2.2.3 Backscattered electron microscopy (BSE)
The basis of this method is that the original cement content, water content and free w/c ratio of an unknown
concrete can be calculated from the microstructural phase assemblage at any time after setting. This is
achieved by measuring the volume fractions of capillary pores, hydration products and unreacted cement of
the hardened concrete using scanning electron microscopy in the backscattered mode [6-8].
Epoxy impregnated flat polished blocks or petrographic thin sections are prepared from the unknown con-
crete and imaged at high magnification (typically 500 or more). A large number of images are collected per
sample in a random and uniform manner so that bulk paste and paste near aggregate particles (interfacial
transition zone) are sampled. Image analysis is used to segment and measure the volume fractions of capil-
lary pores, unreacted cement and hydration products. Sufficiently large number of images is analysed until
the cumulative average reaches a steady value, thereby indicating representative sampling. The measured
volume fractions are then used to calculate the original cement and free water contents, and free w/c ratio.
The main advantage of this method is that it is quantitative and does not require comparison with reference
standards made of the same materials and cured to the same hydration degree as the unknown concrete. The
method is only applicable to concretes that have not experienced physical or chemical degradation such that
significant volumetric changes have occurred since hardening.
It should be noted that the calculated value is the free w/c ratio. The method assumes that aggregate absorp-
tion has been accounted in the mix design and that no water is lost through bleeding and/or evaporation from
the fresh concrete. Lab studies [6, 9] have shown that the latter occurs in concretes at high w/c ratios ( 0.5)
and that the method tends to underestimate the mix design w/c ratio unless water lost to bleeding and/or
evaporation is accounted.
17 April 2019
7
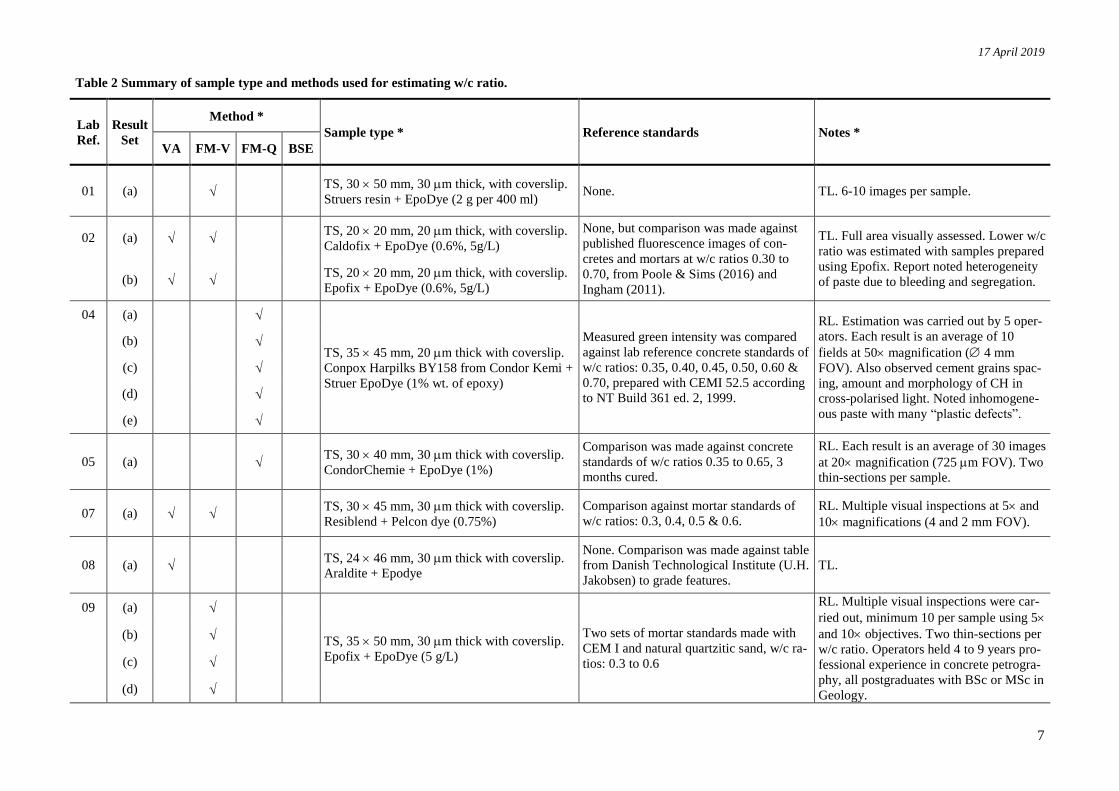
Table 2 Summary of sample type and methods used for estimating w/c ratio.
Lab
Ref.
Result
Set
Method *
Sample type * Reference standards Notes *
VA FM-V FM-Q BSE
01 (a) TS, 30 50 mm, 30 m thick, with coverslip.
Struers resin + EpoDye (2 g per 400 ml) None. TL. 6-10 images per sample.
02 (a) TS, 20 20 mm, 20 m thick, with coverslip.
Caldofix + EpoDye (0.6%, 5g/L)
None, but comparison was made against
published fluorescence images of con-
cretes and mortars at w/c ratios 0.30 to
0.70, from Poole & Sims (2016) and
Ingham (2011).
TL. Full area visually assessed. Lower w/c
ratio was estimated with samples prepared
using Epofix. Report noted heterogeneity
of paste due to bleeding and segregation. (b) TS, 20 20 mm, 20 m thick, with coverslip.
Epofix + EpoDye (0.6%, 5g/L)
04 (a)
TS, 35 45 mm, 20 m thick with coverslip.
Conpox Harpilks BY158 from Condor Kemi +
Struer EpoDye (1% wt. of epoxy)
Measured green intensity was compared
against lab reference concrete standards of
w/c ratios: 0.35, 0.40, 0.45, 0.50, 0.60 &
0.70, prepared with CEMI 52.5 according
to NT Build 361 ed. 2, 1999.
RL. Estimation was carried out by 5 oper-
ators. Each result is an average of 10
fields at 50 magnification ( 4 mm
FOV). Also observed cement grains spac-
ing, amount and morphology of CH in
cross-polarised light. Noted inhomogene-
ous paste with many “plastic defects”.
(b)
(c)
(d)
(e)
05 (a) TS, 30 40 mm, 30 m thick with coverslip.
CondorChemie + EpoDye (1%)
Comparison was made against concrete
standards of w/c ratios 0.35 to 0.65, 3
months cured.
RL. Each result is an average of 30 images
at 20 magnification (725 m FOV). Two
thin-sections per sample.
07 (a) TS, 30 45 mm, 30 m thick with coverslip.
Resiblend + Pelcon dye (0.75%)
Comparison against mortar standards of
w/c ratios: 0.3, 0.4, 0.5 & 0.6.
RL. Multiple visual inspections at 5 and
10 magnifications (4 and 2 mm FOV).
08 (a) TS, 24 46 mm, 30 m thick with coverslip.
Araldite + Epodye
None. Comparison was made against table
from Danish Technological Institute (U.H.
Jakobsen) to grade features.
TL.
09 (a)
TS, 35 50 mm, 30 m thick with coverslip.
Epofix + EpoDye (5 g/L)
Two sets of mortar standards made with
CEM I and natural quartzitic sand, w/c ra-
tios: 0.3 to 0.6
RL. Multiple visual inspections were car-
ried out, minimum 10 per sample using 5
and 10 objectives. Two thin-sections per
w/c ratio. Operators held 4 to 9 years pro-
fessional experience in concrete petrogra-
phy, all postgraduates with BSc or MSc in
Geology.
(b)
(c)
(d)

17 April 2019
8
11 (a) PB, 17 40 8 mm, Epofix + EpoDye (5 g/L) Not required.
30 images per sample at 500 magnifica-
tion (228 x 171 μm FOV). Two replicate
polished blocks per w/c ratio. Heterogene-
ous paste microstructure noted. Estimated
values are “free” w/c ratio, i.e. assuming
no water lost to bleeding and evaporation
in fresh concrete.
12 (a) TS, 45 67 mm, 30 m thick without co-
verslip. Araldite + EpoDye (0.2% wt.)
Comparison was made against concrete
standards at w/c ratios: 0.35, 0.40 0.45,
0.50, 0.55, 0.60, 0.65 & 0.70.
RL + TL, Entire thin section was scanned
and 5-10 representative areas examined in
detail at 200 (2 mm FOV). Porosity dis-
tribution suggests mix water not uniformly
distributed.
13 (a) TS, 45 60 mm, 30 m thick with coverslip.
Epotek + Epoye (0.5%)
No reference standards. Determination
was based on extrapolation from Fig. 4.62
of Poole & Sims (2016).
RL. One observation per sample at 10
magnification (2.6 mm FOV).
14 (a) TS, 50 75 mm, 30 m thick with coverslip.
MSDS + EpoDye (5 g/L) Two sets of concrete standards with w/c
ratios: 0.30 to 0.60 at 0.05 increment.
RL, 7 repeat measurements per thin-sec-
tion, averaged over 952 measurements.
Noted large standard deviation and stand-
ard error, such that the results are not reli-
able. This suggests there are variables, in
addition to w/c ratio, that may have af-
fected results e.g. differences in sample
preparation, and differences between un-
known sample and reference standards.
(b) TS, 50 75 mm, 30 m thick with coverslip.
Robnor + Orasol Blue (0.7g/100g) RL
* VA = Visual assessment of cement paste characteristics; FM-V = Visual assessment of fluorescent intensity; FM-Q = Quantitative assessment of fluorescent intensity; BSE =
Quantitative backscattered electron microscopy; TS = Thin-section; PB = Polished block; RL = Reflected light; TL = Transmitted light, FOV = Field of view.

17 April 2019
9
2.3 Analysis of results
The secretary copied all the sets of w/c ratio results, together with the methodologies that had been used by
the participating laboratories to CTS committee members on 6th April 2018 (with one additional late result
sent on 23rd June 2018). A generalised update concerning the results was also circulated to all APG members
on 16th May 2018 which read as follows:
11 organisations/laboratories across the UK and Europe (identified only by a reference number) have
provided sets of results. 100 individual test specimen determinations of w/c ratio have been collected.
Some laboratories provided sets of results by more than one method.
A first appraisal of the results suggest that the large majority are within ± 0.1 of the mix design target
values and near to 2/3 come to within ± 0.05 of the target value. Differences in the particular methods
used does not appear to make significant differences to the precision of the results obtained, but a more
accurate and thorough evaluation of the results will be provided by the CTS committee in due course.
3. Results
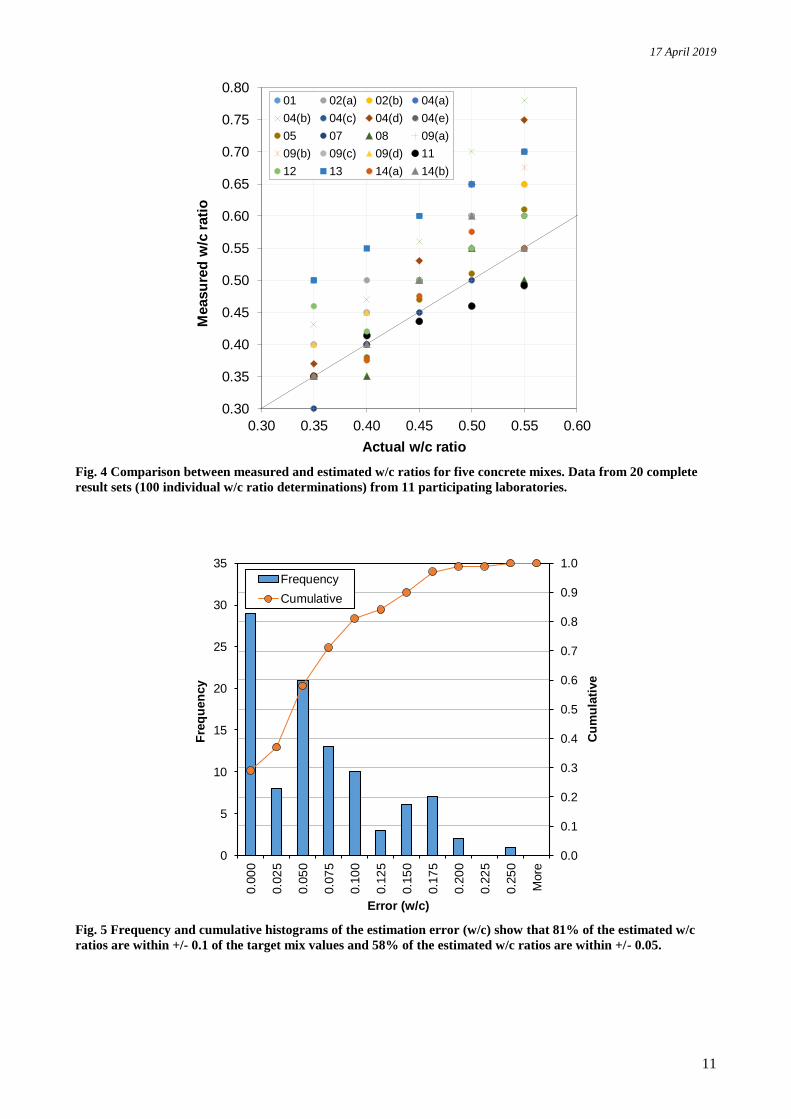
Table 3 summarises the results obtained. Fig. 4 shows a plot of the estimated w/c ratios against target mix
design w/c ratios. Note that some of the estimated w/c ratios were reported as a range. If a laboratory re-
turned a w/c estimate as ranging from x to y, then the average (= (x + y) / 2) was plotted. If a lab estimated
w/c as < x (or as > x), then x was plotted as the returned value.
Table 3 Estimated w/c ratios from all participants.
Lab
Ref. Method
Mix ID (Target w/c ratio)
A (0.35) C (0.40) E (0.45) B (0.50) D (0.55)
01 FM-V 0.5 > 0.45 0.60 < 0.65 0.55
02 (a) VA, FM-V 0.40 ± 0.1 0.50 ± 0.1 0.45 ± 0.1 0.55 ± 0.1 0.65 ± 0.1
02 (b) VA, FM-V 0.35 ± 0.1 0.40 ± 0.1 0.50 ± 0.1 0.55 ± 0.1 0.65 ± 0.1
04 (a) FM-Q 0.35 0.40 0.50 0.60 0.70
04 (b) FM-Q 0.43 0.47 0.56 0.70 0.78
04 (c) FM-Q 0.35 0.40 0.50 0.55 0.60
04 (d) FM-Q 0.37 0.40 0.53 0.65 0.75
04 (e) FM-Q 0.35 0.40 0.50 0.60 0.70
05 FM-Q 0.35 ± 0.04 0.38 ± 0.03 0.47 ± 0.06 0.51 ± 0.03 0.61 ± 0.03
07 VA, FM-V 0.30 ± 0.05 0.40 ± 0.05 0.45 ± 0.05 0.50 ± 0.05 0.55 ± 0.05
08 VA < 0.35 < 0.35 0.45-0.55 > 0.55 0.45-0.55
09 (a) FM-V < 0.3 ± 0.1 0.35-0.4 ± 0.05 0.4-0.50 ± 0.05 0.50 ± 0.1 0.60 ± 0.1
09 (b) FM-V 0.4 ± 0.05 0.45 ± 0.05 0.5 ± 0.05 0.6 ± 0.05 0.65-0.7 ± 0.1
09 (c) FM-V 0.35 ± 0.1 0.4 ± 0.1 0.45 ± 0.1 0.5 ± 0.1 0.6 ± 0.1
09 (d) FM-V 0.4 ± 0.1 0.45 ± 0.1 0.5 ± 0.1 0.6 ± 0.1 0.7 ± 0.1
11 BSE 0.35 ± 0.02 0.41 ± 0.02 0.44 ± 0.02 0.46 ± 0.02 0.49 ± 0.02
12 FM-V 0.46 ± 0.1 0.42 ± 0.1 0.50 ± 0.1 0.55 ±0.1 0.60 ± 0.1
13 VA 0.50 0.55 0.60 0.65 0.70
14 (a) FM-Q 0.35 ± 0.1 0.35-0.4 ± 0.1 0.45-0.5 ± 0.1 0.55-0.6 ± 0.1 0.55 ± 0.1
14 (b) VA 0.35 ± 0.05 0.40 ± 0.05 0.50 ± 0.05 0.60 ± 0.05 0.55 ± 0.05

17 April 2019
10
Some of the results were provided with an estimate of error or precision i.e. w/c ± confidence interval. How-
ever, it is unclear how this was defined or obtained in all cases except for Lab #5 (based on standard devia-
tion of the estimates from two thin-sections per series) and Lab #11 (based on 95% confidence interval). The
estimated errors reported by Labs #07, #09, #12 and #14 were based on previous work experience. Some
labs returned more than one precision. All of this in addition to variations in the test methods used further
complicate data analyses.
It is noted that of the 20 sets of w/c ratio results, 14 sets (70%) from 6 laboratories (i.e. 55% of participating
labs) gave the correct order of sample w/c ratios from low to high regardless of the absolute error. The fre-
quency and cumulative histograms in Fig. 5 show that 81% of the estimated w/c ratios are within +/- 0.1 of
the target mix values and 58% of the estimated w/c ratios are within +/- 0.05.
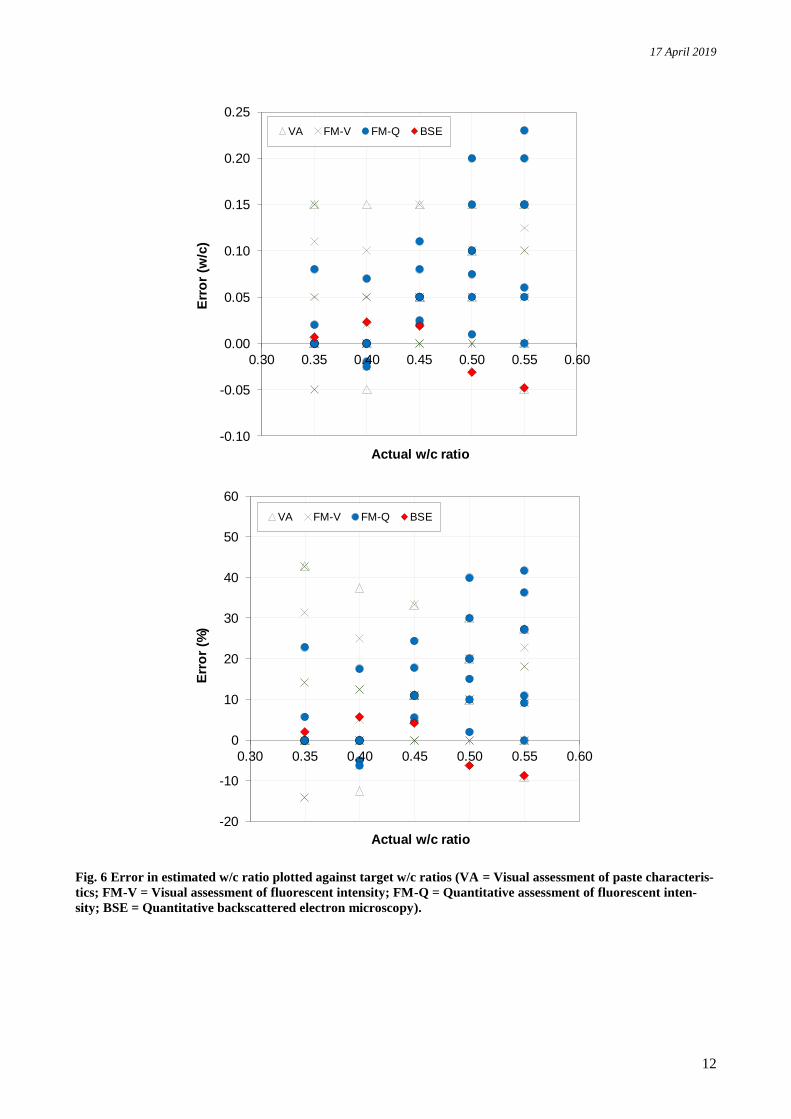
Fig. 6 shows that error in the estimated w/c ratio ranged from -0.058 to +0.23 or from -14% to +43%. The
magnitude of error does not appear to be strongly dependent on w/c ratio. However, of the 100 individual
determinations, 61% gave positive errors while only 10% were negative. The data show that w/c ratio tend to
be over-estimated, this is particularly the case for the VA and FM methods.
Fig. 7 shows the maximum, minimum and average error in the estimated w/c ratio, according to test method.
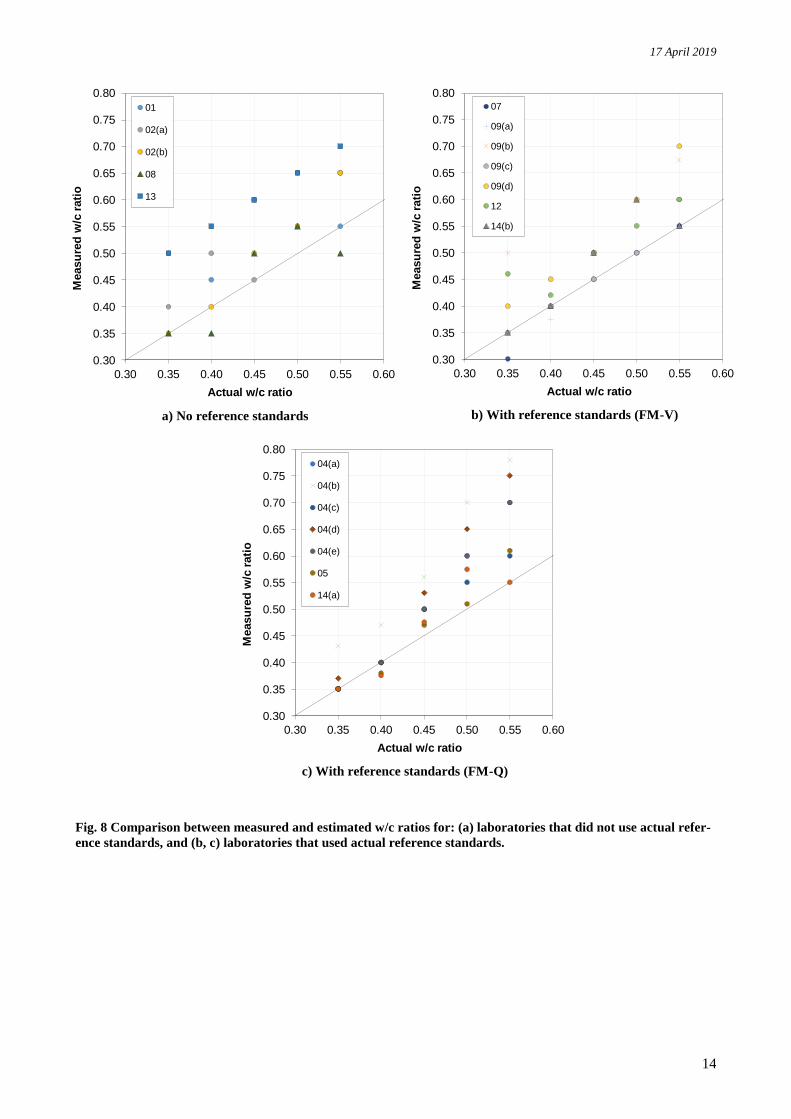
Fig. 8 compares the results from laboratories that did not use actual reference standards to results from labor-
atories that did, the latter divided to those that used FM-V and FM-Q methods.
17 April 2019
11
Fig. 4 Comparison between measured and estimated w/c ratios for five concrete mixes. Data from 20 complete
result sets (100 individual w/c ratio determinations) from 11 participating laboratories.
Fig. 5 Frequency and cumulative histograms of the estimation error (w/c) show that 81% of the estimated w/c
ratios are within +/- 0.1 of the target mix values and 58% of the estimated w/c ratios are within +/- 0.05.
0.30
0.35
0.40
0.45
0.50
0.55
0.60
0.65
0.70
0.75
0.80
0.30 0.35 0.40 0.45 0.50 0.55 0.60
Measu
red
w/c
rati
o
Actual w/c ratio
01 02(a) 02(b) 04(a)
04(b) 04(c) 04(d) 04(e)
05 07 08 09(a)
09(b) 09(c) 09(d) 11
12 13 14(a) 14(b)
0.0
0.1
0.2
0.3
0.4
0.5
0.6
0.7
0.8
0.9
1.0
0
5
10
15
20
25
30
35
0.0
00
0.0
25
0.0
50
0.0
75
0.1
00
0.1
25
0.1
50
0.1
75
0.2
00
0.2
25
0.2
50
More
Cu
mu
lati
ve
Fre
qu
en
cy
Error (w/c)
Frequency
Cumulative
17 April 2019
12
Fig. 6 Error in estimated w/c ratio plotted against target w/c ratios (VA = Visual assessment of paste characteris-
tics; FM-V = Visual assessment of fluorescent intensity; FM-Q = Quantitative assessment of fluorescent inten-
sity; BSE = Quantitative backscattered electron microscopy).
-0.10
-0.05
0.00
0.05
0.10
0.15
0.20
0.25
0.30 0.35 0.40 0.45 0.50 0.55 0.60
Err
or
(w/c
)
Actual w/c ratio
VA FM-V FM-Q BSE
-20
-10
0
10
20
30
40
50
60
0.30 0.35 0.40 0.45 0.50 0.55 0.60
Err
or
(%)
Actual w/c ratio
VA FM-V FM-Q BSE

17 April 2019
13
Fig. 7 Maximum, minimum and average error in the estimated w/c ratio. Error bars represent +/- standard devi-
ation (VA = Visual assessment of paste characteristics; FM-V = Visual assessment of fluorescent intensity; FM-Q
= Quantitative assessment of fluorescent intensity; BSE = Quantitative backscattered electron microscopy).
-0.10
-0.05
0.00
0.05
0.10
0.15
0.20
0.25
VA FM-V FM-Q BSE
Err
or
(w/c
)
Test method
Max error
Min error
Average error
17 April 2019
14
a) No reference standards
b) With reference standards (FM-V)
c) With reference standards (FM-Q)
Fig. 8 Comparison between measured and estimated w/c ratios for: (a) laboratories that did not use actual refer-
ence standards, and (b, c) laboratories that used actual reference standards.
0.30
0.35
0.40
0.45
0.50
0.55
0.60
0.65
0.70
0.75
0.80
0.30 0.35 0.40 0.45 0.50 0.55 0.60
Measu
red
w/c
rati
o
Actual w/c ratio
01
02(a)
02(b)
08
13
0.30
0.35
0.40
0.45
0.50
0.55
0.60
0.65
0.70
0.75
0.80
0.30 0.35 0.40 0.45 0.50 0.55 0.60
Measu
red
w/c
rati
o
Actual w/c ratio
07
09(a)
09(b)
09(c)
09(d)
12
14(b)
0.30
0.35
0.40
0.45
0.50
0.55
0.60
0.65
0.70
0.75
0.80
0.30 0.35 0.40 0.45 0.50 0.55 0.60
Measu
red
w/c
rati
o
Actual w/c ratio
04(a)
04(b)
04(c)
04(d)
04(e)
05
14(a)
17 April 2019
15
4. Statistical analysis
4.1 Preliminary considerations
4.1.1 Accuracy
Accuracy measures were claimed for many of the results submitted. However, reading the detailed submis-
sions indicated that, whilst some measures were based on a statistical analysis of many estimates, many were
non-quantifiable. It was therefore decided not to use this information. Additionally, it has little bearing on the
main objective of the study.
4.1.2 Ranges
Some measurements are reported as ranges, e.g. '0.1 - 0.2' or '> 0.1'. There are various statistical options for
dealing with such values but it is decided based both on the nature of the tests and the main objective of the
study, to treat each true range, i.e. a reported result shown as a minimum and a maximum, as the mid-point;
and to treat inequalities, i.e. less than or more than, as the actual value.
Additional information arising from responses to 'The Enquiry to Laboratories Participating in the APG In-
ter-laboratory w/c ratio in Concrete Trial - sent out 02/10/2018' does shed further light on the claimed error
bars, including one derived from the standard deviation of replicates and others based on experience. It is
suggested that any future work should collect more background data and hence to try to incorporate ranges,
which could give better results, including analysis of variance.
Starting with summary statistics we look at distribution-free (non-parametric) statistical tests. These are ana-
lytical tools that do not require the data to satisfy certain behavioural constraints, i.e. they make minimal as-
sumptions about the data. We then move on to those tests which do make assumptions about the data or,
more accurately, about the conditions under which the experiments were run.
4.2 Summary Statistics
4.2.1 Outliers and stragglers
It is impossible to unequivocally identify outliers as being anomalies which should be ignored, as opposed to
what might, in this case, be indicators of unreliability in either a laboratory or the process. However, routine
outlier analysis did identify some transcription errors (typographical errors) that occurred when the raw data
was transferred from the results form and complied, which were corrected. This point is noted in part to indi-
cate how easy it is for mistakes to enter into a data set, which can only be in small part be offset by using ro-
bust statistics. In the following, we frequently 'top and tail' the dataset as a rough form of robust estimation
but ideally a more thorough provenance analysis would be undertaken. In the following, reference to a robust
calculation is simply ignoring the lowest and highest values in the set.
4.2.2 Non-parametric statistics
The most basic non-parametric test is order: did the labs correctly order the samples? We can follow this
with a rank test and a measure of how different each result was from the correct value.
Only 7 out of 80 pairs were out of order, which implies that this is a good relative test, whether or not it is a
good absolute test. Furthermore, the arithmetic averages (over all labs) were in strict order and showed re-
markable consistency: all five averages of measured results were over-estimates and the errors (of each mix)
were well correlated with the results, cc 0.997 (confidence >99.99%). This implies that a simple linear cali-
bration could provide very good absolute accuracy, in addition to the extant relative accuracy, if given access
to a sufficient number of replications.
That is as far is we should try to take the non-parametric analysis of the whole data set. Additional analysis,
still without making assumptions about distributions, could include a between-labs test, to order the labs by
accuracy, or between-methods tests. Since the stated aim of the experiment was to judge methods, not labs,
we will look only at the latter.
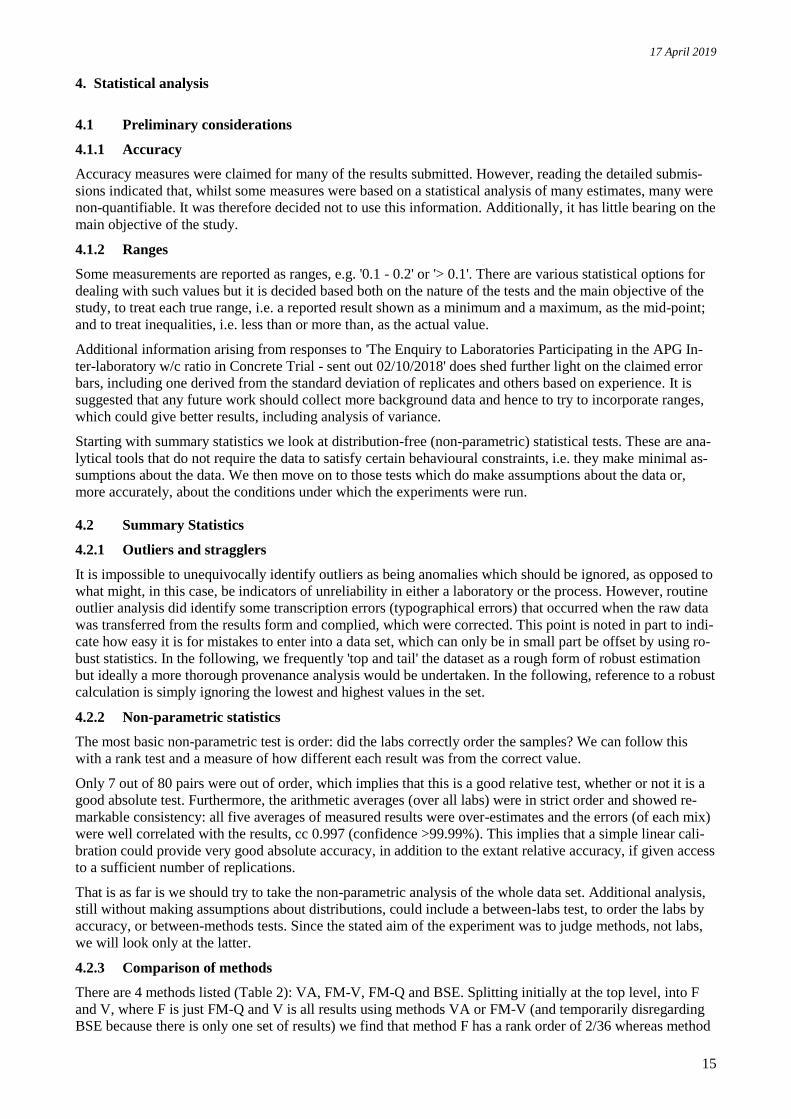
4.2.3 Comparison of methods
There are 4 methods listed (Table 2): VA, FM-V, FM-Q and BSE. Splitting initially at the top level, into F
and V, where F is just FM-Q and V is all results using methods VA or FM-V (and temporarily disregarding
BSE because there is only one set of results) we find that method F has a rank order of 2/36 whereas method

17 April 2019
16
V has a rank order of 5/16. This is sufficient difference to justify undertaking tests to establish the signifi-
cance and whether there is a statistical basis for declaring one method is better than the other. However, the
arithmetic mean error (Table 4) shows that there is not a clear distinction between the accuracy of the meth-
ods. There is also no significance difference in the accuracy of the methods between method F and method V
at 80% level on a student's T-test for means (unknown variance).
When the results at each w/c ratio are analysed individually, there is a noticeable difference between the
methods (Table 5). Method F shows increasing error with increase in w/c ratio, while method V shows rela-
tively consistent positive error. This does warrant further investigation, which, externally to statistical analy-
sis, could include examination of the standards used for visual comparison, the ability of the method to deter-
mine correctly at high w/c ratios, and whether the physical basis for the method scales linearly with w/c ra-
tio. However, it should be noted that this observed effect (of error increasing with w/c ratio) is based on a
small number of observations.
Further subdividing V into VA and FM-V does not introduce any further significant differences in these sta-
tistical tests.
Table 4 Arithmetic mean error.
Method Arithmetic mean error (all) Arithmetic mean error (robust)
F (FM-Q) 0.061 0.053
V (VA & FM-V) 0.056 0.052
BSE 0.025 N/A (only one sample)
Table 5 Percentage error (robust) at individual w/c ratio.
Method Mix ID (Target w/c ratio)
A (0.35) C (0.40) E (0.45) B (0.50) D (0.55)
F (FM-Q) 1.1% -1.3% 11.3% 19.0% 20.0%
V (VA & FM-V) 8.9% 5.5% 10.0% 12.5% 9.5%
BSE (only one sample) 0.00 0.01 -0.01 -0.04 -0.06
4.3 Standards
An apparently promising line of statistical enquiry is to subdivide the results into those with standards and
those without. This would be interesting in its own right but particularly apposite given the analysis of pre-
diction efficiency (later section). Preliminary results were compiled but the rationale seemed to be invali-
dated by responses received to enquiries sent out 02/10/2018. Of these, there is at least one that said "no
standards, we used Poole & Sims" and one that said "our standards are those in Poole and Sims". Further
analysis and questioning of the trialists may be required in order to justify this analysis. It is potentially of
critical importance for consideration of the prediction efficiency.
Additionally, we could, if required, check the significance of the rank order statistics using a Wilcoxon
signed rank test.
4.4 Calibration
Having noted that the errors for Method F and V appear to be linearly related to the data values, once subdi-
vided into top-level method (F, V), we could investigate the possibility that each could be corrected using a
straight line calibration, based on a least squared error fit within its own subdivided data set. Whilst this is
the same underlying principle (a least squared errors) as underpins bivariate regression, which is a parametric

17 April 2019
17
test, we are not making any assumptions about distributions if we simply fit a straight line by minimising the
errors of the points from the line.
As compared with the results in Table 5, this reduces the errors to those shown in Table 6. This is an indica-
tion that calibration and the formalisation of standards may have the potential to effect a considerable in-
crease in accuracy of the methods.
Table 6 Percentage error (robust) at individual w/c ratio, after correction using a simple linear calibration.
Method Mix ID (Target w/c ratio)
A (0.35) C (0.40) E (0.45) B (0.50) D (0.55)
F (FM-Q) 4.4% -6.2% 0.0% 2.6% -0.6%
V (VA & FM-V) 2.3% -2.1% -1.3% 0.9% 0.3%
5. Discussion
The application of fluorescence microscopy to measuring water/cement ratio is based on the scientifically
rigorous principal that for a simple concrete, the microporosity of the cement paste in concrete increases as
water/cement ratio increases. The term “simple concrete” refers to non-deteriorated and non-carbonated con-
crete of recent origin without plasticisers or other admixtures that can influence the microporosity of the ce-
ment paste in concrete. Using fluorescence microscopy, it is possible to directly establish the microporosity
of the cement paste rather than the concrete as a whole, and this is a significant advantage over other porosity
based test methods such as that given in BS 1881, Part 124 (2015) that cannot distinguish microporosity in
cement paste from porosity due to aggregate porosity and porosity resulting from entrapped and entrained air
voids in cement paste.
The relationship between fluorescence and apparent microporosity in thin sections becomes much less linear
at the extremes. The reasons for this are that at very low water/cement ratios the fluorescence levels become
much harder to detect. Similarly, at very high water/cement ratios the fluorescence becomes saturated and it
becomes increasingly difficult to detect differences in microporosity where the water/cement ratio exceeds
about 0.60.
The results from the participating laboratories using quantitative fluorescence microscopy (FM-Q) gave a
mean error of 0.06. The value for mean error does not, however convey the trend for the FM-Q method to
overestimate w/c ratio by a much greater extent compared to other methods when w/c ratio exceeds 0.50.
There are many potential sources of error unrelated to concrete type that can affect the measurement of wa-
ter/cement ratio by fluorescence microscopy many of which can be mitigated by technicians and petrogra-
phers skilled in the preparation and examination of concrete thin sections. Possible sources of error in the
fluorescence determination of water/cement ratio include:
• Variation in the quality of impregnation with resin containing fluorescent dye
• Size of the thin section used for the determination
• Accidental, partial removal of the fluorescent resin-impregnated zone during preliminary flattening
• Variation in thin section thickness
Many modern concretes do not fall within the definition of “simple concrete” given above. This means that
in many situations it would not be possible to rely wholly on fluorescence microscopy without taking into
consideration the many factors that can interfere with the relationship between microporosity and water/ce-
ment ratio such as the use of plasticisers, cement replacement materials and silica fume. For these reasons it
is usually necessary to consider other indicators of water/cement ratio such as:
• Degree of cement hydration / quantities of unhydrated cement
• Evidence for the presence of plasticisers

17 April 2019
18
• Portlandite size and abundance
• Porosity increase due to leaching or other processes of deterioration
• The effects of aggregate dust including micaceous dust
• Colour of the paste
• Excessive weakness / friability
• Segregation / bleeding
The assessment of water/cement ratio from the wide range of parameters listed above describes the “visual”
method of water/cement ratio assessment.
The results from the visual test methods not including FM-Q show a slightly lower mean error of 0.05 com-
pared to 0.06 for FM-Q. There is however a systematic trend for the visual test methods to overestimate w/c
ratio by about 10% over the entire range of 0.35-0.55. The FM-Q method, in contrast gave lower errors at
w/c ratios of ≤0.40 or less (-1.1 to -1.3%) and much higher errors at w/c ratios of ≥ 0.50 (19.6 to 21.8%).
Taking all test results obtained, irrespective of test method, more than 80% of the results obtained achieve an
accuracy of ≥ +/- 0.1. A small proportion of the results, mostly from one of the participating laboratories are
inexplicably high.
An important observation from several participants was the non-uniform distribution of microporosity in
some of the samples. This probably reflects inadequate mixing or possibly artefacts from the compaction of
the test samples and this may be factor in some of the outlying results. It is also possible that there may be
variations between the reference concretes used by some laboratories and the trial mix concretes such as
those caused by differing curing conditions and curing times.
One of the outcomes of this study is that it would form a useful basis for a more in-depth trial. Some consid-
erations for further work would include:
• Modifying the range of w/c ratios of the test specimens to include w/c ratios of 0.60 and possibly
greater. This may require increasing fines content to control bleeding.
• Using larger test specimens that could be cored. This would help mitigate variation in microporosity
and mix water dispersion caused by compaction effects at the contacts between the moulds and the
concrete.
• There was much variation in the methodology and types of information provided by each participat-
ing lab that have hindered the statistical analysis of the test results. The present trial would inform
future studies of the types of information required in order to carry out a rigorous statistical appraisal
of future w/c trial studies.
6. Conclusions
a) 5 simple concrete mixes with w/c ratios 0.35, 0.40, 0.45, 0.50 & 0.55 were prepared and cured for 28
days. Sub-sections from each mix were distributed to 14 organisations / laboratories across the UK
and Europe for w/c ratio determination using petrographic methods.
b) The methods included visual assessment (VA) of paste characteristics (e.g. colour, quantities of un-
reacted cement, portlandite, microporosity), visual assessment of fluorescent intensity (FM-V),
quantitative assessment of fluorescent intensity (FM-Q) and quantitative backscattered electron mi-
croscopy (BSE).
c) 11 organisations / laboratories provided 20 sets of complete results. In total 100 individual test speci-
men determinations of w/c ratio were received.
d) The majority (81%) of the test results are within +/- 0.1 of the target mix w/c ratios and 58% of the
results come to within +/- 0.05 of the target value. Error in the estimated w/c ratio ranged from -
0.058 to +0.23 or from -14% to +43%.
e) 14 sets of results from 6 laboratories gave the correct order of sample w/c ratios from low to high
regardless of the absolute error.

17 April 2019
19
f) 3 of the 11 participating laboratories measured w/c ratios of 0.70 or greater for the trial sample with
an actual w/c ratio of 0.55. Further work is required to understand the reasons for these outliers
given that these results are significantly outside of the range of w/c ratios that can be used in most
structural concrete types without generating substantial segregation, bleeding and laitance develop-
ment.
g) Further work is required to compare the two fluorescence techniques for measuring w/c ratio (de-
scribed in Section 2.2.2 of this report).
h) Statistical analysis show that 73 of the 80 pairs were correctly ordered and the arithmetic averages
over all labs were in strict order and showed remarkable consistency. Visual assessment methods
(VA & FM-V) tended to over-estimate w/c ratio while quantitative fluorescence method (FM-Q)
showed increasing error with increase in w/c ratio.
Acknowledgements
The Applied Petrography Group wish to express their sincere thanks to the Engineering Group of the Geo-
logical Society for their continuing support. To Michael Thomas of the Tarmac Technical Centre, Lutter-
worth for preparing the test specimens, to Mike Eden of Sandbergs Ltd. for production of the test sub-speci-
mens and to Hong Wong of Imperial College, London for the storage and distribution of the sets of sub-
specimens. The APG CTS committee also particularly wish to thank all the laboratories that have partici-
pated in this trial.

17 April 2019
20
Appendix 1: Method statement for the casting of the APG w/c ratio trial specimens
Location: Tarmac Technical Centre
Gibbet Lane
Shawell
Lutterworth
Leicestershire
LE17 6AA
Proposed Casting Date: 18th May 2017
Objective:
Cast 5*no. concrete prisms of dimension 300mm*80mm*80mm with w/c of 0.35, 0.40, 0.45, 0.50, and 0.55
respectively, and cure for 28 days at 20oC and 80% RH.
Method:
The concrete mixture for casting the prisms to be composed of cement type CEMI, 4/10mm crushed lime-
stone coarse aggregate, 0/4mm natural quartz sand, and water only.
With the exception of the water content, the mass and proportion of the constituents to be kept constant for
each prism.
The concrete mixture to be proportioned to have sufficient workability to be cast without excessive voidage
or honeycombing at the 0.35 w/c, but sufficient cohesion and segregation resistance at the 0.55 w/c.
Having arrived at a suitable mixture to satisfy the above, the following detail to be followed:
1. Not more than 24 hours before casting the prisms, oven dry the crushed limestone and sand and allow
to cool to ambient temperature in a controlled atmosphere. Record temperature and humidity.
2. Calibrate the prism moulds.
3. Starting with the 0.35 w/c mix, using a calibrated and checked balance, pre weigh the CEMI, lime-
stone, sand, and water into separate containers.
4. Add the limestone and sand to the mixing bowl of a 5 litre capacity “Hobart” mixer and, uniformly
distribute by hand, and then add 2/3 of the mixing water.
5. Cover the bowl with a damp cloth and allow to stand/soak for 10 minutes.
6. Remove the cloth from the bowl, attach the mixing blade and mix at low speed (setting 1) for 15 sec-
onds. Add the CEMI and start the timer. Add the remaining 1/3 of the mixing water and mix at low
speed for 30 seconds until the CEMI is fully incorporated into the mixture. Increase speed to medium
(setting 2) and mix for a further 5 minutes.
7. Stop the mixer, remove the blade and, using a metal spatula, scrape any unmixed material from the
sides and base of the bowl and incorporate into the mixture. Re-attach the blade and continue mixing
for another minute.
8. Remove the blade and bowl from the mixer, visually check the mixture for homogeneity.
9. Locate the prism mould on the vibrating table, and fill to 2/3rds depth as uniformally as possible. Vi-
brate for 90 seconds, or until no air bubbles appear. Avoid over-vibrating and segregation of the mix-
ture. Fill the mould to the top and again vibrate for 90 seconds, adding additional material to keep the
mixture slightly proud of the mould.
10. Transfer the filled mould to the curing room and cover with polythene membrane. Label and leave to
stand undisturbed for 24 hours.
11. Repeat items 4 to 10 for the 0.4 w/c mixture, but reduce the time on the vibrating table to 60 seconds
for each layer.

17 April 2019
21
12. Repeat items 4 to 10 for the 0.45 w/c and 0.50 w/c mixtures, but DO NOT vibrate. Hand tamp as re-
quired to achieve full compaction.
13. Repeat items 4 to 10 for the 0.55 w/c mixture. DO NOT vibrate or hand tamp. Fill the mould in two
layers and lightly tap the mould with a rubber mallet at each fill.
14. 24 hours after casting carefully strip the moulds, remove any flashings. Visually check the prisms for
satisfactory compaction, and photograph. Apply an identification label before transferring to the hu-
midity cabinet. Ensure this process is carried out one prism at a time to eliminate any possibility of
miss-identification of the prisms.
15. Record the max/min temps and RH of the curing room.
16. At the beginning and end of each work shift, record the temperature and RH of the humidity cabinet
for the duration of the curing period.
17. When ready for collection, remove the prisms from the humidity cabinet and seal in polythene before
packing in plastic containers for transport. Ensure adequate packaging to guard against damage to the
prisms.
Collate all records and make available to APG.
End of Method Statement.
Michael L. Thomas
Technical Optimization Manager - RMX

17 April 2019
22
Appendix 2: Mix design
Mix A (w/c 0.35)
Notes:
“Coarse Aggregate 1” refers to 4/10 crushed limestone coarse aggregate.
“Coarse aggregate 2” refers to the 0/4mm natural quartz sand.
“Water in aggregate” refers to the water added to bring the oven-dried aggregates to saturated surface dry state.
“Water added to achieve target slump” is the total water used in the trial mix.
v5mlt30sep16
JOB TRIAL MIX NO. OTHER
Trial Mix Ref. No. 1900 R8
Description
Pot Volume(litres) 1.646
Pot Number
Aggregate/Cement Ratio 3.99 Coarse Aggregate 1 0 0
Cement Content 450 Coarse Aggregate 2 0 0
Extender % 0 Fine Aggregate 1 0 0
Trial Mix Volume (litres) 3 Fine Aggregate 2 0 0
Target Slump(mm)
Fine Aggregate % 0.0 Date 18/05/2017
Water/Cement Ratio 0.35
Operator : Dipak Mistry Trial Attended by:
Cube Reference Numbers
WEIGHTS
CORRECTED
CEM I 450 450.0 1.350 450 450
0 0 0.0 0.000 0 0
0 0 0.0 0.000 0 0
Filler 0 0.0 0.000 0 0
Coarse Aggregate 1 897 883.5 2.651 897.00 898
Coarse Aggregate 2 897 896.1 2.688 897 898
Fine Aggregate 1 0 0.0 0.000 0 0
Fine Aggregate 2 0 0.0 0.000 0 0
0.000 0.0 0.000 0 0
0.000 0.0 0.000 0 0
0.000 0.0 0.000 0 0
Microsilica slurry 0 0.0 0.000 0 0
-14 -14
0.515 172 172
157 157
2401 2403
3.955 Plastic Density (kg/m3) A 2403
2403
1.00 Cube age (days/No.) Stress (N/mm2) Density (Kg/m
3)
2403
Material Lab Ref No. Supplier Source Type Absorption (%)
Cement CRH Tunstead CEM I N/A
Extender 1 N/A
Extender 2 N/A
Filler N/A
Coarse Aggregate 1 Tarmac Tunstead 110L0410C 1.5
Coarse Aggregate 2 Tarmac Alrewas 110S04MCW 0.1
Fine Aggregate 1
Fine Aggregate 2
Lab Ref No. Supplier Type Dose (% by mass of
cement)S.G.
Admixture 1
Admixture 2
Admixture 3
Microsilica slurry
Theoretical m3
Batch Weights
(kg) (Adjusted
for Moisture in
Aggregates)
Standard Concrete Trial-Mix Form
Constituents
Trial Mix Batch
Weights (kg)
SSD m3 Batch
Weights
(adjusted for
yield) (kg)
Water in Aggregates (kg)
Water added to achieve target Slump
Material
Air Content (%)
Plastic Density (kg/m3)
Yield
w/c 0.35
Total Free Water (litres)
Theoretical Density (kg/m3)
Mass of Fresh Concrete in Pot (kg) A
Theoretical
ssd m3 Batch
Weights (kg)
Moisture Content (%)

17 April 2019
23
Mix C (w/c 0.40)
Notes:
“Coarse Aggregate 1” refers to 4/10 crushed limestone coarse aggregate.
“Coarse aggregate 2” refers to the 0/4mm natural quartz sand.
“Water in aggregate” refers to the water added to bring the oven-dried aggregates to saturated surface dry state.
“Water added to achieve target slump” is the total water used in the trial mix.
v5mlt30sep16
JOB TRIAL MIX NO. OTHER
Trial Mix Ref. No. 1900 R9
Description
Pot Volume(litres) 1.646
Pot Number
Aggregate/Cement Ratio 3.99 Coarse Aggregate 1 0 0
Cement Content 440 Coarse Aggregate 2 0 0
Extender % 0 Fine Aggregate 1 0 0
Trial Mix Volume (litres) 3 Fine Aggregate 2 0 0
Target Slump(mm)
Fine Aggregate % 0.0 Date 18/05/2017
Water/Cement Ratio 0.40
Operator : Dipak Mistry Trial Attended by:
Cube Reference Numbers
WEIGHTS
CORRECTED
CEM I 450 450.0 1.350 450 440
0 0 0.0 0.000 0 0
0 0 0.0 0.000 0 0
Filler 0 0.0 0.000 0 0
Coarse Aggregate 1 897 883.5 2.651 897.00 876
Coarse Aggregate 2 897 896.1 2.688 897 876
Fine Aggregate 1 0 0.0 0.000 0 0
Fine Aggregate 2 0 0.0 0.000 0 0
0.000 0.0 0.000 0 0
0.000 0.0 0.000 0 0
0.000 0.0 0.000 0 0
Microsilica slurry 0 0.0 0.000 0 0
-14 -14
0.584 195 195
180 176
2424 2369
3.899 Plastic Density (kg/m3) A 2369
2369
1.02 Cube age (days/No.) Stress (N/mm2) Density (Kg/m
3)
2369
Material Lab Ref No. Supplier Source Type Absorption (%)
Cement CRH Tunstead CEM I N/A
Extender 1 N/A
Extender 2 N/A
Filler N/A
Coarse Aggregate 1 Tarmac Tunstead 110L0410C 1.5
Coarse Aggregate 2 Tarmac Alrewas 110S04MCW 0.1
Fine Aggregate 1
Fine Aggregate 2
Lab Ref No. Supplier Type Dose (% by mass of
cement)S.G.
Admixture 1
Admixture 2
Admixture 3
Microsilica slurry
Theoretical m3
Batch Weights
(kg) (Adjusted
for Moisture in
Aggregates)
Standard Concrete Trial-Mix Form
Constituents
Trial Mix Batch
Weights (kg)
SSD m3 Batch
Weights
(adjusted for
yield) (kg)
Water in Aggregates (kg)
Water added to achieve target Slump
Material
Slump @ T10 (mm)
Air Content (%)
Plastic Density (kg/m3)
Yield
w/c 0.40
Total Free Water (litres)
Theoretical Density (kg/m3)
Mass of Fresh Concrete in Pot (kg) A
Theoretical
ssd m3 Batch
Weights (kg)
Moisture Content (%)
17 April 2019
24
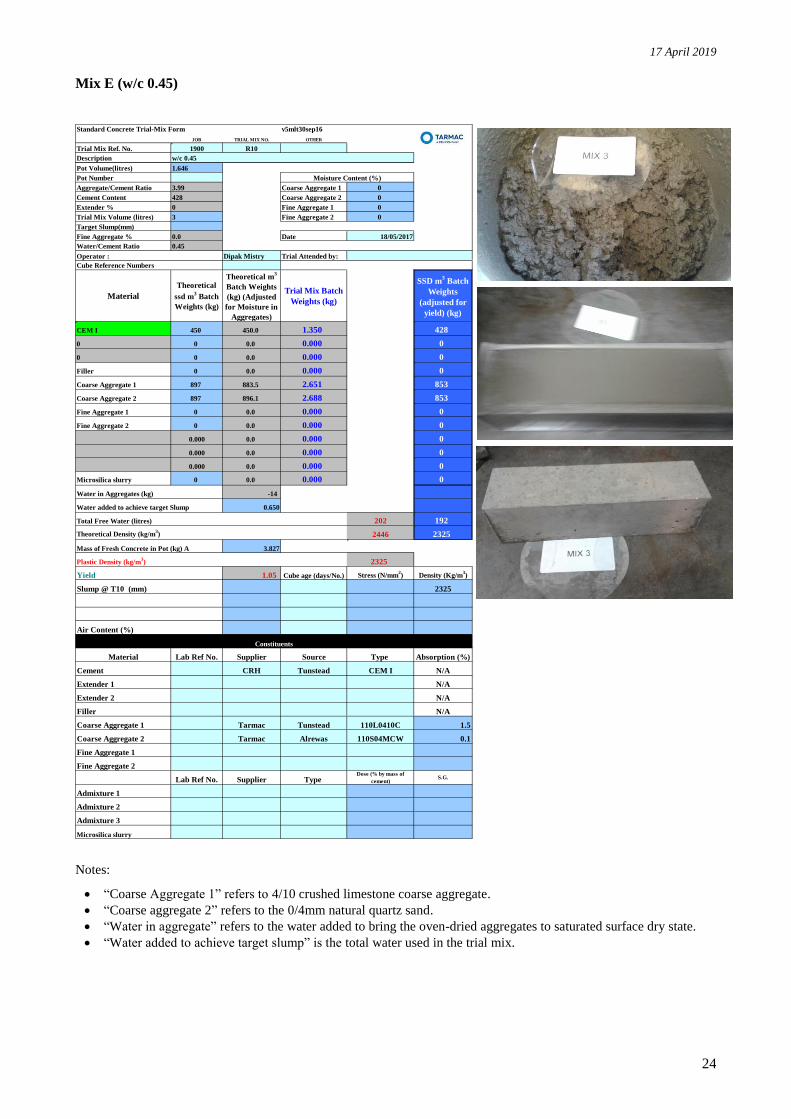
Mix E (w/c 0.45)
Notes:
“Coarse Aggregate 1” refers to 4/10 crushed limestone coarse aggregate.
“Coarse aggregate 2” refers to the 0/4mm natural quartz sand.
“Water in aggregate” refers to the water added to bring the oven-dried aggregates to saturated surface dry state.
“Water added to achieve target slump” is the total water used in the trial mix.
v5mlt30sep16
JOB TRIAL MIX NO. OTHER
Trial Mix Ref. No. 1900 R10
Description
Pot Volume(litres) 1.646
Pot Number
Aggregate/Cement Ratio 3.99 Coarse Aggregate 1 0 0
Cement Content 428 Coarse Aggregate 2 0 0
Extender % 0 Fine Aggregate 1 0 0
Trial Mix Volume (litres) 3 Fine Aggregate 2 0 0
Target Slump(mm)
Fine Aggregate % 0.0 Date 18/05/2017
Water/Cement Ratio 0.45
Operator : Dipak Mistry Trial Attended by:
Cube Reference Numbers
WEIGHTS
CORRECTED
CEM I 450 450.0 1.350 450 428
0 0 0.0 0.000 0 0
0 0 0.0 0.000 0 0
Filler 0 0.0 0.000 0 0
Coarse Aggregate 1 897 883.5 2.651 897.00 853
Coarse Aggregate 2 897 896.1 2.688 897 853
Fine Aggregate 1 0 0.0 0.000 0 0
Fine Aggregate 2 0 0.0 0.000 0 0
0.000 0.0 0.000 0 0
0.000 0.0 0.000 0 0
0.000 0.0 0.000 0 0
Microsilica slurry 0 0.0 0.000 0 0
-14 -14
0.650 217 217
202 192
2446 2325
3.827 Plastic Density (kg/m3) A 2325
2325
1.05 Cube age (days/No.) Stress (N/mm2) Density (Kg/m
3)
2325
Material Lab Ref No. Supplier Source Type Absorption (%)
Cement CRH Tunstead CEM I N/A
Extender 1 N/A
Extender 2 N/A
Filler N/A
Coarse Aggregate 1 Tarmac Tunstead 110L0410C 1.5
Coarse Aggregate 2 Tarmac Alrewas 110S04MCW 0.1
Fine Aggregate 1
Fine Aggregate 2
Lab Ref No. Supplier Type Dose (% by mass of
cement)S.G.
Admixture 1
Admixture 2
Admixture 3
Microsilica slurry
Theoretical m3
Batch Weights
(kg) (Adjusted
for Moisture in
Aggregates)
Standard Concrete Trial-Mix Form
Constituents
Trial Mix Batch
Weights (kg)
SSD m3 Batch
Weights
(adjusted for
yield) (kg)
Water in Aggregates (kg)
Water added to achieve target Slump
Material
Slump @ T10 (mm)
Air Content (%)
Plastic Density (kg/m3)
Yield
w/c 0.45
Total Free Water (litres)
Theoretical Density (kg/m3)
Mass of Fresh Concrete in Pot (kg) A
Theoretical
ssd m3 Batch
Weights (kg)
Moisture Content (%)

17 April 2019
25
Mix B (w/c 0.50)
Notes:
“Coarse Aggregate 1” refers to 4/10 crushed limestone coarse aggregate.
“Coarse aggregate 2” refers to the 0/4mm natural quartz sand.
“Water in aggregate” refers to the water added to bring the oven-dried aggregates to saturated surface dry state.
“Water added to achieve target slump” is the total water used in the trial mix.
v5mlt30sep16
JOB TRIAL MIX NO. OTHER
Trial Mix Ref. No. 1900 R11
Description
Pot Volume(litres) 1.646
Pot Number
Aggregate/Cement Ratio 3.99 Coarse Aggregate 1 0 0
Cement Content 414 Coarse Aggregate 2 0 0
Extender % 0 Fine Aggregate 1 0 0
Trial Mix Volume (litres) 3 Fine Aggregate 2 0 0
Target Slump(mm)
Fine Aggregate % 0.0 Date 18/05/2017
Water/Cement Ratio 0.50
Operator : Dipak Mistry Trial Attended by:
Cube Reference Numbers
WEIGHTS
CORRECTED
CEM I 450 450.0 1.350 450 414
0 0 0.0 0.000 0 0
0 0 0.0 0.000 0 0
Filler 0 0.0 0.000 0 0
Coarse Aggregate 1 897 883.5 2.651 897.00 825
Coarse Aggregate 2 897 896.1 2.688 897 825
Fine Aggregate 1 0 0.0 0.000 0 0
Fine Aggregate 2 0 0.0 0.000 0 0
0.000 0.0 0.000 0 0
0.000 0.0 0.000 0 0
0.000 0.0 0.000 0 0
Microsilica slurry 0 0.0 0.000 0 0
-14 -14
0.717 239 239
225 207
2469 2271
3.738 Plastic Density (kg/m3) A 2271
2271
1.09 Cube age (days/No.) Stress (N/mm2) Density (Kg/m
3)
2271
Material Lab Ref No. Supplier Source Type Absorption (%)
Cement CRH Tunstead CEM I N/A
Extender 1 N/A
Extender 2 N/A
Filler N/A
Coarse Aggregate 1 Tarmac Tunstead 110L0410C 1.5
Coarse Aggregate 2 Tarmac Alrewas 110S04MCW 0.1
Fine Aggregate 1
Fine Aggregate 2
Lab Ref No. Supplier Type Dose (% by mass of
cement)S.G.
Admixture 1
Admixture 2
Admixture 3
Microsilica slurry
Theoretical m3
Batch Weights
(kg) (Adjusted
for Moisture in
Aggregates)
Standard Concrete Trial-Mix Form
Constituents
Trial Mix Batch
Weights (kg)
SSD m3 Batch
Weights
(adjusted for
yield) (kg)
Water in Aggregates (kg)
Water added to achieve target Slump
Material
Slump @ T10 (mm)
Air Content (%)
Plastic Density (kg/m3)
Yield
w/c 0.50
Total Free Water (litres)
Theoretical Density (kg/m3)
Mass of Fresh Concrete in Pot (kg) A
Theoretical
ssd m3 Batch
Weights (kg)
Moisture Content (%)

17 April 2019
26
Mix D (w/c 0.55)
Notes:
“Coarse Aggregate 1” refers to 4/10 crushed limestone coarse aggregate.
“Coarse aggregate 2” refers to the 0/4mm natural quartz sand.
“Water in aggregate” refers to the water added to bring the oven-dried aggregates to saturated surface dry state.
“Water added to achieve target slump” is the total water used in the trial mix.
v5mlt30sep16
JOB TRIAL MIX NO. OTHER
Trial Mix Ref. No. 1900 R12
Description
Pot Volume(litres) 1.646
Pot Number
Aggregate/Cement Ratio 3.99 Coarse Aggregate 1 0 0
Cement Content 417 Coarse Aggregate 2 0 0
Extender % 0 Fine Aggregate 1 0 0
Trial Mix Volume (litres) 3 Fine Aggregate 2 0 0
Target Slump(mm)
Fine Aggregate % 0.0 Date 18/05/2017
Water/Cement Ratio 0.55
Operator : Dipak Mistry Trial Attended by:
Cube Reference Numbers
WEIGHTS
CORRECTED
CEM I 450 450.0 1.350 450 417
0 0 0.0 0.000 0 0
0 0 0.0 0.000 0 0
Filler 0 0.0 0.000 0 0
Coarse Aggregate 1 897 883.5 2.651 897.00 831
Coarse Aggregate 2 897 896.1 2.688 897 831
Fine Aggregate 1 0 0.0 0.000 0 0
Fine Aggregate 2 0 0.0 0.000 0 0
0.000 0.0 0.000 0 0
0.000 0.0 0.000 0 0
0.000 0.0 0.000 0 0
Microsilica slurry 0 0.0 0.000 0 0
-14 -14
0.787 262 262
248 230
2492 2307
3.798 Plastic Density (kg/m3) A 2307
2307
1.08 Cube age (days/No.) Stress (N/mm2) Density (Kg/m
3)
2307
Material Lab Ref No. Supplier Source Type Absorption (%)
Cement CRH Tunstead CEM I N/A
Extender 1 N/A
Extender 2 N/A
Filler N/A
Coarse Aggregate 1 Tarmac Tunstead 110L0410C 1.5
Coarse Aggregate 2 Tarmac Alrewas 110S04MCW 0.1
Fine Aggregate 1
Fine Aggregate 2
Lab Ref No. Supplier Type Dose (% by mass of
cement)S.G.
Admixture 1
Admixture 2
Admixture 3
Microsilica slurry
Theoretical m3
Batch Weights
(kg) (Adjusted
for Moisture in
Aggregates)
Standard Concrete Trial-Mix Form
Constituents
Trial Mix Batch
Weights (kg)
SSD m3 Batch
Weights
(adjusted for
yield) (kg)
Water in Aggregates (kg)
Water added to achieve target Slump
Material
Slump @ T10 (mm)
Air Content (%)
Plastic Density (kg/m3)
Yield
w/c 0.55
Total Free Water (litres)
Theoretical Density (kg/m3)
Mass of Fresh Concrete in Pot (kg) A
Theoretical
ssd m3 Batch
Weights (kg)
Moisture Content (%)

17 April 2019
27
Appendix 3: Results form
The Applied Petrography Group Inter-Laboratory w/c Ratio in Concrete Calibration Trial
A set of 5 individually identified calibration trial sub-specimens are now available for your laboratory
To insure confidentiality your laboratory will only be identified by its laboratory reference number.
Please Note that Your LABORATORY IDENTIFICATION REFERENCE NUMBER is: xx
LABORATORY METHOD(S) AND RECORD OF RESULTS
(Please complete with as much detail concerning methods used as possible. Extend the form if necessary. The headings below are suggested as guidance for the sorts of information that would be useful).
1. OPTICAL FLUORESCENCE METHOD(S) AND RESULTS OBTAINED
1.1 Details of the Equipment Used Microscope: …………………………………………………………………………………………………………..
UV source: ………………………………Filters used: …………………………………………………………
Wavelength/frequency of band of optical radiation used: …………………………………….
Detector type/make: …………………………………………………………………………….................
Measurements made in: Reflected light: ……. Transmitted light: ………. (Please tick)
1.2 Thin Section Manufacture Method Used Resin used in thin section manufacture: …………………………Refractive Index ……………
Yellow fluorescent dye used in the thin section: ……………………………………………….
Concentration of dye in the resin: …………………………………………………………………….
Thin section thickness in µm: ……………… Cover slip used: Yes/No ……… (Please tick):
1.3 The Measurement Strategy Used Comparison against standards? Details of comparative standards: w/c ratios: ………………….
……….…………………………… Details of the standards cement/concrete type: …………………………..
Fluorescent measurement: Integrated over:……..seconds/Instantaneous measurement : …
Number of repeat measurements: …… Averaged over …… measurements
Results: Standard Deviation, (2σ): ………………….. /or estimated error: ± ……………………
Fluorescence Results Obtained
Sub-Specimen & Measured No. of Repeat w/c Ratio determined Estimated
Sub-script number Intensity Readings by Laboratory: xx Error
A
B
C
D
E
Page 1 of 2

17 April 2019
28
LABORATORY METHOD(S) AND RECORD OF RESULTS
LABORATORY IDENTIFICATION REFERENCE NUMBER: xx
2. OTHER METHOD(S) AND RESULTS OBTAINED
2.1 Basis of Method(s): …………………………………………………………………………………………………………..
2.2 Brief Summary of Equipment used …………………………………………………………………………………
……………………………………………………………………………………………………………………………………………………
……………………………………………………………………………………………………………………………………………………
2.3 Sample Type and Preparation: ……………………………………………………………………………………….
……………………………………………………………………………………………………………………………………………………
2.4 The Measurement Strategy Used: …………………………………………………………………………
……………………………………………………………………………………………………………………………………………………
Comparison against standards? ........... Details of comparative standards: w/c ratios: …………….
……….…………………………… Details of standards cement/concrete type: ……………………………………….
……………………………………………………………………………………………………………………………………………………
……………………………………………………………………………………………………………………………………………………
Number of Repeat Measurements: …………………………. Results are Averages of: ………………….
Results, Standard Deviation, (2σ): ………………….. /or estimated error: ± ……………………
Method Type & Results Obtained
Sub-Specimen & Basis of No. of Repeat w/c Ratio determined Estimated
Sub-script number Measurement Readings by Laboratory: xx Error
A
B
C
D
E
3. Any Other Relevant Comments Concerning the Methods Used or the Results Obtained? ……………………………………………………………………………………………………………………………………………
……………………………………………………………………………………………………………………………………………
……………………………………………………………………………………………………………………………………………
……………………………………………………………………………………………………………………………………………
Please complete this form with as much information as you consider relevant and return it to CTS Secretary ([email protected]) as soon as possible please.
Page 2 of 2

17 April 2019
29
References
[1] NT Build 361-1999 Concrete, Hardened: Water-Cement Ratio, Nordtest Method, 1999.
[2] B. Mayfield, The quantitative evaluation of the water/cement ratio using fluorescence microscopy,
Magazine of Concrete Research, 42 (1990) 45-49.
[3] J. Elsen, N. Lens, T. Aarre, D. Quenard, V. Smolej, Determination of the wc ratio of hardened cement
paste and concrete samples on thin sections using automated image analysis techniques, Cement and
Concrete Research, 25 (1995) 827-834.
[4] U.H. Jakobsen, D.R. Brown, Reproducibility of w/c ratio determination from fluorescent impregnated
thin sections, Cement and Concrete Research, 36 (2006) 1567-1573.
[5] U.H. Jakobsen, P. Laugesen, N. Thaulow, Determination of Water-Cement Ratio in Hardened Concrete
by Optical Fluorescence Microscopy, ACI Special Publication, 191-3 (1999) 27-41.
[6] H.S. Wong, N.R. Buenfeld, Determining the water–cement ratio, cement content, water content and
degree of hydration of hardened cement paste: Method development and validation on paste samples,
Cement and Concrete Research, 39 (2009) 957-965.
[7] H.S. Wong, K. Matter, N.R. Buenfeld, Estimating the original cement content and water–cement ratio of
Portland cement concrete and mortar using backscattered electron microscopy, Magazine of Concrete
Research, 65 (2013) 693-706.
[8] M.H.N. Yio, J.C. Phelan, H.S. Wong, N.R. Buenfeld, Determining the slag fraction, water/binder ratio
and degree of hydration in hardened cement pastes, Cement and Concrete Research, 56 (2014) 171-181.
[9] H.S. Wong, N.R. Buenfeld, K. Matter, Estimating the original cement content and water-cement ratio of
Portland cement concrete and mortar using backscattered electron microscopy, Magazine of Concrete
Research, 65 (2013) 693-706.
[10] ISO 5725-2:1994 Accuracy (trueness and precision) of measurement methods and results - Part 2: Basic
method for the determination of repeatability and reproducibility of a standard measurement method,
International Organization for Standardization, 1994.
[11] ISO 5725-4:1994 Accuracy (trueness and precision) of measurement methods and results -- Part 4:
Basic methods for the determination of the trueness of a standard measurement method, International
Organization for Standardization, 1994.
[12] ISO 5725-5:1998 Accuracy (trueness and precision) of measurement methods and results -- Part 5:
Alternative methods for the determination of the precision of a standard measurement method, International
Organization for Standardization, 1998.
[13] ASTM C670-15, Standard Practice for Preparing Precision and Bias Statements for Test Methods for
Construction Materials, ASTM International, West Conshohocken, PA, 2015, 2015.
[14] F. Wilcoxon, Individual Comparisons by Ranking Methods, Biometrics Bulletin, 1 (1945) 80-83.