DETERMINING THERMAL LETHALITY TO ... - University of Florida
66
1 DETERMINING THERMAL LETHALITY TO REDUCE PRESENCES OF POTENTIAL PATHOGENIC VIBRIO SPP. IN OYSTERS, CRASSOSTREA VIRGINICA By CHRISTOPHER W. HANNA A THESIS PRESENTED TO THE GRADUATE SCHOOL OF THE UNIVERSITY OF FLORIDA IN PARTIAL FULFILLMENT OF THE REQUIREMENTS FOR THE DEGREE OF MASTERS OF SCIENCE UNIVERSITY OF FLORIDA 2012
Transcript of DETERMINING THERMAL LETHALITY TO ... - University of Florida

1
DETERMINING THERMAL LETHALITY TO REDUCE PRESENCES OF POTENTIAL PATHOGENIC VIBRIO SPP. IN OYSTERS, CRASSOSTREA VIRGINICA
By
CHRISTOPHER W. HANNA
A THESIS PRESENTED TO THE GRADUATE SCHOOL OF THE UNIVERSITY OF FLORIDA IN PARTIAL FULFILLMENT
OF THE REQUIREMENTS FOR THE DEGREE OF MASTERS OF SCIENCE
UNIVERSITY OF FLORIDA
2012

2
© 2012 Christopher W. Hanna

3
To my friends, brothers and sisters who always supported me through my endeavors

4
ACKNOWLEDGMENTS
I would like to thank my major professor Dr. Steve Otwell and his knowledgeable
lab co-workers Laura Garrido and Victor Garrido. Without their help I would never have
been able to accomplish this work. Dr. Otwell has stood behind my work, helped me to
make the connections needed to be able to enter restaurants to conduct studies, and
helped fund and support me throughout the entire endeavor.
I also acknowledge the patient help provided Dr. Wright and Dr. Schneider who
taught me microbiology and helped me through every major step of this process. Dr.
Wright generously allowed the use of her lab and facilities, while Dr. Schneider provided
specific and continuing advice on protocols and thermal assessments. Without their
help this never would have been possible.
I would like to thank my sisters Laura and Jenna for their support and help through
college. I would like to show my appreciation for Zina Williams and Charlene Burke for
helping me organize and execute my travels and lab work. I would have gone crazy
without your patience and knowledge, and for that I thank you. Lastly, I would like to
thank all my Fraternity Brothers of the Delta Zeta chapter of Delta Tau Delta: Dedicated
to Lives of Excellence.

5
TABLE OF CONTENTS page
ACKNOWLEDGMENTS .................................................................................................. 4
LIST OF TABLES ............................................................................................................ 6
LIST OF FIGURES .......................................................................................................... 7
LIST OF ABBREVIATIONS ............................................................................................. 9
ABSTRACT ................................................................................................................... 11
CHAPTER
1 INTRODUCTION .................................................................................................... 13
2 LITERATURE REVIEW .......................................................................................... 17
3 OBJECTIVES AND HYPOTHESIS ......................................................................... 25
4 MATERIALS AND METHODS ................................................................................ 26
Bacterial Growth Curves ......................................................................................... 26
Thermal Applications in Media ................................................................................ 28
Determining D and z- Values in PBS Media ........................................................... 29
Thermal Assessments with Oysters ........................................................................ 33 Assessing Commercial Cooking Procedures .......................................................... 35
Assessing Regulatory Guidelines ........................................................................... 37
5 VIBRIO SPP. GROWTH CURVES ......................................................................... 38
6 D- AND Z-VALUE ASSESMENTS .......................................................................... 41
7 THERMAL RECOVERY STUDY ............................................................................ 50
8 ASSESSING COMMERICAL COOKING PROCEDURES ...................................... 53
9 DISCUSSION ......................................................................................................... 58
LIST OF REFERENCES ............................................................................................... 63
BIOGRAPHICAL SKETCH ............................................................................................ 66

6
LIST OF TABLES
Table page 2-1 Heat resistance of V. cholerae in shrimp homogenate conducted by Hinton
and Grodner, 1985. ............................................................................................ 18
2-2 Heat resistance of V. cholerae in crabmeat homogenate conducted by Shultz et al. (1984) ........................................................................................................ 19
6-1 D and z-values for V. vulnificus, V. parahaemolyticus, and V. cholerae. Letters are used to denote statistical differences with a p≤0.05 of the mean. .... 49
7-1 Overnight Temperature Abused Oyster MPN Calculations for V. vulnificus, V. parahaemolyticus and total bacteria in MPN/mL. ............................................... 50
7-2 Log unit reduction of Heat Treated Temperature Abused Oysters for V. vulnificus, V. parahaemolyticus and total bacteria in MPN/mL.. ......................... 51
8-1 Initial concentrations and Log unit Reduction of Temperature Abused Oyster V. vulnificus, V. parahaemolyticus and total bacteria after a 200oF heat treatment in CFU/mL.. ........................................................................................ 55
9-1 D-values for V. cholerae ..................................................................................... 58
9-2 D-values for V. parahaemolyticus. ...................................................................... 59
9-3 D-values for V. vulnificus. ................................................................................... 59

7
LIST OF FIGURES
Figure page 5-1 Growth curve of Vibrio cholerae N16961 in L-Broth.. ......................................... 38
5-2 Growth curve of Vibrio vulnificus CMCP6 in L-Broth. The line at 8 hr displays the end of exponential growth and the beginning of the stationary phase. The line at 12 hr displays the beginning of mid-stationary phase. ............................. 39
5-3 Growth curve of Vibrio parahaemolyticus TX2103 in L-Broth. The line at 9 hr displays the end of exponential growth and the beginning of the stationary phase. The line at 12 hr displays the beginning of mid-stationary phase. .......... 40
6-1 Vibrio cholerae N16961 D48 time versus average log10CFU/mL graph with standard deviation. R2=0.9923 ........................................................................... 41
6-2 Vibrio vulnificus CMCP6 D48 time versus average log10CFU/mL with standard deviation. R2=0.9916 ........................................................................... 42
6-3 Vibrio parahaemolyticus TX2103 D48 time versus average log10CFU/mL with standard deviation. R2=0.9887. .......................................................................... 43
6-4 Vibrio cholerae N16961 D50 time versus average log10CFU/mL with standard deviation. R2=0.9659. ......................................................................................... 44
6-5 Vibrio vulnificus CMCP6 D50 time versus average log10CFU/mL with standard deviation. R2=0.9501. .......................................................................... 44
6-6 Vibrio parahaemolyticus TX2103 D50 time versus average log10CFU/mL with standard deviation. R2=0.9041. .......................................................................... 45
6-7 Vibrio cholerae N16961 D55 time versus average log10CFU/mL with standard deviation. R2=0.9885. ......................................................................................... 46
6-8 Vibrio vulnificus CMCP6 D55 time versus average log10CFU/mL with standard deviation. R2=0.9738. .......................................................................... 46
6-9 Vibrio parahaemolyticus TX2103 D55 time versus average log10CFU/mL with standard deviation. R2=0.9885. .......................................................................... 47
8-1 Internal temperature of half-shucked oyster on an open chargrill gas grill conducted on site in a commercial environment. ................................................ 53
8-2 Internal Oyster Temperatures during on site trials conducted on the restaurant level.. ................................................................................................. 54

8
9-1 Illustration of a possible HACCP plan for cooking oysters in a commercial restaurant operation. .......................................................................................... 62

9
LIST OF ABBREVIATIONS
APW Alkaline Peptone Water
BAM bacteriological Analytical Manual
CDC Center for Disease Control and Prevention
CFU Colony Forming Unit
CL Critical Limit
CT Cycle Threshold
DI Deionized Water
EPIPT End-Point Internal Product Temperature
mm Millimeter
FDA Food and Drug Administration
g Grams
HACCP Hazardous Analysis and Critical Control Points
ISSC Interstate Shellfish Sanitation Conference
LA Luria Burtani Broth with NaCl Agar
LBN Luria Burtani Broth with NaCl
LB Luria Burtani Broth
mL Milliliters
mCPC Modified Cellobiose Polymyxin B Colistin
MPN Most Probable Number
NACMCF National Advisory Committee on Microbiological Criteria for Foods
NMFS National Marine Fisheries Service
PBS Phosphate Buffer Saline
PHP Post-Harvest Processing
qPCR Quantitative Real Time Polymerase Chain Reaction

10
RPM Rotations Per Minute
SCP Safe Cooking Practices
TCBS Thiosulfate Citrate Bile Salts Sucrose
TSA Tryptic Soy Agar
V. Vibrio
VC Vibrio cholera
VP Vibrio parahaemolyticus
VV Vibrio vulnificus
vol Volume
wt Weight

11
Abstract of Thesis Presented to the Graduate School of the University of Florida in Partial Fulfillment of the Requirements for the Degree of Masters of Science
DETERMINING THERMAL LETHALITY TO REDUCE PRESENCES OF POTENTIAL PATHOGENIC VIBRIO SPP. IN OYSTERS, CRASSOSTREA VIRGINICA
By
Christopher W. Hanna
December 2012
Chair: Steve Otwell Major: Food Science and Human Nutrition
Controls are necessary to prevent illness associated with Vibrio spp. in oysters,
Crassostrea virginica. The primary bacterial pathogens associated with human disease
attributed to oysters are Vibrio parahaemolyticus, V. vulnificus, and V. cholerae
serogroups. The most commonly recommended control has been cooking but
descriptions of the specific application of this control are limited.
The following D and z-values were calculated based on thermal consequences in
a phosphate buffered saline (PBS): V. vulnificus CMCP6 were as follows: D48=2.24 min,
D50=2.05 min, D55=0.50 min and z-value=10.19oC, V. cholera 01 N16961: D48=2.36 min,
D50=1.96 min, D55=0.52 min, and a z-value=10.31oC and V. parahaemolyticus TX2103
was the most heat stable with D48=3.02 min, D50=1.99 min, D55=0.72 min with a z-
value=11.3oC.
Trials conducted at the same temperatures on whole oysters to demonstrate the
protective effects of the food matrix and suggests that at lower temperatures the food
matrix provided a protective effect, but at 55oC internal temperatures the protective
effect was diminished.

12
Further trials assessing the effectiveness of routine commercial cooking
procedures and the Food and Drug Administration’s (FDA) recommendations in the US
Food Code (2009) was conducted on chargrilled half-shell shucked oysters containing
Vibrio spp. Field trials confirmed routine chargrilling and frying exceed internal product
temperatures of 200oF (93.3oC) and >145oF for 15 seconds. Results indicate restaurant
standard cooking practices proved effective in reducing or eliminating the potential
Vibrio spp. pathogens. These results can be used to validate cooking controls in
Hazardous Analysis and Critical Control Points (HACCP) plan’s designed for restaurant
applications.

13
CHAPTER 1 INTRODUCTION
Vibrio vulnificus V. cholerae and V. parahaemolyticus are naturally occurring
potentially pathogenic bacteria that are commonly found in Crassostrea virginica
(oysters) throughout the Gulf Coast (Blake et al., 1979). These halophilic, gram-
negative bacteria are the most common cause of seafood related bacterial illness in the
United States but are still considered rare (CDC, 2009). They can be accompanied by
additional Vibrio spp. that are more commonly associated with water contaminants of
human origin, i.e. Vibrio cholerae and other Vibrio spp. depending on the species and
serotype present, that can result in non-approved harvest conditions. Together these
bacteria are commonly referred to as opportunistic pathogens because healthy persons
do not get V. vulnificus fatal infections and Vibrio spp. infections that can be vectored to
consumers through consumption of raw or improperly cooked oysters.
Vibrio spp. related disease has increased regulatory action for more appropriate
controls to reduce or eliminate the presence of these particular Vibrio spp. Many coastal
states are actively developing and implementing new recommendations for Vibrio spp.
control plans through the Interstate Shellfish Sanitation Conference (ISSC). These plans
specify controls for shellfish obtained from approved harvest waters through proper
product identification (tagging), reducing product temperatures immediately after
harvest and throughout processing and distribution, and a possible intervention with
innovative post-harvest processing (PHP) methods designed to reduce or eliminate
potential pathogens (ISSC, 2012). Although the effectiveness of these controls as single
or combined procedures is debated, all regulatory and commercial interests agree that
14
cooking is the safest and most effective control. The ISSC recommends following the
US Food Code (2009) for the control of molluscan shellfish (ISSC, 2012).
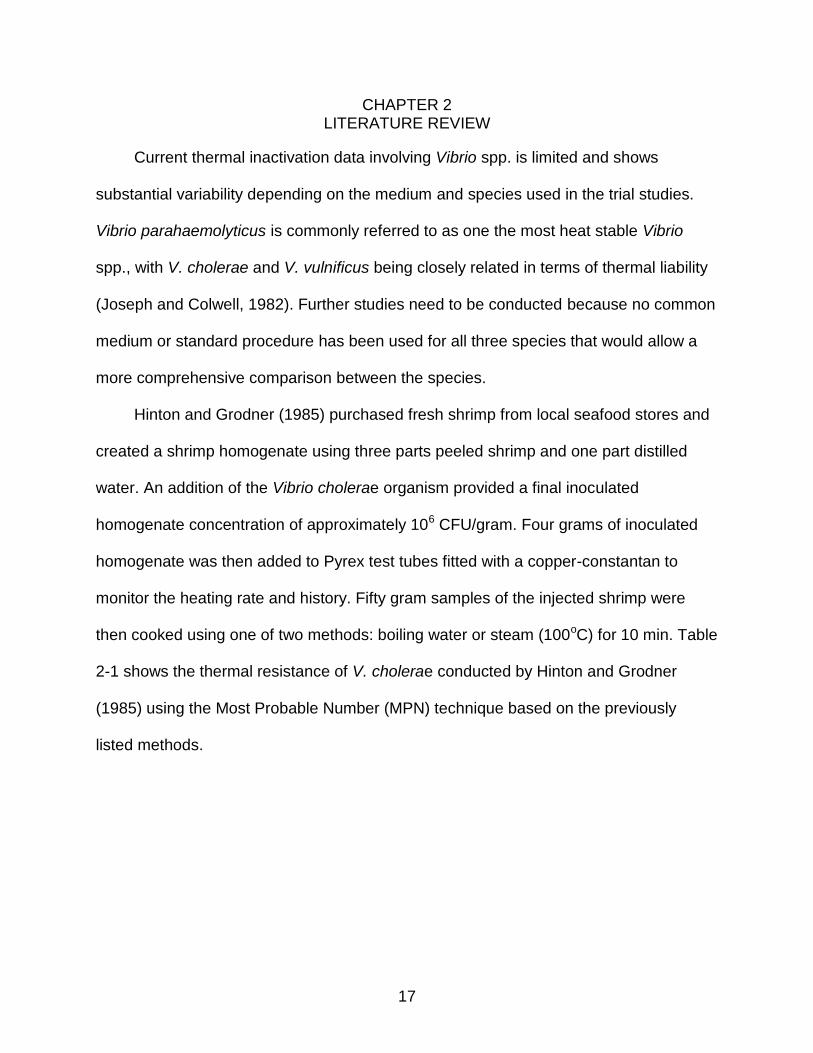
The Centers for Disease Control and Prevention (CDC) recognizes an urgent
need for additional controls in the face of the trends for increasing oyster-borne Vibrio
spp. illnesses and the increasing percentage of immunocompromised consumers.
According to the CDC (2012) the reported incidences of Vibrio spp. illnesses had
significantly increased in 2010 when compared to 2006-2008; with a rise of 39% within
24 months. This situation could be further complicated by environmental warming trends
(Cox et al., 2000) that could extend the more problematic summer seasons that favor
the presence of Vibrio spp. and correlates with the period of higher occurrence of
recorded oyster related illness (CDC, 2012). Serious infections from consumption of raw
oysters harboring the Vibrio spp. most often occur within individuals that show some
underlying condition that compromises the defenses of the host. Common underlying
conditions include diabetes, liver disease, immuno-compromised, the elderly or very
young, alcoholic cirrhosis or hemochromatosis (Blake et al., 1979). These immune-
compromised conditions appear to be increasing in our aging society (CDC, 2009) and
the persistent occurrence of Vibrio spp. illness and environmental trends suggests a
need for better controls to reduce or eliminate Vibrio spp. encounters by oyster
consumers. In response, the ISSC and the CDC continues to recommend methods to
minimize the risk through the use of controls or hurdles to prevent bacterial presence
and growth. Their recommended options include: rapidly refrigerating oysters after
harvest, treating the oysters at the processing plant with heat, freezing or high pressure,
and finally by thorough cooking (CDC, 2012).

15
The use of cooking to control bacterial infections from seafood is not always
apparent in terms of actual procedures. The National Advisory Committee on
Microbiological Criteria for Foods (NACMCF) was asked by the Food and Drug
Administration (FDA) and the National Marine Fisheries Service (NMFS) to provide
advice on cooking seafood in order to provide consumer messages and directions
necessary to ensure the safety of seafood (NACMCF, 2008). Several conclusions were
drawn, but overall and most importantly for proper cooking of oysters, the committee
stated that there is a lack of thermal inactivation data for relevant pathogens in
appropriate seafood due, at least in part, to the wide variety of products available and
the many methods of cooking that are commonly applied to these products. The
committee agrees that the microbial safety of seafood is enhanced greatly when it is
properly handled, cooked, served, and stored; however, the committee still recognizes
the fact that some consumers prefer to eat certain seafood products raw or
undercooked. The committee comments that cooking methods for seafood products
differ and often are not necessarily based on scientific data. Although seafood cooking
recommendations are widely available, there is no easy, practical measurement or
indicator for the consumer to objectively determine sufficient cooking in order to ensure
the safety of fishery products (NACMCF, 2008).
The inactivation of infectious non-spore-forming pathogens using a heat treatment
is a critical control point in the safe preparation of many foods. Insufficient processing,
cooking or reheating are often contributing factors in food-poisoning outbreaks (Roberts,
1991). Many food-processing systems contain a heating step to reduce the number of
bacteria in a product to enhance food safety and increases overall shelf-life of the

16
product (Asselt and Zwietering, 2005). Many of these cooking parameters are based on
challenge tests, legislation and overall common experience. Heat resistance and injury
of food-borne pathogens such as Salmonellae, Staphylococcus aureus, and Clostridia
have been studied extensively; yet, much less attention has been given to the thermal
stability characteristics of Vibrio spp. (Beuchat and Worthington, 1976).
17
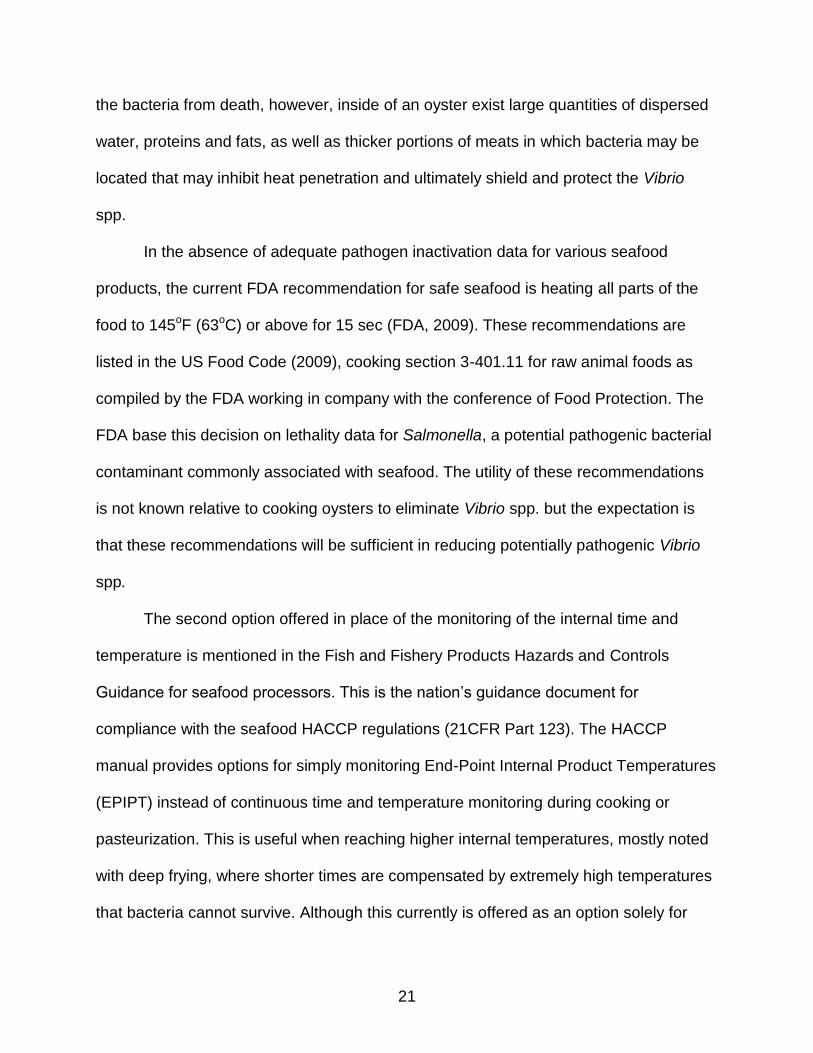
CHAPTER 2 LITERATURE REVIEW
Current thermal inactivation data involving Vibrio spp. is limited and shows
substantial variability depending on the medium and species used in the trial studies.
Vibrio parahaemolyticus is commonly referred to as one the most heat stable Vibrio
spp., with V. cholerae and V. vulnificus being closely related in terms of thermal liability
(Joseph and Colwell, 1982). Further studies need to be conducted because no common
medium or standard procedure has been used for all three species that would allow a
more comprehensive comparison between the species.
Hinton and Grodner (1985) purchased fresh shrimp from local seafood stores and
created a shrimp homogenate using three parts peeled shrimp and one part distilled
water. An addition of the Vibrio cholerae organism provided a final inoculated
homogenate concentration of approximately 106 CFU/gram. Four grams of inoculated
homogenate was then added to Pyrex test tubes fitted with a copper-constantan to
monitor the heating rate and history. Fifty gram samples of the injected shrimp were
then cooked using one of two methods: boiling water or steam (100oC) for 10 min. Table
2-1 shows the thermal resistance of V. cholerae conducted by Hinton and Grodner
(1985) using the Most Probable Number (MPN) technique based on the previously
listed methods.

18
Table 2-1. Heat resistance of V. cholerae in shrimp homogenate conducted by Hinton and Grodner, 1985.
Temperature D-value (min)
48.9 9.17 54.4 0.43 60 0.39 65.5 0.32 71.1 0.31 76.7 0.30 82.2 0.28
The data displays a drastic drop from 48.9oC with a D-value of 9.17 min to only
0.43 min at 54.4oC without the remaining data following thermal death trends. Also,
these results do not coincide with a study conducted on Vibrio cholera in blue crab
homogenates (Shultz et al., 1984). Raw crabmeat was placed in a sterile Warring
Blender in 150g quantities and three mL of a 1:3 dilution of the V. cholerae inoculums
were added to achieve a final concentration of 106 CFU/g; followed directly by
homogenization for 2 min (Shultz et al., 1984). Next, 4 g of homogenate was aseptically
placed in glass tubes and sealed with a surface mix gas-oxygen torch. Fifteen total
tubes, six of which were equipped with thermocouples, were totally submerged in a
water bath for various time increments at 49, 54, 60, 66, and 71oC. Upon removal, the
inoculated tubes were cooled rapidly in a water bath for 30 sec and the contents were
aseptically transferred to alkaline peptone water (APW). The APW tubes were then
incubated at 35oC for 6-8 hr and recovery techniques taken from the FDA’s
Bacteriological Analytical Manual (BAM) were used to determine the final bacteria
counts. Table 2-2 below displays the results.

19
Table 2-2. Heat resistance of V. cholerae in crabmeat homogenate conducted by Shultz et al. (1984)
Temperature D-Value
49 8.15 54 5.02 60 2.65 66 1.60 71 0.30
When comparing Hinton and Grodner’s V. cholerae experiments with shrimp
(1985) at similar temperatures to the aforementioned studies conducted by Shultz et al.
(1984), it is noticeable that a margin of difference in the D-values. At 48.9oC Hinton and
Grodner (1985) found a D-value of 9.17 min, whereas at 49oC Shultz et al. (1984) found
the D-value to be 8.15 min. This is similar enough to be associated with the medium
itself attributing to this difference, but when comparing the remaining values, the trend
differs exponentially. At 54.4oC the shrimp homogenate changes from 9.17 to 0.43 min
(Hinton and Grodner, 1985); whereas, in the crabmeat homogenate, a D-value of 8.15
min at 49oC only drops to 5.02 min at a similar 5oC increase to 54oC. Even with different
media, the bacteria themselves should act similarly within one medium. As the
temperature increases again the values differ even more drastically. Hinton and
Grodner (1985) found that at a temperature of 60 and 71.1oC the respective D-values
were 0.39 and 0.31 min; while Shultz et al. (1984) reports a D-value at 60 and 71oC to
be 2.65 and 0.30 min. The values start similarly at lower temperatures, veer off
correlation towards the middle temperature range, and then end nearly identically. This
matter is not expected in normal D-value studies.
Beuchat and Worthington (1976) conducted another study examining the thermal
inactivation of V. parahaemolyticus where exponential phase cells, or bacterial cells in

20
the reproduction stage of life, were transferred to 190 mL of 0.1 M potassium phosphate
containing 0.5%, 3.0% or 7.5% (wt/vol) NaCl at a pH of 7.2 with a concentration of
approximately 107 CFU/mL for 3% NaCl-TSB and 107 CFU/mL for 0.5% and 7.5%.
These mixtures were heated under constant agitation and samples were withdrawn at
appropriate times, dispensed in a sterile chilled test tube and then serially diluted in 0.1
M potassium phosphate containing 3.0% NaCl. A tryptic soy agar (TSA) consisting of
1.2% agar and 3.0% NaCl was tempered at 42oC and colonies were counted after 18-
24 hr at 35oC. Heat survivor curves of log10 viable number per milliliter versus time at
47oC were plotted. With a growth temperature of 37oC, 7.5% NaCl was inoculated and
heated at 47oC and produced a D-value of 65.1 min (Beuchat and Worthington, 1976).
When compared to a study conducted in 1992 on V. vulnificus in a buffered saline
solution at the same 47oC, a D-value of 2.40 min was calculated (Cook and Ruple,
1992). This shows a difference of 62.7 min between similar mediums and subspecies
that again shows a substantial variation between studies.
Thermal inactivation is not solely dependent upon the bacterial organism in
question. Other factors for overall inactivation include: exposure time and temperature,
pH, fatty acid composition, protein insulation and evaporative cooling. In addition
bacterial concentration and location inside the specific mediums, water activity,
rapid/slow cooling and heat penetration are also extremely important in the overall
production of a safe product (Blackburn et al., 1997). For example, the thermal
inactivation of Vibrio spp. in PBS may vary slightly or drastically based upon the
protective effects of the medium. PBS consists mostly of water, with low concentrations
of phosphate and saline which should not play a major factor in the overall protection of
21
the bacteria from death, however, inside of an oyster exist large quantities of dispersed
water, proteins and fats, as well as thicker portions of meats in which bacteria may be
located that may inhibit heat penetration and ultimately shield and protect the Vibrio
spp.
In the absence of adequate pathogen inactivation data for various seafood
products, the current FDA recommendation for safe seafood is heating all parts of the
food to 145oF (63oC) or above for 15 sec (FDA, 2009). These recommendations are
listed in the US Food Code (2009), cooking section 3-401.11 for raw animal foods as
compiled by the FDA working in company with the conference of Food Protection. The
FDA base this decision on lethality data for Salmonella, a potential pathogenic bacterial
contaminant commonly associated with seafood. The utility of these recommendations
is not known relative to cooking oysters to eliminate Vibrio spp. but the expectation is
that these recommendations will be sufficient in reducing potentially pathogenic Vibrio
spp.
The second option offered in place of the monitoring of the internal time and
temperature is mentioned in the Fish and Fishery Products Hazards and Controls
Guidance for seafood processors. This is the nation’s guidance document for
compliance with the seafood HACCP regulations (21CFR Part 123). The HACCP
manual provides options for simply monitoring End-Point Internal Product Temperatures
(EPIPT) instead of continuous time and temperature monitoring during cooking or
pasteurization. This is useful when reaching higher internal temperatures, mostly noted
with deep frying, where shorter times are compensated by extremely high temperatures
that bacteria cannot survive. Although this currently is offered as an option solely for

22
processors, restaurant settings may benefit from regulations that follow this manner as
an alternative option to internal time and temperatures currently in place. The use of
HACCP concepts in restaurant operations is encouraged in the US Food Code (2009)
(FDA, 2009).
The Hazardous Analysis and Critical Control Points (HACCP) for Seafood
recommends processes that create a 6D, or 6-log reduction, of potential pathogens for
processors or distributors, but these do not apply to the restaurant level. Restaurants
are not held to these standards because the food is cooked for immediate consumption.
After processors reduce bacterial concentrations, the product may be transferred or
stored for hours or days, allowing the surviving bacteria the time they need to regrow
and increase concentrations, which is why the processors have such high D
requirements. This is not the case with restaurant foods because they are consumed
immediately after being cooked. This does not allow the time needed for any surviving
bacteria to replicate again to the concentrations normally required for pathogenicity after
cooking has occurred.
Current oyster cooking methods commonly used in restaurant industry range
from chargrilling on an industrial gas grill, to steaming and deep frying; however, many
restaurants now solely offer chargrilled and deep frying for several factors including
ease and convenience. Also, average consumer demand is higher for these methods
over steaming. Household consumers also grill and fry oysters, but most are limited on
their ability to steam simply due to their lack of equipment.
Overall, mindful of prior restrictions and complications with confounding factors,
additional research is necessary to better substantiate the recommendations and

23
dependence on appropriate cooking methods to control potential illness due to Vibrio
spp. in raw oysters.
Determination of thermal death time (D-values) and corresponding z-values are
appropriate methods to evaluate the performance of a thermal inactivation process.
These concepts dictate required temperature and exposure time to effectively reduce or
eliminate particular bacteria. These data can then be applied and altered to obtain
thermal inactivation in different mediums in a laboratory or in food processing and
handling situations. The same approach can be used to determine required cooking
procedures for a retail or restaurant operation that prepares food for immediate
consumption.
The D-value refers to the reduction time required at a certain temperature to kill
90%, or 1 log unit of the organism in question. Upon obtaining several D-values, a
thermal destruction curve can be created by graphing the corresponding D-values to
their appropriate times. The z-value is a temperature that is required for the thermal
destruction curve to move 1 log cycle. Z-values can be calculated by taking the
reciprocal of the slope resulting from the plot of the logarithm of the D-value versus the
temperature at which the D-value was obtained. While the D-value gives the time
needed to destroy organisms at a specific temperature, the z-value relates the
resistance of an organism to differing temperatures (McLandsborough, 2004).
Mindful of the risk associated with potential pathogenic species of Vibrio bacteria
vectored by oyster consumption, this study was conducted to provide more reliable
measures for effective thermal treatments for cooking controls in restaurant and food
service operations preparing oysters for immediate consumption. The scope of work

24
includes determinations of basic thermal parameters for bacterial lethality and
comparisons against recommended FDA guidelines for general cooking of seafood and
actual commercial (restaurant) practices.

25
CHAPTER 3 OBJECTIVES AND HYPOTHESIS
The main objective was to determine the thermal inactivation of pathogenic Vibrio
spp. in order to obtain reliable and comprehensive pathogenic inactivation data to better
direct appropriate cooking of oysters.
The hypotheses for this work included:
Vibrio vulnificus CMCP6, Vibrio parahaemolyticus TX2103, and Vibrio cholerae N16961 have similar thermal-inactivation requirements.
Protective food matrix effects may occur in whole oysters, but this will not be a sufficient enough barrier to prevent bacterial death during common industry cooking standards
Cooking to an internal temperature of 145oF for 15 sec as recorded in the US Food Code (2009) will sufficiently eliminate all three potentially pathogenic Vibrio spp. pathogenic threats in oysters, Crassostrea virginica.

26
CHAPTER 4 MATERIALS AND METHODS
The thermal parameters for bacterial lethality were first determined with media
grown sources based on prior efforts to assure proper growth stages and conditions to
monitor bacterial survival. The resulting thermal parameters were then compared with
similar measures for thermal resistances during actual commercial operations to
determine the resulting thermal parameters and the effectiveness of routine cooking
procedures and recommended guidelines.
Bacterial Growth Curves
Growth curves are extremely important in determining the phase of bacterial
growth. Many bacteria have different growth curves; however, nearly all follow the same
pattern of growth: a lag, logarithmic, stationary and death phase. Practically, the mid-
stationary phase is the most useful in these experiments because of the cells ability to
withstand a greater range of stresses with a lower susceptibility to death. Most bacteria
in foods tend to be in this phase. It is important to ensure that the bacteria used in the
experiment is in a strong, mid-stationary phase for several reasons: it decreases the
likelihood of variability during heat treatments, ensures the bacteria is metabolically
sound with a majority of its energy going towards survival as opposed to reproduction,
and finally to have a known quantity of bacterial concentration as a starting point.
Triplicate experiments were conducted and the average log10 CFU/mL was plotted
versus time to give the growth curve graph.
The selected bacterial strains included species previously associated with raw
oysters. They include: V. vulnificus CMCP6, V. parahaemolyticus TX2103, and Vibrio
cholerae N16961 and were obtained from the University of Florida Food Science and

27
Human Nutrition Department. Strains were stored as frozen stocks at -80oC in Luria
Burtani Broth with NaCl (LBN) and 50% glycerol with a pH of 7.5 and streaked onto LBN
Agar (LA) for isolation and incubated at 37oC overnight for each individual study. An
isolated colony selected from the overnight LA was placed in 50mL of Luria Burtani
Broth (LB) and incubated at 37oC in a shaking incubator set to 90 rotations per minute
(RPM) for 24 hr to ensure viable culture growth. Next, 1 mL of the incubated sample
was inoculated into 50 mL of LB and placed into the shaking incubator with the same
parameters. Every hr, including a time 0, serial dilutions of the sample were conducted
in PBS test tubes in a ratio of 1:10 and 0.1 mL was aseptically spread plated onto LA in
order to obtain an accurate measurement of the growth of the specific strains. Each
sample was conducted with three replications to obtain the most solid statistical model
of growth.
After each time point, the LA plates incubated at 37oC for 24 hr to allow accurate
growth of colonies. On the 24 hr mark, the plates were taken from the incubator and all
individual viable colonies were counted and recorded for each time point at a dilution
that met the requirements of being within 25-300 colony forming units (CFU) per plate.
The recorded data were then converted into log10 CFU and graphed versus time to
create a growth curve. These growth curves were used to determine the growth phase
(e.g., lag, exponential, stationary and death phases) of the bacteria throughout their
replication process.
For many human pathogens, the capacity to survive physical challenges during
food processing is a critical step in their transmission to the host by the food-borne route
(Rees et al., 1995). Stationary phase cells are generally more resistant to a range of

28
stresses and inimical processes, environmental changes, temperature and pH
alterations, and are known to be capable of surviving in conditions where logarithmic
phase cells would tend to be more susceptible to death since a majority of their energy
is put into reproduction as opposed to survival (Rees et al., 1995). Therefore, cells from
early stationary phase were used to determine bacterial survival in these studies.
Thermal Applications in Media
Following the substantiation for stationary growth, preliminary work was necessary
to determine the conditions for thermal exposure of the Vibrio spp. in media. A come-up
time, or the time required for the medium to reach the desired temperature, was
determined for 5.0 mL of PBS in an identical test tube that was used during the thermo-
tests for each temperature (48, 50, 55oC). These heating temperatures were chosen
based on previous studies that showed death occurring at these temperatures at a rate
large enough to allow progressive measurements for change in bacterial levels. PBS
(5.0 mL) at room temperature (21.2oC ± 0.3) was dispensed into 16x125MM test tubes
and the rate of temperature change in the tube of media. New, calibrated
thermocouples were connected to an OCTTEMP 2000 and secured in the center of the
test tube without contact to the side. A circulating water bath was filled with
approximately 2.5-3.0 L of deionized water (DI water) and allowed to reach the
respective temperature (48, 50, 55oC). Fifteen test tubes filled with 5.0 mL of PBS at
room temperature were placed in a test tube rack and two thermo-couples were placed
in two test tubes at random to accurately create a thermo-profile and ensure no
overloading of the water bath and its temperature would occur. A third thermocouple
was placed inside the water bath to ensure the temperature remained constant.

29
Finally, an ice-slush was used for rapid the cooling and a fourth temperature probe
was placed inside the ice-slush to verify the temperature remained at ~0oC ± 0.4oC.
Once the circulating water bath reached the appropriate temperature, the test tube rack
was placed in the center of the water bath and the timing began. The time was recorded
for the PBS tubes to reach the desired temperature ± 0.4oC, with three replications to
accurately identify the come-up time at individual temperatures; once the last of the two
test tubes containing the thermo-couple had reached the designated temperature the
entire test tube rack was removed from the water bath and instantly put into the ice-
slush. The time required to reduce the temperature of the PBS from the set point to
25oC was recorded. Three replications were conducted, with two test tubes monitored
per replication, giving a total of 6 temperature trials per study.
At 55oC, the come up time was long enough to where the previous experiments
(48 and 50oC) provided data suggesting an elimination of a majority of the bacterial
concentration before testing could begin. An additional study was conducted using an
identical method to 48 and 50oC with time points 0, 30 and 60 sec. The results proved
that too large of a quantity of the Vibrio spp. were inactivated for this test to accurately
define the lethality over the period of time required. Therefore, all studies conducted at
55oC used pre-warmed PBS (4.5 mL) that were inoculated with 0.5 mL of bacteria was
pipetted into each tube, individually, from a master mix. This ensured that testing could
begin at a time zero, where no bacteria was lost in the come up and enough would
remain to obtain a reliable death curve.
Determining D and z- Values in PBS Media
The first step in obtaining accurate D-values was to assure uniform methods
across all experiments. Once the freezer stock bacteria was plated onto L-Agar and an

30
isolated colony was selected from the overnight growth, colonies were then allowed to
culture overnight in L-Broth for 11-13 hr to ensure the bacteria had reached stationary
phase as previously established in preliminary studies. After the bacteria reached mid-
stationary phase, at approximately hr 16, it had the desired properties for overall
strength and survival needed to conduct an accurate thermal-death matrix.
Freezer stock samples of each individual bacteria specimen were plated for
isolation on LA and allowed to grow overnight at 37oC in a standard incubator. An
isolated colony of each was then inoculated into 50mL of LB for 16 hr, which was
determined to be early stationary phase of the bacteria’s growth based on prior analysis
of the growth curves. This was performed to ensure all bacteria are in a strong
metabolic, non-reproductive phase to guarantee the greatest heat resistance during
trials and the least amount of variability possible between replications and experiments.
Next, 20mLs of the inoculated broth was put into a 50mL conical and spun in a
centrifuge for 15 min at 3000 RPMs. The supernatant LB was then discarded, and the
remaining specimen was re-suspended in 20 mL of PBS solution and vortexed until
homogenized. The new solution was then used to create a master solution with a 1:10
dilution in PBS. Portions (5mL) of this solution was serologically pipetted into 5 sterile
test tubes, after which the pipette tip was discarded and the master solution was re-
vortexed in order to ensure even distribution of the sample. This procedure was
repeated until the required amount of test tubes were filled.
Upon completion, the concentration of bacteria in the master sample was
determined by serially diluting with a 1:10 ratio in PBS and spread plated onto LA before
heat was administered. The same procedure was followed and plated on differential

31
media based on the subspecies: modified cellobiose polymyxin B colistin (mCPC) for V.
vulnificus CMCP6, thiosulfate citrate bile salts sucrose (TCBS) for V. cholerae N16961,
or CHROMagar for V. parahaemolyticus TX2103 and the results were compared to the
counts on non-selective media to verify no contamination.
Once the overnight sample was plated, the circulating water bath was brought to
the appropriate temperature, the ice-slush was prepared and the test tubes were racked
in an identical setup to the preliminary come-up time procedure. The inoculated test
tubes were then placed in the middle of the water bath and the time began.
After 2 min at 48oC, a time 0 test tube was pulled to account for the initial death
occurring during the initial heating. After achieving the desired temperature, every 4
minutes test tubes were pulled, cooled down in the ice-slush for 15 sec, and placed
inside a new, dry test tube rack. The cool down period is used to immediately stop
thermal related death and is as minimal as possible to prevent any death occurring from
cold shock. After completion of all time intervals, test tubes were then serially diluted at
a 1:10 ratio in PBS and 0.1mL of the heat-treated samples were plated onto LA and
placed in a standard non-motion incubator over night at 37oC. After 24 hr, the plates
were counted in the standard range and the data was recorded. Finally, the colony
numbers were converted into CFU/ml, then Log10 CFU/ml and graphed versus time. A
linear trend of best fit was then applied to the graph to determine the D and z-values.
The D-values were based on the thermal death that occurred at a specific temperature,
whereas the z-value was determined based off of the results of all three D-value
studies.

32
Identical methods were followed for preparation at 50oC as 48oC with the come up
time varying slightly, from 2 min to 2.5 min, with the same 15 sec cool down period. The
procedure for D and Z-values at 50oC followed the methods at 48oC with only the time
interval altering from 4 min at 48oC to 1 min intervals at 50oC. This change allows for a
more accurate death calculation with the increased death occurring from higher
temperatures and energy in the system.
Due to the heat-sensitivity of Vibrio spp., the normal come-up time procedure was
altered at this higher temperature in order to prevent high levels of death before
reaching the desired time points. In order to prevent this, 4.5mL of PBS was pipetted
into test tubes and the appropriate quantity of test tubes were then racked and placed in
a circulating water bath set to 55oC. Two temperature probes were inserted at random
into two test tubes and the PBS was allowed to come up to 55oC. Once the last
monitored test tube reached 55oC, an additional 5 min was given in order to prevent any
tubes from hovering below the required temperature.
A portion (0.5mL) of the overnight sample, which was prepared and quantified
identically to D48’s procedure, was individually inoculated into the 4.5 mL heat-treated
PBS producing a 1:10 dilution of the overnight sample. The time points were set to 30
sec intervals and upon reaching the time point, the test tube was pulled and instantly
iced down in the same ice-slush for 15 sec in order to instantaneously end kill. The
same quantification methods as the previous D48 and D50 were then followed to
calculate the survival of the bacteria at this temperature.
Each sample was conducted in triplicate, and then the average CFU/mL was
calculated as well as a standard deviation for each trial. The results were then plotted

33
on a time versus average log10CFU/mL. Once plotted, a linear regression for the
average log was plotted and used to calculate the D-value by solving the equation with
a 1 log unit reduction, or a reduction of the y-axis by 1 log unit.
Thermal Assessments with Oysters
Food products are commonly known to create a protective effect of bacteria
lethality for many reasons including: evaporative cooling, protection from proteins, lipids
and water in the systems, insulation from thicker or more dense portions of the product
and the ability for heat to transfer to evenly throughout the system. Because of this
phenomenon, trials were conducted in oysters at 48, 50 and 55oC in order to evaluate
the overall protective effect encountered in oysters at these lower-heat temperatures.
Preliminary tests were conducted on oyster homogenates (1:1 in PBS); however,
protein separation, gelling and layering occurred. Further separation between the
medium and the oysters as time and heat increased. Due to the non-uniformity of the
homogenate after the heating process heating whole oysters as opposed to the
homogenates were used in subsequent studies in order to provide greater accuracy of
the thermal inactivation and the homogenate method was abandoned in favor of the use
of whole oysters.
Live oyster samples were purchased from a local vendor in Apalachicola and
levels of naturally occurring Vibrio spp. in oysters were increased by temperature
abused using incubation at 26oC for 24 hr. The oysters were subsequently stored at
room temperature (ca. 21oC). Initial Vibrio spp. concentration in oysters was determined
from a standard weight of oysters (100g; ~10-12 oysters) that were shucked and placed
into a Warring Blender and mixed with an equivalent amount of PBS to produce a 1:2
homogenate. The mixture (20 mL) was added to 80mL of PBS to form a 1:10 dilution of

34
oyster to PBS. Serial 10 fold dilutions were performed by taking 11 mL of sample to 99
mL of PBS (1:10) out to the 10-6 dilution. These dilutions were inoculated into APW with
a pH of 8.5 ± 0.2 in triplicate, placed in an incubator set to 37oC and allowed to grow
overnight. All test tubes that were visually positive for growth in APW were recorded and
processed through the DuPont Vibrio BAX system (Dupont, Wilmington, US) system for
real time qPCR of Vibrio spp. All results were obtained using the qPCR were then
manually analyzed and all positives with a cycle threshold (CT) value above 32 were
excluded and considered a false positive. All positive APW test tubes were compared to
confirmed Vibrio spp. positives from the BAX, and any qPCR Vibrio negatives based on
the analyzed BAX results were removed in the calculation of MPN in order to obtain an
overall death of Vibrio only and to eliminate any other bacteria that may be producing a
positive in later dilutions that were not necessarily Vibrio spp. This was repeated in
triplicate with four separate temperature abused samples in order to obtain the most
likely amount of Vibrio bacteria in the samples.
A sample (100 g) of live oysters from the same temperature abused sampling
were shucked and put into a 1 gallon size Ziploc® (Johnsons & Son, Racine, US) brand
bag. The bags were fitted with three temperature probes attached to an OCTTEMP2000
(Thermoworks, Lindon, US), the temperature recorder. The probes were inserted into
three random oysters and the bag was inserted into a circulating water bath set to 48oC.
Once the last probed oyster (considered the worst case scenario) reached an internal
temperature of 48oC, a timer set for 9 min and 4 sec began which was determined from
a three log reduction based on the PBS D-values of V. parahaemolyticus conducted in
previous experiments. This control point was chosen due to its heat stability over V.

35
vulnificus and V. cholerae. Once time had expired, the samples were immediately
placed in an ice-slush to instantly stop death. The same MPN procedure as the
overnight experiments was then followed, and false Vibrio-positives were removed.
The same procedure was conducted for the 50oC heat treatment as the 48oC with
the exception of the water bath and internal temperature being set to 50oC and the time
point altered to 5 min and 58 sec based on the three log reduction D50 value conducted
in PBS. The same MPN procedure was used in all heat treatment studies.
The identical procedure was conducted for the 55oC heat treatment as the
previous two heat treatments at 48 and 50oC with the same alteration for water bath and
internal temperature. The new set point for cooking was also changed based on a 3 log
unit reduction in PBS from the D55 study from V. parahaemolyticus equating to a new
time of 2 min 10 sec. The same MPN procedure as the previous two heat treatment
studies was used to calculate the quantity of surviving bacteria.
Assessing Commercial Cooking Procedures
In order to compare lab-based results with actual commercial cooking procedures
a series of trials were conducted to monitor thermal history of oysters when cooked by
chargrilling or frying relative to bacterial reduction. The approached involved measuring
thermal consequence in actual restaurant settings and using these results to confirm the
bacterial consequences in controlled trials. The cooking method of choice was
chargrilling. The chargrill method has recently become one of the most popular
restaurant forms and appears to be replacing the traditional steamed form. Chargrilling
in a restaurant setting involves shucking the oyster on the half-shell, then cooking the
half-shell shucked oyster directly on a gas chargrill. Restaurants may flavor and butter
the product differently; however, they all have the similar grills and cooking procedures.

36
Recording of the internal temperatures during routine commercial practices was
conducted on site at reputable restaurants (Drago’s Seafood Restaurant & Oyster Bar
and Acme Oyster House, New Orleans) as the actual cooking procedures occurred to
determine if common industry cooking practices meet, fall short of, or exceed lethal
expectations and requirements based on the newly calculated D and z-values. The
results from the on-site determinations were used to stage a series of similar trials
measuring the consequence for bacterial loads in the same oysters, raw and after
chargrilling.
Raw oysters were purchased directly from distributers in Apalachicola, Florida and
were temperature abused at 26oC overnight in an incubator. The next morning, bacterial
concentrations were conducted by taking 100 g of shucked oyster, serially diluting out to
10-6 followed by spread plating on both selective media (mCPC and CHROMagar
(CHROMagar, Paris, France)) as well as non-selective media (LA). CHROMagar was
used to calculate the concentration of presumptive V. parahaemolyticus (identified by a
mauve color), mCPC was used to calculate presumptive V. vulnificus (yellow colonies)
and LA was used for total bacterial concentrations. Once spread plating was completed,
the inoculated plates were stored overnight in an incubator set to 37oC and the next
morning the plates were counted and the CFU/mL was recorded. The assumption that
there is no V. cholerae in natural oysters was applied and TCBS was not used to
calculate V. cholerae concentrations in order to prevent false positives from
proteus/enterococci on the media and skewing final results.
An industrial gas grill was used to simulate the popular chargrilled method
conducted onsite in many commercial settings. The center of the grill was recorded to

37
have temperatures exceeding 450oF, while the outer skirts ranged from 420-445oF,
never dipping below 420oF on any portion of the grills surface. The temperature-abused
oysters were then shucked to the half shell and temperature probes were inserted into
the oyster. Twelve oysters, three with temperature probes, were then placed (shell side
down) on the grill near the center, identically to how it was observed inside a restaurant
setting. The oysters were allowed to come to 200oF, then were promptly removed from
the grill and allowed to cool naturally to near room temperature. The oysters were then
aseptically shucked into a sterile, stomacher bag and the contents were then blended in
a Warring Blender. PBS dilutions and plating procedures were identical to those of the
overnight temperature abused samples (mCPC, CHROMagar, and LA).
Assessing Regulatory Guidelines
The final examination was conducted on a process many commercial settings
follow from the 2009 US Food Code: an internal temperature of 145oF (62.78oC) for 15
sec that is commonly based on the inactivation of Salmonella (FDA, 2009). Overnight
temperature abused oysters were again shucked and left on the half shell. Again, twelve
oysters, three with temperature probes, were placed shell side down on the grill near
the center. The oysters were allowed to come up to 145oF, and upon reaching that
internal temperature a timer was started. After 15 sec, the oysters were removed from
the grill and allowed to cool naturally. The identical steps to the 200oF test above were
conducted and the following morning, all selective and non-selective plates were
counted to determine overall Vibrio spp. lethality as well as overall bacterial lethality.
Three replications of each experiment, including the overnight, were conducted to
increase overall reliability of the data as well as statistical analysis.

38
CHAPTER 5 VIBRIO SPP. GROWTH CURVES
Initial work determined the parameters for reaching a stationary phase prior to use
in thermal trials. Figure 5-1 shows V. cholerae N16961 entering stationary phase after
approximately 9 hr. The mid-stationary phase for this bacteria was determined to be
between hr 11-13 with an approximate concentration of 1010 CFU/mL or very high 109
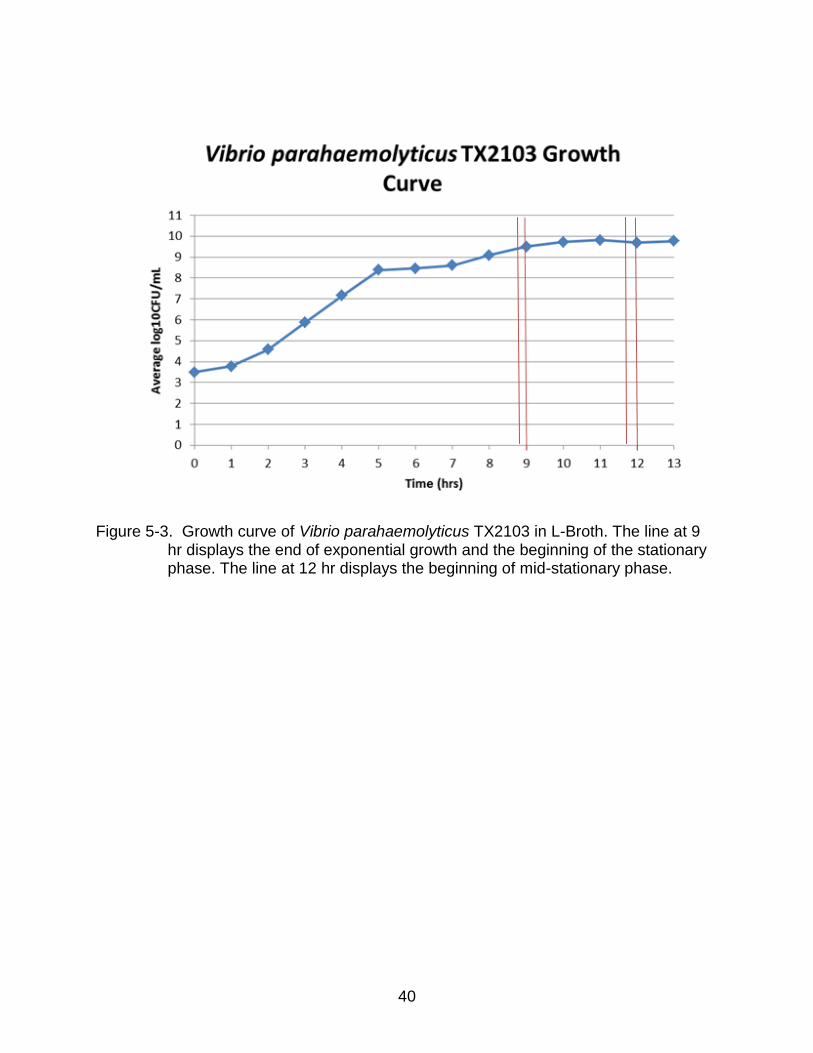
CFU/mL. Figures 5-2 and 5-3 show V. cholerae, V. vulnificus CMCP6 and V.
parahaemolyticus TX2103 with a final concentration of 109 with the same 11-13 hr mid-
stationary phase. All bacteria have extremely similar growth patterns, times and final
concentrations based on these initial studies.
0
1
2
3
4
5
6
7
8
9
10
11
0 1 2 3 4 5 6 7 8 9 10 11 12 13
Ave
rage
log1
0C
FU/m
L
Time (hrs)
Vibrio cholerae N16961 Growth Curve
Figure 5-1. Growth curve of Vibrio cholerae N16961 in L-Broth. The line at 6 hr displays the end of exponential growth and the beginning of the stationary phase. The line at 10 hr displays the beginning of mid-stationary phase.

39
Figure 5-2. Growth curve of Vibrio vulnificus CMCP6 in L-Broth. The line at 8 hr displays the end of exponential growth and the beginning of the stationary phase. The line at 12 hr displays the beginning of mid-stationary phase.
40
Figure 5-3. Growth curve of Vibrio parahaemolyticus TX2103 in L-Broth. The line at 9 hr displays the end of exponential growth and the beginning of the stationary phase. The line at 12 hr displays the beginning of mid-stationary phase.
41
CHAPTER 6 D- AND Z-VALUE ASSESMENTS
The D-values were determined using Vibrio spp. cultures in the mid-stationary
growth phase. In trials at 48oC using media, it was noted that V. parahaemolyticus had
the longest survival with a D-value of 3.02 min; V. vulnificus and V. cholerae were
equally heat liable at 2.36 min. Figure 6-1 through 6-3 display the average concentration
of bacteria versus time.
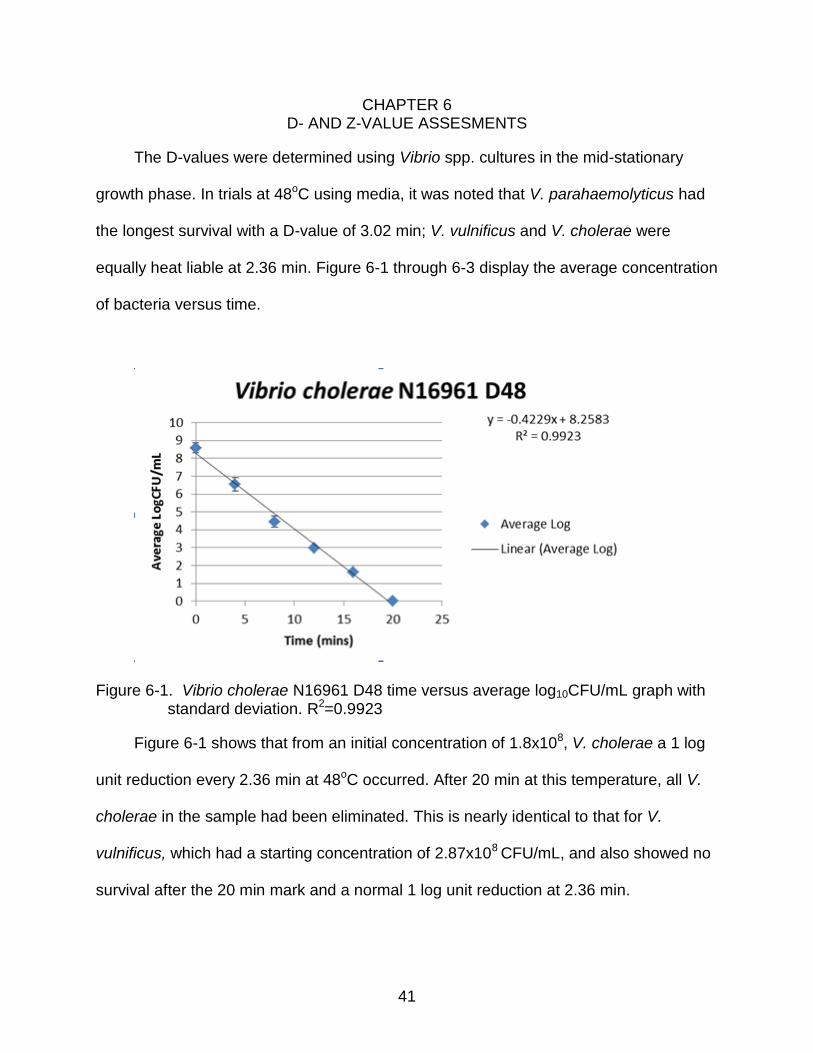
Figure 6-1. Vibrio cholerae N16961 D48 time versus average log10CFU/mL graph with standard deviation. R2=0.9923
Figure 6-1 shows that from an initial concentration of 1.8x10⁸, V. cholerae a 1 log
unit reduction every 2.36 min at 48oC occurred. After 20 min at this temperature, all V.
cholerae in the sample had been eliminated. This is nearly identical to that for V.
vulnificus, which had a starting concentration of 2.87x10⁸ CFU/mL, and also showed no
survival after the 20 min mark and a normal 1 log unit reduction at 2.36 min.

42
Figure 6-2. Vibrio vulnificus CMCP6 D48 time versus average log10CFU/mL with standard deviation. R2=0.9916
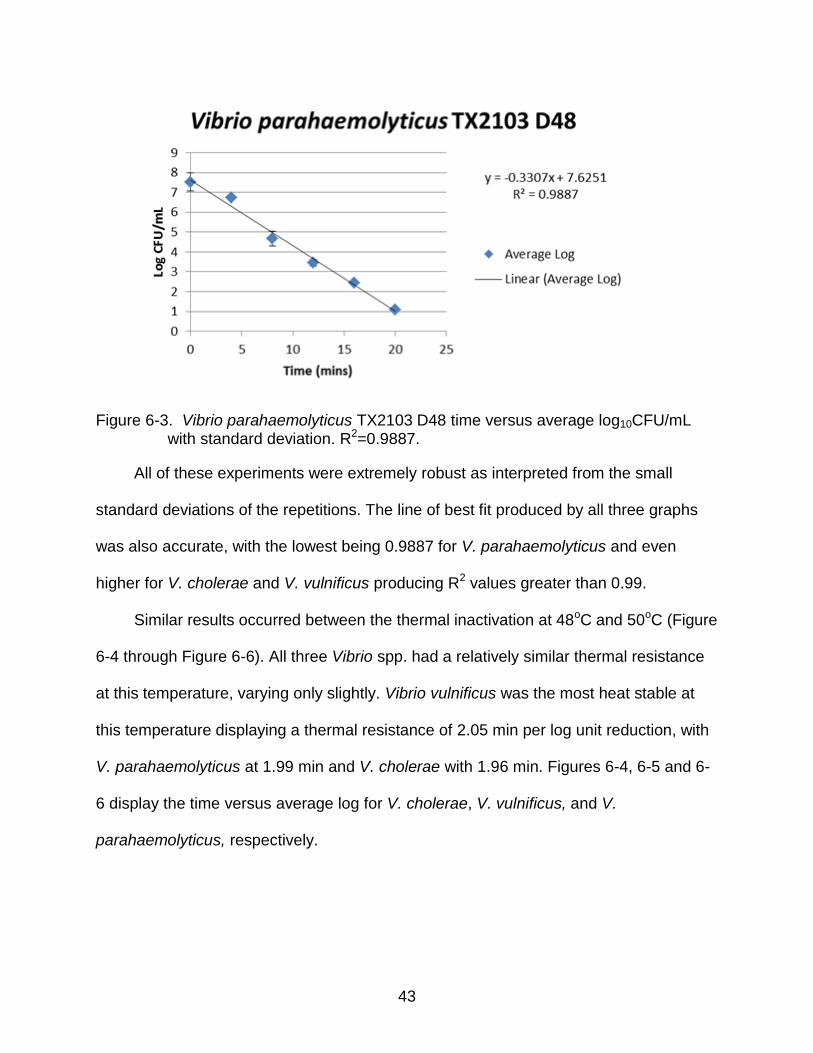
Figure 6-3 shows the slight heat-stable advantage V. parahaemolyticus has over
the other two subspecies. At this temperature, V. parahaemolyticus displayed a greater
thermal resistance compared to the other species with a D-value of 3.02. This is roughly
3.02 min versus V. vulnificus and V. cholerae having approximately 2.37 min,
respectively.
43
Figure 6-3. Vibrio parahaemolyticus TX2103 D48 time versus average log10CFU/mL with standard deviation. R2=0.9887.
All of these experiments were extremely robust as interpreted from the small
standard deviations of the repetitions. The line of best fit produced by all three graphs
was also accurate, with the lowest being 0.9887 for V. parahaemolyticus and even
higher for V. cholerae and V. vulnificus producing R2 values greater than 0.99.
Similar results occurred between the thermal inactivation at 48oC and 50oC (Figure
6-4 through Figure 6-6). All three Vibrio spp. had a relatively similar thermal resistance
at this temperature, varying only slightly. Vibrio vulnificus was the most heat stable at
this temperature displaying a thermal resistance of 2.05 min per log unit reduction, with
V. parahaemolyticus at 1.99 min and V. cholerae with 1.96 min. Figures 6-4, 6-5 and 6-
6 display the time versus average log for V. cholerae, V. vulnificus, and V.
parahaemolyticus, respectively.

44
Figure 6-4. Vibrio cholerae N16961 D50 time versus average log10CFU/mL with standard deviation. R2=0.9659.
Figure 6-5. Vibrio vulnificus CMCP6 D50 time versus average log10CFU/mL with standard deviation. R2=0.9501.

45
Figure 6-6. Vibrio parahaemolyticus TX2103 D50 time versus average log10CFU/mL with standard deviation. R2=0.9041.
The R-values displays minimal variability in these trials; however, the standard
deviations throughout the experiments display the capability of these procedures to be
replicated with accuracy. The overall low variation of the standard deviation of these
experiments coupled with the R-values give support to the accuracy of the experiments
conducted.
As the temperature increases, it is commonly expected to have an exponential
reduction in bacterial counts over the same time period. Because of this, the normal
D-value procedure was altered from having a come up time with the lower
temperatures, to being inoculated directly into the already heated tubes. Due to the
exponential increase in death over a shorter period of time, the time points were
decreased from 4 min per time at 48oC point to only 30 sec at 55oC, and after only three
min nearly all bacteria were destroyed. Figure 6-7, 6-8 and 6-9 display the death versus
time graph of V. cholerae, V. vulnificus, and V. parahaemolyticus, respectively.

46
Figure 6-7. Vibrio cholerae N16961 D55 time versus average log10CFU/mL with standard deviation. R2=0.9885.
Figure 6-8. Vibrio vulnificus CMCP6 D55 time versus average log10CFU/mL with standard deviation. R2=0.9738.

47
Figure 6-9. Vibrio parahaemolyticus TX2103 D55 time versus average log10CFU/mL with standard deviation. R2=0.9885.
The low variability of the standard deviations coupled with the high R2 values show
that these experiments were reproducible as well as follow an accurate linear path that
is expected in all the thermal-death studies that were conducted. The pathogens
followed similar suit to previous expectations with V. vulnificus and V. cholerae having
very similar D-values, with V. parahaemolyticus being the most heat stable with 0.72
min compared to V. vulnificus at 0.50 and cholerae at 0.53.
Prior research has shown that at ~48oC ± 1oC, Vibrio spp. can have a D-value of
8.15 min in crabmeat (Shultz et al., 1984) for V. cholerae, 0.82 min for V.
parahaemolyticus in a clam homogenate (Delmore and Chrisley, 1979), or even as high
as 65.1 min in 7.5% NaCl (Beuchat and Worthington, 1976). No prior research
conducted had the ability to compare the thermal resistance of the Vibrio spp. simply
because no prior research had conducted the same methods or the same media across
all three pathogens in question. Using the same methodology and medium between V.
vulnificus, V. parahaemolyticus, and V. cholerae allows for a better overall
48
understanding of the pathogens as well as the ability to cross reference and compare
the three species.
After obtaining a set of three reliable D-values per organism, the z-value was
calculated by taking the reciprocal of the slope resulting from the plot of the logarithm of
the D-value versus the temperature at which the D-value was obtained. This is
equivalent to the temperature required for a 1 log unit reduction in the D-value. Table 6-
1 displays the calculated z-values per organism based on the obtained D-values.

49
Table 6-1. D and z-values for V. vulnificus, V. parahaemolyticus, and V. cholerae.
Letters are used to denote statistical differences with a p≤0.05 of the mean.
Species D48 (min) D50 (min) D55 (min) z-value (oC)
V. vulnificus CMCP6 2.24 B 2.05 CD 0.50 E 10.19 V. parahaemolyticus
TX2103 3.02 A 1.99 CD 0.72 E 11.3
V. cholerae N16961 2.36 BC 1.96 D 0.52 E 10.31
Once the D-values were calculated, a one-way ANOVA analysis was carried out
and Fisher’s LSD was used for multiple mean comparisons using statistical analysis
system software, version 9.1.3 (SAS Institute Inc., Cary, NC). Differences are noted by
different letters and were determined by a statistical difference with a p≤0.05 of the
mean.
Based on these trials, V. parahaemolyticus is significantly different from both V.
vulnificus and V. cholerae at 48oC. As the temperature increases to 50oC, V. cholerae is
significantly different from V. parahaemolyticus as well as V. vulnificus. However, once
the temperature reaches 55oC, all three bacteria show no significant difference. With all
three bacteria acting in this manner, V. parahaemolyticus could be considered the target
organism due to its heat stability over V. vulnificus and V. cholerae at lower
temperatures and no difference at higher temperatures. All Vibrio spp. experimented on
displayed minimal thermal survival capacities that will directly result in their ability to be
lowered or eliminated during standard cooking procedures.

50
CHAPTER 7 THERMAL RECOVERY STUDY
Thermal abuse (26oC for 24 hr) elevated the level of Vibrio spp. for heating trials
using whole oysters (Table 7-1). The overnight bacterial concentration was conducted
by MPN and verified by the BAX Vibrio spp. system. Each individual Vibrio spp.
concentration was calculated, however, no V. cholerae cultures were found in any
samples at any dilution. The MPN calculations for V. vulnificus, V. parahaemolyticus,
and overall MPN for total aerobic bacterial counts (bacteria that are capable of growth in
APW at 37oC) are probable in raw oysters harvested from approved waters for
commerce (ISSC, 2012).
Table 7-1. Overnight Temperature Abused Oyster MPN Calculations for V. vulnificus, V. parahaemolyticus and total bacteria in MPN/mL.
Sample V. vulnificus V. parahaemolyticus
Total Aerobic Plate Count*
1 7.3x101 2.4x10⁴ >2.4x10⁵ 2 2.3x101 2.4x10⁴ >2.4x10⁵ 3 4.3x101 9.3x10³ >2.4x10⁵ 4 2.3x101 2.4x10⁴ >2.4x10⁵ Mean 4.0x101 ± 2.0x101 2.0x10⁴ ± 6.4x10³ >2.4x10⁵ ± 0.0
*Total aerobic plate counts were calculated by bacteria that are capable of growth in APW at 37oC incubation overnight.
After determining the initial concentration, the overall reduction after the heating
process was calculated to determine if there was any protective effect from the oyster
on the survival of the Vibrio spp. A lower final concentration of V. vulnificus was
expected due in part to V. vulnificus’ decreased heat tolerance as well as its lower
starting concentration versus V. parahaemolyticus. The oysters that were heat treated
at 48oC showed a complete reduction of V. vulnificus; however, V. parahaemolyticus
had survivors. This could be due to a lower starting concentration of V. vulnificus versus
V. parahaemolyticus as well as the more heat stable V. parahaemolyticus. This

51
experiment was arranged to ensure at least a 3 log unit reduction in the bacteria.
Although this shows a nearly complete inactivation of V. vulnificus, it is apparent that
there is little increase in the inactivation of V. parahaemolyticus or total bacteria counts.
This suggests that there are significant protective effects from the oyster at this
temperature, which was fully expected.
Table 7-2. Log unit reduction of Heat Treated Temperature Abused Oysters for V. vulnificus, V. parahaemolyticus and total bacteria in MPN/mL.
Sample V. vulnificus V. parahaemolyticus
Total Aerobic Plate Count*
Overnight Mean 4.0x101 ± 2.0x101 2.0x10⁴ ± 6.4x10³ >2.4x10⁵ ± 0.0 48oC Mean Reduction 1.0 ± 0.0 0.0 ± 0.0 0.3 ± 0.6 50oC Mean Reduction 1.0 ± 0.0 1.3 ± 0.6 2.0 ± 1.0 55oC Mean Reduction 1.0 ± 0.0 2.7 ± 0.6 2.7 ± 0.6
*Total aerobic plate counts were calculated by bacteria that are capable of growth in APW at 37oC incubation overnight.
Table 7-2 show the log unit reductions of V. parahaemolyticus, V. vulnificus and
total bacteria after the 50 and 55oC treatment respectively. At the 50oC treatment, again,
all the V. vulnificus was completely eliminated, however, an average of a 1.3 log unit
reduction was observed for V. parahaemolyticus. Again, with the expectation of a
minimum of a 3 log unit reduction, we can conclude that the protective effect at this
temperature results in a reduction in the overall inactivation of V. parahaemolyticus and
thus not safe for human consumption. It is important to note that the protective effect at
50oC was less than at the previous 48oC temperature, which could suggest that as the
temperature increases, the ability for the oyster to provide a protective effect may be
minimized.
At 55oC, however, the protective effect becomes even less apparent than in the
previous two cases. Using the mean of the overnight sample’s V. parahaemolyticus
concentrations (2.0x10⁴), a 3 log unit reduction in trials 1 and 2 and a 2 log unit in trial 3

52
is found. The mean shows a 2.7 ± 0.6 log unit reduction, displaying that the protective
effect at this temperature has been reduced. Again, V. vulnificus was completely
eliminated, most probably related to the low initial starting concentration. This
temperature not only significantly reduced the Vibrio spp. but also reduced the total
bacterial count by 2.7 ± 0.6 log units. A pattern can be noticed that as the temperature
increases, the protective effect appears to be minimized, thus suggesting the higher the
temperature the less likely protective effects influence the survival of these potential
pathogens.
Overall, the study concludes that cooking to a 3 log unit reduction at lower
temperatures is not sufficient in eliminating the test organisms due to the protective
effect of the oyster. As the temperature increased, it was observed that protection from
the food system was reduced and a safer product is the end result. Because of this
issue, safe cooking parameters were not recommended on these temperatures, and
other studies were conducted to allow safe cooking practices based on higher
temperatures.
53
CHAPTER 8 ASSESSING COMMERICAL COOKING PROCEDURES
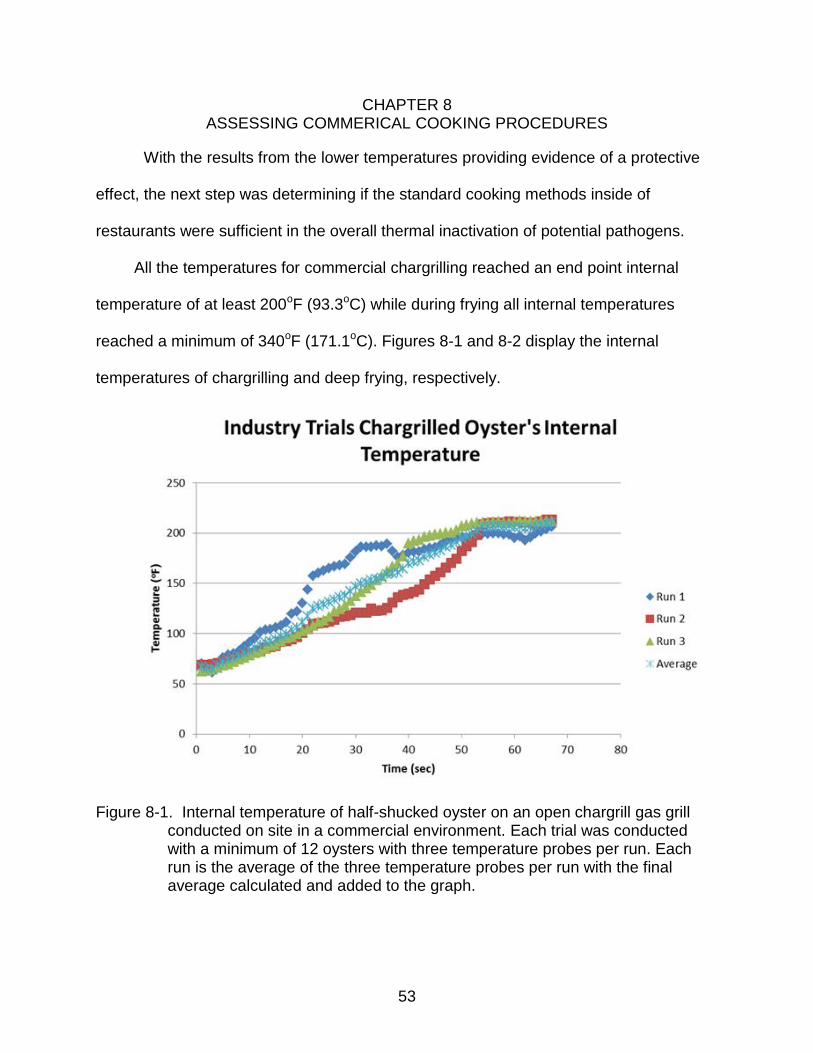
With the results from the lower temperatures providing evidence of a protective
effect, the next step was determining if the standard cooking methods inside of
restaurants were sufficient in the overall thermal inactivation of potential pathogens.
All the temperatures for commercial chargrilling reached an end point internal
temperature of at least 200oF (93.3oC) while during frying all internal temperatures
reached a minimum of 340oF (171.1oC). Figures 8-1 and 8-2 display the internal
temperatures of chargrilling and deep frying, respectively.
Figure 8-1. Internal temperature of half-shucked oyster on an open chargrill gas grill conducted on site in a commercial environment. Each trial was conducted with a minimum of 12 oysters with three temperature probes per run. Each run is the average of the three temperature probes per run with the final average calculated and added to the graph.

54
Figure 8-2. Internal Oyster Temperatures during on site trials conducted on the
restaurant level. Twelve oysters were dropped per frying batch with each run having three temperature probes per 12 oysters. Each run is the average of those 3 trials and then the average of those trials was averaged.
These results should differ from the lower temperature if following the
assumption that as the temperature increases the overall protective effects of the oyster
will decrease as noted in previous experiments. Using the D and z-values determined in
a PBS solution, it was hypothesized that if mimicking the lowest internal temperature
recorded in commercial restaurant operations (200oF), enough energy should enter the
system to sufficiently eliminate potential Vibrio spp. pathogens. The staged trials used
whole shucked oysters with elevated levels of V. vulnificus and V. parahaemolyticus
prepared using identical temperature abuse procedures as described for the thermal

55
assessment at internal temperatures of 48, 50 and 55oC (Table 8-1). The resulting
levels exceeded 103 CFU/mL V. vulnificus and V. parahaemolyticus. The staged
chargrill system provided direct heating between 420-450oF. The oysters all reached an
internal temperature of 200oF before removal from the grill, and they were allowed to
cool (for handling) as would customarily occur in a restaurant setting. Total bacteria
were calculated by bacteria that are capable of growth in APW at 37oC incubation
overnight.
It is important to note that the V. vulnificus concentrations in these trials were
much higher than in initial thermal recovery study (103 CFU/mL versus 101 CFU/mL).
This helped to also determine the overall reduction of V. vulnificus as well as V.
parahaemolyticus where the prior study could only hypothesize that if V.
parahaemolyticus was reduced, V. vulnificus should be reduced at least to an
equivalent rate
Table 8-1. Initial concentrations and Log unit Reduction of Temperature Abused Oyster V. vulnificus, V. parahaemolyticus and total bacteria after a 200oF heat treatment in CFU/mL.
Sample
V. vulnificus V. parahaemolyticus
Total Aerobic Plate Count*
Initial concentration 6.0x10³ 4.0x10³ 7.3x10⁵ Mean log unit reduction at 200oF 3 ± 0.0 3 ± 0.0 4.7 ± 0.6 Mean log unit reduction at 145oF 3 ± 0.0 3 ± 0.0 1.7 ± 0.6
*Total aerobic plate counts were calculated by bacteria that are capable of growth in APW at 37oC incubation overnight.
The results suggests that when reaching an internal temperature of 200oF in a
standard cooking practice as followed by many reputable restaurants, not only are the
potential Vibrio spp. pathogens eliminated, so are nearly all other bacterial counts
(Table 8-1).

56
Mindful of the FDA US Food Code (2009) recommendations to cook seafood to
145oF internal for 15 sec, the final trial intended to demonstrate the bacterial influence
of this procedure.
The approached used the same batch of overnight temperature abused oysters
that were shucked on the half shell and placed on the grill. However, the product was
only allowed to reach and internal temperature of 145oF. After 15 sec, the product was
removed from the grill (temperatures reached greater than 145oF internally from the
extra 15 sec on the grill) and the product was then allowed to cool to room temperature
identically as used in the 200oF trials.
Table 8-1 displays the temperature abused oyster’s mean aerobic plate counts for
V. vulnificus, V. parahaemolyticus and total bacteria after a 145oF for 15 sec heat
treatment in CFU/mL as well as the total log unit reduction after heat treatment. *Total
bacteria were calculated by bacteria that are capable of growth in APW at 37oC
incubation overnight.
Heating to an internal temperature of 145oF for 15 sec with a starting
concentration of ~103 CFU/mL will eliminate potential Vibrio spp. pathogens (Table 8-1).
Interestingly, although there were no Vibrio spp. survivors that grew on the selective
media, some bacteria did survive and grew on standard non-selective media APC at
37oC. With this data, it can be conclusively stated that with an internal temperature of
200oF or 145oF for 15 sec, a passive cool down, and a common 3 log unit initial
bacterial count for Vibrio spp. will produce a safe product for human consumption.
Another important note about these trials is the amount of energy entered into the
200oF system is drastically greater in terms of reducing Vibrio spp. than in the 145oF.
57
Since both reduced the Vibrio spp. concentrations by at least 3 log units, it is
reasonable to assume that cooking to 200oF will eliminate even greater than 3 log units
simply because of the time and energy in the system after the 145oF temperature has
been reached.

58
CHAPTER 9 DISCUSSION
Vibrio vulnificus, V. parahaemolyticus and serogroup 01 V. cholerae are halophilic,
potential pathogenic mesophiles commonly found inside of Crassostrea virginica.
Although consumption of this product includes raw to steamed, fried and chargrilled
products, little has been documented on how to create safe cooking parameters to
eliminate potential pathogenic threats. This study provides detailed information about D
and z-values in a common PBS medium and relates that with the actual food commonly
associated with human infections.
The findings determined in this study are similar to some previous studies (Tables
9-1, 9-2 and 9-3).
Table 9-1. D-values for V. cholerae
Temperature D-Value Medium Reference
(oC) (oF) (min) 48 118.4 2.36 PBS Solution Hanna and Otwell, unpublished 48.9 120 9.17 Shrimp Homogenate Hinton and Grodner, 1985. 49 120.2 8.15 Crabmeat Shultz et al., 1984 50 122 1.96 PBS Solution Hanna and Otwell, unpublished 54 129.2 5.02 Crabmeat Shultz et al., 1984 54.4 129.9 0.43 Shrimp Homogenate Hinton and Grodner, 1985 55 131 0.52 PBS Solution Hanna and Otwell, unpublished 60 140 2.65 Crabmeat Shultz et al., 1984 60 140 0.39 Shrimp Homogenate Hinton and Grodner, 1985 65.5 149.9 0.32 Shrimp Homogenate Hinton and Grodner, 1985 66 150.8 1.60 Crabmeat Shultz et al., 1984 66 150.8 1.22 Crayfish Homogenate Grodner and Hinton, 1985 71 159.8 0.30 Crabmeat Shultz et al., 1984 71 159.8 0.30 Crayfish Homogenate Grodner and Hinton, 1985 71.1 160 0.31 Shrimp Homogenate Hinton and Grodner, 1985 76.7 170.1 0.30 Shrimp Homogenate Hinton and Grodner, 1985 77 170.6 0.27 Crayfish Homogenate Grodner and Hinton, 1985 82 179.6 0.27 Crayfish Homogenate Grodner and Hinton, 1985 82.2 180 0.28 Shrimp Homogenate Hinton and Grodner, 1985

59
Table 9-2. D-values for V. parahaemolyticus.
Temperature D-Value Medium Reference
(oC) (oF) (min) 47 116.6 65.1 7.5% NaCl Beuchat and Worthington, 1976 48 118.4 3.02 PBS Solution Hanna and Otwell, unpublished 49 120.0 0.82 Clam Homogenate Delmore and Chrisley, 1979 50 122 1.99 PBS Solution Hanna and Otwell, unpublished 51 123.8 0.66 Clam Homogenate Delmore and Chrisley, 1979 53 127.4 0.40 Clam Homogenate Delmore and Chrisley, 1979 55 131 0.29 Clam Homogenate Delmore and Chrisley, 1979 55 131 0.72 PBS Solution Hanna and Otwell, unpublished
Table 9-3. D-values for V. vulnificus.
Temperature D-Value Medium Reference
(oC) (oF) (min) 47 116.6 2.4 Buffered Saline Cook and Ruple, 1992 48 118.4 2.24 PBS Solution Hanna and Otwell, unpublished 50 122 1.15 Buffered Saline Cook and Ruple, 1992 50 122 2.05 PBS Solution Hanna and Otwell, unpublished 55 131 0.50 PBS Solution Hanna and Otwell, unpublished
The lack of literature on D-values for V. cholerae’s based on media as opposed to
a food matrix makes such comparisons difficult. An apparent food protective effect is
noticed in the shrimp homogenate at 48.9oC when compared directly to this study’s
value at 48oC (9.17 min in the shrimp homogenate versus 2.36 min in PBS). This is
expected as protective barriers found in foods can vary based on food product type,
density, shape and related composition.
Similar discrepancies were noticed with V. parahaemolyticus (Table 9-2). A
difference was noted when heating Vibrio spp. at 48oC in PBS (Table 9-2) versus
Beuchat and Worthington’s (1976) trials in 7.5% NaCl at 47oC. Beuchat and
Worthington (1976) recorded a 65.1 min D-value at this temperature, whereas this study
resulted in a 3.02 min D-value in PBS, a similar media.

60
At certain temperatures, the values in this study correspond closely to values in
previous literature for V. vulnificus (Table 9-3). Cook and Ruple (1992) noted a 2.4 min
D-value in a buffered saline at 47oC, whereas this study noted a 2.24 min D-value at
48oC. As the temperatures increased to 50oC, Cook and Ruple (1992) noted a 1.15 min
(in a buffered saline) whereas this study recorded a 2.05 min D-value (in PBS).
Because of the significant role of the food matrix in the protection of the bacteria
during cooking processes, the thermal recovery studies were essential to determining
how the PBS D-values would compare to trials conducted in oysters. The thermal
recovery studies show that at lower temperatures (48 and 50oC), protective effects from
the oyster are greater than protective effects at higher temperatures (55oC+). This
justifies cooking to higher temperatures in order to produce a product safe for human
consumption. These studies also provide directions to develop cooking control
programs in actual restaurant operations that can support HACCP-based concepts.
Every trial conducted on site at multiple locations had an internal temperature reaching
a minimum of 200oF. Using this as a standard, this study proves that not only were all
potential Vibrio spp. pathogenic threats reduced from concentrations commonly found in
oyster products (~103 CFU/mL), but other bacterial counts were reduced as well.
Another extremely beneficial aspect of this study is the validation of the US Food
Code’s (2009) internal temperature of 145oF for 15 sec as a safe guard for reducing
pathogenic threats. Results from this study conclude that following the US Food Code’s
(2009) recommendation eliminates all potential Vibrio spp. pathogenic threats to a
threshold of a minimum of 3 log units, which is a normal concentration of Vibrio spp.
commonly associated with oysters.

61
This research demonstrated that following the parameters of cooking to an internal
temperature of either 145oF for 15 sec or 200oF will sufficiently eliminate potential
pathogenic threats of Vibrio spp. Because of these data it can be stated that using
oyster products with natural Vibrio spp. loads (~103 CFU/mL) can be cooked to a point
of safe for human consumption with little risk of infection. With this knowledge, a
HACCP plan for the restaurant level can be recommended and standard cooking
procedures can be applied and validated. Restaurants following these validated
methods can assume that their product is safe for human consumption as long as it
follows the criteria in the validated methods.
Restaurants can rely on these science-based results as a validation of proper
cooking procedures. For example, one well established famous oyster restaurant in
New Orleans has traditionally followed in-house protocols or recipes to cook their most
popular oyster dish, chargrilled oysters. They train their staff on very specific cooking
instructions with visual aids to help ensure their methods are followed. They
recommend placing the required amount of oysters onto a preheated grill and allowing
the oysters to heat to the point that they begin to expel some of their water, using the
visual aid of the separation and expansion of the edges of the oyster to help determine
when this point is reached. Next, they tip and remove the liquor (commonly called the
liquid) of the oyster, and continue to cook for approximately 6 min. After applying
proprietary seasonings and butter sauces, they allow to cook for an additional 1 min and
30 sec and then remove from the heat. They state that at this point the oyster should be
the color of a brown paper bag and are cooked to an internal temperature of >200oF at
this point.
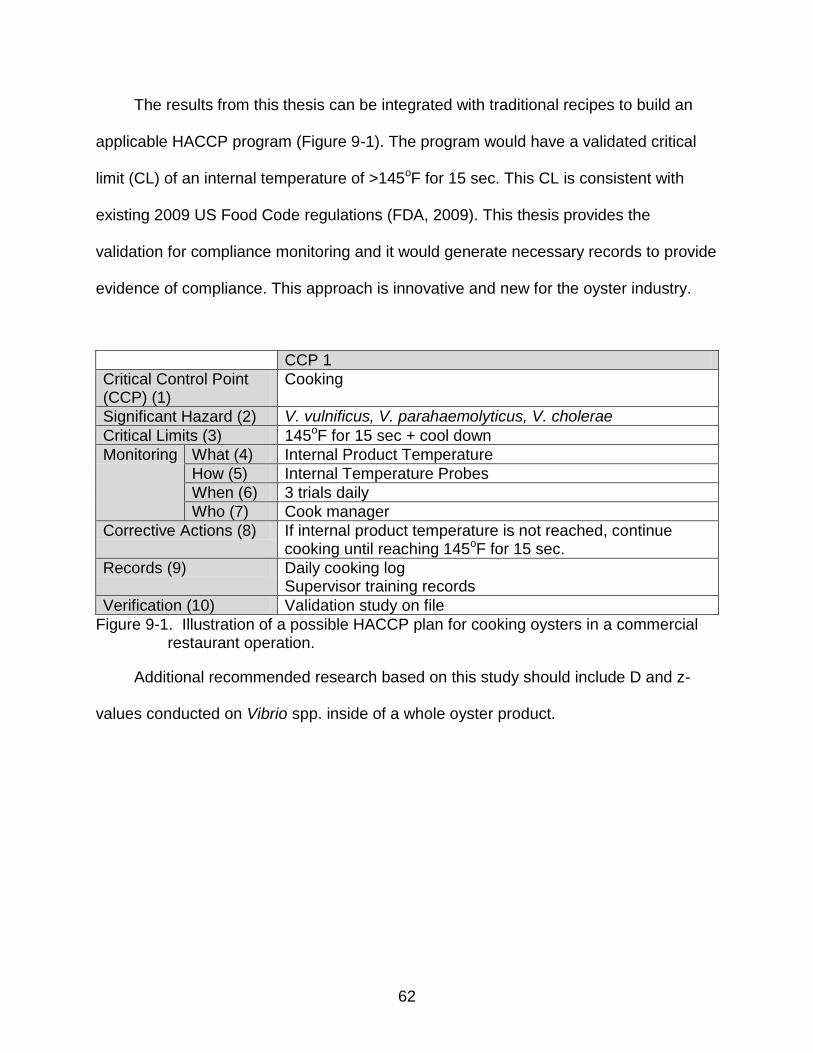
62
The results from this thesis can be integrated with traditional recipes to build an
applicable HACCP program (Figure 9-1). The program would have a validated critical
limit (CL) of an internal temperature of >145oF for 15 sec. This CL is consistent with
existing 2009 US Food Code regulations (FDA, 2009). This thesis provides the
validation for compliance monitoring and it would generate necessary records to provide
evidence of compliance. This approach is innovative and new for the oyster industry.
CCP 1
Critical Control Point (CCP) (1)
Cooking
Significant Hazard (2) V. vulnificus, V. parahaemolyticus, V. cholerae
Critical Limits (3) 145oF for 15 sec + cool down
Monitoring What (4) Internal Product Temperature
How (5) Internal Temperature Probes
When (6) 3 trials daily
Who (7) Cook manager
Corrective Actions (8) If internal product temperature is not reached, continue cooking until reaching 145oF for 15 sec.
Records (9) Daily cooking log Supervisor training records
Verification (10) Validation study on file
Figure 9-1. Illustration of a possible HACCP plan for cooking oysters in a commercial restaurant operation.
Additional recommended research based on this study should include D and z-
values conducted on Vibrio spp. inside of a whole oyster product.

63
LIST OF REFERENCES
Asselt ED, Zwietering MH. 2005. A Systematic Approach to Determine Global Thermal Inactivation Parameters for Various Food Pathogens. International Journal of Food Microbiology. 03 (468): 1-10.
Beuchat LR, Worthington RE. 1976. Relationships Between Heat Resistance and Phospholipid Fatty Acid Composition of Vibrio parahaemolyticus. Applied and Environmental Microbiology. Mar 1976:389-94.
Blackburn C de W, Curtis LM, Humpheson L, Billon C, McClure PJ. 1997. Development of Thermal Inactivation Models for Salmonella enteritidis and Escherichia coli O157:H7 with Temperature, pH and NaCl as Controlling Factors. International Journal of Food Microbiology. 38: 31-44.
Blake PA, Merson MH, Weaver RE, Hollis DG, Heublein PC. 1979. Disease Caused by a Marine Vibrio – Clinical Characteristics and Epidemiology. New England Journal of Medicine. 300:1-5.
CDC. Diabetes trend. http://www.cdc.gov/diabetes/pubs/factsheet11.htm, August, 2012. Last accessed on October 10, 2012.
CDC. Vibrio. http://www.cdc.gov/nczved/divisions/dfbmd/diseases/vibriov/ August 2012. Last accessed on October 10, 2012.
Cook DW, Ruple AD. 1992. Cold Storage and Mild Heat Treatment as Processing Aids to Reduce the Number of Vibrio vulnificus in Raw Oysters. Journal of Food Protection. 55(12):985-989.
Cox PM, Bets RA, Jones CD, Spall SA, Totterdell IJ. 2000. Acceleration of Global Warming due to Carbon-Cycle Feedbacks in a Coupled Climate Model. Nature 408:184-186.
Delmore RP, and Chrisley FD. 1979. Thermal Resistance of Vibrio parahaemolyticus in Clam Homogenate. Journal of Food Protection. 42(2):131-134.
Food and Drug Administration [FDA]. Food Code 2009. http://www.fda.gov/Food/FoodSafety/RetailFoodProtection/FoodCode/FoodCode2009/ August 2012. Last accessed on October 10, 2012.
Food and Drug Administration [FDA]. 21CFRPart 123 http://www.accessdata.fda.gov/scripts/cdrh/cfdocs/cfCFR/CFRSearch.cfm?CFRPart=123 August 2012. Last accessed on October 10, 2012.
Falkow S. 1988. Molecular Koch’s Postulates Applied to Microbial Pathogenicity. Reviews of Infectious Disease 10(2): S274-6.

64
Grodner RM, Hinton A. 1985. Determination of the Thermal Death Time of Vibrio cholerae in Crayfish Meat Homogenate (Procambarus clarkii Gerard). In Proceedings of the Ninth Annual Tropical and Subtropical Fisheries Conference. 15-20.
Grodner RM, Hinton A. 1985. Determination of the Thermal Death Time of Vibrio cholerae in shrimp (Penaeus setiferus). In Proceedings of the Ninth Annual Tropical and Subtropical Fisheries Conference. 109-119.
Interstate Shellfish Sanitation Conference [ISSC]. NSSP Guide for the Control of Molluscan Shellfish. http://www.issc.org/NSSP/Default.aspx. August 2012. Last accessed October 12, 2012.
Jones MK, Oliver JD. 2009. Vibrio vulnificus: Disease and Pathogensis. Infection and Immunity. 77:1723-33
Joseph SW, Colwell RR, Kaper JB. 1982. Vibrio parahaemolyticus and Related Halophilic Vibrios. CRC Critical Reviews in Microbiology. 10: 77-124
Kaspar CW, Tamplin ML. 1993. Effects of Temperature and Salinity on the Survival of Vibrio vulnificus in seawater and shellfish. Applied Environment Microbiology. 59(8): 2425-2429.
McLandsborough LA 2003. Food Microbiology Laboratory. 2003. Taylor and Francis Group. Florida. Pg:196-199
Motes ML, DePaola A., Cook DW, Veazey JE, Hunsucker JC, Garthright WE, Blodgett RJ, Chirtel SJ. 1998. Influence of Water Temperature and Salinity on Vibrio vulnificus in Northern Gulf and Atlantic Coast Oysters (Crassostrea virginica). Applied Environment Microbiology. 64(4): 1459-1465.
National Advisory Committee on Microbiological Criteria for Foods [NACMCF]. 2007. Response to the Questions Posed by the Food and Drug Administration and the National Marine Fisheries Service Regarding Determination of Cooking Parameters for Safe Seafood Consumers. Journal of Food Protection. 71(6):1287-1308
Randa MA, Polz MF, Lim E. 2004. Effects of Temperature and Salinity on Vibrio vulnificus Population Dynamics as Assessed by Quantitative PCR. Applied Environment Microbiology. 70(9): 5469-5476
Reese CED, Dodd C, Gibson PT, Booth IR, and Stewart GSAB. 1995. International Journal of Food Microbiology. 2:263-275.
Roberts RJ, Chanratchakool P, Pearson M, Limsuwan C. 1991. Oxytetracycline Sensitivity of Vibrio Species Isolated from Diseased Black Tiger Shrimp, Penaeus monodon Fabricius. Journal of Fish Diseases. 18:79-82.

65
Schultz LM, Rutledge JE, Grodner RM, Biede SL. 1984. Disease from Infection with Vibrio mimicus a newly Recognized Vibrio Species. Annals of Internal Medicine. 99:169-171

66
BIOGRAPHICAL SKETCH
Christopher W. Hanna attended the University of Florida from 2005-2009 for his
Bachelor of Science in food science and human nutrition. He completed courses
ranging from chemistry 1- organic 2, biology 1 and 2, microbiology, biochemistry,
physics 1-2, nutrition courses, and general electives. He then took a year off and
applied to the food science graduate program at the University of Florida. During his
graduate degree he received all A-marks in his core classes: advanced food chemistry,
advanced food microbiology, advanced food processing, product development, and
sensory analysis. Chris completed this course work under Dr. Wade Yang initially, and
transferred to the aquatics seafood department and began his thesis with Dr. Steve
Otwell as his chair. His appointed committee members include Dr. Keith Schneider, Dr.
Anita Wright, and Dr. Chuck Adams.
Chris eventually desires to pursue a career as a technical sales associate,
however, he hope to one day end up managing and becoming the vice president of
sales at a large company.