Determining the “TRUE COST” of Low Income Customers
30
©1997 Lenhardt & Colton LLC Stephen D. Colton Lenhardt & Colton, LLC 1775 Magnolia Ln N Minneapolis, MN 55441 Ph (612) 550-0687 *** Fax (612) 550-0776 [email protected] Determining the “TRUE COST” of Low Income Customers
-
Upload
raya-walls -
Category
Documents
-
view
28 -
download
1
description
Determining the “TRUE COST” of Low Income Customers. Stephen D. Colton Lenhardt & Colton, LLC 1775 Magnolia Ln N Minneapolis, MN 55441 Ph (612) 550-0687 *** Fax (612) 550-0776 [email protected]. Workshop Objective. - PowerPoint PPT Presentation
Transcript of Determining the “TRUE COST” of Low Income Customers

©1997 Lenhardt & Colton LLC
Stephen D. ColtonLenhardt & Colton, LLC
1775 Magnolia Ln N Minneapolis, MN 55441Ph (612) 550-0687 *** Fax (612) 550-0776
Determining the “TRUE COST” ofLow Income Customers

©1997 Lenhardt & Colton LLC
Workshop Objective
Demonstrate How One UsesActivity Based Costing
to Determine the “True Cost” of Serving Low Income Customers

©1997 Lenhardt & Colton LLC
Definition
“True Cost” means there is a direct causal link between costs incurred and our cost objective, the Low Income Customer market segment.

©1997 Lenhardt & Colton LLC
Today’s Agenda
• Why Do We Need to Know the True Cost of Serving Low Income Customers?
• Why Turn to “Activity Based Costing”?
• Structuring an ABC Project• Analyzing the Data• Using Activity Based Data for
Continuous Improvement.

©1997 Lenhardt & Colton LLC
Why Do We Need to Know?
The Public Policy Question:“How Big is the Aggregate Need?”
The Question for an Individual Utility:“How Do We Live Within the Subsidy?”

©1997 Lenhardt & Colton LLC
How Big is the Aggregate Need?
$1,000,000?$1,000,000?
$20,000,000?$20,000,000?
$500,000,000?$500,000,000?
©1997 Lenhardt & Colton LLC
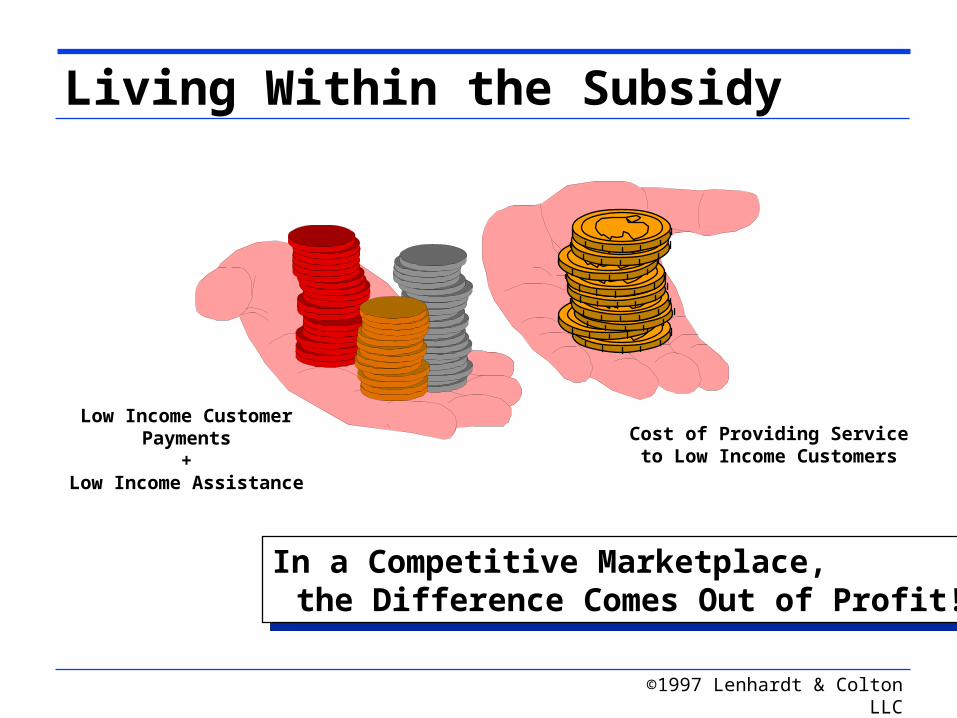
Living Within the Subsidy
Low Income Customer Payments
+Low Income Assistance
Cost of Providing Service to Low Income Customers
In a Competitive Marketplace, the Difference Comes Out of Profit!
In a Competitive Marketplace, the Difference Comes Out of Profit!

©1997 Lenhardt & Colton LLC
• Why Do We Need to Know the True Cost of Serving Low Income Customers?
• Why Turn to “Activity Based Costing”?
• Structuring an ABC Project• Analyzing the Data• Using Activity Based Data for
Continuous Improvement.
Today’s Agenda

©1997 Lenhardt & Colton LLC
Traditional Data Tells Us What???
Description Plan Actual VarianceSalaries & Benefits 500$ 575$ (75)$ Postage 75 80 (5) Telephone 50 45 5 Building Occupancy 25 25 - Other Supplies 20 50 (30) Transfers 50 40 10 903- Customer records & collection expenses
720$ 815$ (95)$

©1997 Lenhardt & Colton LLC
Activity Based Data Reveals Causes
Description Plan Actual VarianceAnswer Customer Inquiries 140$ 165 (25) Resolve Billing Errors 115 120$ (5)$ Apply Customer Payments 75 75 - Negotiate Deferred Pmt Plans 115 110 5 Disconnect Customer Service 255 320 (65) Attend Weekly Staff Meetings 20 25 (5) Total 720$ 815$ (95)$
Cause of Costs
• Normal Credit & Collections Activities
- Qty of Credit & Collections “Actions”
- Current Credit & Collections Process
• High Arrearages at End of Winter

©1997 Lenhardt & Colton LLC
ActivitiesActivities
The Process Model
External CustomersExternal Customers
SuppliersSuppliers
Internal CustomersInternal Customers
Resources ConsumedPeople Costs $$$
Supplies $$$Deprec $$$
Inputs
Outputs

©1997 Lenhardt & Colton LLC
Hierarchy of “Process Terms”
Business Process
Activity
Tasks
Activity Output
Review Application
Run Credit Report
Assign Customer Number
Perform Data Entry
Send Confirmation
1. Setup New Account 2. Connect new service 3. Issue first billing
Initiate New Customer Service
Confirmation Letter

©1997 Lenhardt & Colton LLC
• Why Do We Need to Know the True Cost of Serving Low Income Customers?
• Why Turn to “Activity Based Costing”?
• Structuring an ABC Project• Analyzing the Data• Using Activity Based Data for
Continuous Improvement.
Today’s Agenda

©1997 Lenhardt & Colton LLC
Steps of the ABC Process
1. Identify Activiti
es
2. Trace Costs to Activitie
s
3. Identify Outputs
5. Calc Cost per Output
4. Collect
Demand for
Outputs
6. Calc Market Segment Cost

©1997 Lenhardt & Colton LLC
Step 1: Define Activities
Interviews
Workshops

©1997 Lenhardt & Colton LLC
The APQC Business Process Model
Develop & Manage Human Resources
Manage Information
Manage Financial & Physical Resources
Execute Environmental Management Program
Manage External Relations
Manage Improvement & Change
Understand Markets & Customers
Develop Vision & Strategy
Design Goods & Services
Market & Sell Goods & Services
Produce & Deliver
Goods & Services
Invoice & Service
Customer
Man
ag
em
en
t &
Su
pp
ort
Pro
cess
es
Op
era
tin
g P
roce
sses
©1997 Lenhardt & Colton LLC
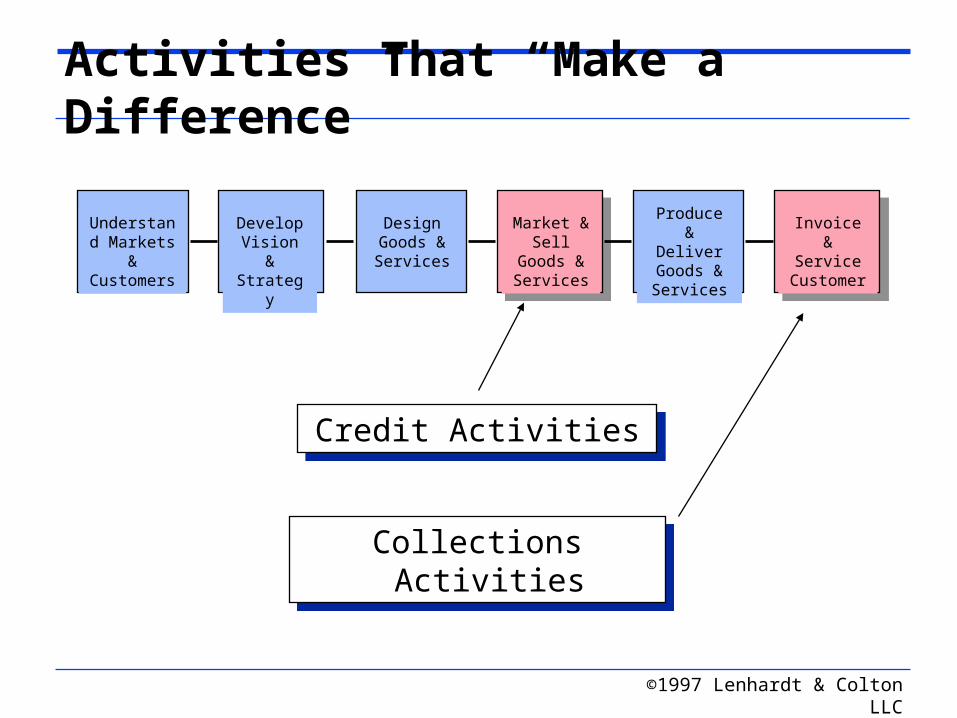
Activities That “Make a Difference”
Understand Markets
& Customers
Develop Vision & Strategy
Design Goods & Services
Market & Sell
Goods & Services
Produce & Deliver
Goods & Services
Invoice & Service
Customer
Credit ActivitiesCredit Activities
Collections ActivitiesCollections Activities

©1997 Lenhardt & Colton LLC
Example of Collections Activities
Collections Activities
• Answer Customer Inquiries
• Resolve Billing Errors
• Apply Customer Pmts
• Negotiate Deferred Payment Plans
• Disconnect Customer Service
• Attend Staff Meetings
Collections Activities
• Answer Customer Inquiries
• Resolve Billing Errors
• Apply Customer Pmts
• Negotiate Deferred Payment Plans
• Disconnect Customer Service
• Attend Staff Meetings

©1997 Lenhardt & Colton LLC
Step 2: Trace Costs to Activities
Description ActualAnswer Customer Inquiries 165$ Resolve Billing Errors 120 Apply Customer Payments 75 Negotiate Deferred Pmt Plans 110 Disconnect Customer Service 320 Attend Weekly Staff Meetings 25 Total 815$
Description ActualAnswer Customer Inquiries 165$ Resolve Billing Errors 120 Apply Customer Payments 75 Negotiate Deferred Pmt Plans 110 Disconnect Customer Service 320 Attend Weekly Staff Meetings 25 Total 815$
Description ActualSalaries & Benefits 575$ Postage 80 Telephone 45 Building Occupancy 25 Other Supplies 50 Transfers 40 903- Customer records & collection expenses
815$
Description ActualSalaries & Benefits 575$ Postage 80 Telephone 45 Building Occupancy 25 Other Supplies 50 Transfers 40 903- Customer records & collection expenses
815$

©1997 Lenhardt & Colton LLC
Step 3: Identify Outputs
Description Actual Activity OutputAnswer Customer Inquiries 165$ One Resolved InquiryResolve Billing Errors 120 One Corrected ErrorApply Customer Payments 75 One Applied PaymentNegotiate Deferred Pmt Plans 110 One Negotiated PlanDisconnect Customer Service 320 One Customer DisconnectionAttend Weekly Staff Meetings 25 One Attended Staff MeetingTotal 815$
Description Actual Activity OutputAnswer Customer Inquiries 165$ One Resolved InquiryResolve Billing Errors 120 One Corrected ErrorApply Customer Payments 75 One Applied PaymentNegotiate Deferred Pmt Plans 110 One Negotiated PlanDisconnect Customer Service 320 One Customer DisconnectionAttend Weekly Staff Meetings 25 One Attended Staff MeetingTotal 815$

©1997 Lenhardt & Colton LLC
Step 4: Collect Demand for Outputs
• Projected Aggregate Annual Demand for each Activity’s Output
• Projected or Actual Demand for each Activity’s Output by Market Segment

©1997 Lenhardt & Colton LLC
Aggregate Annual Demand
Description Actual Activity Output Annual DemandAnswer Customer Inquiries 165$ Resolved Inquiry 4000 InquiriesResolve Billing Errors 120 Corrected Error 55000 CorrectionsApply Customer Payments 75 Applied Payment 600000 ApplicationsNegotiate Pmt Plans 110 Negotiated Plan 800 PlansDisconnect Service 320 Customer Disconnection 2900 DisconnectionsAttend Weekly Staff Mtgs 25 Attended Staff Meeting 48 Staff MeetingsTotal 815$
Description Actual Activity Output Annual DemandAnswer Customer Inquiries 165$ Resolved Inquiry 4000 InquiriesResolve Billing Errors 120 Corrected Error 55000 CorrectionsApply Customer Payments 75 Applied Payment 600000 ApplicationsNegotiate Pmt Plans 110 Negotiated Plan 800 PlansDisconnect Service 320 Customer Disconnection 2900 DisconnectionsAttend Weekly Staff Mtgs 25 Attended Staff Meeting 48 Staff MeetingsTotal 815$

©1997 Lenhardt & Colton LLC
Output Demand by Market Segment
Description Annual DemandLow Income
Demand
NotLow Income
DemandAnswer Customer Inquiries 4000 Inquiries 250 3750Resolve Billing Errors 55000 CorrectionsApply Customer Payments 600000 ApplicationsNegotiate Pmt Plans 800 Plans 705 105Disconnect Service 2900 DisconnectionsAttend Weekly Staff Mtgs 48 Staff Meetings Support ActivityTotal

©1997 Lenhardt & Colton LLC
Step 5: Calculate Cost per Output
Description Actual Annual Demand Cost / OutputAnswer Customer Inquiries 165$ 4000 Inquiries 42.50$ Resolve Billing Errors 120 55000 Corrections 2.25$ Apply Customer Payments 75 600000 Applications 0.129$ Negotiate Pmt Plans 110 800 Plans 141.60$ Disconnect Service 320 2900 Disconnections 113.65$ Attend Weekly Staff Mtgs 25 48 Staff Meetings n/aTotal 815$
Description Actual Annual Demand Cost / OutputAnswer Customer Inquiries 165$ 4000 Inquiries 42.50$ Resolve Billing Errors 120 55000 Corrections 2.25$ Apply Customer Payments 75 600000 Applications 0.129$ Negotiate Pmt Plans 110 800 Plans 141.60$ Disconnect Service 320 2900 Disconnections 113.65$ Attend Weekly Staff Mtgs 25 48 Staff Meetings n/aTotal 815$

©1997 Lenhardt & Colton LLC
Step 6: Calculate Market Segment Cost
Description Cost / OutputLow Income
DemandLow Income
Segment CostAnswer Customer Inquiries 42.50$ 250 10,600$ Resolve Billing Errors 2.25$ 5000 11,300$ Apply Customer Payments 0.129$ 54000 7,000$ Negotiate Pmt Plans 141.60$ 705 99,800$ Disconnect Service 113.65$ 1650 187,500$ Attend Weekly Staff Mtgs n/a n/a n/aTotal 316,200$

©1997 Lenhardt & Colton LLC
Today’s Agenda
• Why Do We Need to Know the True Cost of Serving Low Income Customers?
• Why Turn to “Activity Based Costing”?
• Structuring an ABC Project• Analyzing the Data• Using Activity Based Data for
Continuous Improvement.

©1997 Lenhardt & Colton LLC
Analyzing the Data
• Total Cost of the Low Income Market Segment
• Differential Cost of the Low Income Segment
• Normalizing the Data- Cost/Sales Ratio- Cost/Customer Ratio- A Caution

©1997 Lenhardt & Colton LLC
• Why Do We Need to Know the True Cost of Serving Low Income Customers?
• Why Turn to “Activity Based Costing”?
• Structuring an ABC Project• Analyzing the Data• Using Activity Based Data for
Continuous Improvement.
Today’s Agenda

©1997 Lenhardt & Colton LLC
Strategies for Continuous Improvement
1. Reduce Costs of Value Added Activities using Root Cause Analysis
2. Reduce the Frequency of Non-Value Added Activities

©1997 Lenhardt & Colton LLC
Description ActualAnswer Customer Inquiries 165$ Resolve Billing Errors 120 Apply Customer Payments 75 Negotiate Deferred Pmt Plans 110 Disconnect Customer Service 320 Attend Weekly Staff Meetings 25 Total 815$
Description ActualAnswer Customer Inquiries 165$ Resolve Billing Errors 120 Apply Customer Payments 75 Negotiate Deferred Pmt Plans 110 Disconnect Customer Service 320 Attend Weekly Staff Meetings 25 Total 815$
Applying These Strategies
Strategy #1Largest dollar Value Added Activity.Use Root Cause Analysis to identify the
Cost Drivers and reduce them, improving the Cost per Output.
Strategy #1Largest dollar Value Added Activity.Use Root Cause Analysis to identify the
Cost Drivers and reduce them, improving the Cost per Output.
Strategy #2A Non-Value Added Activity.Reduce the number of Non-Value
Added Outputs by reducing the “demand” for those outputs.
Strategy #2A Non-Value Added Activity.Reduce the number of Non-Value
Added Outputs by reducing the “demand” for those outputs.