Determining the economics of processing plantation … revised...Ensis – Wood Quality Private Bag...
90
This report can also be viewed on the FWPA website www.fwpa.com.au FWPA, PO Box 69, World Trade Centre, Melbourne VIC 8005, Australia T +61 (0)3 9614 7544 F +61 (0)3 9614 6822 E [email protected] W www.fwpa.com.au RESOURCE CHARACTERISATION & IMPROVEMENT PROJECT NUMBER: PN04.3007 JANUARY 2008 Determining the economics of processing plantation eucalypts for solid timber products
Transcript of Determining the economics of processing plantation … revised...Ensis – Wood Quality Private Bag...
This report can also be viewed on the FWPA website
www.fwpa.com.auFWPA, PO Box 69, World Trade Centre,
Melbourne VIC 8005, AustraliaT +61 (0)3 9614 7544 F +61 (0)3 9614 6822
E [email protected] W www.fwpa.com.au
RESOuRcE cHARAcTERiSATiON & iMPROVEMENTPROJECT NUMBER: PN04.3007 JANUARY 2008
Determining the economics ofprocessing plantation eucalyptsfor solid timber products
© 2008 Forest and Wood Products Australia Limited. All rights reserved. Publication: Determining the economics of processing plantation eucalypts for solid timber products Forest and Wood Products Australia Limited (“FWPA”) makes no warranties or assurances with respect to this publication including merchantability, fitness for purpose or otherwise. FWPA and all persons associated with it exclude all liability (including liability for negligence) in relation to any opinion, advice or information contained in this publication or for any consequences arising from the use of such opinion, advice or information. This work is copyright and protected under the Copyright Act 1968 (Cth). All material except the FWPA logo may be reproduced in whole or in part, provided that it is not sold or used for commercial benefit and its source (Forest and Wood Products Australia Limited) is acknowledged. Reproduction or copying for other purposes, which is strictly reserved only for the owner or licensee of copyright under the Copyright Act, is prohibited without the prior written consent of Forest and Wood Products Australia Limited. Project no: PN04.3007 Researchers: T. Innes FEA Timber Pty.Ltd. PO Box 733, Launceston, TAS 7250 B. Greaves, G. Nolan University of Tasmania Timber Research Unit, School of Architecture, University of Tasmania, Locked Bag 1324, Launceston, TAS 7250 R. Washusen Ensis – Wood Quality Private Bag 10, Clayton South, VIC 3169 Final report received by the FWPRDC (FWPA from September 2007) in August 2007 Forest and Wood Products Australia Limited PO Box 69, World Trade Centre, Victoria 8005 Phone: 03 9614 7544 Fax: 03 9614 6822 Email: [email protected] Web: www.fwpa.com.au
Determining the economics of processing plantation eucalypts for solid timber products
Prepared for
Forest and Wood Products Australia
by
T. Innes, B. Greaves, R. Washusen and G. Nolan
i
Contents
EXECUTIVE SUMMARY ..................................................................................... III Internal Check.............................................................................................. iv Board distortion............................................................................................ vi Conclusions.................................................................................................. vi
1.0 INTRODUCTION............................................................................................ 1
2.0 METHODOLOGY AND MATERIALS.................................................................. 2 2.1 FORESTS SAMPLED AND LOG TYPES EVALUATED...........................................................2 2.2 SAWLOG GRADING ...........................................................................................2 2.3 LOG PROCESSING ............................................................................................3
2.3.1 Log processing ......................................................................................3 2.3.2 Sawing.................................................................................................3 2.3.3 Drying .................................................................................................6 2.3.4 Dry milling............................................................................................8
2.4 GRADING SAWN BOARDS ....................................................................................8 2.4.1 Grading - ITC Heyfield............................................................................9 2.4.2 Grading - ITC Newood ............................................................................9 2.4.3 Grading - Gunns Lindsay Street ...............................................................9
2.5 CALCULATIONS ...............................................................................................9 2.6 ASSUMED PRODUCT VALUES .............................................................................. 10 2.7 DISK MEASUREMENTS...................................................................................... 11
3.0 RESULTS ..................................................................................................... 13 3.1 ABOUT FORESTS............................................................................................ 13
3.1.1 Harvested area.................................................................................... 13 3.1.2 Sawlog yield ....................................................................................... 13
3.2 LOG CHARACTERISTICS.................................................................................... 17 3.3 SAWN TIMBER GRADE RECOVERY ......................................................................... 18
3.3.1 Total dry recovery ............................................................................... 18 3.3.2 Final sawn-board grade recovery ........................................................... 19
3.4 DEFECTS IN SAWN BOARDS ............................................................................... 23 3.4.1 Reason for board downgrade................................................................. 23 3.4.2 Observed defects in sawn boards ........................................................... 24
3.5 INTERNAL CHECK ........................................................................................... 26 3.6 TOTAL PRODUCT VALUE.................................................................................... 28
3.6.1 Total product value per cubic metre of sawlog ......................................... 28 3.7 TOTAL PRODUCT VALUE PER HECTARE.................................................................... 32 3.8 ESTIMATED MILL-DOOR LOG VALUE ...................................................................... 34 3.9 DISK MEASUREMENTS FROM RIDGLEY THINNED-PRUNED E. NITENS BUTT LOGS .................... 36
4.0 DISCUSSIONS AND CONCLUSIONS ............................................................. 38 4.1 LOSS OF VALUE............................................................................................. 39
4.1.1 Internal Check .................................................................................... 39 4.1.2 Board distortion................................................................................... 40
4.2 OTHER OBSERVATIONS .................................................................................... 41 4.3 CONCLUSIONS .............................................................................................. 41
REFERENCES..................................................................................................... 42
APPENDICES..................................................................................................... 43 APPENDIX 1: FORESTS SAMPLED AND LOG TYPES EVALUATED.............................................. 43
A1.1 Victoria - 47-year-old E. globulus - unthinned, unpruned............................ 43

ii
A1.2 Victoria - E. globulus and E. nitens - 13-year-old - established at low stocking and early pruned and thinned........................................................................ 44 A1.3 Tasmania - E. nitens - 26-year-old - thinned and pruned and control (no thinning or pruning) - Gunns’ - Ridgley ........................................................... 46 A1.4 Tasmania - E. globulus - 19-year-old - early thinned and pruned - Ulverstone49
APPENDIX 2: SUMMARY OF APPEARANCE GRADING CRITERIA BY ITC LTD ................................ 51 APPENDIX 3: GREEN SAWN RECOVERY........................................................................ 52 APPENDIX 4: SAWN BOARD RECOVERY BY BOARD GRADE, NOMINAL BOARD WIDTH AND LOG GRADE.. 55 APPENDIX 5: PRIMARY REASON FOR BOARD DOWNGRADE.................................................. 60 APPENDIX 6: ASSUMPTIONS UNDERLYING ESTIMATION ON MILL-DOOR LOG VALUE...................... 61 APPENDIX 7: ENSIS REPORT ON SAWING TRIALS IN VICTORIA ........................................... 64
Acknowledgements The authors gratefully acknowledge the contribution of:
• Integrated Tree Cropping Ltd (ITC). At the beginning of this study, this company was known as Neville Smith Timber Industries (NSTI) in Victoria and Neville Smith Tasmania (NST) in Tasmania. They are still referred to as this in Appendix 7;
• Gunns Ltd’s timber and plantation divisions;
• Sustainable Forest Management; and
• SmartFibre.
Other companies and organisations who contributed to the project including Forestry Tasmania, Grand Ridge Plantations, Frank Hirst, and Robin.
The authors would also like to thank:
• Nigel Lee Jones from Gunns Ltd for his invaluable experience in grading, and other Gunns Ltd staff;
• Vince Hurley, Mick Lee and other staff at Integrated Tree Cropping Ltd;
• Steve Wright, John Lilywhite and Ross Farrell from the University of Tasmania’s Timber Research Unit; and
• Morrow and M. Bojadzic from Ensis.
iii
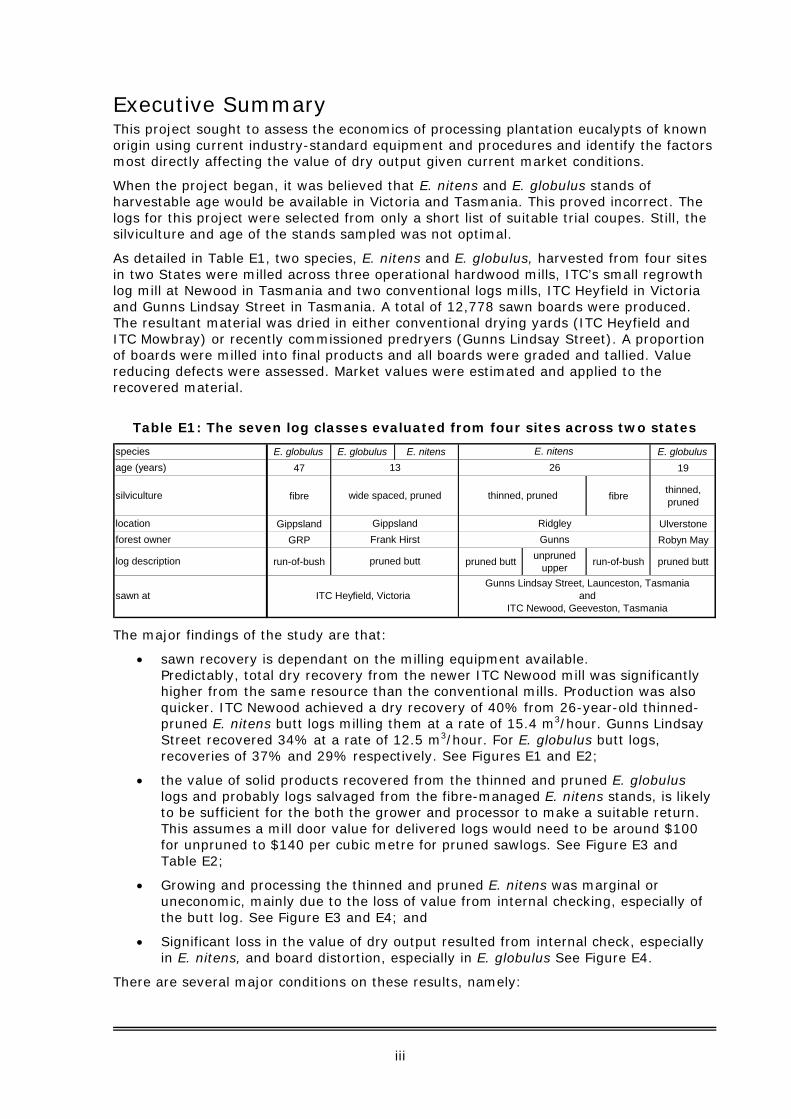
Executive Summary This project sought to assess the economics of processing plantation eucalypts of known origin using current industry-standard equipment and procedures and identify the factors most directly affecting the value of dry output given current market conditions.
When the project began, it was believed that E. nitens and E. globulus stands of harvestable age would be available in Victoria and Tasmania. This proved incorrect. The logs for this project were selected from only a short list of suitable trial coupes. Still, the silviculture and age of the stands sampled was not optimal.
As detailed in Table E1, two species, E. nitens and E. globulus, harvested from four sites in two States were milled across three operational hardwood mills, ITC’s small regrowth log mill at Newood in Tasmania and two conventional logs mills, ITC Heyfield in Victoria and Gunns Lindsay Street in Tasmania. A total of 12,778 sawn boards were produced. The resultant material was dried in either conventional drying yards (ITC Heyfield and ITC Mowbray) or recently commissioned predryers (Gunns Lindsay Street). A proportion of boards were milled into final products and all boards were graded and tallied. Value reducing defects were assessed. Market values were estimated and applied to the recovered material.
Table E1: The seven log classes evaluated from four sites across two states
E. globulus E. globulus E. nitens E. globulus47 19
fibre fibre thinned, pruned
Gippsland UlverstoneGRP Robyn May
run-of-bush pruned butt unpruned upper run-of-bush pruned butt
ITC Heyfield, VictoriaGunns Lindsay Street, Launceston, Tasmania
andITC Newood, Geeveston, Tasmania
pruned butt
sawn at
log description
E. nitens
Frank HirstGippsland
26
RidgleyGunns
thinned, pruned
13
wide spaced, pruned
speciesage (years)
silviculture
locationforest owner
The major findings of the study are that:
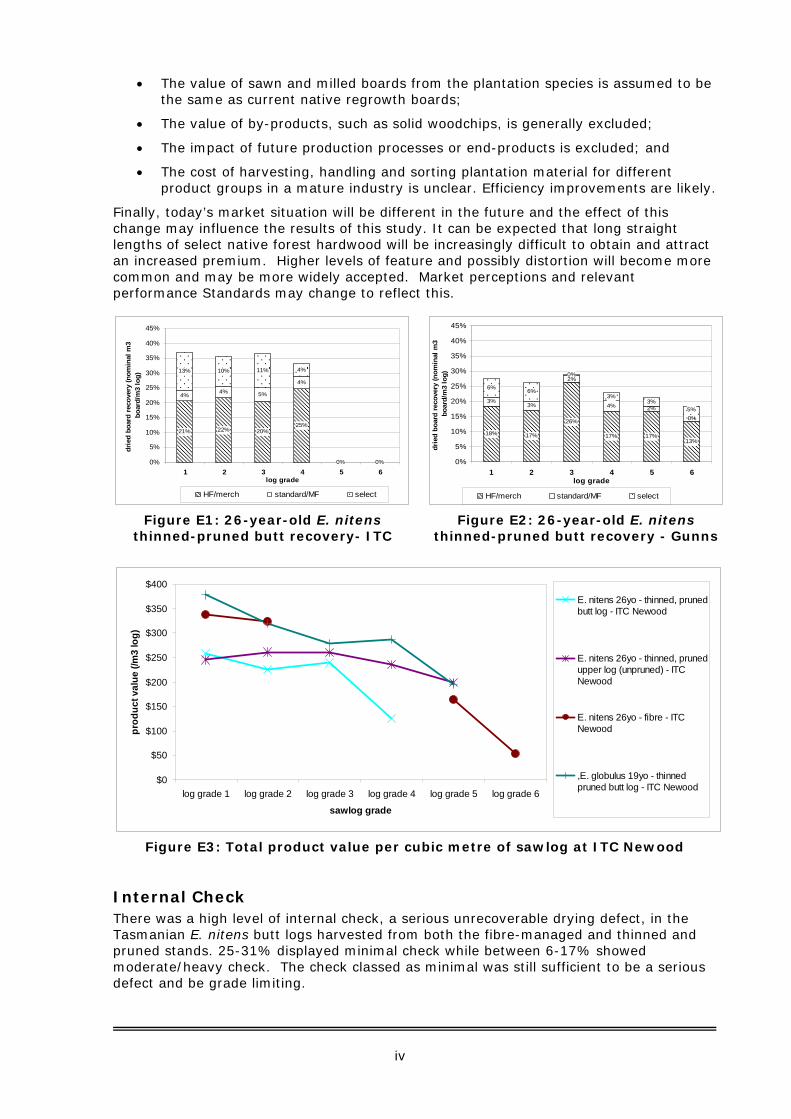
• sawn recovery is dependant on the milling equipment available. Predictably, total dry recovery from the newer ITC Newood mill was significantly higher from the same resource than the conventional mills. Production was also quicker. ITC Newood achieved a dry recovery of 40% from 26-year-old thinned-pruned E. nitens butt logs milling them at a rate of 15.4 m3/hour. Gunns Lindsay Street recovered 34% at a rate of 12.5 m3/hour. For E. globulus butt logs, recoveries of 37% and 29% respectively. See Figures E1 and E2;
• the value of solid products recovered from the thinned and pruned E. globulus logs and probably logs salvaged from the fibre-managed E. nitens stands, is likely to be sufficient for the both the grower and processor to make a suitable return. This assumes a mill door value for delivered logs would need to be around $100 for unpruned to $140 per cubic metre for pruned sawlogs. See Figure E3 and Table E2;
• Growing and processing the thinned and pruned E. nitens was marginal or uneconomic, mainly due to the loss of value from internal checking, especially of the butt log. See Figure E3 and E4; and
• Significant loss in the value of dry output resulted from internal check, especially in E. nitens, and board distortion, especially in E. globulus See Figure E4.
There are several major conditions on these results, namely:
iv
• The value of sawn and milled boards from the plantation species is assumed to be the same as current native regrowth boards;
• The value of by-products, such as solid woodchips, is generally excluded;
• The impact of future production processes or end-products is excluded; and
• The cost of harvesting, handling and sorting plantation material for different product groups in a mature industry is unclear. Efficiency improvements are likely.
Finally, today’s market situation will be different in the future and the effect of this change may influence the results of this study. It can be expected that long straight lengths of select native forest hardwood will be increasingly difficult to obtain and attract an increased premium. Higher levels of feature and possibly distortion will become more common and may be more widely accepted. Market perceptions and relevant performance Standards may change to reflect this.
21% 22% 20%25%
0% 0%
4% 4% 5%
4%
0% 0%
13% 10% 11% 4%
0% 0%0%
5%
10%
15%
20%
25%
30%
35%
40%
45%
1 2 3 4 5 6log grade
drie
d bo
ard
reco
very
(nom
inal
m3
boar
d/m
3 lo
g)
HF/merch standard/MF select
Figure E1: 26-year-old E. nitens thinned-pruned butt recovery- ITC
18% 17%
26%
17% 17%13%
3%3% 4%
6% 6%
0%
3%3%
2%
0%
2% 5%
0%
5%
10%
15%
20%
25%
30%
35%
40%
45%
1 2 3 4 5 6log grade
drie
d bo
ard
reco
very
(nom
inal
m3
boar
d/m
3 lo
g)
HF/merch standard/MF select Figure E2: 26-year-old E. nitens
thinned-pruned butt recovery - Gunns
$0
$50
$100
$150
$200
$250
$300
$350
$400
log grade 1 log grade 2 log grade 3 log grade 4 log grade 5 log grade 6
sawlog grade
prod
uct v
alue
(/m
3 lo
g)
E. nitens 26yo - thinned, prunedbutt log - ITC Newood
E. nitens 26yo - thinned, prunedupper log (unpruned) - ITCNewood
E. nitens 26yo - fibre - ITCNewood
,E. globulus 19yo - thinnedpruned butt log - ITC Newood
Figure E3: Total product value per cubic metre of sawlog at ITC Newood
Internal Check There was a high level of internal check, a serious unrecoverable drying defect, in the Tasmanian E. nitens butt logs harvested from both the fibre-managed and thinned and pruned stands. 25-31% displayed minimal check while between 6-17% showed moderate/heavy check. The check classed as minimal was still sufficient to be a serious defect and be grade limiting.
v
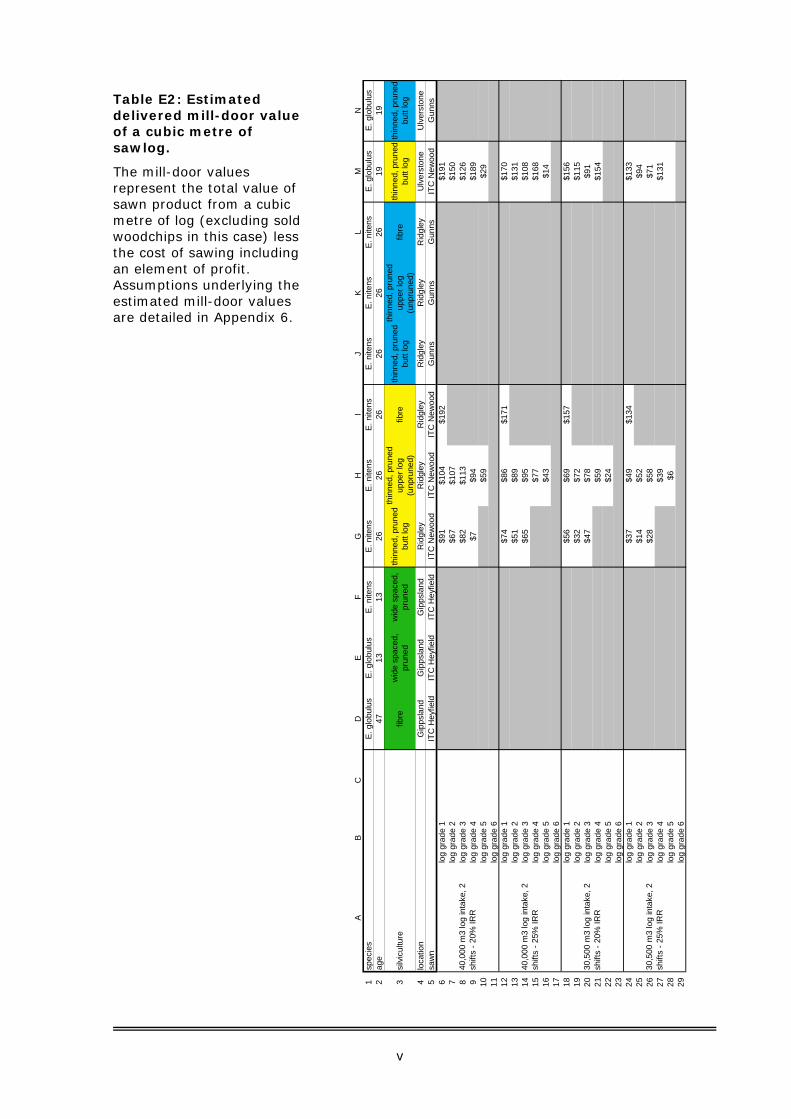
Table E2: Estimated delivered mill-door value of a cubic metre of sawlog.
The mill-door values represent the total value of sawn product from a cubic metre of log (excluding sold woodchips in this case) less the cost of sawing including an element of profit. Assumptions underlying the estimated mill-door values are detailed in Appendix 6.
A
BC
DE
FG
HI
JK
LM
N1
spec
ies
E. g
lobu
lus
E. g
lobu
lus
E. n
itens
E. n
itens
E. n
itens
E. n
itens
E. n
itens
E. n
itens
E. n
itens
E. g
lobu
lus
E. g
lobu
lus
2ag
e47
1313
2626
2626
2626
1919
3si
lvic
ultu
refib
rew
ide
spac
ed,
prun
edw
ide
spac
ed,
prun
edth
inne
d, p
rune
d bu
tt lo
g
thin
ned,
pru
ned
uppe
r log
(u
npru
ned)
fibre
thin
ned,
pru
ned
butt
log
thin
ned,
pru
ned
uppe
r log
(u
npru
ned)
fibre
thin
ned,
pru
ned
butt
log
thin
ned,
pru
ned
butt
log
4lo
catio
nG
ipps
land
Gip
psla
ndG
ipps
land
Rid
gley
Rid
gley
Rid
gley
Rid
gley
Rid
gley
Rid
gley
Ulv
erst
one
Ulv
erst
one
5sa
wn
ITC
Hey
field
ITC
Hey
field
ITC
Hey
field
ITC
New
ood
ITC
New
ood
ITC
New
ood
Gun
nsG
unns
Gun
nsIT
C N
ewoo
dG
unns
6lo
g gr
ade
1$9
1$1
04$1
92$1
917
log
grad
e 2
$67
$107
$150
8lo
g gr
ade
3$8
2$1
13$1
269
log
grad
e 4
$7$9
4$1
8910
log
grad
e 5
$59
$29
11lo
g gr
ade
612
log
grad
e 1
$74
$86
$171
$170
13lo
g gr
ade
2$5
1$8
9$1
3114
log
grad
e 3
$65
$95
$108
15lo
g gr
ade
4$7
7$1
6816
log
grad
e 5
$43
$14
17lo
g gr
ade
618
log
grad
e 1
$56
$69
$157
$156
19lo
g gr
ade
2$3
2$7
2$1
1520
log
grad
e 3
$47
$78
$91
21lo
g gr
ade
4$5
9$1
5422
log
grad
e 5
$24
23lo
g gr
ade
624
log
grad
e 1
$37
$49
$134
$133
25lo
g gr
ade
2$1
4$5
2$9
426
log
grad
e 3
$28
$58
$71
27lo
g gr
ade
4$3
9$1
3128
log
grad
e 5
$629
log
grad
e 6
30,5
00 m
3 lo
g in
take
, 2
shift
s - 2
5% IR
R
40,0
00 m
3 lo
g in
take
, 2
shift
s - 2
0% IR
R
40,0
00 m
3 lo
g in
take
, 2
shift
s - 2
5% IR
R
30,5
00 m
3 lo
g in
take
, 2
shift
s - 2
0% IR
R

vi
The rate of checking was consistent for air-dried and predried material. Internal check in the E. nitens top logs and the E. globulus was significantly less.
The high level of internal check observed is of serious concern as the studied logs were from an expensive silvicultural regime, similar to the regime adopted by major growers managing E. nitens plantations for clearwood log production. The results indicate that between 15 and 40% of boards from similar thinned and pruned full-rotation E. nitens can be expected to contain significant levels of internal check if dried with current industry technology.
The situation could be even worse in full-scale production if 5.4 m logs were milled into long length boards. If the rate of internal check in the E. nitens butt log could be constrained to the rate found in the E. globulus, it is likely that the E. nitens could be processed economically, as higher recoveries of select material could be expected from pruned logs.
0%10%20%30%40%50%60%70%80%90%
100%
no check minimal check moderate check heavy check
Gunns ENIT TP butt - 100mm - all gradesGunns ENIT UTUP - 125mm - all gradesGunns ENIT TUP tops - 125mm - all gradesGunns EGLOB TP butt - 125mm - all gradesITC EGLOB TP butt - all sizes, all gradesITC ENIT TP butt - all sizes, all grades
Figure E4: Levels of internal check by log type.
Board distortion Board distortion affects satisfactory milling into the required profile and the spring or bow in boards. In this study, there was an unexpected high loss in recovery when skim-dressed boards were milled into final products, especially of E. globulus. 12% of sawn volume from the thinned-pruned E. nitens butt logs was rejected and 30% of sawn volume from the thinned-pruned E. globulus butt logs was rejected. The high level of reject was due to formed tongue-and-groove boards having pieces of the tongue or groove missing making the boards unacceptable at any grade under the relevant Australian standard. Quartersawn boards of both species cut at normal full length (5.4 – 6.0 m) can be also expected to incur significant downgrade from spring distortion.
This result casts doubt on assumptions of board and value recovery based on the assessment of skim-dressed material only.
Conclusions The results of the study indicate that future, economically-viable production of high value traditionally sawn products from these types of plantations will require:
• different processing techniques to provide better control over value-limiting factors such as distortion, collapse and internal checking; and
• sawing equipment optimised to handle this resource.

vii
If these technical issues can be overcome, some optimism can be held for the future of an industry based on production of both new and existing sawn products from a suitably managed plantation resource.
Further research is needed to:
• address value-limiting factors of internal check, collapse and distortion while growing the resource and after milling;
• better quantify whole-of-process product values; and
• clarify recovery of sawn appearance material from full rotation, high stand density unpruned E. nitens and E. globulus.
Research that involves processing a plantation resource through facilities clearly unable to optimally handle or process the raw material is unlikely to yield encouraging results.
1
1.0 Introduction Eucalypt plantation forestry in southern Australia has developed rapidly in recent years. Much of the existing resource comprises E. globulus (mainly in Western Australia and Victoria) and E. nitens (mainly in Tasmania). While most of this resource is managed primarily to provide fibre logs for the pulp and paper industry, there is potential for these and future plantations to provide logs for sawn timber production, potentially supplementing or ultimately replacing supplies from native forests. Recent published trials using both pruned and unpruned sawlogs in conventional hardwood mills have produced encouraging results (Washusen and McCormick 2002, Washusen et al. 2004, Washusen 2006), although doubts still exist as to the processing behaviour of the wider plantation resource. There is little economic data available to verify if plantation-grown resources can be processed profitably using the existing sawing and wood drying systems available to native forest sawmillers, while still providing a viable return to growers. This information is needed to improve the decision-making capacity of forest managers and the existing hardwood industry about utilization of young plantation-grown eucalypts.
The trials described in this report were a first step in determining the economics of processing plantation-grown eucalypts in existing hardwood mills. The trees selected for this study were selected from a limited available range of sawlog-managed plantations, plus a control unthinned and unpruned pulp-managed stand.
In summary:
• Four plantation sites were sampled across two states, Tasmania and Victoria;
o Gippsland, Victoria (2 sites)
o Ulverstone, Tasmania
o Ridgley, Tasmania
• The sampled stands represented three distinct silvicultural management regimes;
o Fibre management (no thinning or pruning)
o High establishment stocking thinned to 200 sph and pruned
o Open spaced at establishment (100 sph) and pruned
• Two species were sampled;
o Eucalyptus globulus
o Eucalyptus nitens
• Three age classes were represented;
o 13 years
o 18-26 years
o 47 years
• A total of 696 short (2.7m) sawlogs were sawn across three sawmills;
o ITC Heyfield, Victoria
o Gunns Lindsay Street, Launceston, Tasmania
o ITC Newood, Geeveston, Tasmania
• A total of 12,778 sawn boards were produced and dried using conventional air drying at ITC Heyfield, Victoria, and ITC Mowbray (for the Newood sawn material) and in recently commissioned predryers at Gunns Lindsay Street.
2
2.0 Methodology and materials
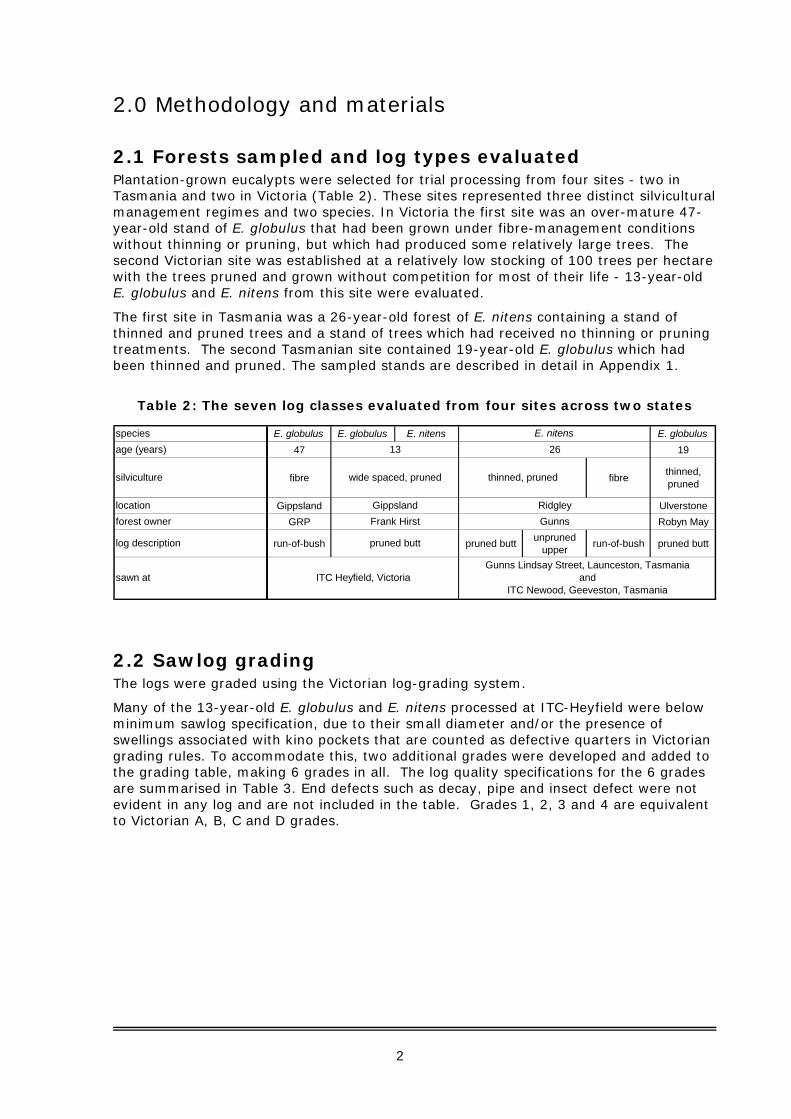
2.1 Forests sampled and log types evaluated Plantation-grown eucalypts were selected for trial processing from four sites - two in Tasmania and two in Victoria (Table 2). These sites represented three distinct silvicultural management regimes and two species. In Victoria the first site was an over-mature 47-year-old stand of E. globulus that had been grown under fibre-management conditions without thinning or pruning, but which had produced some relatively large trees. The second Victorian site was established at a relatively low stocking of 100 trees per hectare with the trees pruned and grown without competition for most of their life - 13-year-old E. globulus and E. nitens from this site were evaluated.
The first site in Tasmania was a 26-year-old forest of E. nitens containing a stand of thinned and pruned trees and a stand of trees which had received no thinning or pruning treatments. The second Tasmanian site contained 19-year-old E. globulus which had been thinned and pruned. The sampled stands are described in detail in Appendix 1.
Table 2: The seven log classes evaluated from four sites across two states
E. globulus E. globulus E. nitens E. globulus47 19
fibre fibre thinned, pruned
Gippsland UlverstoneGRP Robyn May
run-of-bush pruned butt unpruned upper run-of-bush pruned butt
ITC Heyfield, VictoriaGunns Lindsay Street, Launceston, Tasmania
andITC Newood, Geeveston, Tasmania
pruned butt
sawn at
log description
E. nitens
Frank HirstGippsland
26
RidgleyGunns
thinned, pruned
13
wide spaced, pruned
speciesage (years)
silviculture
locationforest owner
2.2 Sawlog grading The logs were graded using the Victorian log-grading system.
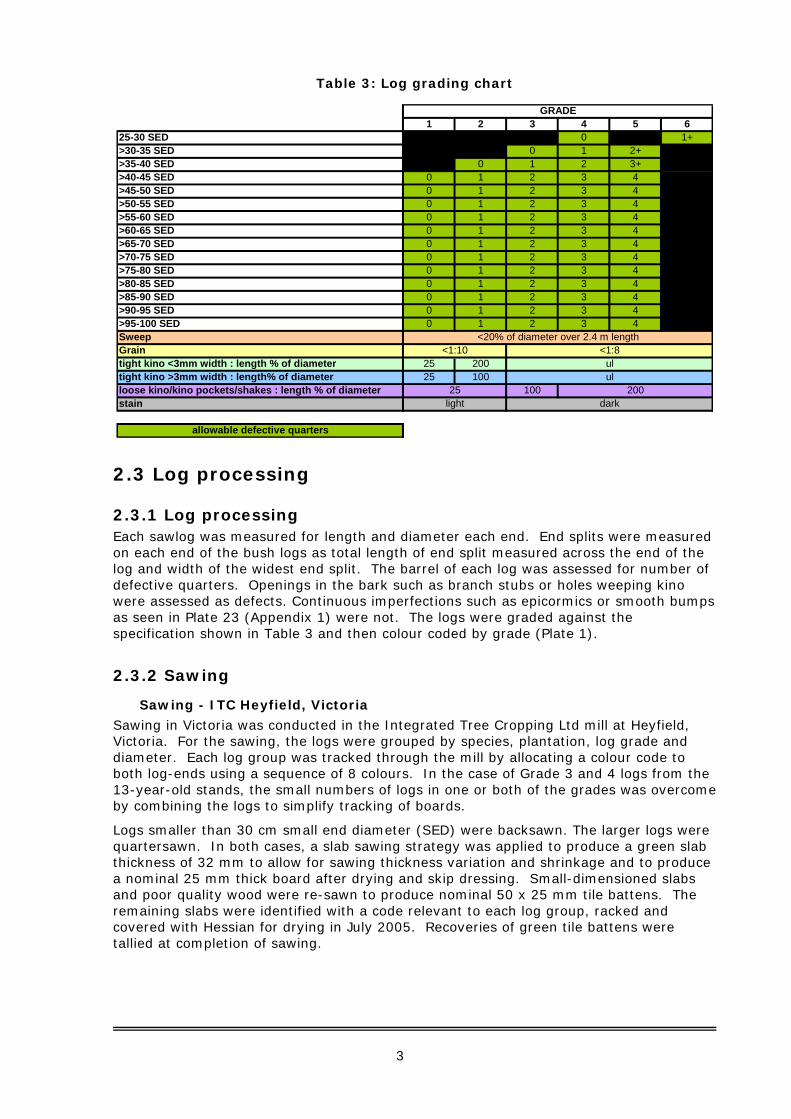
Many of the 13-year-old E. globulus and E. nitens processed at ITC-Heyfield were below minimum sawlog specification, due to their small diameter and/or the presence of swellings associated with kino pockets that are counted as defective quarters in Victorian grading rules. To accommodate this, two additional grades were developed and added to the grading table, making 6 grades in all. The log quality specifications for the 6 grades are summarised in Table 3. End defects such as decay, pipe and insect defect were not evident in any log and are not included in the table. Grades 1, 2, 3 and 4 are equivalent to Victorian A, B, C and D grades.
3
Table 3: Log grading chart
1 2 3 4 5 625-30 SED 0 1+>30-35 SED 0 1 2+>35-40 SED 0 1 2 3+>40-45 SED 0 1 2 3 4>45-50 SED 0 1 2 3 4>50-55 SED 0 1 2 3 4>55-60 SED 0 1 2 3 4>60-65 SED 0 1 2 3 4>65-70 SED 0 1 2 3 4>70-75 SED 0 1 2 3 4>75-80 SED 0 1 2 3 4>80-85 SED 0 1 2 3 4>85-90 SED 0 1 2 3 4>90-95 SED 0 1 2 3 4>95-100 SED 0 1 2 3 4SweepGraintight kino <3mm width : length % of diameter 25 200tight kino >3mm width : length% of diameter 25 100loose kino/kino pockets/shakes : length % of diameter 100stain
allowable defective quarters
GRADE
<20% of diameter over 2.4 m length<1:8
ul<1:10
ul200
dark25
light
2.3 Log processing
2.3.1 Log processing Each sawlog was measured for length and diameter each end. End splits were measured on each end of the bush logs as total length of end split measured across the end of the log and width of the widest end split. The barrel of each log was assessed for number of defective quarters. Openings in the bark such as branch stubs or holes weeping kino were assessed as defects. Continuous imperfections such as epicormics or smooth bumps as seen in Plate 23 (Appendix 1) were not. The logs were graded against the specification shown in Table 3 and then colour coded by grade (Plate 1).
2.3.2 Sawing
Sawing - ITC Heyfield, Victoria
Sawing in Victoria was conducted in the Integrated Tree Cropping Ltd mill at Heyfield, Victoria. For the sawing, the logs were grouped by species, plantation, log grade and diameter. Each log group was tracked through the mill by allocating a colour code to both log-ends using a sequence of 8 colours. In the case of Grade 3 and 4 logs from the 13-year-old stands, the small numbers of logs in one or both of the grades was overcome by combining the logs to simplify tracking of boards.
Logs smaller than 30 cm small end diameter (SED) were backsawn. The larger logs were quartersawn. In both cases, a slab sawing strategy was applied to produce a green slab thickness of 32 mm to allow for sawing thickness variation and shrinkage and to produce a nominal 25 mm thick board after drying and skip dressing. Small-dimensioned slabs and poor quality wood were re-sawn to produce nominal 50 x 25 mm tile battens. The remaining slabs were identified with a code relevant to each log group, racked and covered with Hessian for drying in July 2005. Recoveries of green tile battens were tallied at completion of sawing.

4
Sawing - ITC Newood
The E. nitens logs from Ridgley were sawn at ITC Newood on 4th November 2005, and the E. globulus logs from Ulverstone were sawn on 7th December.
The breaking down saw was a single bandsaw followed by two twin bandsaw resaws and an optimising multi-rip edger. Saw kerf was 3 mm. Logs smaller than approximately 40 cm SED were cut in half on the headrig, with each roundback then boarded off by multiple passes through one of two resaws (Figure 1). Logs greater than about 40 cm SED but less than approximately 45 cm SED were sawn to the pattern shown in Figure 2, while larger logs were sawn to the pattern shown in Figure 3. All boards then passed through the optimiser. All boards were cut to 25 mm nominal dry thickness. Boards were block-stacked, tallied and then transported to ITC’s Mowbray (Launceston) mill by covered truck.
Boards were cut to six width sizes at the discretion of the sawmill: 200, 150, 125, 100, 75 and 50 mm nominal dry width.
Figure 1: ITC cutting pattern for logs less than approximately 40 cm SED.
Cut 1 on headrig, cuts 2-8 on twin resaw (both roundbacks separately). All boards then edged.
Figure 2: ITC sawing pattern for logs greater than 40 cm SED and less than
approximately 45 cm SED. Cuts 1-8 on headrig, four flitches resawn as shown. Boards from cuts 9-11 on flitches “A” then edged.
A 9
B
11 13 13 9 11
1
2
3
4
5
6
7
8 Chip A
B
10 12
9
10 12
9
10 10
11
Flitch “A” resaw Flitch “B” resaw
1
2
4 6
2
3
4
5
6
7 7 3 5
8

5
Figure 3: ITC sawing pattern for logs greater than approximately 45 cm SED. Cuts 1-7 on headrig, four flitches resawn as shown. Boards from cuts 8-10 on
flitches “A” and “B” then edged.
The multi-rip edger was unable to keep up with the head-rig and re-saws; its throughput governed the mill’s throughput. Unpruned E. nitens top logs were sawn in 2 hours and 40 minutes (2:40) (14.0 m3/hour), pruned E. nitens butt logs in 1:40 (15.4 m3/hour) and unthinned/unpruned E. nitens logs in 0:40 (11.1 m3/hour). The mill was substantially slower than when processing its normal stock of regrowth native forest logs (approximately 26 m3/hour). This is due to the smaller size of logs, and also because a higher proportion of the boards from smaller logs need to be edged, as there is a lower proportion of squared flitch produced by the head-rig.
Plate 1: Colour coding logs ITC
Newood.
Plate 2: Twin-saw re-saw at ITC
Newood.
Sawing - Gunns Lindsay Street The E. nitens logs from Ridgley were sawn at Gunns on 21st and 24th October, and the E. globulus logs from Ulverstone were sawn on 1st December. Logs were stored under water spray until sawn.
The breaking-down saw was a single bandsaw pony carriage, followed by two single band resaws on a roundabout, and then two edgers. Sawing kerf on the breakdown and resaws was 5.5 mm. Small logs (less than 30 cm SED) were sawn through-and-through
8 10 12 12 8 10
9 11 9 11
Flitch “A” resaw
8 10 8 10
9 9 11
Flitch “B” resaw
B
B
A Chip
C
Flitch “C” resaw
8
9 9
8 10
1
2
3
4
5
6
7
6
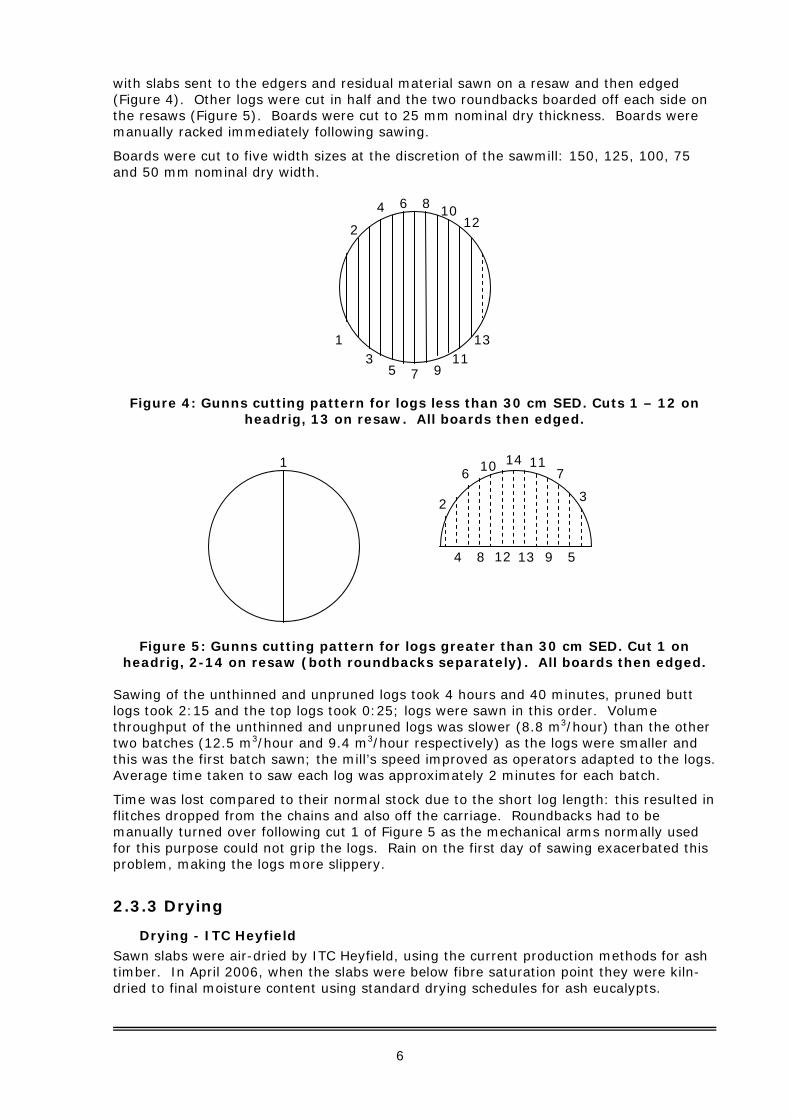
with slabs sent to the edgers and residual material sawn on a resaw and then edged (Figure 4). Other logs were cut in half and the two roundbacks boarded off each side on the resaws (Figure 5). Boards were cut to 25 mm nominal dry thickness. Boards were manually racked immediately following sawing.
Boards were cut to five width sizes at the discretion of the sawmill: 150, 125, 100, 75 and 50 mm nominal dry width.
Figure 4: Gunns cutting pattern for logs less than 30 cm SED. Cuts 1 – 12 on
headrig, 13 on resaw. All boards then edged.
Figure 5: Gunns cutting pattern for logs greater than 30 cm SED. Cut 1 on
headrig, 2-14 on resaw (both roundbacks separately). All boards then edged.
Sawing of the unthinned and unpruned logs took 4 hours and 40 minutes, pruned butt logs took 2:15 and the top logs took 0:25; logs were sawn in this order. Volume throughput of the unthinned and unpruned logs was slower (8.8 m3/hour) than the other two batches (12.5 m3/hour and 9.4 m3/hour respectively) as the logs were smaller and this was the first batch sawn; the mill’s speed improved as operators adapted to the logs. Average time taken to saw each log was approximately 2 minutes for each batch.
Time was lost compared to their normal stock due to the short log length: this resulted in flitches dropped from the chains and also off the carriage. Roundbacks had to be manually turned over following cut 1 of Figure 5 as the mechanical arms normally used for this purpose could not grip the logs. Rain on the first day of sawing exacerbated this problem, making the logs more slippery.
2.3.3 Drying
Drying - ITC Heyfield
Sawn slabs were air-dried by ITC Heyfield, using the current production methods for ash timber. In April 2006, when the slabs were below fibre saturation point they were kiln-dried to final moisture content using standard drying schedules for ash eucalypts.
1 3
4
5
6
7
8
9
10
11
12
13
2
1
2
7 10
3
4
6
8
11
13 12 5 9
14
7
Drying - Gunns Lindsay Street
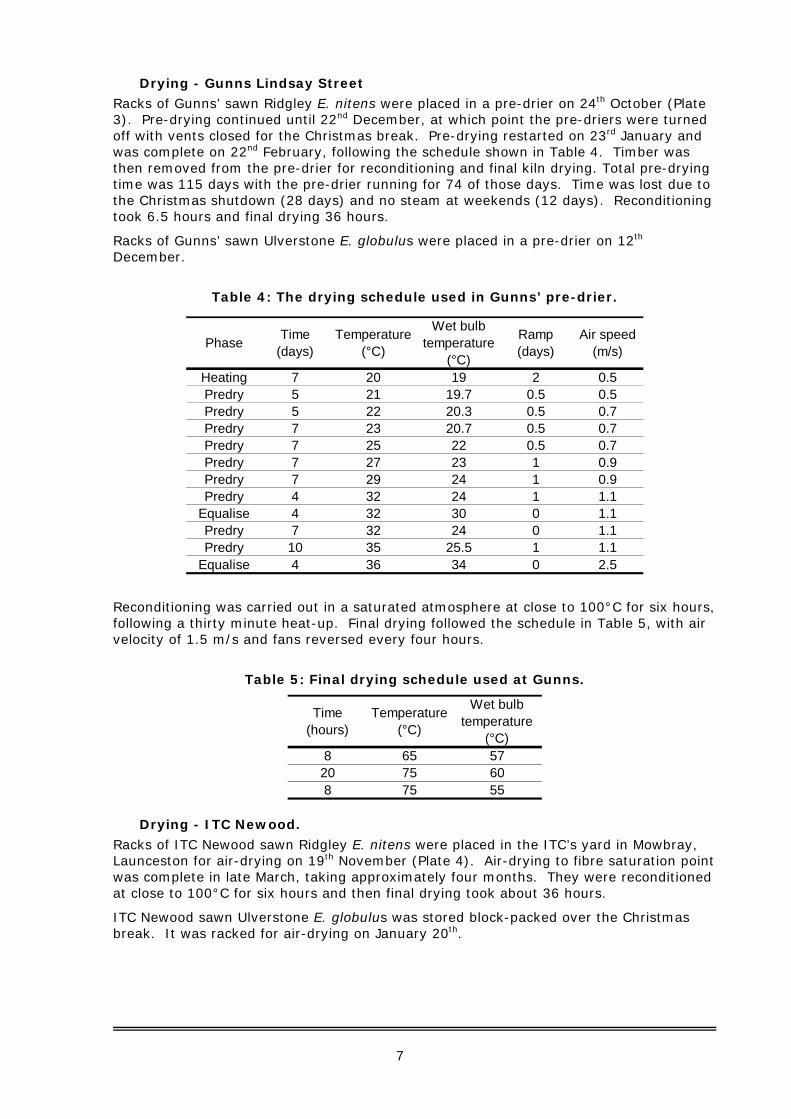
Racks of Gunns’ sawn Ridgley E. nitens were placed in a pre-drier on 24th October (Plate 3). Pre-drying continued until 22nd December, at which point the pre-driers were turned off with vents closed for the Christmas break. Pre-drying restarted on 23rd January and was complete on 22nd February, following the schedule shown in Table 4. Timber was then removed from the pre-drier for reconditioning and final kiln drying. Total pre-drying time was 115 days with the pre-drier running for 74 of those days. Time was lost due to the Christmas shutdown (28 days) and no steam at weekends (12 days). Reconditioning took 6.5 hours and final drying 36 hours.
Racks of Gunns’ sawn Ulverstone E. globulus were placed in a pre-drier on 12th December.
Table 4: The drying schedule used in Gunns’ pre-drier.
Phase Time(days)
Temperature(°C)
Wet bulb temperature
(°C)
Ramp(days)
Air speed(m/s)
Heating 7 20 19 2 0.5Predry 5 21 19.7 0.5 0.5Predry 5 22 20.3 0.5 0.7Predry 7 23 20.7 0.5 0.7Predry 7 25 22 0.5 0.7Predry 7 27 23 1 0.9Predry 7 29 24 1 0.9Predry 4 32 24 1 1.1
Equalise 4 32 30 0 1.1Predry 7 32 24 0 1.1Predry 10 35 25.5 1 1.1
Equalise 4 36 34 0 2.5
Reconditioning was carried out in a saturated atmosphere at close to 100°C for six hours, following a thirty minute heat-up. Final drying followed the schedule in Table 5, with air velocity of 1.5 m/s and fans reversed every four hours.
Table 5: Final drying schedule used at Gunns.
Time(hours)
Temperature(°C)
Wet bulb temperature
(°C)8 65 57
20 75 608 75 55
Drying - ITC Newood.
Racks of ITC Newood sawn Ridgley E. nitens were placed in the ITC’s yard in Mowbray, Launceston for air-drying on 19th November (Plate 4). Air-drying to fibre saturation point was complete in late March, taking approximately four months. They were reconditioned at close to 100°C for six hours and then final drying took about 36 hours.
ITC Newood sawn Ulverstone E. globulus was stored block-packed over the Christmas break. It was racked for air-drying on January 20th.
8
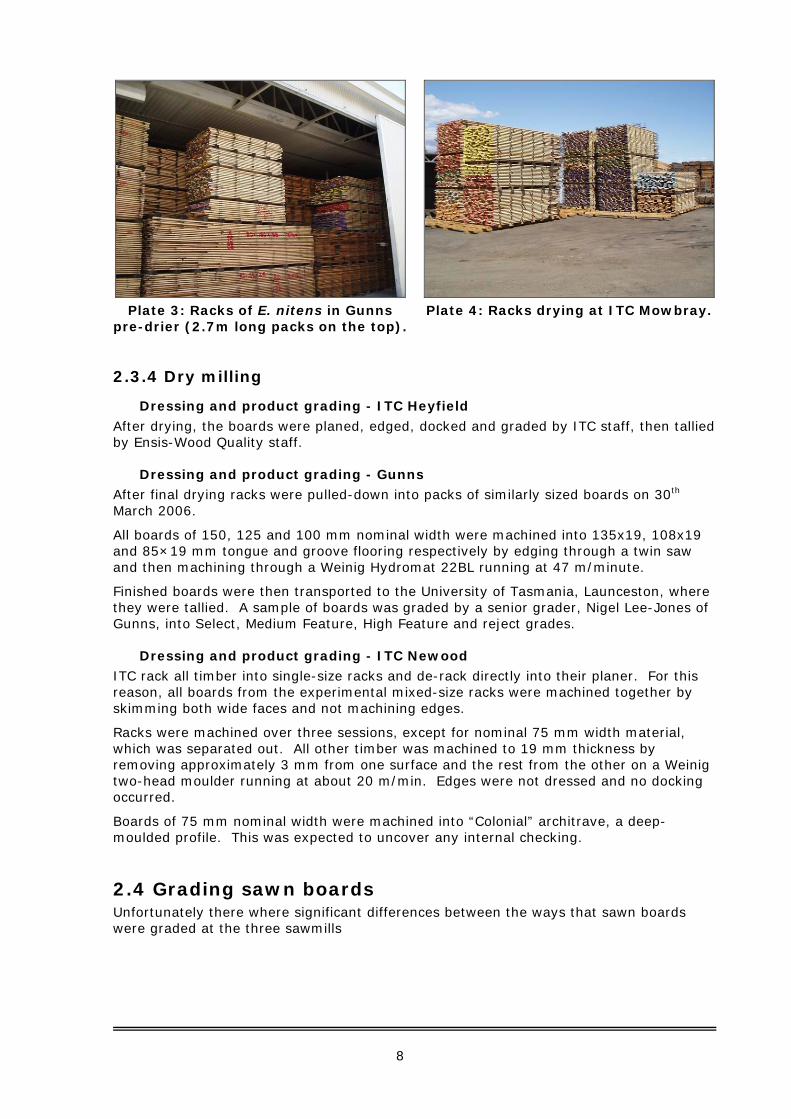
Plate 3: Racks of E. nitens in Gunns
pre-drier (2.7m long packs on the top).
Plate 4: Racks drying at ITC Mowbray.
2.3.4 Dry milling
Dressing and product grading - ITC Heyfield
After drying, the boards were planed, edged, docked and graded by ITC staff, then tallied by Ensis-Wood Quality staff.
Dressing and product grading - Gunns After final drying racks were pulled-down into packs of similarly sized boards on 30th March 2006.
All boards of 150, 125 and 100 mm nominal width were machined into 135x19, 108x19 and 85×19 mm tongue and groove flooring respectively by edging through a twin saw and then machining through a Weinig Hydromat 22BL running at 47 m/minute.
Finished boards were then transported to the University of Tasmania, Launceston, where they were tallied. A sample of boards was graded by a senior grader, Nigel Lee-Jones of Gunns, into Select, Medium Feature, High Feature and reject grades.
Dressing and product grading - ITC Newood ITC rack all timber into single-size racks and de-rack directly into their planer. For this reason, all boards from the experimental mixed-size racks were machined together by skimming both wide faces and not machining edges.
Racks were machined over three sessions, except for nominal 75 mm width material, which was separated out. All other timber was machined to 19 mm thickness by removing approximately 3 mm from one surface and the rest from the other on a Weinig two-head moulder running at about 20 m/min. Edges were not dressed and no docking occurred.
Boards of 75 mm nominal width were machined into “Colonial” architrave, a deep-moulded profile. This was expected to uncover any internal checking.
2.4 Grading sawn boards Unfortunately there where significant differences between the ways that sawn boards were graded at the three sawmills

9
2.4.1 Grading - ITC Heyfield At ITC Heyfield, boards were graded by ITC staff according to the appearance grading criteria specified in Appendix 2 into Select, Medium Feature (standard), and High Feature (utility) grades.
2.4.2 Grading - ITC Newood Timber was graded on the best face only into two grades by ITC personnel Select and sub-Select - according to ITC company grading rules which use Australian Standard 2796 (Standards Australia 1999) as a minimum. All boards where graded. Up to 500 mm length of each board was disregarded for the purposes of grading if it was affected by end-splits or other grade limiting defect. Similarly, defect near the edges of boards that didn’t affect the board’s nominal width were disregarded.
A sample of boards graded as Select and Sub-Select were regraded by Nigel Lee-Jones to estimate the fraction of each that could be graded into the three grades: Select, Medium Feature (standard), and High Feature (utility). The fractions were then applied to the ITC grade recoveries to estimate overall product grade recoveries in the three grades. There was no reject grade.
2.4.3 Grading - Gunns Lindsay Street Only a sample of boards was graded. Grading was undertaken by Nigel Lee-Jones of Gunns. Boards were graded into Select, Medium Feature (standard), High Feature (utility) and reject grades.
Minimum allowable board length was 1.8 metres and grading assumed boards could be docked to waste to achieve a higher grade providing that the remaining board length was greater than 1.8 metres.
2.5 Calculations Board volume by board-width was estimated after:
000,000,000,1thicknessardsnumberofbolengthwidthvol ×××
=
where: width is nominal board width in mm (200, 150, 125, 100, 75 or 50); length is the average log length of sawn logs; numberofboards is the tallied number of boards by log grade; thickness is the nominal dry board thickness (Gunns: 25 mm for 28mm green boards and 35mm for 38mm green boards); and 1,000,000,000 is to convert cubic mm to cubic metres.
Total board volume by board grade and log grade was calculated as the sum of all board volumes by board-width:
5075100125150200 volvolvolvolvolvolvoltotal +++++=
Total recovery (by grade: Select and High-feature) by log was estimated as the total board volume:
total
total
logvolvol
recovery =
where logvoltotal is the estimated total log volume by log grade, where individual log volumes (logvol) where estimated after:
10
000,1200020002
22 lLEDSEDlogvol ⎟⎟⎠
⎞⎜⎜⎝
⎛⎟⎠⎞
⎜⎝⎛+⎟
⎠⎞
⎜⎝⎛=
π
where SED and LED are sawlog small-end and large-end diameters under-bark respectively (in mm) and l is sawlog length in mm.
Total product value per cubic metre of sawlog (value) was estimated by log grade after:
( )total
gradesizegradesize
logvolvaluevol
value ∑ −−=
where volsize-grade is the total sawn-board volume by board-width and board-grade and valuesize-grade is the per-cubic-metre value of sawn product by board width and grade (Table 6).
Total product value per cubic metre of sawlog by log grade with allowance for observed levels of length lost due to board end-split and internal check was estimated by assuming that the observed fraction of Select and Medium-feature sawn-boards with moderate or heavy internal check were downgraded to high-feature and that one third of observed fraction of Select and Medium-feature sawn-boards with minimal internal check were down-graded to high-feature. Total value was then recalculated with allowance for length lost due to end-split as described above.
All value calculations were based upon nominal dry dimensions, that is, 25mm board thickness.
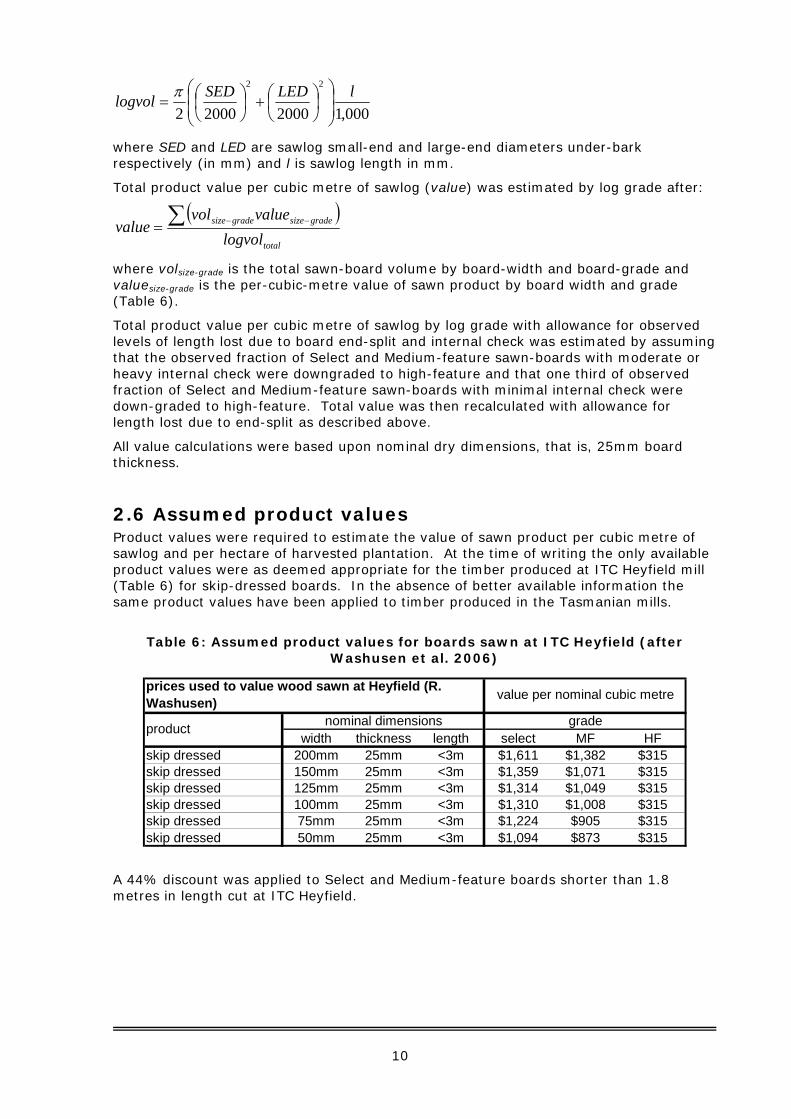
2.6 Assumed product values Product values were required to estimate the value of sawn product per cubic metre of sawlog and per hectare of harvested plantation. At the time of writing the only available product values were as deemed appropriate for the timber produced at ITC Heyfield mill (Table 6) for skip-dressed boards. In the absence of better available information the same product values have been applied to timber produced in the Tasmanian mills.
Table 6: Assumed product values for boards sawn at ITC Heyfield (after Washusen et al. 2006)
width thickness length select MF HFskip dressed 200mm 25mm <3m $1,611 $1,382 $315skip dressed 150mm 25mm <3m $1,359 $1,071 $315skip dressed 125mm 25mm <3m $1,314 $1,049 $315skip dressed 100mm 25mm <3m $1,310 $1,008 $315skip dressed 75mm 25mm <3m $1,224 $905 $315skip dressed 50mm 25mm <3m $1,094 $873 $315
gradenominal dimensions
value per nominal cubic metreprices used to value wood sawn at Heyfield (R. Washusen)
product
A 44% discount was applied to Select and Medium-feature boards shorter than 1.8 metres in length cut at ITC Heyfield.
11
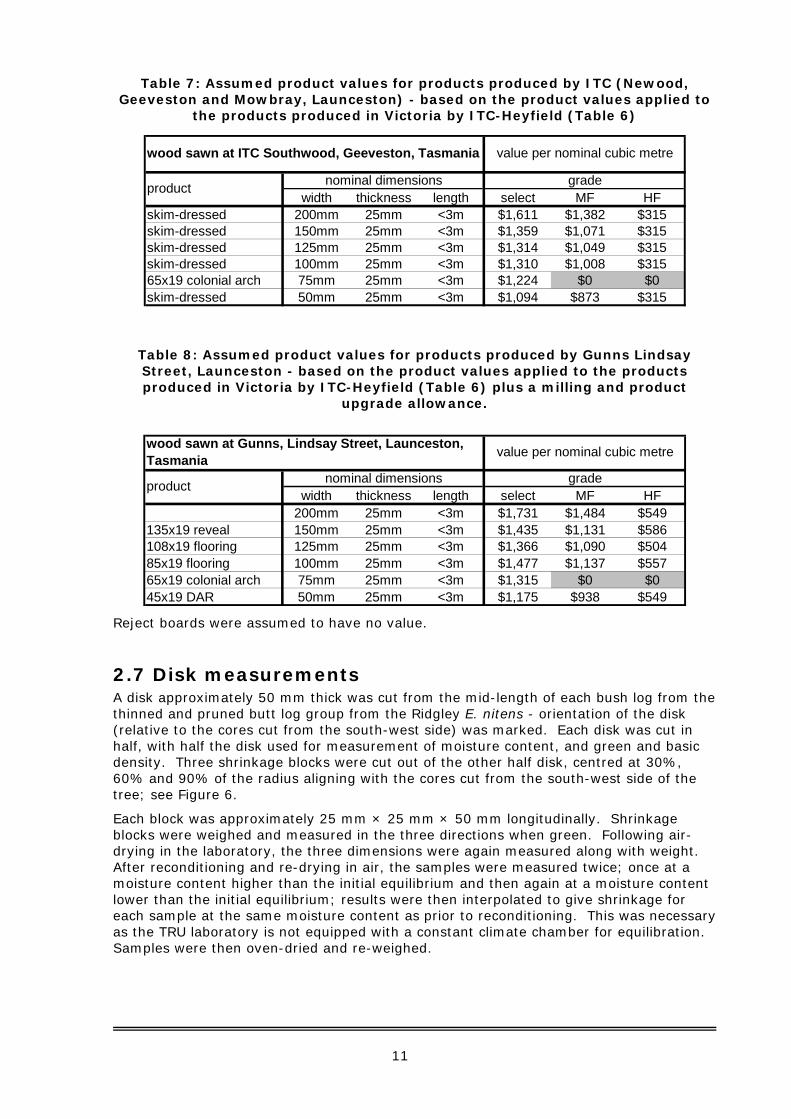
Table 7: Assumed product values for products produced by ITC (Newood, Geeveston and Mowbray, Launceston) - based on the product values applied to
the products produced in Victoria by ITC-Heyfield (Table 6)
width thickness length select MF HFskim-dressed 200mm 25mm <3m $1,611 $1,382 $315skim-dressed 150mm 25mm <3m $1,359 $1,071 $315skim-dressed 125mm 25mm <3m $1,314 $1,049 $315skim-dressed 100mm 25mm <3m $1,310 $1,008 $31565x19 colonial arch 75mm 25mm <3m $1,224 $0 $0skim-dressed 50mm 25mm <3m $1,094 $873 $315
nominal dimensions grade
wood sawn at ITC Southwood, Geeveston, Tasmania value per nominal cubic metre
product
Table 8: Assumed product values for products produced by Gunns Lindsay Street, Launceston - based on the product values applied to the products produced in Victoria by ITC-Heyfield (Table 6) plus a milling and product
upgrade allowance.
width thickness length select MF HF200mm 25mm <3m $1,731 $1,484 $549
135x19 reveal 150mm 25mm <3m $1,435 $1,131 $586108x19 flooring 125mm 25mm <3m $1,366 $1,090 $50485x19 flooring 100mm 25mm <3m $1,477 $1,137 $55765x19 colonial arch 75mm 25mm <3m $1,315 $0 $045x19 DAR 50mm 25mm <3m $1,175 $938 $549
product
wood sawn at Gunns, Lindsay Street, Launceston, Tasmania value per nominal cubic metre
nominal dimensions grade
Reject boards were assumed to have no value.
2.7 Disk measurements A disk approximately 50 mm thick was cut from the mid-length of each bush log from the thinned and pruned butt log group from the Ridgley E. nitens - orientation of the disk (relative to the cores cut from the south-west side) was marked. Each disk was cut in half, with half the disk used for measurement of moisture content, and green and basic density. Three shrinkage blocks were cut out of the other half disk, centred at 30%, 60% and 90% of the radius aligning with the cores cut from the south-west side of the tree; see Figure 6.
Each block was approximately 25 mm × 25 mm × 50 mm longitudinally. Shrinkage blocks were weighed and measured in the three directions when green. Following air-drying in the laboratory, the three dimensions were again measured along with weight. After reconditioning and re-drying in air, the samples were measured twice; once at a moisture content higher than the initial equilibrium and then again at a moisture content lower than the initial equilibrium; results were then interpolated to give shrinkage for each sample at the same moisture content as prior to reconditioning. This was necessary as the TRU laboratory is not equipped with a constant climate chamber for equilibration. Samples were then oven-dried and re-weighed.

12
Figure 6: Disk processing.
Shrinkage blocks at 30%, 60% and 90% of radius
South-west side
Half-disc for density and moisture content measurement
13
3.0 Results
3.1 About forests
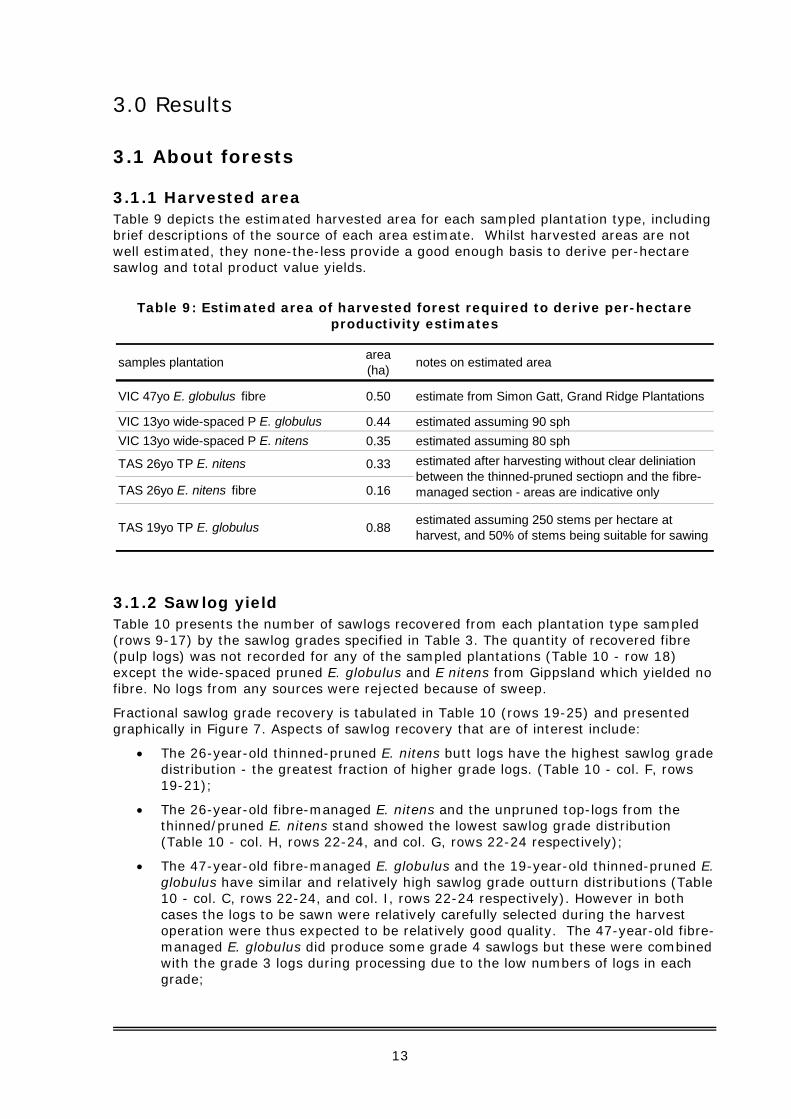
3.1.1 Harvested area Table 9 depicts the estimated harvested area for each sampled plantation type, including brief descriptions of the source of each area estimate. Whilst harvested areas are not well estimated, they none-the-less provide a good enough basis to derive per-hectare sawlog and total product value yields.
Table 9: Estimated area of harvested forest required to derive per-hectare productivity estimates
samples plantation area(ha) notes on estimated area
VIC 47yo E. globulus fibre 0.50 estimate from Simon Gatt, Grand Ridge Plantations
VIC 13yo wide-spaced P E. globulus 0.44 estimated assuming 90 sphVIC 13yo wide-spaced P E. nitens 0.35 estimated assuming 80 sph
TAS 26yo TP E. nitens 0.33
TAS 26yo E. nitens fibre 0.16
TAS 19yo TP E. globulus 0.88 estimated assuming 250 stems per hectare at harvest, and 50% of stems being suitable for sawing
estimated after harvesting without clear deliniation between the thinned-pruned sectiopn and the fibre-managed section - areas are indicative only
3.1.2 Sawlog yield Table 10 presents the number of sawlogs recovered from each plantation type sampled (rows 9-17) by the sawlog grades specified in Table 3. The quantity of recovered fibre (pulp logs) was not recorded for any of the sampled plantations (Table 10 - row 18) except the wide-spaced pruned E. globulus and E nitens from Gippsland which yielded no fibre. No logs from any sources were rejected because of sweep.
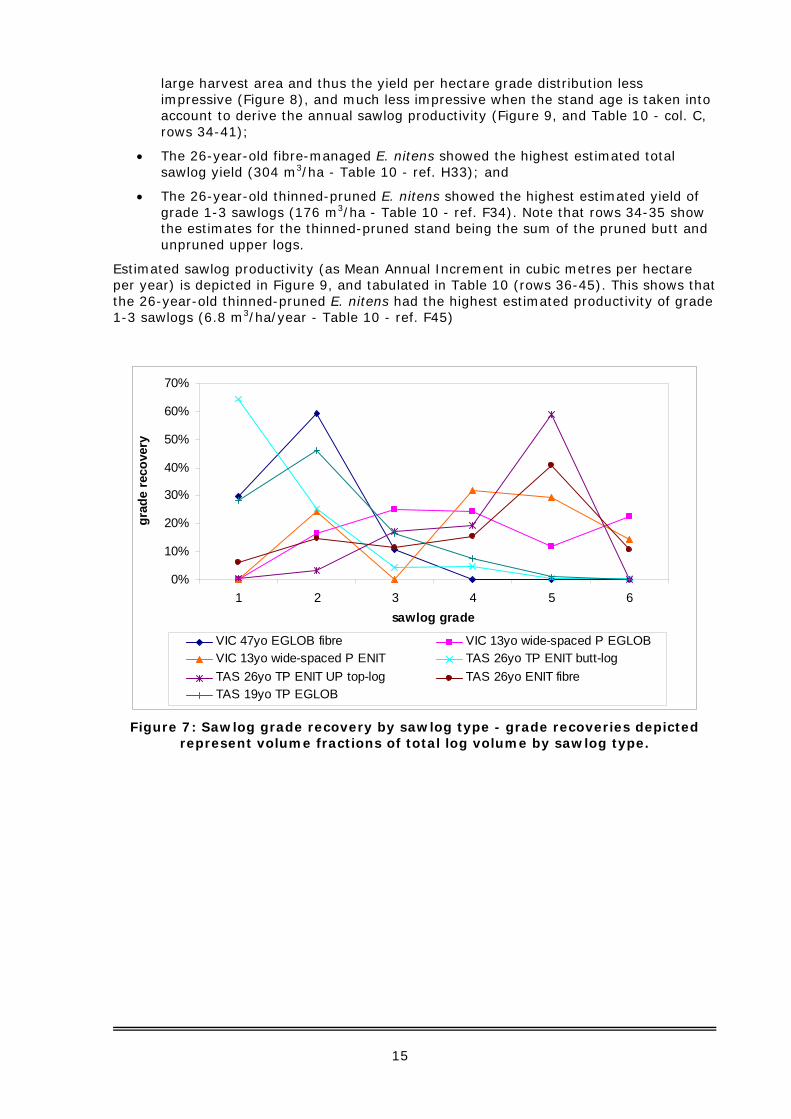
Fractional sawlog grade recovery is tabulated in Table 10 (rows 19-25) and presented graphically in Figure 7. Aspects of sawlog recovery that are of interest include:
• The 26-year-old thinned-pruned E. nitens butt logs have the highest sawlog grade distribution - the greatest fraction of higher grade logs. (Table 10 - col. F, rows 19-21);
• The 26-year-old fibre-managed E. nitens and the unpruned top-logs from the thinned/pruned E. nitens stand showed the lowest sawlog grade distribution (Table 10 - col. H, rows 22-24, and col. G, rows 22-24 respectively);
• The 47-year-old fibre-managed E. globulus and the 19-year-old thinned-pruned E. globulus have similar and relatively high sawlog grade outturn distributions (Table 10 - col. C, rows 22-24, and col. I, rows 22-24 respectively). However in both cases the logs to be sawn were relatively carefully selected during the harvest operation were thus expected to be relatively good quality. The 47-year-old fibre-managed E. globulus did produce some grade 4 sawlogs but these were combined with the grade 3 logs during processing due to the low numbers of logs in each grade;

14
• The 13-year-old wide-spaced E. globulus and E. nitens both showed moderate sawlog grade distributions (Table 10 - col. D-E, rows 22-24) with no grade 1 sawlogs. The trees were relatively young and too small for grade 1. The E. nitens did produce some grade 3 sawlogs but these were combined with the grade 4 logs during processing due to the low numbers of logs in each grade.
Table 10: Summary of stands sampled - by sawlog grade: volume of sawlogs; fractional sawlog grade recovery; estimated sawlog yield per hectare at
harvest; and estimated sawlog productivity (as Mean Annual Increment in cubic metres per hectare per year).
REF A B C D E F G H I1 E. globulus E. globulus E. nitens E. globulus2 47 19
3 fibre fibre thinned, pruned
4 Gippsland Ulverstone5 GRP Robyn May
6 run-of-bush pruned butt unpruned upper run-of-bush pruned butt
7
8 harvest area (ha) 0.50 0.44 0.35 0.33 0.33 0.16 0.889 number of logs 58 80 56 124 110 158 110
10 grade 1 8.3 0 0 33.9 0.3 3.1 14.211 grade 2 16.4 4.2 4.8 13.4 1.5 7.2 22.912 grade 3 3 6.4 0 2.3 7.1 5.6 8.413 grade 4 0 6.2 6.3 2.5 8.0 7.5 3.814 grade 5 0 3 5.8 0.3 24.2 19.8 0.615 grade 6 0 5.7 2.9 0.3 0.0 5.2 0.016 grades 1-3 27.7 10.6 4.8 49.6 8.9 15.8 45.517 all grades 27.7 25.5 19.8 52.7 41.0 48.4 49.918 total fibre 0.0 0.019 grade 1 30% 0% 0% 64% 1% 6% 28%20 grade 2 59% 16% 24% 25% 4% 15% 46%21 grade 3 11% 25% 0% 4% 17% 11% 17%22 grade 4 0% 24% 32% 5% 20% 16% 8%23 grade 5 0% 12% 29% 1% 59% 41% 1%24 grade 6 0% 22% 15% 1% 0% 11% 0%25 grades 1-3 100% 42% 24% 94% 22% 33% 91%26 grade 1 17 0 0 102 1 19 1627 grade 2 33 9 14 40 4 45 2628 grade 3 6 14 0 7 21 35 1029 grade 4 0 14 18 7 24 47 430 grade 5 0 7 17 1 73 124 131 grade 6 0 13 8 1 0 33 032 grades 1-3 55 24 14 149 27 99 5233 all grades 55 57 57 158 123 304 5734 grades 1-335 all grades36 grade 1 0.35 0.00 0.00 3.92 0.04 0.74 0.6237 grade 2 0.70 0.73 1.05 1.54 0.17 1.74 1.0038 grade 3 0.13 1.11 0.00 0.27 0.82 1.34 0.3739 grade 4 0.00 1.07 1.38 0.29 0.93 1.81 0.1740 grade 5 0.00 0.52 1.27 0.03 2.79 4.78 0.0341 grade 6 0.00 0.99 0.64 0.04 0.00 1.26 0.0042 grades 1-3 1.2 1.8 1.1 5.7 1.0 3.8 2.043 all grades 1.2 4.4 4.4 6.1 4.7 11.7 2.244 grades 1-345 all grades
6.810.8
176281
ITC Heyfield, VictoriaGunns Lindsay Street, Launceston, Tasmania
andITC Newood, Geeveston, Tasmania
pruned butt
total sawlog volume by sawlog grade (m3)*
sawn at
log description
E. nitens
Frank HirstGippsland
26
RidgleyGunns
thinned, pruned
13
wide spaced, pruned
speciesage (years)
silviculture
locationforest owner
total sawlog fractional grade recovery recovered from forest
sawlog productivity per hectare per year (m3)
total sawlog volume per hectare (m3)
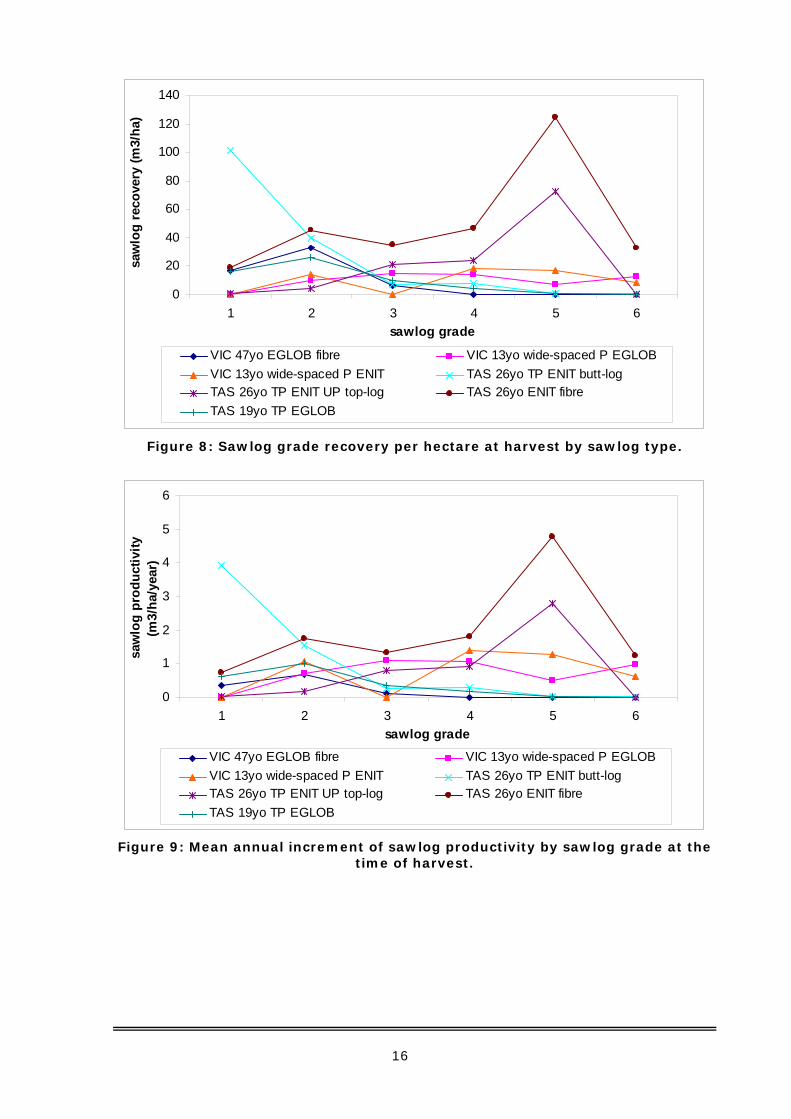
Estimated sawlog yield per hectare by grade is tabulated in Table 10 (rows 26-35) and graphically in Figure 8. This shows that:
• Whilst the 47-year-old fibre-managed E. globulus showed a relatively good sawlog grade outturn distribution (Figure 7), the volume of logs came from a relatively
15
large harvest area and thus the yield per hectare grade distribution less impressive (Figure 8), and much less impressive when the stand age is taken into account to derive the annual sawlog productivity (Figure 9, and Table 10 - col. C, rows 34-41);
• The 26-year-old fibre-managed E. nitens showed the highest estimated total sawlog yield (304 m3/ha - Table 10 - ref. H33); and
• The 26-year-old thinned-pruned E. nitens showed the highest estimated yield of grade 1-3 sawlogs (176 m3/ha - Table 10 - ref. F34). Note that rows 34-35 show the estimates for the thinned-pruned stand being the sum of the pruned butt and unpruned upper logs.
Estimated sawlog productivity (as Mean Annual Increment in cubic metres per hectare per year) is depicted in Figure 9, and tabulated in Table 10 (rows 36-45). This shows that the 26-year-old thinned-pruned E. nitens had the highest estimated productivity of grade 1-3 sawlogs (6.8 m3/ha/year - Table 10 - ref. F45)
0%
10%
20%
30%
40%
50%
60%
70%
1 2 3 4 5 6sawlog grade
grad
e re
cove
ry
VIC 47yo EGLOB fibre VIC 13yo wide-spaced P EGLOBVIC 13yo wide-spaced P ENIT TAS 26yo TP ENIT butt-logTAS 26yo TP ENIT UP top-log TAS 26yo ENIT fibreTAS 19yo TP EGLOB
Figure 7: Sawlog grade recovery by sawlog type - grade recoveries depicted
represent volume fractions of total log volume by sawlog type.
16
0
20
40
60
80
100
120
140
1 2 3 4 5 6sawlog grade
saw
log
reco
very
(m3/
ha)
VIC 47yo EGLOB fibre VIC 13yo wide-spaced P EGLOBVIC 13yo wide-spaced P ENIT TAS 26yo TP ENIT butt-logTAS 26yo TP ENIT UP top-log TAS 26yo ENIT fibreTAS 19yo TP EGLOB
Figure 8: Sawlog grade recovery per hectare at harvest by sawlog type.
0
1
2
3
4
5
6
1 2 3 4 5 6sawlog grade
saw
log
prod
uctiv
ity
(m3/
ha/y
ear)
VIC 47yo EGLOB fibre VIC 13yo wide-spaced P EGLOBVIC 13yo wide-spaced P ENIT TAS 26yo TP ENIT butt-logTAS 26yo TP ENIT UP top-log TAS 26yo ENIT fibreTAS 19yo TP EGLOB
Figure 9: Mean annual increment of sawlog productivity by sawlog grade at the
time of harvest.
17
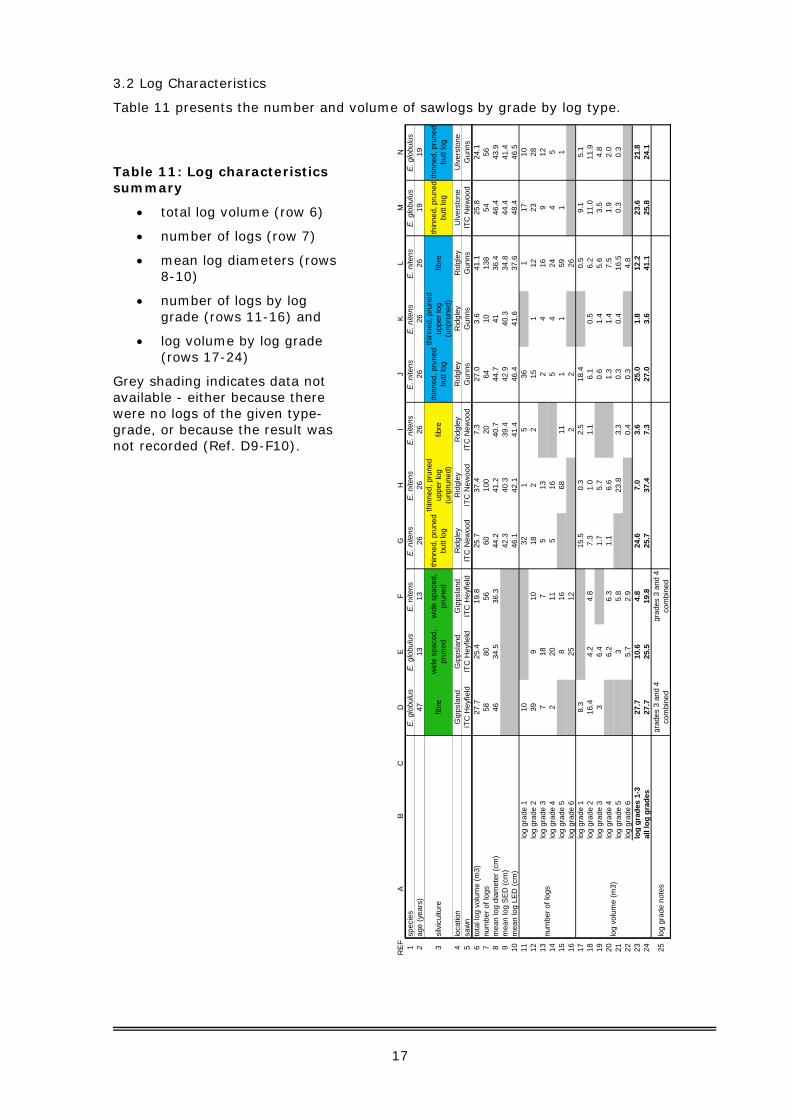
3.2 Log Characteristics
Table 11 presents the number and volume of sawlogs by grade by log type.
Table 11: Log characteristics summary
• total log volume (row 6)
• number of logs (row 7)
• mean log diameters (rows 8-10)
• number of logs by log grade (rows 11-16) and
• log volume by log grade (rows 17-24)
Grey shading indicates data not available - either because there were no logs of the given type-grade, or because the result was not recorded (Ref. D9-F10).
REF
AB
CD
EF
GH
IJ
KL
MN
1sp
ecie
sE
. glo
bulu
sE
. glo
bulu
sE
. nite
nsE
. nite
nsE
. nite
nsE
. nite
nsE
. nite
nsE
. nite
nsE
. nite
nsE
. glo
bulu
sE
. glo
bulu
s2
age
(yea
rs)
4713
1326
2626
2626
2619
19
3si
lvic
ultu
refib
rew
ide
spac
ed,
prun
edw
ide
spac
ed,
prun
edth
inne
d, p
rune
d bu
tt lo
g
thin
ned,
pru
ned
uppe
r log
(u
npru
ned)
fibre
thin
ned,
pru
ned
butt
log
thin
ned,
pru
ned
uppe
r log
(u
npru
ned)
fibre
thin
ned,
pru
ned
butt
log
thin
ned,
pru
ned
butt
log
4lo
catio
nG
ipps
land
Gip
psla
ndG
ipps
land
Rid
gley
Rid
gley
Rid
gley
Rid
gley
Rid
gley
Rid
gley
Ulv
erst
one
Ulv
erst
one
5sa
wn
ITC
Hey
field
ITC
Hey
field
ITC
Hey
field
ITC
New
ood
ITC
New
ood
ITC
New
ood
Gun
nsG
unns
Gun
nsIT
C N
ewoo
dG
unns
6to
tal l
og v
olum
e (m
3)27
.725
.419
.825
.737
.47.
327
.03.
641
.125
.824
.17
num
ber o
f log
s58
8056
6010
020
6410
138
5456
8m
ean
log
diam
eter
(cm
)46
34.5
36.3
44.2
41.2
40.7
44.7
4136
.446
.443
.99
mea
n lo
g SE
D (c
m)
42.3
40.3
39.4
42.9
40.3
34.8
44.4
41.4
10m
ean
log
LED
(cm
)46
.142
.141
.446
.441
.637
.648
.446
.511
log
grad
e 1
1032
15
361
1710
12lo
g gr
ade
239
910
182
215
112
2328
13lo
g gr
ade
37
187
513
24
169
1214
log
grad
e 4
220
115
165
424
45
15lo
g gr
ade
58
1668
111
159
11
16lo
g gr
ade
625
122
226
17lo
g gr
ade
18.
315
.50.
32.
518
.40.
59.
15.
118
log
grad
e 2
16.4
4.2
4.8
7.3
1.0
1.1
6.1
0.5
6.2
11.0
11.9
19lo
g gr
ade
33
6.4
1.7
5.7
0.6
1.4
5.6
3.5
4.8
20lo
g gr
ade
46.
26.
31.
16.
61.
31.
47.
51.
92.
021
log
grad
e 5
35.
823
.83.
30.
30.
416
.50.
30.
322
log
grad
e 6
5.7
2.9
0.4
0.3
4.8
23lo
g gr
ades
1-3
27.7
10.6
4.8
24.6
7.0
3.6
25.0
1.8
12.2
23.6
21.8
24al
l lo g
gra
des
27.7
25.5
19.8
25.7
37.4
7.3
27.0
3.6
41.1
25.8
24.1
25lo
g gr
ade
note
sgr
ades
3 a
nd 4
co
mbi
ned
grad
es 3
and
4
com
bine
d
num
ber o
f log
s
log
volu
me
(m3)

18
3.3 Sawn timber grade recovery Table 13 presents the observed sawn-board grade recoveries by log grade and log type. Sawn board recovery by board grade, nominal board width and log grade are recorded in Appendix 3.
Sawing of thinned and pruned butt logs at Newood also produced approximately 30 tonnes of woodchip; a similar amount was also produced at Gunns. The other log resources sampled would have produced a similar proportion of woodchip.
3.3.1 Total dry recovery Total dry recovery (including dried rejects) calculated as the total nominal dry volume as a fraction of the total log volume is depicted in Table 13 by log grade (rows 6-12), total for log grades 1-3 (row 12) and total for all logs processed in the log-type (row 13). This shows that:
• Total dry recovery for log-grades 1-3 ranged from 24% (ref. F12) for the 13-year-old wide-spaced E. nitens processed by ITC Heyfield, to 42% (ref. H12) for the upper-unpruned-log of the thinned-pruned E. nitens processed by ITC Newood.
• The difference in sawmill technologies is highlighted by comparing the recoveries from:
o 26-year-old thinned-pruned E. nitens butt logs processed by ITC Newood (40% - ref. G12) and Gunns Lindsay Street (34% - ref. J12);
o 19-year-old thinned-pruned E. globulus butt logs processed by ITC Newood (37% - ref. M12) and Gunns Lindsay Street (29% - ref. N12); and
o 47-year-old fibre-managed E. globulus processed by ITC Heyfield (29% - ref. D12) and 19-year-old thinned-pruned E. globulus butt logs processed by Gunns Lindsay Street (29% - ref. N12).
• The difference in recovery (sawlog grades 1-3) between the thinned-pruned butt logs of the 26-year-old E. nitens and the 19 year-old E. globulus is consistent between Tasmanian mills:
o 34% for 26-year-old E. nitens (ref. J12) versus 29% for 19 year-old E. globulus (ref. N12) at Gunns Lindsay Street Launceston;
o 40% for 26-year-old E. nitens (ref. G12) versus 37% for 19 year-old E. globulus (ref. M12) at ITC Newood, Geeveston; and
o Recovery differences appear to hold across log grade at the two mills (Figure 10).
19
0%5%
10%15%20%25%30%35%40%45%
log grade 1 log grade 2 log grade 3sawlog grade
nom
inal
dry
reco
very
E. nitens 26yo - ITCNewood
E. globulus 19yo - ITCNewood
E. nitens 26yo - Gunns
E. globulus 19yo - Gunns
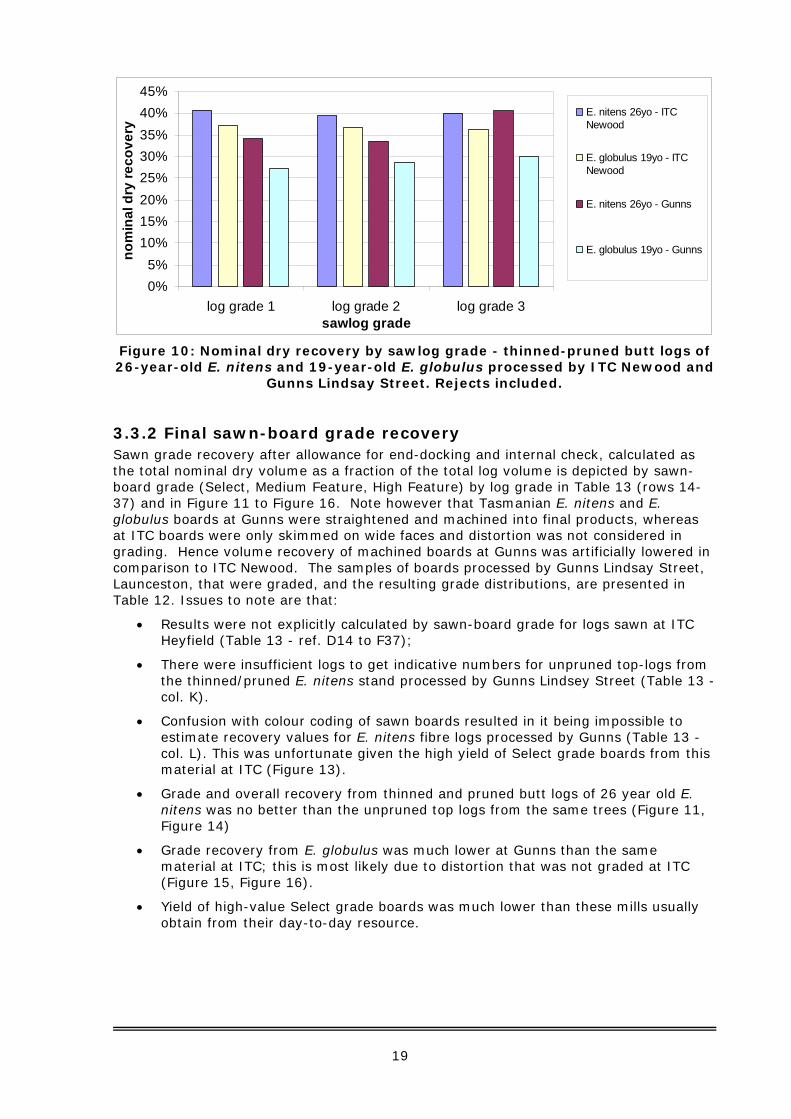
Figure 10: Nominal dry recovery by sawlog grade - thinned-pruned butt logs of 26-year-old E. nitens and 19-year-old E. globulus processed by ITC Newood and
Gunns Lindsay Street. Rejects included.
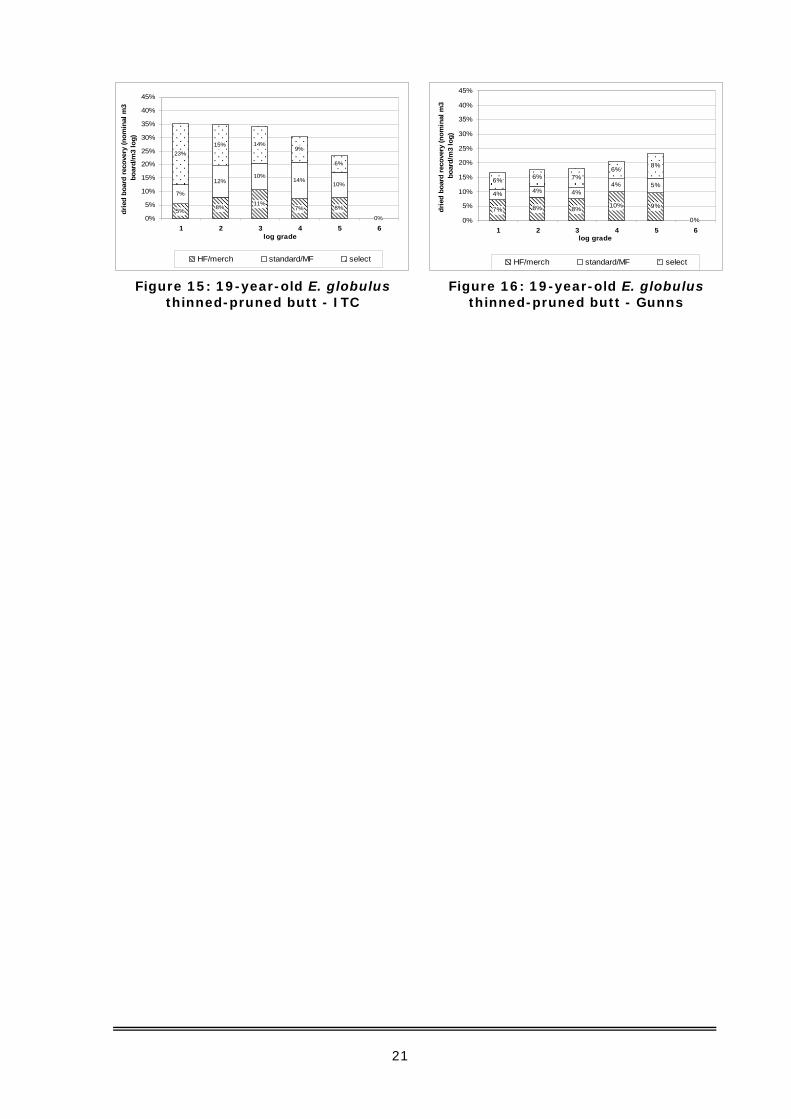
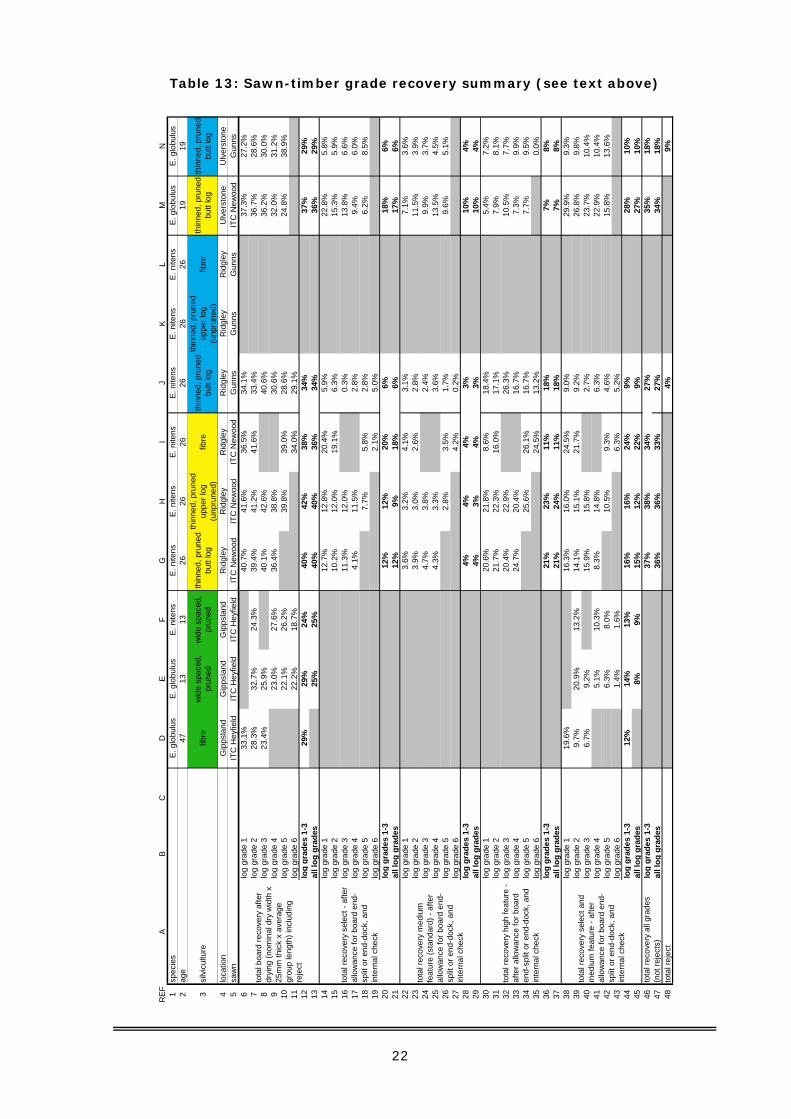
3.3.2 Final sawn-board grade recovery Sawn grade recovery after allowance for end-docking and internal check, calculated as the total nominal dry volume as a fraction of the total log volume is depicted by sawn-board grade (Select, Medium Feature, High Feature) by log grade in Table 13 (rows 14-37) and in Figure 11 to Figure 16. Note however that Tasmanian E. nitens and E. globulus boards at Gunns were straightened and machined into final products, whereas at ITC boards were only skimmed on wide faces and distortion was not considered in grading. Hence volume recovery of machined boards at Gunns was artificially lowered in comparison to ITC Newood. The samples of boards processed by Gunns Lindsay Street, Launceston, that were graded, and the resulting grade distributions, are presented in Table 12. Issues to note are that:
• Results were not explicitly calculated by sawn-board grade for logs sawn at ITC Heyfield (Table 13 - ref. D14 to F37);
• There were insufficient logs to get indicative numbers for unpruned top-logs from the thinned/pruned E. nitens stand processed by Gunns Lindsey Street (Table 13 - col. K).
• Confusion with colour coding of sawn boards resulted in it being impossible to estimate recovery values for E. nitens fibre logs processed by Gunns (Table 13 - col. L). This was unfortunate given the high yield of Select grade boards from this material at ITC (Figure 13).
• Grade and overall recovery from thinned and pruned butt logs of 26 year old E. nitens was no better than the unpruned top logs from the same trees (Figure 11, Figure 14)
• Grade recovery from E. globulus was much lower at Gunns than the same material at ITC; this is most likely due to distortion that was not graded at ITC (Figure 15, Figure 16).
• Yield of high-value Select grade boards was much lower than these mills usually obtain from their day-to-day resource.

20
Table 12: Samples of boards processed by Gunns Lindsay Street, Launceston, that were graded: number of boards, fraction of boards by grade, and fraction of board volume by grade allowing for docking to upgrade board (minimum board
length 1.8m).
select MF HF reject select MF HF reject
EGOLB TP butt - 108x19 flooring 72 17% 25% 24% 35% 15% 23% 23% 38%ENIT fibre - 108x19 flooring 173 9% 10% 25% 56% 7% 9% 24% 59%ENIT TP butt - 108x19 flooring 340 24% 16% 51% 10% 22% 15% 52% 11%ENIT TUP top - 108x19 flooring 53 38% 19% 15% 28% 35% 19% 15% 31%EGOLB TP butt - 135x19 reveal 200 19% 19% 59% 4% 17% 17% 62% 4%ENIT fibre - 135x19 reveal 131 2% 8% 85% 5% 2% 7% 86% 5%ENIT TP butt - 135x19 reveal 252 15% 16% 67% 2% 12% 14% 71% 2%ENIT fibre - 45x19 DAR 74 26% 0% 0% 74% 22% 0% 0% 78%ENIT TP butt - 45x19 DAR 37 19% 3% 0% 78% 16% 2% 0% 82%EGOLB TP butt - 85x19 flooring 172 35% 10% 14% 41% 33% 9% 14% 44%EGOLB TP butt - 65x19 colonial arch 33 42% 0% 0% 58% 39% 0% 0% 61%ENIT TP butt - 65x19 colonial arch 51 61% 0% 0% 39% 59% 0% 0% 41%
fraction of volume >1.8m lengthlog source, board type
fraction of boardsnumber of boards
assessed
21% 22% 20%25%
0% 0%
4% 4% 5%
4%
0% 0%
13% 10% 11% 4%
0% 0%0%
5%
10%
15%
20%
25%
30%
35%
40%
45%
1 2 3 4 5 6log grade
drie
d bo
ard
reco
very
(nom
inal
m3
boar
d/m
3 lo
g)
HF/merch standard/MF select
Figure 11: 26-year-old E. nitens thinned-pruned butt - ITC
18% 17%
26%
17% 17%13%
3%3% 4%
6% 6%
0%
3%3%
2%
0%
2% 5%
0%
5%
10%
15%
20%
25%
30%
35%
40%
45%
1 2 3 4 5 6log grade
drie
d bo
ard
reco
very
(nom
inal
m3
boar
d/m
3 lo
g)
HF/merch standard/MF select Figure 12: 26-year-old E. nitens
thinned-pruned butt - Gunns
9%
16%
0% 0%
26% 25%
0% 0%
3%4%
20%
19%
0% 0%
6%2%
3%
4%
0%
5%
10%
15%
20%
25%
30%
35%
40%
45%
1 2 3 4 5 6log grade
drie
d bo
ard
reco
very
(nom
inal
m3
boar
d/m
3 lo
g)
HF/merch standard/MF select
Figure 13: 26-year-old E. nitens unthinned-unpruned - ITC
22% 22% 23% 20%26%
0%
3% 3% 4%3%
3%
0%
13% 12% 12%11%
8%
0%0%
5%
10%
15%
20%
25%
30%
35%
40%
45%
1 2 3 4 5 6log grade
HF/merch standard/MF select
Figure 14: 26-year-old E. nitens thinned-unpruned top - ITC
21
5% 8% 11%7% 8%
0%
7%
12%10%
14%10%
0%
23%15% 14%
9%
6%
0%0%
5%
10%
15%
20%
25%
30%
35%
40%
45%
1 2 3 4 5 6log grade
drie
d bo
ard
reco
very
(nom
inal
m3
boar
d/m
3 lo
g)
HF/merch standard/MF select
Figure 15: 19-year-old E. globulus thinned-pruned butt - ITC
7% 8% 8% 10% 9%
0%
4% 4% 4%4% 5%
0%
6% 6% 7%6% 8%
0%0%
5%
10%
15%
20%
25%
30%
35%
40%
45%
1 2 3 4 5 6log grade
drie
d bo
ard
reco
very
(nom
inal
m3
boar
d/m
3 lo
g)
HF/merch standard/MF select Figure 16: 19-year-old E. globulus
thinned-pruned butt - Gunns
22
Table 13: Sawn-timber grade recovery summary (see text above)
REF
AB
CD
EF
GH
IJ
KL
MN
1sp
ecie
sE.
glo
bulu
sE.
glo
bulu
sE.
nite
nsE.
nite
nsE.
nite
nsE.
nite
nsE.
nite
nsE.
nite
nsE.
nite
nsE.
glo
bulu
sE.
glo
bulu
s2
age
4713
1326
2626
2626
2619
19
3si
lvic
ultu
refib
rew
ide
spac
ed,
prun
edw
ide
spac
ed,
prun
edth
inne
d, p
rune
d bu
tt lo
g
thin
ned,
pru
ned
uppe
r log
(u
npru
ned)
fibre
thin
ned,
pru
ned
butt
log
thin
ned,
pru
ned
uppe
r log
(u
npru
ned)
fibre
thin
ned,
pru
ned
butt
log
thin
ned,
pru
ned
butt
log
4lo
catio
nG
ipps
land
Gip
psla
ndG
ipps
land
Rid
gley
Rid
gley
Rid
gley
Rid
gley
Rid
gley
Rid
gley
Ulv
erst
one
Ulv
erst
one
5sa
wn
ITC
Hey
field
ITC
Hey
field
ITC
Hey
field
ITC
New
ood
ITC
New
ood
ITC
New
ood
Gun
nsG
unns
Gun
nsIT
C N
ewoo
dG
unns
6lo
g gr
ade
133
.1%
40.7
%41
.6%
36.5
%34
.1%
37.3
%27
.2%
7lo
g gr
ade
228
.3%
32.7
%24
.3%
39.4
%41
.2%
41.6
%33
.4%
36.7
%28
.6%
8lo
g gr
ade
323
.4%
25.9
%40
.1%
42.6
%40
.6%
36.2
%30
.0%
9lo
g gr
ade
423
.0%
27.6
%36
.4%
38.8
%30
.6%
32.0
%31
.2%
10lo
g gr
ade
522
.1%
26.2
%39
.8%
39.0
%28
.6%
24.8
%38
.9%
11lo
g gr
ade
622
.2%
18.7
%34
.0%
29.1
%12
log
grad
es 1
-329
%29
%24
%40
%42
%38
%34
%37
%29
%13
all l
o g g
rade
s25
%25
%40
%40
%36
%34
%36
%29
%14
log
grad
e 1
12.7
%12
.8%
20.4
%5.
9%22
.8%
5.8%
15lo
g gr
ade
210
.2%
12.0
%19
.1%
6.3%
15.3
%5.
9%16
log
grad
e 3
11.3
%12
.0%
0.3%
13.8
%6.
6%17
log
grad
e 4
4.1%
11.5
%2.
8%9.
4%6.
0%18
log
grad
e 5
7.7%
5.8%
2.8%
6.2%
8.5%
19lo
g gr
ade
62.
1%5.
0%20
log
grad
es 1
-312
%12
%20
%6%
18%
6%21
all l
o g g
rade
s12
%9%
18%
6%17
%6%
22lo
g gr
ade
13.
6%3.
2%4.
1%3.
1%7.
1%3.
6%23
log
grad
e 2
3.9%
3.0%
2.6%
2.8%
11.5
%3.
9%24
log
grad
e 3
4.7%
3.8%
2.4%
9.9%
3.7%
25lo
g gr
ade
44.
3%3.
3%3.
6%13
.5%
4.5%
26lo
g gr
ade
52.
8%3.
5%1.
7%9.
6%5.
1%27
log
grad
e 6
4.2%
0.2%
28lo
g gr
ades
1-3
4%4%
4%3%
10%
4%29
all l
o g g
rade
s4%
3%4%
3%10
%4%
30lo
g gr
ade
120
.6%
21.8
%8.
6%18
.4%
5.4%
7.2%
31lo
g gr
ade
221
.7%
22.3
%16
.0%
17.1
%7.
9%8.
1%32
log
grad
e 3
20.4
%22
.9%
26.3
%10
.5%
7.7%
33lo
g gr
ade
424
.7%
20.4
%16
.7%
7.3%
9.9%
34lo
g gr
ade
525
.6%
26.1
%16
.7%
7.7%
9.5%
35lo
g gr
ade
624
.5%
13.2
%0.
0%36
log
grad
es 1
-321
%23
%11
%18
%7%
8%37
all l
o g g
rade
s21
%24
%11
%18
%7%
8%38
log
grad
e 1
19.6
%16
.3%
16.0
%24
.5%
9.0%
29.9
%9.
3%39
log
grad
e 2
9.7%
20.9
%13
.2%
14.1
%15
.1%
21.7
%9.
2%26
.8%
9.8%
40lo
g gr
ade
36.
7%9.
2%15
.9%
15.8
%2.
7%23
.7%
10.4
%41
log
grad
e 4
5.1%
10.3
%8.
3%14
.8%
6.3%
22.9
%10
.4%
42lo
g gr
ade
56.
3%8.
0%10
.5%
9.3%
4.6%
15.8
%13
.6%
43lo
g gr
ade
61.
4%1.
6%6.
3%5.
2%44
log
grad
es 1
-312
%14
%13
%16
%16
%24
%9%
28%
10%
45al
l lo g
gra
des
8%9%
15%
12%
22%
9%27
%10
%46
log
grad
es 1
-337
%38
%34
%27
%35
%18
%47
all l
o g g
rade
s36
%36
%33
%27
%34
%18
%48
tota
l rej
ect
4%9%
tota
l rec
over
y se
lect
and
m
ediu
m fe
atur
e - a
fter
allo
wan
ce fo
r boa
rd e
nd-
split
or e
nd-d
ock,
and
in
tern
al c
heck
tota
l rec
over
y al
l gra
des
(not
reje
cts)
tota
l rec
over
y se
lect
- af
ter
allo
wan
ce fo
r boa
rd e
nd-
split
or e
nd-d
ock,
and
in
tern
al c
heck
tota
l rec
over
y m
ediu
m
feat
ure
(sta
ndar
d) -
afte
r al
low
ance
for b
oard
end
-sp
lit o
r end
-doc
k, a
nd
inte
rnal
che
ck
tota
l rec
over
y hi
gh fe
atur
e -
afte
r allo
wan
ce fo
r boa
rd
end-
split
or e
nd-d
ock,
and
in
tern
al c
heck
tota
l boa
rd re
cove
ry a
fter
dryi
ng (n
omin
al d
ry w
idth
x
25m
m th
ick
x av
erag
e gr
oup
leng
th) i
nclu
ding
re
ject
23
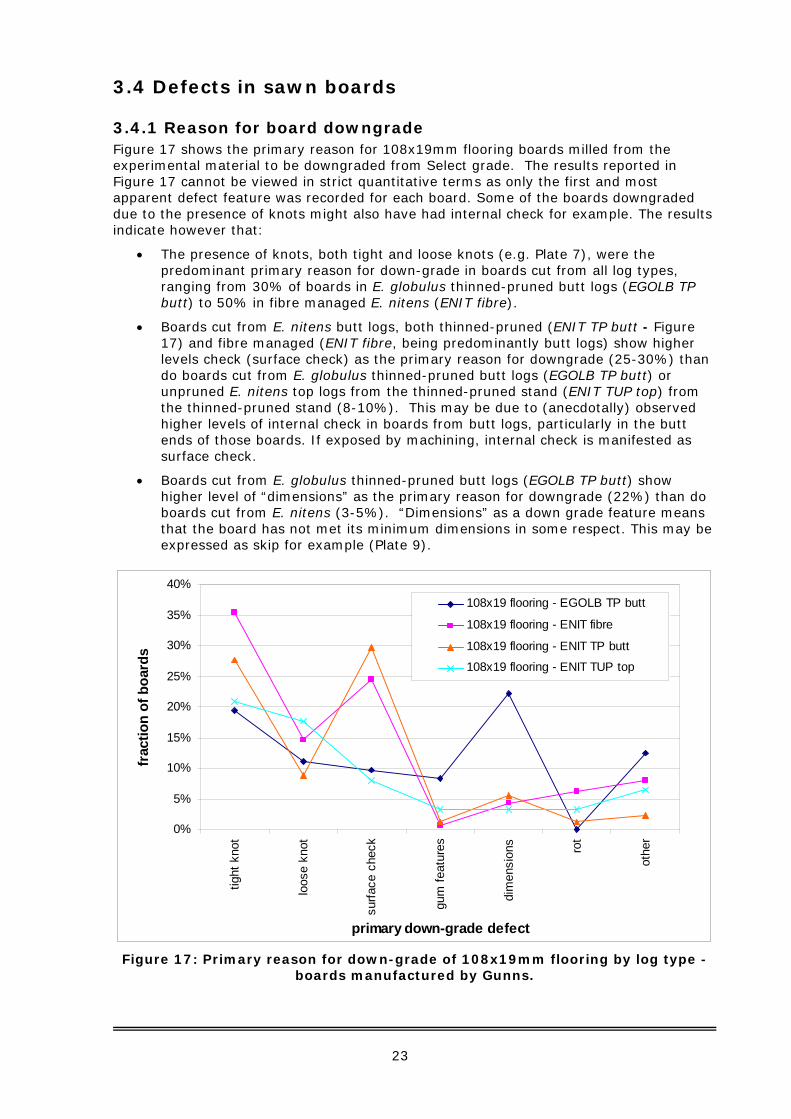
3.4 Defects in sawn boards
3.4.1 Reason for board downgrade Figure 17 shows the primary reason for 108x19mm flooring boards milled from the experimental material to be downgraded from Select grade. The results reported in Figure 17 cannot be viewed in strict quantitative terms as only the first and most apparent defect feature was recorded for each board. Some of the boards downgraded due to the presence of knots might also have had internal check for example. The results indicate however that:
• The presence of knots, both tight and loose knots (e.g. Plate 7), were the predominant primary reason for down-grade in boards cut from all log types, ranging from 30% of boards in E. globulus thinned-pruned butt logs (EGOLB TP butt) to 50% in fibre managed E. nitens (ENIT fibre).
• Boards cut from E. nitens butt logs, both thinned-pruned (ENIT TP butt - Figure 17) and fibre managed (ENIT fibre, being predominantly butt logs) show higher levels check (surface check) as the primary reason for downgrade (25-30%) than do boards cut from E. globulus thinned-pruned butt logs (EGOLB TP butt) or unpruned E. nitens top logs from the thinned-pruned stand (ENIT TUP top) from the thinned-pruned stand (8-10%). This may be due to (anecdotally) observed higher levels of internal check in boards from butt logs, particularly in the butt ends of those boards. If exposed by machining, internal check is manifested as surface check.
• Boards cut from E. globulus thinned-pruned butt logs (EGOLB TP butt) show higher level of “dimensions” as the primary reason for downgrade (22%) than do boards cut from E. nitens (3-5%). “Dimensions” as a down grade feature means that the board has not met its minimum dimensions in some respect. This may be expressed as skip for example (Plate 9).
0%
5%
10%
15%
20%
25%
30%
35%
40%
tight
kno
t
loos
e kn
ot
surfa
ce c
heck
gum
feat
ures
dim
ensi
ons rot
othe
r
primary down-grade defect
frac
tion
of b
oard
s
108x19 flooring - EGOLB TP butt
108x19 flooring - ENIT fibre
108x19 flooring - ENIT TP butt
108x19 flooring - ENIT TUP top
Figure 17: Primary reason for down-grade of 108x19mm flooring by log type -
boards manufactured by Gunns.
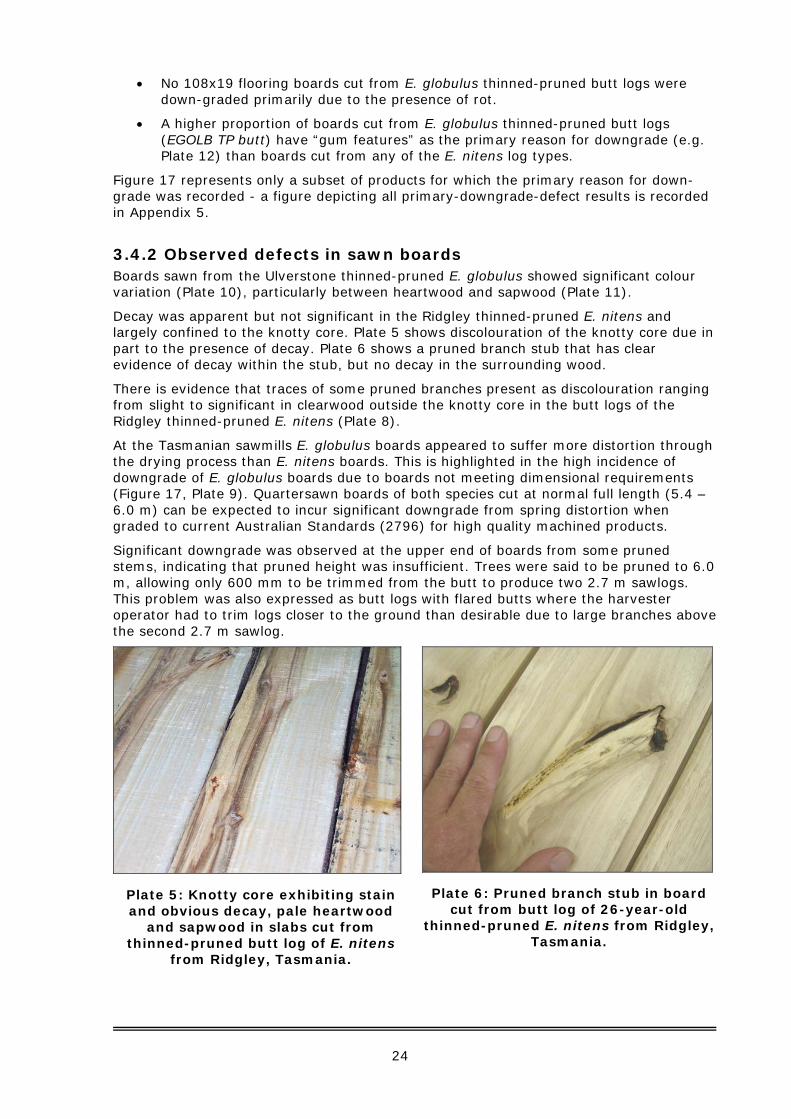
24
• No 108x19 flooring boards cut from E. globulus thinned-pruned butt logs were down-graded primarily due to the presence of rot.
• A higher proportion of boards cut from E. globulus thinned-pruned butt logs (EGOLB TP butt) have “gum features” as the primary reason for downgrade (e.g. Plate 12) than boards cut from any of the E. nitens log types.
Figure 17 represents only a subset of products for which the primary reason for down-grade was recorded - a figure depicting all primary-downgrade-defect results is recorded in Appendix 5.
3.4.2 Observed defects in sawn boards Boards sawn from the Ulverstone thinned-pruned E. globulus showed significant colour variation (Plate 10), particularly between heartwood and sapwood (Plate 11).
Decay was apparent but not significant in the Ridgley thinned-pruned E. nitens and largely confined to the knotty core. Plate 5 shows discolouration of the knotty core due in part to the presence of decay. Plate 6 shows a pruned branch stub that has clear evidence of decay within the stub, but no decay in the surrounding wood.
There is evidence that traces of some pruned branches present as discolouration ranging from slight to significant in clearwood outside the knotty core in the butt logs of the Ridgley thinned-pruned E. nitens (Plate 8).
At the Tasmanian sawmills E. globulus boards appeared to suffer more distortion through the drying process than E. nitens boards. This is highlighted in the high incidence of downgrade of E. globulus boards due to boards not meeting dimensional requirements (Figure 17, Plate 9). Quartersawn boards of both species cut at normal full length (5.4 – 6.0 m) can be expected to incur significant downgrade from spring distortion when graded to current Australian Standards (2796) for high quality machined products.
Significant downgrade was observed at the upper end of boards from some pruned stems, indicating that pruned height was insufficient. Trees were said to be pruned to 6.0 m, allowing only 600 mm to be trimmed from the butt to produce two 2.7 m sawlogs. This problem was also expressed as butt logs with flared butts where the harvester operator had to trim logs closer to the ground than desirable due to large branches above the second 2.7 m sawlog.
Plate 5: Knotty core exhibiting stain and obvious decay, pale heartwood
and sapwood in slabs cut from thinned-pruned butt log of E. nitens
from Ridgley, Tasmania.
Plate 6: Pruned branch stub in board cut from butt log of 26-year-old
thinned-pruned E. nitens from Ridgley, Tasmania.
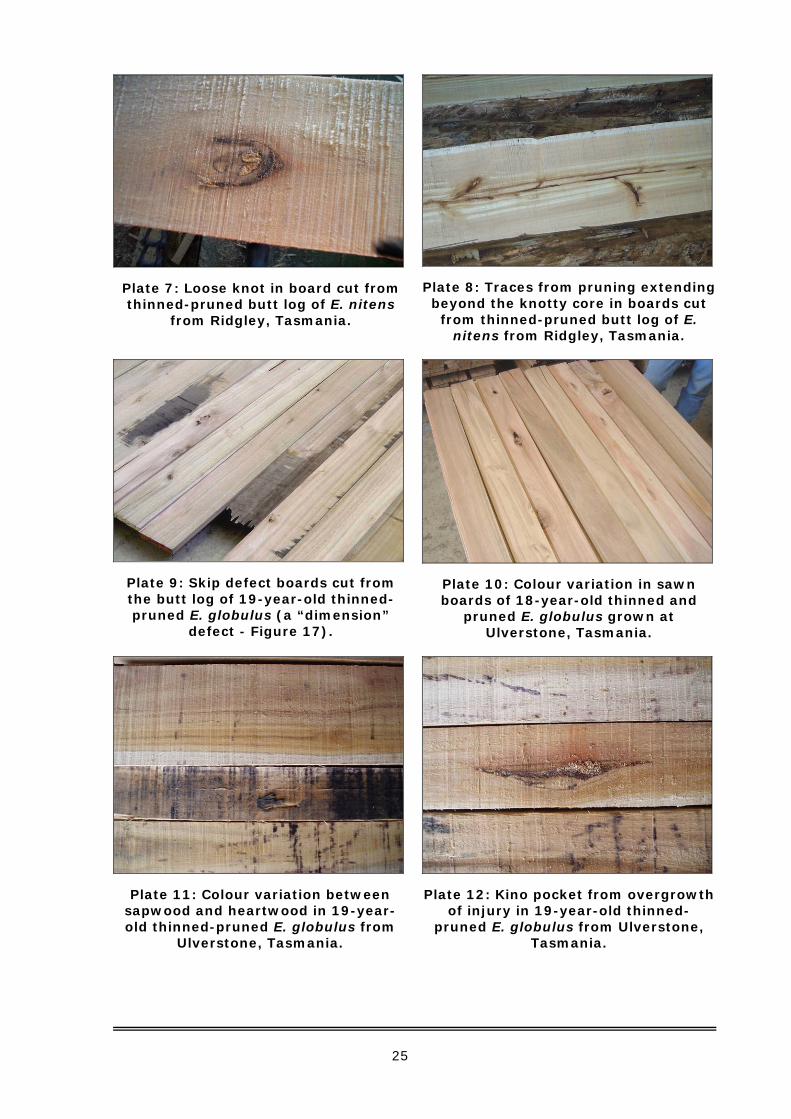
25
Plate 7: Loose knot in board cut from thinned-pruned butt log of E. nitens
from Ridgley, Tasmania.
Plate 8: Traces from pruning extending beyond the knotty core in boards cut
from thinned-pruned butt log of E. nitens from Ridgley, Tasmania.
Plate 9: Skip defect boards cut from the butt log of 19-year-old thinned-pruned E. globulus (a “dimension”
defect - Figure 17).
Plate 10: Colour variation in sawn boards of 18-year-old thinned and
pruned E. globulus grown at Ulverstone, Tasmania.
Plate 11: Colour variation between sapwood and heartwood in 19-year-old thinned-pruned E. globulus from
Ulverstone, Tasmania.
Plate 12: Kino pocket from overgrowth of injury in 19-year-old thinned-
pruned E. globulus from Ulverstone, Tasmania.
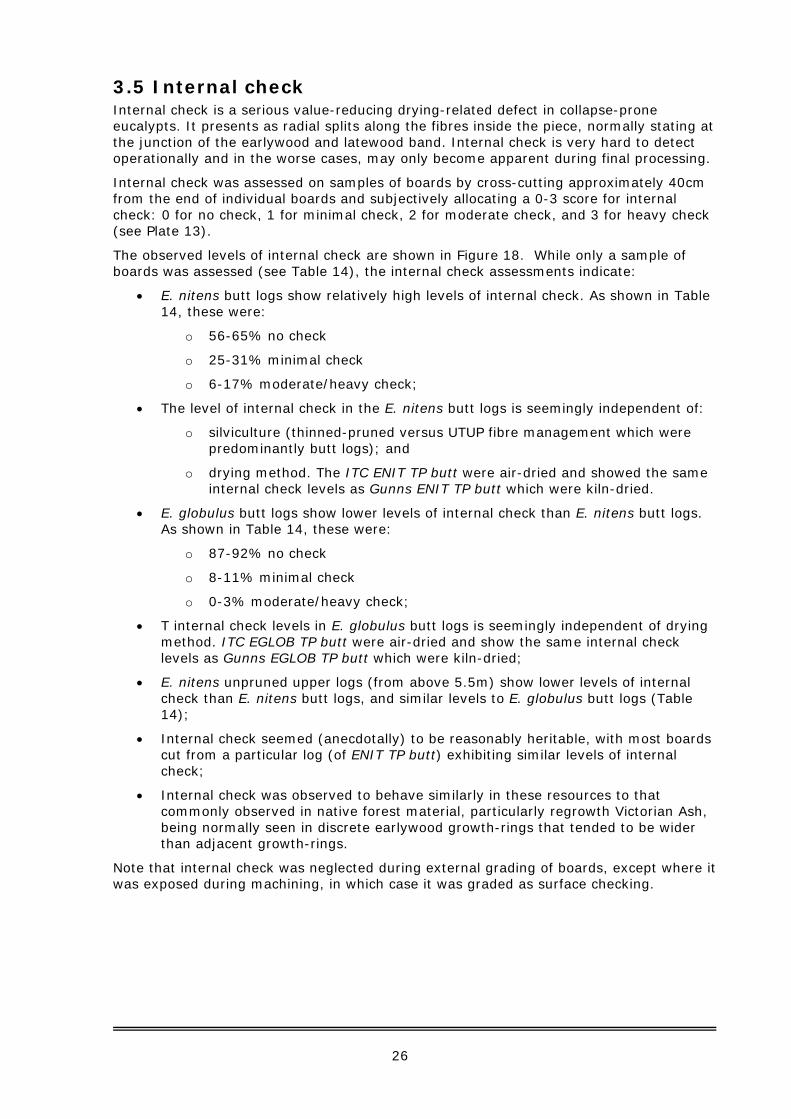
26
3.5 Internal check Internal check is a serious value-reducing drying-related defect in collapse-prone eucalypts. It presents as radial splits along the fibres inside the piece, normally stating at the junction of the earlywood and latewood band. Internal check is very hard to detect operationally and in the worse cases, may only become apparent during final processing.
Internal check was assessed on samples of boards by cross-cutting approximately 40cm from the end of individual boards and subjectively allocating a 0-3 score for internal check: 0 for no check, 1 for minimal check, 2 for moderate check, and 3 for heavy check (see Plate 13).
The observed levels of internal check are shown in Figure 18. While only a sample of boards was assessed (see Table 14), the internal check assessments indicate:
• E. nitens butt logs show relatively high levels of internal check. As shown in Table 14, these were:
o 56-65% no check
o 25-31% minimal check
o 6-17% moderate/heavy check;
• The level of internal check in the E. nitens butt logs is seemingly independent of:
o silviculture (thinned-pruned versus UTUP fibre management which were predominantly butt logs); and
o drying method. The ITC ENIT TP butt were air-dried and showed the same internal check levels as Gunns ENIT TP butt which were kiln-dried.
• E. globulus butt logs show lower levels of internal check than E. nitens butt logs. As shown in Table 14, these were:
o 87-92% no check
o 8-11% minimal check
o 0-3% moderate/heavy check;
• T internal check levels in E. globulus butt logs is seemingly independent of drying method. ITC EGLOB TP butt were air-dried and show the same internal check levels as Gunns EGLOB TP butt which were kiln-dried;
• E. nitens unpruned upper logs (from above 5.5m) show lower levels of internal check than E. nitens butt logs, and similar levels to E. globulus butt logs (Table 14);
• Internal check seemed (anecdotally) to be reasonably heritable, with most boards cut from a particular log (of ENIT TP butt) exhibiting similar levels of internal check;
• Internal check was observed to behave similarly in these resources to that commonly observed in native forest material, particularly regrowth Victorian Ash, being normally seen in discrete earlywood growth-rings that tended to be wider than adjacent growth-rings.
Note that internal check was neglected during external grading of boards, except where it was exposed during machining, in which case it was graded as surface checking.
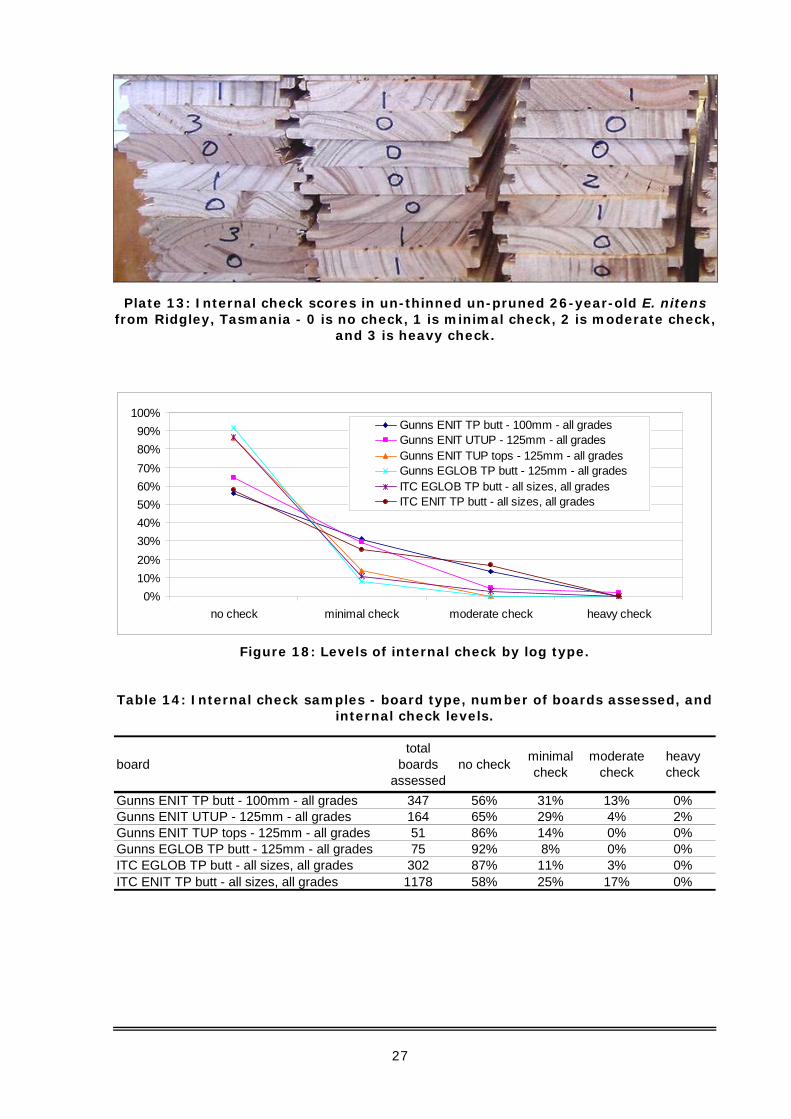
27
Plate 13: Internal check scores in un-thinned un-pruned 26-year-old E. nitens from Ridgley, Tasmania - 0 is no check, 1 is minimal check, 2 is moderate check,
and 3 is heavy check.
0%10%20%30%40%50%60%70%80%90%
100%
no check minimal check moderate check heavy check
Gunns ENIT TP butt - 100mm - all gradesGunns ENIT UTUP - 125mm - all gradesGunns ENIT TUP tops - 125mm - all gradesGunns EGLOB TP butt - 125mm - all gradesITC EGLOB TP butt - all sizes, all gradesITC ENIT TP butt - all sizes, all grades
Figure 18: Levels of internal check by log type.
Table 14: Internal check samples - board type, number of boards assessed, and internal check levels.
boardtotal
boards assessed
no check minimal check
moderate check
heavy check
Gunns ENIT TP butt - 100mm - all grades 347 56% 31% 13% 0%Gunns ENIT UTUP - 125mm - all grades 164 65% 29% 4% 2%Gunns ENIT TUP tops - 125mm - all grades 51 86% 14% 0% 0%Gunns EGLOB TP butt - 125mm - all grades 75 92% 8% 0% 0%ITC EGLOB TP butt - all sizes, all grades 302 87% 11% 3% 0%ITC ENIT TP butt - all sizes, all grades 1178 58% 25% 17% 0%
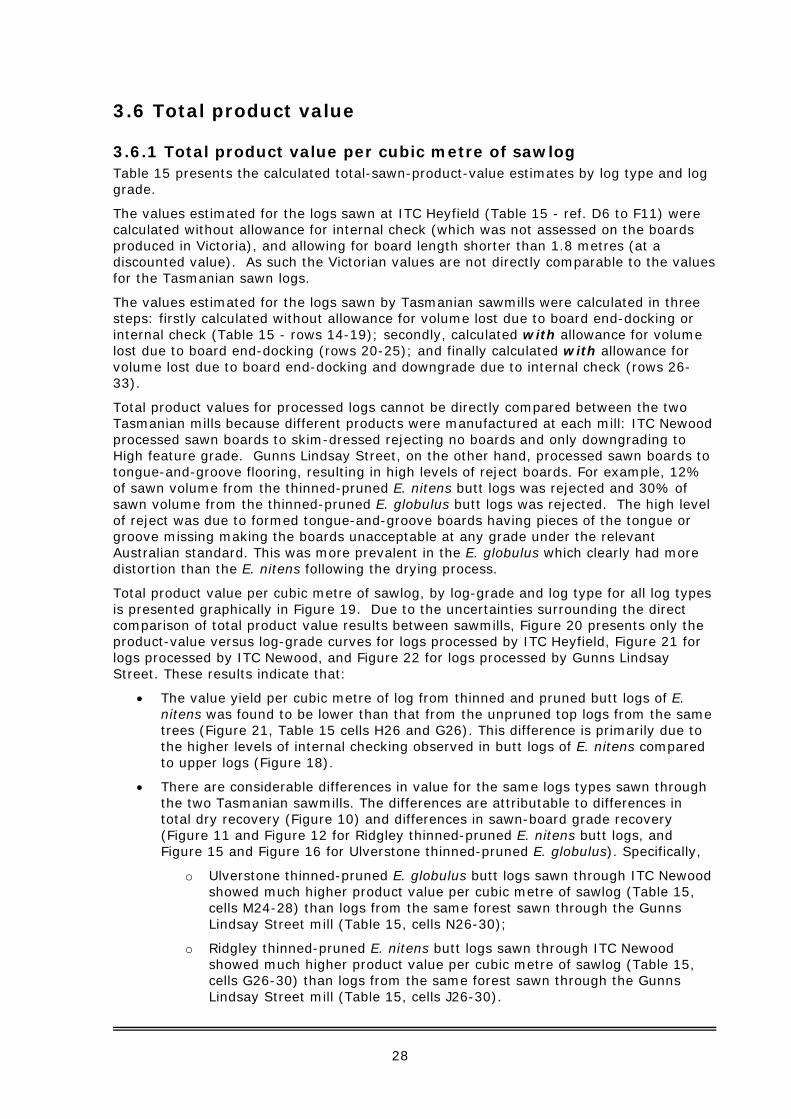
28
3.6 Total product value
3.6.1 Total product value per cubic metre of sawlog Table 15 presents the calculated total-sawn-product-value estimates by log type and log grade.
The values estimated for the logs sawn at ITC Heyfield (Table 15 - ref. D6 to F11) were calculated without allowance for internal check (which was not assessed on the boards produced in Victoria), and allowing for board length shorter than 1.8 metres (at a discounted value). As such the Victorian values are not directly comparable to the values for the Tasmanian sawn logs.
The values estimated for the logs sawn by Tasmanian sawmills were calculated in three steps: firstly calculated without allowance for volume lost due to board end-docking or internal check (Table 15 - rows 14-19); secondly, calculated with allowance for volume lost due to board end-docking (rows 20-25); and finally calculated with allowance for volume lost due to board end-docking and downgrade due to internal check (rows 26-33).
Total product values for processed logs cannot be directly compared between the two Tasmanian mills because different products were manufactured at each mill: ITC Newood processed sawn boards to skim-dressed rejecting no boards and only downgrading to High feature grade. Gunns Lindsay Street, on the other hand, processed sawn boards to tongue-and-groove flooring, resulting in high levels of reject boards. For example, 12% of sawn volume from the thinned-pruned E. nitens butt logs was rejected and 30% of sawn volume from the thinned-pruned E. globulus butt logs was rejected. The high level of reject was due to formed tongue-and-groove boards having pieces of the tongue or groove missing making the boards unacceptable at any grade under the relevant Australian standard. This was more prevalent in the E. globulus which clearly had more distortion than the E. nitens following the drying process.
Total product value per cubic metre of sawlog, by log-grade and log type for all log types is presented graphically in Figure 19. Due to the uncertainties surrounding the direct comparison of total product value results between sawmills, Figure 20 presents only the product-value versus log-grade curves for logs processed by ITC Heyfield, Figure 21 for logs processed by ITC Newood, and Figure 22 for logs processed by Gunns Lindsay Street. These results indicate that:
• The value yield per cubic metre of log from thinned and pruned butt logs of E. nitens was found to be lower than that from the unpruned top logs from the same trees (Figure 21, Table 15 cells H26 and G26). This difference is primarily due to the higher levels of internal checking observed in butt logs of E. nitens compared to upper logs (Figure 18).
• There are considerable differences in value for the same logs types sawn through the two Tasmanian sawmills. The differences are attributable to differences in total dry recovery (Figure 10) and differences in sawn-board grade recovery (Figure 11 and Figure 12 for Ridgley thinned-pruned E. nitens butt logs, and Figure 15 and Figure 16 for Ulverstone thinned-pruned E. globulus). Specifically,
o Ulverstone thinned-pruned E. globulus butt logs sawn through ITC Newood showed much higher product value per cubic metre of sawlog (Table 15, cells M24-28) than logs from the same forest sawn through the Gunns Lindsay Street mill (Table 15, cells N26-30);
o Ridgley thinned-pruned E. nitens butt logs sawn through ITC Newood showed much higher product value per cubic metre of sawlog (Table 15, cells G26-30) than logs from the same forest sawn through the Gunns Lindsay Street mill (Table 15, cells J26-30).

29
The fibre-managed E. nitens logs from Ridgley sawn by ITC Newood showed the highest product value per cubic metre of sawlog (Table 15, cell I26 for grade 1 sawlogs). This is primarily attributable to the very high recovery of Select boards recorded for this log type (20.4% of log volume, Table 13, cell I14). This results needs to be treated with caution as this estimate is based upon sawing only five logs totalling 2.5 m3 (Table 11, cells I11 and I17).
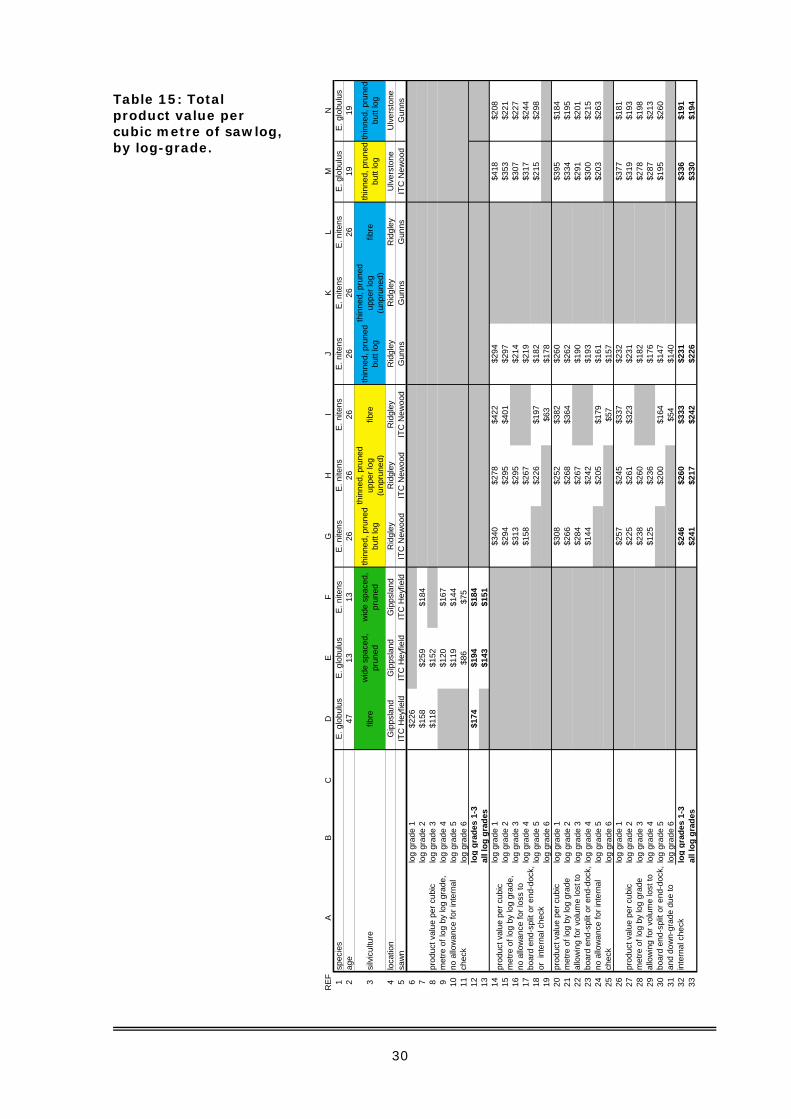
30
Table 15: Total product value per cubic metre of sawlog, by log-grade.
REF
AB
CD
EF
GH
IJ
KL
MN
1sp
ecie
sE.
glo
bulu
sE.
glo
bulu
sE.
nite
nsE.
nite
nsE.
nite
nsE.
nite
nsE.
nite
nsE.
nite
nsE.
nite
nsE.
glo
bulu
sE.
glo
bulu
s2
age
4713
1326
2626
2626
2619
19
3si
lvic
ultu
refib
rew
ide
spac
ed,
prun
edw
ide
spac
ed,
prun
edth
inne
d, p
rune
d bu
tt lo
g
thin
ned,
pru
ned
uppe
r log
(u
npru
ned)
fibre
thin
ned,
pru
ned
butt
log
thin
ned,
pru
ned
uppe
r log
(u
npru
ned)
fibre
thin
ned,
pru
ned
butt
log
thin
ned,
pru
ned
butt
log
4lo
catio
nG
ipps
land
Gip
psla
ndG
ipps
land
Rid
gley
Rid
gley
Rid
gley
Rid
gley
Rid
gley
Rid
gley
Ulv
erst
one
Ulv
erst
one
5sa
wn
ITC
Hey
field
ITC
Hey
field
ITC
Hey
field
ITC
New
ood
ITC
New
ood
ITC
New
ood
Gun
nsG
unns
Gun
nsIT
C N
ewoo
dG
unns
6lo
g gr
ade
1$2
267
log
grad
e 2
$158
$259
$184
8lo
g gr
ade
3$1
18$1
529
log
grad
e 4
$120
$167
10lo
g gr
ade
5$1
19$1
4411
log
grad
e 6
$86
$75
12lo
g gr
ades
1-3
$174
$194
$184
13al
l log
gra
des
$143
$151
14lo
g gr
ade
1$3
40$2
78$4
22$2
94$4
18$2
0815
log
grad
e 2
$294
$295
$401
$297
$353
$221
16lo
g gr
ade
3$3
13$2
95$2
14$3
07$2
2717
log
grad
e 4
$158
$267
$219
$317
$244
18lo
g gr
ade
5$2
26$1
97$1
82$2
15$2
9819
log
grad
e 6
$63
$178
20lo
g gr
ade
1$3
08$2
52$3
82$2
60$3
95$1
8421
log
grad
e 2
$266
$268
$364
$262
$334
$195
22lo
g gr
ade
3$2
84$2
67$1
90$2
91$2
0123
log
grad
e 4
$144
$242
$193
$300
$215
24lo
g gr
ade
5$2
05$1
79$1
61$2
03$2
6325
log
grad
e 6
$57
$157
26lo
g gr
ade
1$2
57$2
45$3
37$2
32$3
77$1
8127
log
grad
e 2
$225
$261
$323
$231
$319
$193
28lo
g gr
ade
3$2
38$2
60$1
82$2
78$1
9829
log
grad
e 4
$125
$236
$176
$287
$213
30lo
g gr
ade
5$2
00$1
64$1
47$1
95$2
6031
log
grad
e 6
$54
$140
32lo
g gr
ades
1-3
$246
$260
$333
$231
$336
$191
33al
l log
gra
des
$241
$217
$242
$226
$330
$194
prod
uct v
alue
per
cub
ic
met
re o
f log
by
log
grad
e,
no a
llow
ance
for l
oss
to
boar
d en
d-sp
lit o
r end
-doc
k,
or i
nter
nal c
heck
prod
uct v
alue
per
cub
ic
met
re o
f log
by
log
grad
e al
low
ing
for v
olum
e lo
st to
bo
ard
end-
split
or e
nd-d
ock,
no
allo
wan
ce fo
r int
erna
l ch
eck
prod
uct v
alue
per
cub
ic
met
re o
f log
by
log
grad
e al
low
ing
for v
olum
e lo
st to
bo
ard
end-
split
or e
nd-d
ock,
an
d do
wn-
grad
e du
e to
in
tern
al c
heck
prod
uct v
alue
per
cub
ic
met
re o
f log
by
log
grad
e,
no a
llow
ance
for i
nter
nal
chec
k

31
$0
$50
$100
$150
$200
$250
$300
$350
$400
log grade 1 log grade 2 log grade 3 log grade 4 log grade 5 log grade 6
sawlog grade
prod
uct v
alue
(/m
3 lo
g)E. globulus 47yo - fibre - ITCHeyfield
,E. globulus 13yo - wide spacedpruned - ITC Heyfield
,E. nitens 13yo - wide spacedpruned - ITC Heyfield
E. nitens 26yo - thinned, prunedbutt log - ITC Newood
E. nitens 26yo - thinned, prunedupper log (unpruned) - ITCNewoodE. nitens 26yo - fibre - ITCNewood
,E. globulus 19yo - thinnedpruned butt log - ITC Newood
,E. globulus 19yo - thinnedpruned butt log - Gunns
E. nitens 26yo - thinned, prunedbutt log - Gunns
Figure 19: Total product value per cubic metre of sawlog, by log-grade and log type. Data reported in Table 15: ITC Heyfield ref. D6 to F11; ITC Newood and
Gunns Lindsay Street ref. G24 to N29.
Total product value per cubic metre of sawlog, by log-grade and log type
$0
$50
$100
$150
$200
$250
$300
log grade 1 log grade 2 log grade 3 log grade 4 log grade 5 log grade 6
sawlog grade
prod
uct v
alue
(/m
3 lo
g)
- E. globulus 47yo - fibreITC Heyfield
E. globulus 13yo - widespaced, pruned - ITCHeyfield
E. nitens 13yo - widespaced, pruned - ITCHeyfield
Figure 20: Total product value per cubic metre of sawlog, by log-grade and log
type - logs processed by ITC Heyfield. Data reported in Table 15: ref. D6 to F11.
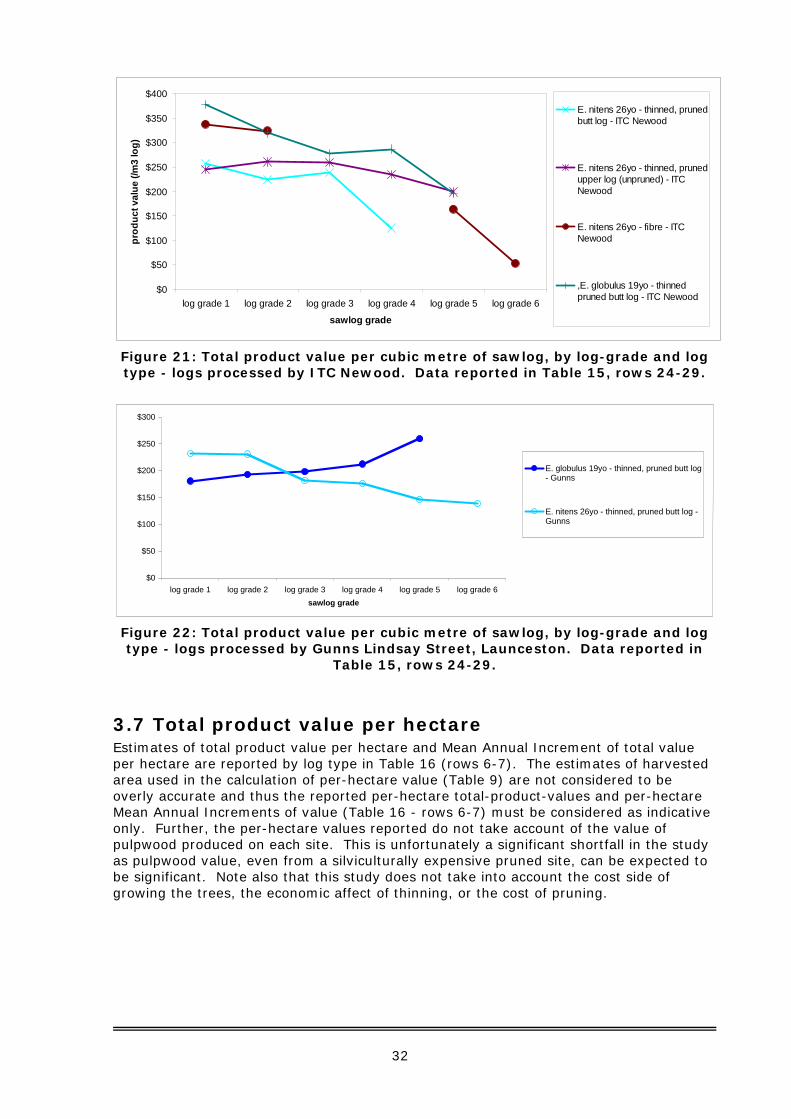
32
$0
$50
$100
$150
$200
$250
$300
$350
$400
log grade 1 log grade 2 log grade 3 log grade 4 log grade 5 log grade 6
sawlog grade
prod
uct v
alue
(/m
3 lo
g)
E. nitens 26yo - thinned, prunedbutt log - ITC Newood
E. nitens 26yo - thinned, prunedupper log (unpruned) - ITCNewood
E. nitens 26yo - fibre - ITCNewood
,E. globulus 19yo - thinnedpruned butt log - ITC Newood
Figure 21: Total product value per cubic metre of sawlog, by log-grade and log type - logs processed by ITC Newood. Data reported in Table 15, rows 24-29.
$0
$50
$100
$150
$200
$250
$300
log grade 1 log grade 2 log grade 3 log grade 4 log grade 5 log grade 6sawlog grade
E. globulus 19yo - thinned, pruned butt log- Gunns
E. nitens 26yo - thinned, pruned butt log -Gunns
Figure 22: Total product value per cubic metre of sawlog, by log-grade and log type - logs processed by Gunns Lindsay Street, Launceston. Data reported in
Table 15, rows 24-29.
3.7 Total product value per hectare Estimates of total product value per hectare and Mean Annual Increment of total value per hectare are reported by log type in Table 16 (rows 6-7). The estimates of harvested area used in the calculation of per-hectare value (Table 9) are not considered to be overly accurate and thus the reported per-hectare total-product-values and per-hectare Mean Annual Increments of value (Table 16 - rows 6-7) must be considered as indicative only. Further, the per-hectare values reported do not take account of the value of pulpwood produced on each site. This is unfortunately a significant shortfall in the study as pulpwood value, even from a silviculturally expensive pruned site, can be expected to be significant. Note also that this study does not take into account the cost side of growing the trees, the economic affect of thinning, or the cost of pruning.

33
Table 16: Total sawn-product value per hectare (not including pulpwood), and mean-annual-increment of total sawn-product value per hectare.
Note that the butt logs and the unpruned top logs came from the same stand and thus there is a single combined per-hectare estimate for these log types (cells G-H: 8-9).
REF
AB
CD
EF
GH
IJ
KL
MN
1sp
ecie
sE.
glo
bulu
sE.
glo
bulu
sE.
nite
nsE.
nite
nsE.
nite
nsE.
nite
nsE.
nite
nsE.
nite
nsE.
nite
nsE.
glo
bulu
sE.
glo
bulu
s2
age
4713
1326
2626
2626
2619
19
3si
lvic
ultu
refib
rew
ide
spac
ed,
prun
edw
ide
spac
ed,
prun
edth
inne
d, p
rune
d bu
tt lo
g
thin
ned,
pru
ned
uppe
r log
(u
npru
ned)
fibre
thin
ned,
pru
ned
butt
log
thin
ned,
pru
ned
uppe
r log
(u
npru
ned)
fibre
thin
ned,
pru
ned
butt
log
thin
ned,
pru
ned
butt
log
4lo
catio
nG
ipps
land
Gip
psla
ndG
ipps
land
Rid
gley
Rid
gley
Rid
gley
Rid
gley
Rid
gley
Rid
gley
Ulv
erst
one
Ulv
erst
one
5sa
wn
ITC
Hey
field
ITC
Hey
field
ITC
Hey
field
ITC
New
ood
ITC
New
ood
ITC
New
ood
Gun
nsG
unns
Gun
nsIT
C N
ewoo
dG
unns
6sa
wn
prod
uct v
alue
per
ha
$9,6
42$8
,217
$8,5
37$3
7,81
2$2
7,10
8$4
1,51
5$3
5,73
2$1
8,41
5$1
0,91
67
MAI
saw
n va
lue
per h
ecta
re$2
05$6
32$6
57$1
,454
$1,0
43$1
,597
$1,3
74$9
69$5
758
saw
n pr
oduc
t val
ue p
er h
a9
MAI
saw
n va
lue
per h
ecta
re$1
06,4
34$4
,094

34
3.8 Estimated mill-door log value Table 17 presents the estimated delivered mill-door value of a cubic metre of sawlog. The mill-door values represent the total value of sawn product from a cubic metre of log (excluding sold woodchips in this case) less the cost of sawing including an element of profit.
The mill door prices have been calculated using CSIROMILL with a module representing a hypothetical hardwood sawmill located in south-eastern Australia. This module was developed after widespread consultation with the hardwood processing industry in Australia and represents a modern processing system incorporating many of the characteristics of the ITC mill at Newood, Geeveston, Tasmania.
CSIROMILL is a financial analysis system that simultaneously calculates Net Present Value, Internal Rates of Return and Mill Door log values, in a time series analysis over 16 years using real Australian dollars. Some details of the data used for calculations are given in the Appendix 6. The sixteen year period represents an investment cycle at the end of which the mill is either sold off or re-investment is undertaken to upgrade the mill for further production. Depreciation rates for the various components of the mill are given in the Appendix 6.
It is assumed for this analysis that there is 100% equity in the mill and that a taxation rate of 30% is applied to any profit.
The product values per cubic metre of log input obtained from the trials were used to generate the returns. For this analysis wood chip values have not been included and sawdust is assumed to be used for fuel at the mill.
The analysis produced by the CSIROMILL system requires that the Internal Rate of Return be around 20-25% considering the use of real capital and the risks associated with a new plantation-based resource.
Assumptions underlying the estimated mill-door values are detailed in Appendix 6.
Assuming stumpage of around $90 per cubic metre of pruned sawlog and $50 per cubic metre of unpruned sawlog (after Volker et al. 2005) and harvesting and transport of around $50 per cubic metre (unconfirmed industry estimate), mill door value (Table 17) would need to be around $100 to $140 per cubic metre. The analysis indicates:
• Logs from the thinned-pruned E. globulus at Ulverstone are worth processing in a Newood-style sawmill, down to and including log grade 4. The mill-door log values shown in Table 17 (reference M6:9 and M12:15) are greater than $100 to $140 per cubic metre for these grades. This is providing the mill scale is 40,000 m3 per year log intake. At the lower log volume intake modelled (30,500 m3/year) unit sawing costs are higher (not tabulated) and mill-door log values are reduced (Table 17, reference M18:21 and M24:27);
• That the butt logs of the Ridgley thinned-pruned E. nitens are not worth processing in a Newood-style sawmill, as none of the log grades were predicted to have value greater than the $100 per m3 threshold (Table 17, column G); and
• The unpruned top logs from the Ridgley thinned-pruned E. nitens appear to be marginally better than the butt logs.
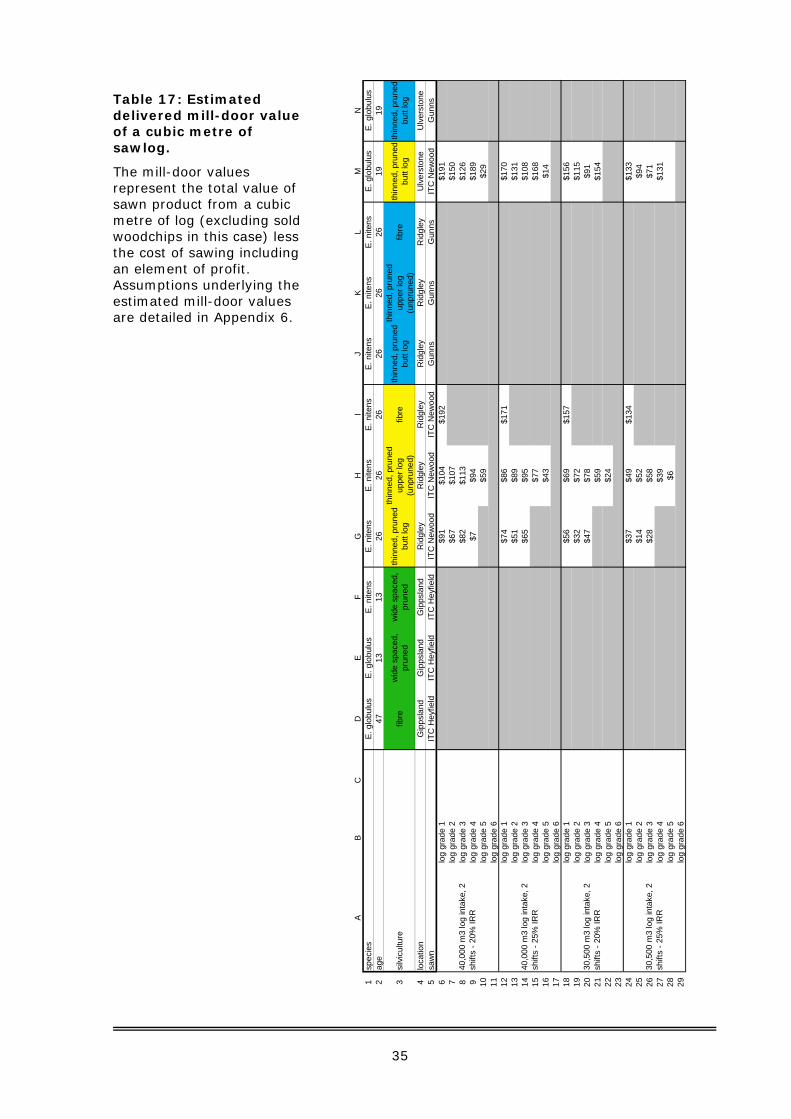
35
Table 17: Estimated delivered mill-door value of a cubic metre of sawlog.
The mill-door values represent the total value of sawn product from a cubic metre of log (excluding sold woodchips in this case) less the cost of sawing including an element of profit. Assumptions underlying the estimated mill-door values are detailed in Appendix 6.
A
BC
DE
FG
HI
JK
LM
N1
spec
ies
E. g
lobu
lus
E. g
lobu
lus
E. n
itens
E. n
itens
E. n
itens
E. n
itens
E. n
itens
E. n
itens
E. n
itens
E. g
lobu
lus
E. g
lobu
lus
2ag
e47
1313
2626
2626
2626
1919
3si
lvic
ultu
refib
rew
ide
spac
ed,
prun
edw
ide
spac
ed,
prun
edth
inne
d, p
rune
d bu
tt lo
g
thin
ned,
pru
ned
uppe
r log
(u
npru
ned)
fibre
thin
ned,
pru
ned
butt
log
thin
ned,
pru
ned
uppe
r log
(u
npru
ned)
fibre
thin
ned,
pru
ned
butt
log
thin
ned,
pru
ned
butt
log
4lo
catio
nG
ipps
land
Gip
psla
ndG
ipps
land
Rid
gley
Rid
gley
Rid
gley
Rid
gley
Rid
gley
Rid
gley
Ulv
erst
one
Ulv
erst
one
5sa
wn
ITC
Hey
field
ITC
Hey
field
ITC
Hey
field
ITC
New
ood
ITC
New
ood
ITC
New
ood
Gun
nsG
unns
Gun
nsIT
C N
ewoo
dG
unns
6lo
g gr
ade
1$9
1$1
04$1
92$1
917
log
grad
e 2
$67
$107
$150
8lo
g gr
ade
3$8
2$1
13$1
269
log
grad
e 4
$7$9
4$1
8910
log
grad
e 5
$59
$29
11lo
g gr
ade
612
log
grad
e 1
$74
$86
$171
$170
13lo
g gr
ade
2$5
1$8
9$1
3114
log
grad
e 3
$65
$95
$108
15lo
g gr
ade
4$7
7$1
6816
log
grad
e 5
$43
$14
17lo
g gr
ade
618
log
grad
e 1
$56
$69
$157
$156
19lo
g gr
ade
2$3
2$7
2$1
1520
log
grad
e 3
$47
$78
$91
21lo
g gr
ade
4$5
9$1
5422
log
grad
e 5
$24
23lo
g gr
ade
624
log
grad
e 1
$37
$49
$134
$133
25lo
g gr
ade
2$1
4$5
2$9
426
log
grad
e 3
$28
$58
$71
27lo
g gr
ade
4$3
9$1
3128
log
grad
e 5
$629
log
grad
e 6
30,5
00 m
3 lo
g in
take
, 2
shift
s - 2
5% IR
R
40,0
00 m
3 lo
g in
take
, 2
shift
s - 2
0% IR
R
40,0
00 m
3 lo
g in
take
, 2
shift
s - 2
5% IR
R
30,5
00 m
3 lo
g in
take
, 2
shift
s - 2
0% IR
R
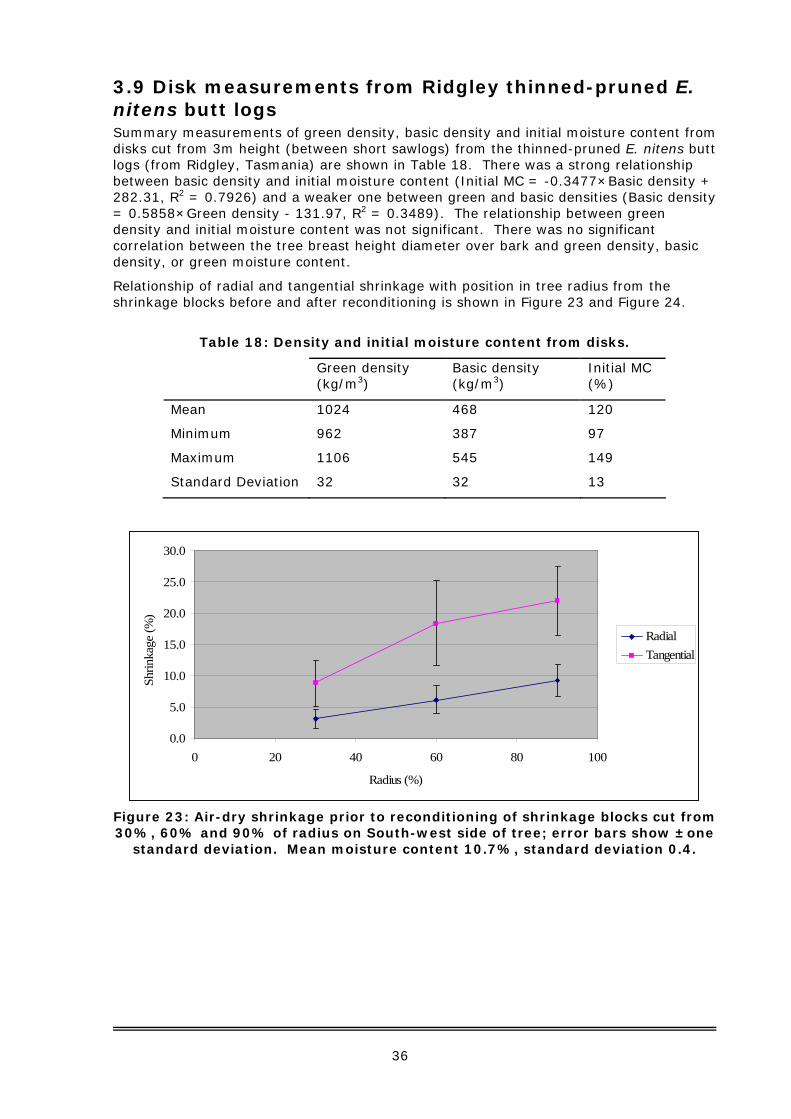
36
3.9 Disk measurements from Ridgley thinned-pruned E. nitens butt logs Summary measurements of green density, basic density and initial moisture content from disks cut from 3m height (between short sawlogs) from the thinned-pruned E. nitens butt logs (from Ridgley, Tasmania) are shown in Table 18. There was a strong relationship between basic density and initial moisture content (Initial MC = -0.3477×Basic density + 282.31, R2 = 0.7926) and a weaker one between green and basic densities (Basic density = 0.5858×Green density - 131.97, R2 = 0.3489). The relationship between green density and initial moisture content was not significant. There was no significant correlation between the tree breast height diameter over bark and green density, basic density, or green moisture content.
Relationship of radial and tangential shrinkage with position in tree radius from the shrinkage blocks before and after reconditioning is shown in Figure 23 and Figure 24.
Table 18: Density and initial moisture content from disks.
Green density (kg/m3)
Basic density (kg/m3)
Initial MC (%)
Mean 1024 468 120
Minimum 962 387 97
Maximum 1106 545 149
Standard Deviation 32 32 13
0.0
5.0
10.0
15.0
20.0
25.0
30.0
0 20 40 60 80 100
Radius (%)
Shrin
kage
(%)
RadialTangential
Figure 23: Air-dry shrinkage prior to reconditioning of shrinkage blocks cut from 30%, 60% and 90% of radius on South-west side of tree; error bars show ±one
standard deviation. Mean moisture content 10.7%, standard deviation 0.4.
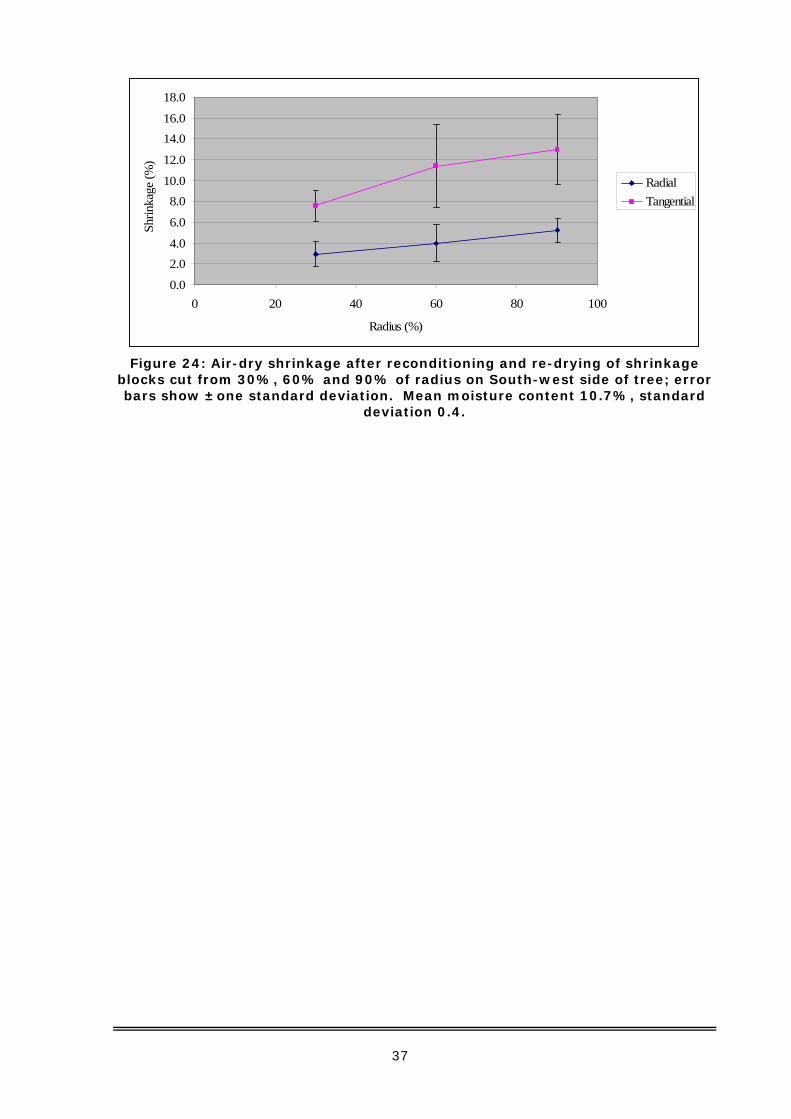
37
0.0
2.04.0
6.0
8.010.0
12.0
14.016.0
18.0
0 20 40 60 80 100
Radius (%)
Shrin
kage
(%)
RadialTangential
Figure 24: Air-dry shrinkage after reconditioning and re-drying of shrinkage
blocks cut from 30%, 60% and 90% of radius on South-west side of tree; error bars show ±one standard deviation. Mean moisture content 10.7%, standard
deviation 0.4.
38
4.0 Discussions and conclusions The objectives of this project were to assess the economics of processing plantation eucalypts of known origin using current industry-standard equipment and procedures and identify the factors most directly affecting the value of dry output given current market conditions.
Eucalypt plantation forestry has developed rapidly in Australia in recent years. In 2005, the nation’s hardwood plantation estate was estimated at 715,531 hectares (National Forest Inventory 2005). Much of the existing resource in southern Australia is made up of two species E. globulus (mainly in Western Australia and Victoria) and the more frost-resistant E. nitens (mainly in Tasmania). While most of this resource is managed to provide logs for the pulp and paper industry, approximately 17.5% is managed for sawlogs (Nolan et al. 2005). Also, there is potential for fibre managed and future plantations to provide logs for the production of sawn timber.
When the project began, it was believed that stands of trees of harvestable age (between 20 and 35 years old) of the major plantation species, E. nitens and E. globulus, would be available in Victoria and Tasmania. This proved incorrect. A survey of forest owners in each state showed that hardwood plantations grown on a sawlog silvicultural regime (thinned and pruned) of a harvestable age are very rare. As a consequence, the plantation resources studied in this project were selected from only a short list of suitable trial coupes. Still, the silviculture and age of the stands sampled was not what is currently regarded as optimal. For example, the Ridgley plantation was pruned too late, hence more defect was pushed into the clearwood from the knotty core than would otherwise be expected from early pruned stems.
Study of the overall economics of producing sawn wood from plantation eucalypts is very open-ended due to the number of variables that occur at each stage of the growth and production process. This study sought to control these variables by focusing on the two main eucalypt plantation species in southern Australia, E. nitens and E. globulus, milling the recovered logs into appearance products at industry-standard hardwood production facilities: a mill specifically designed for a smaller regrowth log resource (ITC Newood) and two conventional large logs mills (ITC Heyfield and Gunns Lindsay Street), and drying the material in both conventional drying yards (ITC Heyfield and ITC Mowbray) and in recently commissioned predryers (Gunns Lindsay Street).
Considerable detail on the material processed, recoveries achieved and the factors most directly affecting the value of dry output is included in Section 3 and the attached appendices. In summarising this data, the major findings of the study are that:
• the sawn recovery is dependant on the milling equipment available. Predictably, total dry recovery from the newer ITC Newood mill was significantly higher from the same resource than the conventional mills. Production was also quicker. ITC Newood achieved a dry recovery of 40% from 26-year-old thinned-pruned E. nitens butt logs milling them at a rate of 15.4 m3/hour. Gunns Lindsay Street recovered 34% at a rate of 12.5 m3/hour. The comparisons are similar for the E. globulus butt logs with recoveries of 37% and 29% respectively. Mill details are in Section 2.3.
• the value of solid products recovered from the thinned and pruned E. globulus logs and probably logs salvaged from the fibre-managed E. nitens stands, is likely to be sufficient for the both the grower and processor to make a suitable return. That is, the value of recovered products less the costs of sawmilling (including profit), is higher than the estimated delivered mill-door cost of the sawlogs;
• Growing and processing the thinned and pruned E. nitens was marginal or uneconomic, mainly due to the loss of value from internal checking, especially of the butt log.
39
• Significant loss in the value of dry output resulted from internal check, especially in E. nitens, and board distortion, especially in E. globulus. These are discussed in greater detail below.
There are several major conditions on these results, namely:
• The value of sawn and milled boards from the plantation species is assumed in this study to be the same as current native regrowth boards. Industry members involved in the study strongly suggested that as E. nitens or E. globulus are not currently major commercial species, this may not be the case. They believe that factors such as the colour, grain and hardness may limit market acceptance and affect value. They believe that the material's performance and acceptance in use needs to be confirmed;
• The value of by-products, such as solid woodchips, is generally excluded. Closer attention to residue and by-product values is necessary as modelling the overall economic performance of a long term crop like trees requires significant assumptions regarding general economic conditions over a timeframe of up to a quarter of a century.
• The impact of future production processes or end-products is very hard to determine. It is difficult to gauge the possible commercial implications of new or very different products that may contribute to whole-of-forest value, whether they be the focus of production, such as sawn appearance or structural material, or by-products, such as fibreboards, fibre, energy, or carbon storage;
• The cost of harvesting, handling and sorting plantation material for different product groups in a mature industry is unclear. Current plantation harvesting methods focus on handling large numbers of smaller pulp logs and experience with harvesting a larger diameter, even age resource is rare. Efficiency improvements in mechanically harvesting both pulp and sawlogs are likely.
Finally, today’s market situation will be different in the future and the effect of this change may influence the results of this study. It is known that log supply will be different (Nolan et al. 2005). Supply of full rotation age plantation hardwood saw logs is projected to grow only slowly till beyond 2015 while the supply of native forest material is projected to fall. The market for hardwood products is changing and is likely to change further. It can be expected that long straight lengths of select native forest hardwood will be increasingly difficult to obtain and attract an increased premium. Higher levels of feature and possibly distortion will become more common and may be more widely accepted. Market perceptions and relevant performance Standards may change to reflect this.
4.1 Loss of value
4.1.1 Internal Check Internal checking is a serious and unrecoverable drying defect in high-value appearance timber. Occurring inside the board, it is often only found when boards are fully dried and machined and much of the cost of production has been borne.
There was a high level of internal check in the Tasmanian E. nitens butt logs harvested from both the fibre-managed and thinned and pruned stands. 25-31% displayed minimal check while between 6-17% showed moderate/heavy check. The check classed as minimal was still sufficient to be a serious defect and be grade limiting. The rate was consistent for air-dried and predried material. Internal check in the E. nitens top logs and the E. globulus was significantly less.

40
The internal check observed was similar to that commonly seen in native forest material, particularly regrowth Victorian Ash, where it is normally found in discrete earlywood growth-rings that tended to be wider than adjacent growth-rings.
The high level of internal check observed is of serious concern as:
• the trees from which the boards were cut were the product of an expensive silvicultural regimes, including pruning, designed for the express purpose of clearwood production; and
• this regime is similar to the regime adopted by major growers in managing E. nitens plantations for clearwood log production.
This trial indicates that between 15 and 40% of boards from similar thinned and pruned full-rotation E. nitens can be expected to contain significant levels of internal check if dried with current industry technology. If this is the case, it may be marginal or uneconomic to mill these logs into the high value appearance products for which they were grown.
The situation could be even worse in full-scale production. The results of this trial were obtained from 2.7 m long logs. This study and other anecdotal evidence suggest that internal check is more prevalent in the butt end of trees. So, if 5.4 m logs were milled into long length boards, potentially up to twice as much of the board volume (if graded at full length) could be affected by internal check.
Internal check may potentially be reduced in the short to medium term by tuning processing regimes, particularly drying, and perhaps by using novel technologies to sort or treat material before it is dried. In the long term, breeding programmes may also reduce occurrence of this defect as there is some evidence that it is a heritable characteristic.
If the rate of internal check in the E. nitens butt log could be constrained to the rate found in the E. globulus, it is likely that the E. nitens could be processed economically, as higher recoveries of select material could be expected from pruned logs.
4.1.2 Board distortion Distortion is changes in the shape of a board away from a flat, straight evenly shaped piece. It includes cup, bow, twist, spring or a combination of these. Value is lost when distortion affects satisfactory milling into the required profile or the spring or bow of the milled board is outside of the product tolerances established in Australian Standard 2796.
In this study, there was an unexpected high loss in recovery when skim-dressed boards were milled into final products, especially of E. globulus. Current industry experience appears to be that some improvement in grade recovery can be expected from milling rough-sawn or skim-dressed boards. The results in Section 3.6.1 indicate a reverse of this.
This casts doubt on assumptions of board and value recovery based on the assessment of skim-dressed material only.
At the Tasmanian sawmills E. globulus boards appeared to suffer more distortion through the drying process than E. nitens boards. This is highlighted in the high incidence of downgrade of E. globulus boards due to boards not meeting dimensional requirements. For example, 12% of sawn volume from the thinned-pruned E. nitens butt logs was rejected and 30% of sawn volume from the thinned-pruned E. globulus butt logs was rejected. The high level of reject was due to formed tongue-and-groove boards having pieces of the tongue or groove missing making the boards unacceptable at any grade under the relevant Australian standard.
Quartersawn boards of both species cut at normal full length (5.4 – 6.0 m) can be expected to incur significant downgrade from spring distortion when graded to current Australian Standards 2796 for high quality machined products.

41
Like internal check, distortion may potentially be reduced by tuning processing regimes, particularly drying regimes and sawing allowances. In the long term, improvements in silviculture and breeding may reduce occurrences of the stresses in the wood that contribute to this defect.
4.2 Other observations Other observations from the study include:
• There was an unexpectedly high recovery of high-value Select grade material from unpruned top logs when compared with pruned butt logs from the same trees. This appears to be mostly due to internal checking exposed during machining of butt log material.
• An apparently high recovery of Select grade material from pulp log managed E. nitens processed at ITC could not be verified by processing at Gunns Ltd due to mixing of material during processing. This deserves further attention. Pruning adds significantly to the cost of growing trees. It appears possible that trees planted at a high stand density may self-prune to a reasonable extent, producing a reasonable volume of clearwood from a proportion of the long rotation stand.
• The ratio of tangential to radial shrinkage was high at slightly over two. This suggests that the material is likely to experience cupping with changes in environmental conditions in service, particularly for backsawn boards.
4.3 Conclusions The results of the study indicate that future, economically-viable production of high value traditionally sawn products from these types of plantations will require:
• different processing techniques to provide better control over value-limiting factors such as distortion, collapse and internal checking.
• sawing equipment optimised to handle this resource.
If these technical issues can be overcome sufficiently to justify capital outlay on tooling, some optimism can be held for the future of an industry based on production of both new and existing sawn products from a suitably managed plantation resource.
Further research is needed to:
• address value-limiting factors of internal check, collapse and distortion:
o while growing the resource, through improvement in breeding and silvicultural techniques; and
o after milling, through refining drying and milling processes;
• better quantify whole-of-process product values; and
• clarify recovery of sawn appearance material from full rotation, high stand density unpruned E.nitens and E.globulus.
Research that involves processing a plantation resource through facilities clearly unable to optimally handle or process the raw material is unlikely to yield encouraging results.
42
References National Forest Inventory (2005). National Plantation Inventory 2005 Update, Bureau of Rural Sciences, Canberra.
Nolan, G, Greaves, BL, Washusen, R*, Parsons, M*, Jennings, SM, (2005). Eucalypt Plantations for Solid Wood Products in Australia - A Review: If you don't prune it, we can't use it, Forest & Wood Products Research & Development Corporation
Standards Australia (1999). Australian Standard AS2796: Timber – Hardwood – Sawn and Milled Products. Standards Australia, Sydney.
Volker, P.W., Greaves, B.L. and Wood, M. (2005). Silvicultural Management of Eucalypt Plantations for Solid Wood and Engineered Wood Products - Experience from Tasmania, Australia. IUFRO Conference, China. October 2005
Washusen, R. (2006). Evaluation of product value and sawing and drying efficiencies of low rainfall hardwood thinnings. A report for the RIRDC/Land & Water Australia/FWPRDC/MDBC Joint Venture Agroforestry Program. In press. January 2006. pp 43.
Washusen, R. and McCormick, M. (2002). Recovery potential of quarter-sawn solid wood products from regrowth and plantation-grown Eucalyptus nitens. CSIRO-FFP Client report No. 1227 for NRE. December 2002. pp 15.
Washusen, R., Reeves, K., Hingston, R. Davis, S. Menz, D. and Morrow, A. (2004). Processing pruned and un-pruned blue gum (Eucalyptus globulus) to produce high value products. Forest and Wood Products Research and Development Corporation Report PN03.1315. pp. 27.
Waugh, G. (2004). Growing Eucalyptus globulus for high quality sawn products. In Eucalyptus in a changing world - International IUFRO Conference of the WP2.08.03 on Silviculture and Improvement of Eucalypts, Portugal.
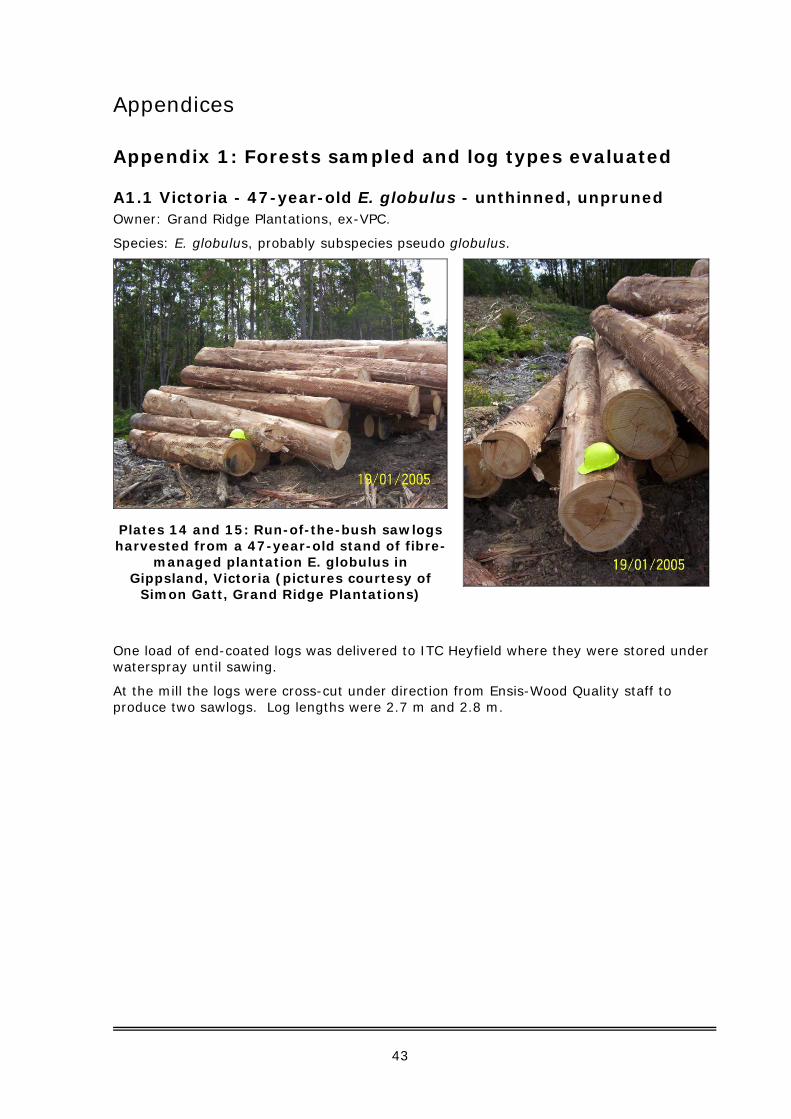
43
Appendices
Appendix 1: Forests sampled and log types evaluated
A1.1 Victoria - 47-year-old E. globulus - unthinned, unpruned Owner: Grand Ridge Plantations, ex-VPC.
Species: E. globulus, probably subspecies pseudo globulus.
Plates 14 and 15: Run-of-the-bush sawlogs harvested from a 47-year-old stand of fibre-
managed plantation E. globulus in Gippsland, Victoria (pictures courtesy of
Simon Gatt, Grand Ridge Plantations)
One load of end-coated logs was delivered to ITC Heyfield where they were stored under waterspray until sawing.
At the mill the logs were cross-cut under direction from Ensis-Wood Quality staff to produce two sawlogs. Log lengths were 2.7 m and 2.8 m.
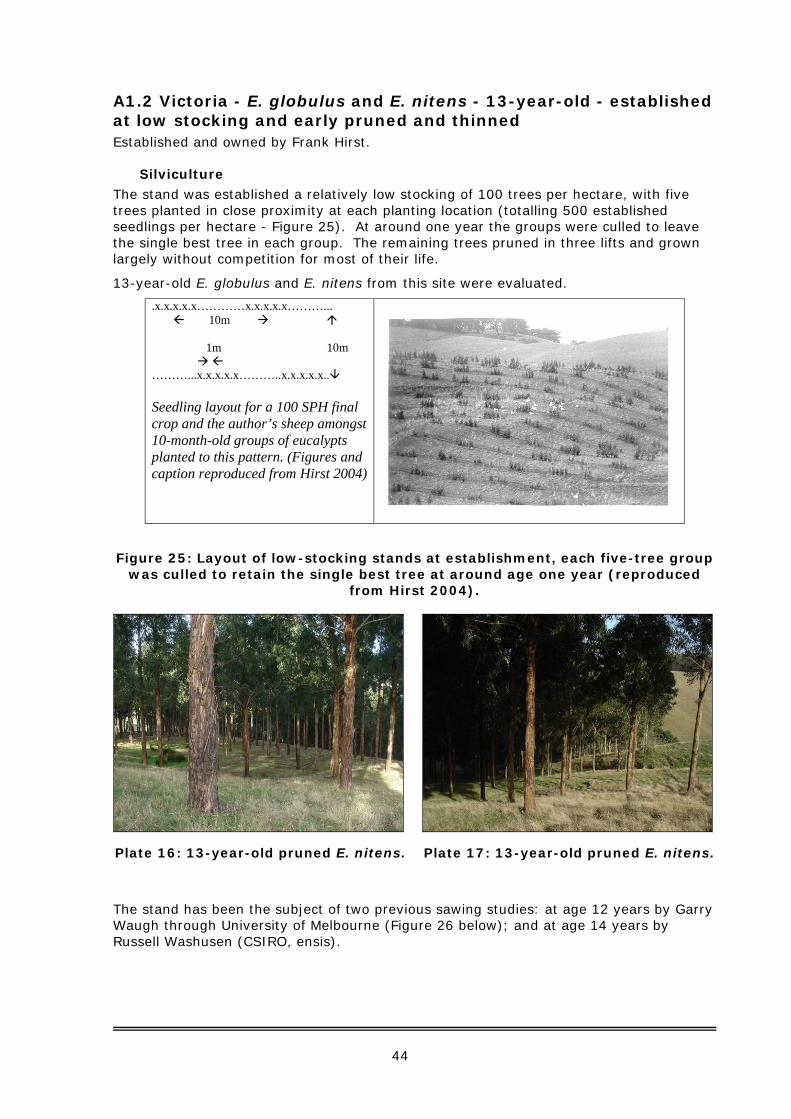
44
A1.2 Victoria - E. globulus and E. nitens - 13-year-old - established at low stocking and early pruned and thinned Established and owned by Frank Hirst.
Silviculture The stand was established a relatively low stocking of 100 trees per hectare, with five trees planted in close proximity at each planting location (totalling 500 established seedlings per hectare - Figure 25). At around one year the groups were culled to leave the single best tree in each group. The remaining trees pruned in three lifts and grown largely without competition for most of their life.
13-year-old E. globulus and E. nitens from this site were evaluated.
.x.x.x.x.x…………x.x.x.x.x………... 10m 1m 10m ………...x.x.x.x.x………..x.x.x.x.x.. Seedling layout for a 100 SPH final crop and the author’s sheep amongst 10-month-old groups of eucalypts planted to this pattern. (Figures and caption reproduced from Hirst 2004)
Figure 25: Layout of low-stocking stands at establishment, each five-tree group was culled to retain the single best tree at around age one year (reproduced
from Hirst 2004).
Plate 16: 13-year-old pruned E. nitens.
Plate 17: 13-year-old pruned E. nitens.
The stand has been the subject of two previous sawing studies: at age 12 years by Garry Waugh through University of Melbourne (Figure 26 below); and at age 14 years by Russell Washusen (CSIRO, ensis).
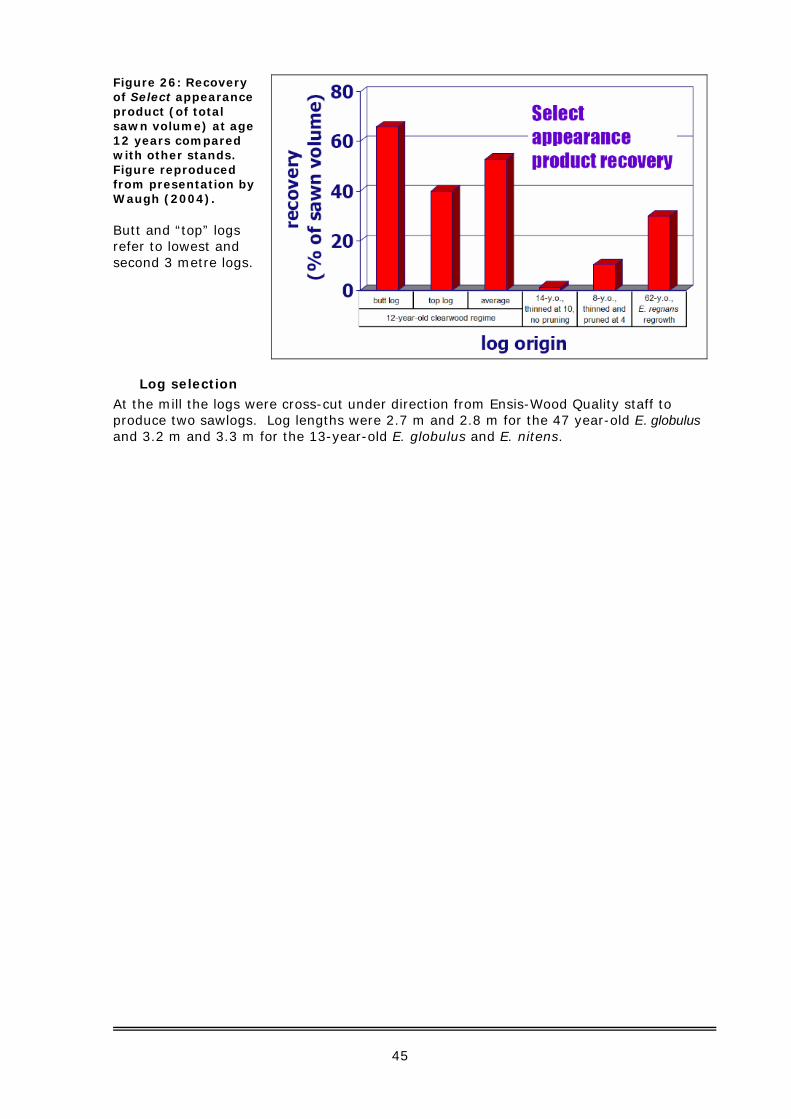
45
Figure 26: Recovery of Select appearance product (of total sawn volume) at age 12 years compared with other stands. Figure reproduced from presentation by Waugh (2004).
Butt and “top” logs refer to lowest and second 3 metre logs.
Log selection
At the mill the logs were cross-cut under direction from Ensis-Wood Quality staff to produce two sawlogs. Log lengths were 2.7 m and 2.8 m for the 47 year-old E. globulus and 3.2 m and 3.3 m for the 13-year-old E. globulus and E. nitens.

46
A1.3 Tasmania - E. nitens - 26-year-old - thinned and pruned and control (no thinning or pruning) - Gunns’ - Ridgley The sampled trees were part of a Gunns Ltd plantation at St George’s Rd, Ridgley in north-west Tasmania (Plate 18 to Plate 21). The site was fairly sheltered from prevailing south-west winds. The thinned and pruned trees were surrounded on all sides by approximately six rows of unthinned and unpruned trees, which were sampled as fibre-grown. Edge trees were not sampled for sawlog due to heavy branching.
Silviculture The stand was established in 1979 at 3 m × 3 m spacing, an estimated actual initial stocking 1070 stems per hectare. Two varieties were planted: Mt St Gwinear, Victoria (78% of planted trees) and Anemdo Forest, Southern NSW (22% of planted trees).
The thinned and pruned part of the stand had the following treatment applied:
• Pruned to 2.1 m height early in 1985 (age 5.5 years);
• Pruned to 4.2 m height late in 1985, non-commercial thinned to 450 sph (age 6 years); and
• Pruned to 6.3 m height early in 1986, non-commercial thinned to 220 sph (age 6.5 years).
At time of harvest, there was approximately one hectare of thinned and pruned trees. Surrounding this was approximately 1.5 ha of unthinned and unpruned trees with approximately 420 sph surviving. Approximately one-third of the stand was felled for this project.
Plate 18: 26-y.o. stands viewed from a
distance beyond replanted E. nitens plantation.
Plate 19: Trees in the thinned and
pruned portion of the stand.
The thinned and pruned stand has been subject to studies of pruning-induced decay by Forestry Tasmania and others.
The site may not be representative of sawlog-managed sites in Tasmania generally due to early-age disease infestations here.
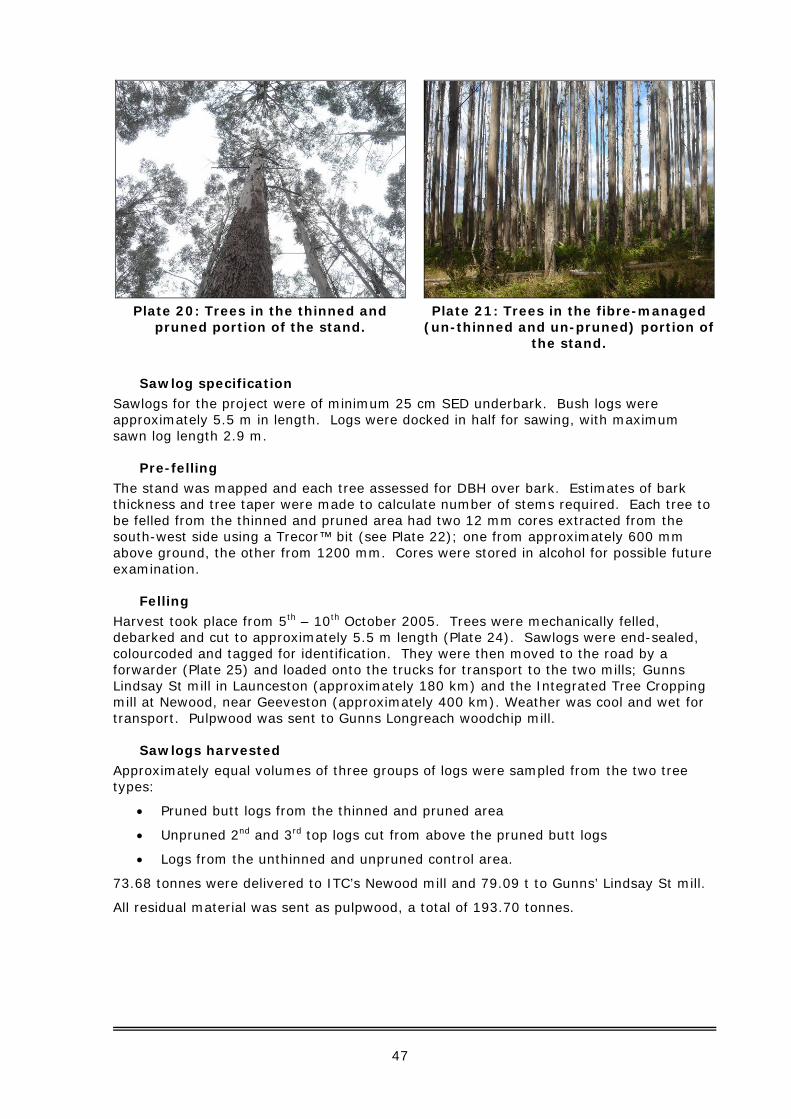
47
Plate 20: Trees in the thinned and
pruned portion of the stand.
Plate 21: Trees in the fibre-managed
(un-thinned and un-pruned) portion of the stand.
Sawlog specification
Sawlogs for the project were of minimum 25 cm SED underbark. Bush logs were approximately 5.5 m in length. Logs were docked in half for sawing, with maximum sawn log length 2.9 m.
Pre-felling
The stand was mapped and each tree assessed for DBH over bark. Estimates of bark thickness and tree taper were made to calculate number of stems required. Each tree to be felled from the thinned and pruned area had two 12 mm cores extracted from the south-west side using a Trecor™ bit (see Plate 22); one from approximately 600 mm above ground, the other from 1200 mm. Cores were stored in alcohol for possible future examination.
Felling
Harvest took place from 5th – 10th October 2005. Trees were mechanically felled, debarked and cut to approximately 5.5 m length (Plate 24). Sawlogs were end-sealed, colourcoded and tagged for identification. They were then moved to the road by a forwarder (Plate 25) and loaded onto the trucks for transport to the two mills; Gunns Lindsay St mill in Launceston (approximately 180 km) and the Integrated Tree Cropping mill at Newood, near Geeveston (approximately 400 km). Weather was cool and wet for transport. Pulpwood was sent to Gunns Longreach woodchip mill.
Sawlogs harvested Approximately equal volumes of three groups of logs were sampled from the two tree types:
• Pruned butt logs from the thinned and pruned area
• Unpruned 2nd and 3rd top logs cut from above the pruned butt logs
• Logs from the unthinned and unpruned control area.
73.68 tonnes were delivered to ITC’s Newood mill and 79.09 t to Gunns’ Lindsay St mill.
All residual material was sent as pulpwood, a total of 193.70 tonnes.
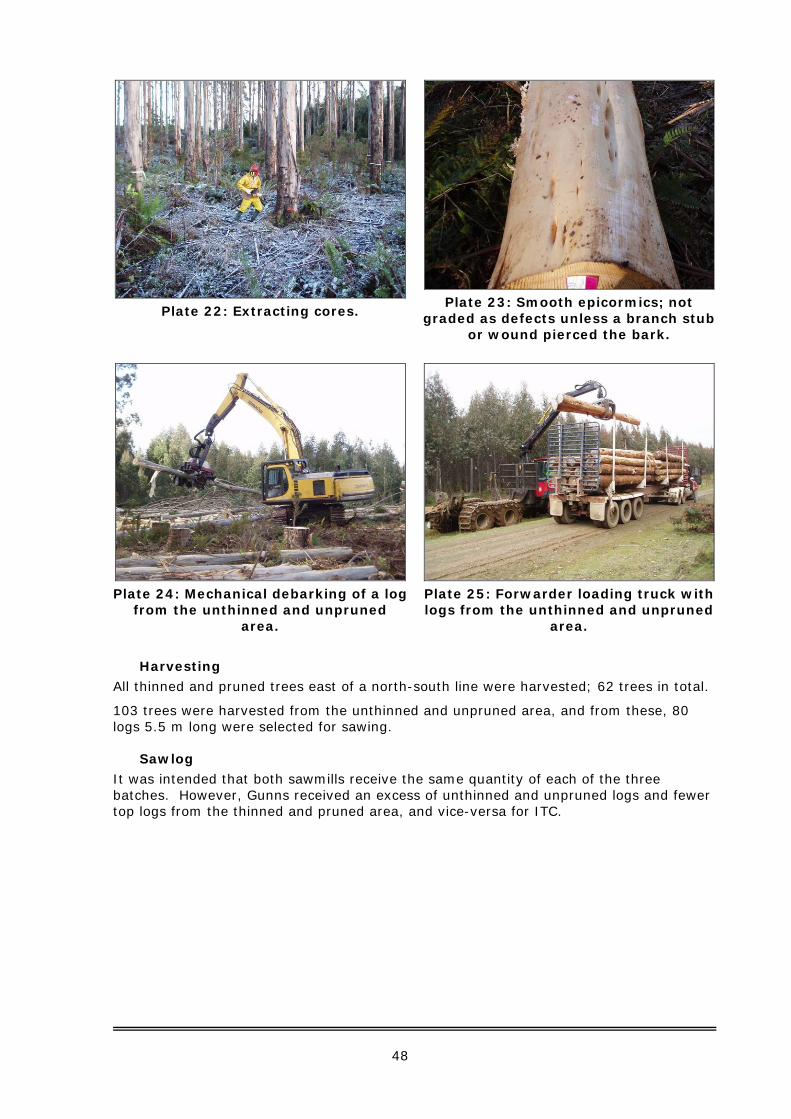
48
Plate 22: Extracting cores.
Plate 23: Smooth epicormics; not
graded as defects unless a branch stub or wound pierced the bark.
Plate 24: Mechanical debarking of a log
from the unthinned and unpruned area.
Plate 25: Forwarder loading truck with logs from the unthinned and unpruned
area.
Harvesting All thinned and pruned trees east of a north-south line were harvested; 62 trees in total.
103 trees were harvested from the unthinned and unpruned area, and from these, 80 logs 5.5 m long were selected for sawing.
Sawlog It was intended that both sawmills receive the same quantity of each of the three batches. However, Gunns received an excess of unthinned and unpruned logs and fewer top logs from the thinned and pruned area, and vice-versa for ITC.

49
A1.4 Tasmania - E. globulus - 19-year-old - early thinned and pruned - Ulverstone The sampled trees were situated on a farm at Ulverstone. The coupe was 3.2 ha, situated on a north–facing hillside. The stand was clearfelled with all merchantable volume.
Silviculture The following information was provided by Private Forests Tasmania. The site was prepared in 1984/85 with rip and mound work and spraying for weed control. The plantation was established at approximately 1,000 SPH with extensive replanting the following year to replace failed stock. First and second pruning lifts were carried out in 1988 and 1989. The stand was thinned in 1989/90 using chemical and a gas axe, reducing stocking to approximately 260 SPH. An inventory plot in 1993 indicated 263 SPH with average DBH of 25.5 cm, average height of 17.8 m with a mean annual increment of 16.5 m3/ha/yr. Current annual increment at the time was 34.5 m3/ha/yr, indicating that the trees were still actively growing.
Plates 26 and 27: 19-year-old thinned
and pruned Eucalyptus globulus plantation at Ulverstone, Tasmania.
Harvesting
The stand of approximately 1280 trees was clearfelled and 55 stems selected for 5.5 m long sawlogs. The remainder of the material, 512.02 tonnes, was sent for woodchips.
Harvest took place from 23-28 November 2005. Trees were mechanically felled, debarked and cut to approximately 5.5 m length (Plate 32). They were then moved to an accessible area by a forwarder (Plate 33) and loaded onto the trucks for transport to the two mills: Gunns’ Lindsay St mill in Launceston (approximately 130 km); and ITC mill at Newood, near Geeveston (approximately 350 km). Logs for Gunns were end-sealed with Dussek-Campbell Log-Shield prior to transport, but unfortunately logs for ITC were not. Pulpwood was sent to Tasfibre’s Bell Bay woodchip mill.
One truckload of sawlog was sent to each of the two Tasmanian sawmills.
Several of the trees were not pruned to sufficient height; some of the sawlogs exhibited significant butt swell (Plate 28) and/or defects associated with presence of unpruned high
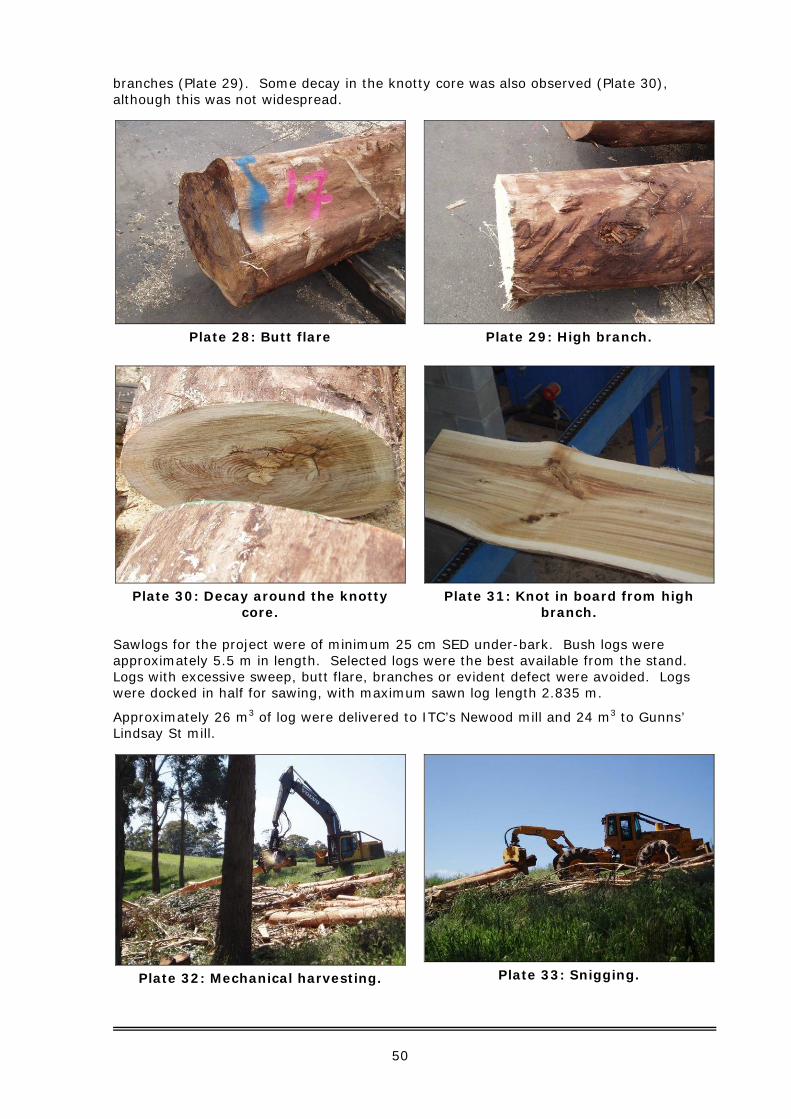
50
branches (Plate 29). Some decay in the knotty core was also observed (Plate 30), although this was not widespread.
Plate 28: Butt flare
Plate 29: High branch.
Plate 30: Decay around the knotty
core.
Plate 31: Knot in board from high
branch.
Sawlogs for the project were of minimum 25 cm SED under-bark. Bush logs were approximately 5.5 m in length. Selected logs were the best available from the stand. Logs with excessive sweep, butt flare, branches or evident defect were avoided. Logs were docked in half for sawing, with maximum sawn log length 2.835 m.
Approximately 26 m3 of log were delivered to ITC’s Newood mill and 24 m3 to Gunns’ Lindsay St mill.
Plate 32: Mechanical harvesting.
Plate 33: Snigging.

51
Appendix 2: Summary of appearance grading criteria by ITC Ltd DEFECT 1. SELECT 2. STANDARD (Medium
Feature) 3. MERCH (High Feature)
Graded To: 2 Faces/2 Edges 1 Face/2 Edges Worst Face
Internal Check Not Permitted Not Permitted No Limitation
Surface Checks Not Allowed Not to exceed 2mm in depth
No Limitation
Sound Knots/Burls
No greater than 20mm wide or 1/6 of width. One per 2m in length
No greater than 30mm wide or ¼ of width. One in any 1m length.
No Limitation
Tight Gum Vein Not greater than 2mm wide, and not exceeding ½ aggregate length of board.
Not greater than 5mm wide, and not exceeding aggregate length of board.
No Limitation
Loose Gum Vein Not Permitted Not greater than 3mm wide, not intersecting an end. Aggregate length 1/6 of board.
Not greater than 5mm wide, and not exceeding aggregate length of board.
Brown Stain Slight No Limitation No Limitation
Hobnail No Limitation No Limitation No Limitation
Gum Pockets Not Permitted No greater than 6mm wide. Length max 75mm. Not exceeding 1 per 1500mm of length.
No Limitation
Black Speck Slight No Limitation No Limitation
Pinholes and Holes
Not Permitted No greater than 3mm in diameter. 6 per 100x100 area and not associated with decay.
Scattered
Decay Not Permitted Not Permitted Not Permitted
Heart Wood Not Permitted Not Permitted No Limitation
End Splits Not exceeding
12mm in length
Not exceeding 12mm in length
Up to 150mm in length
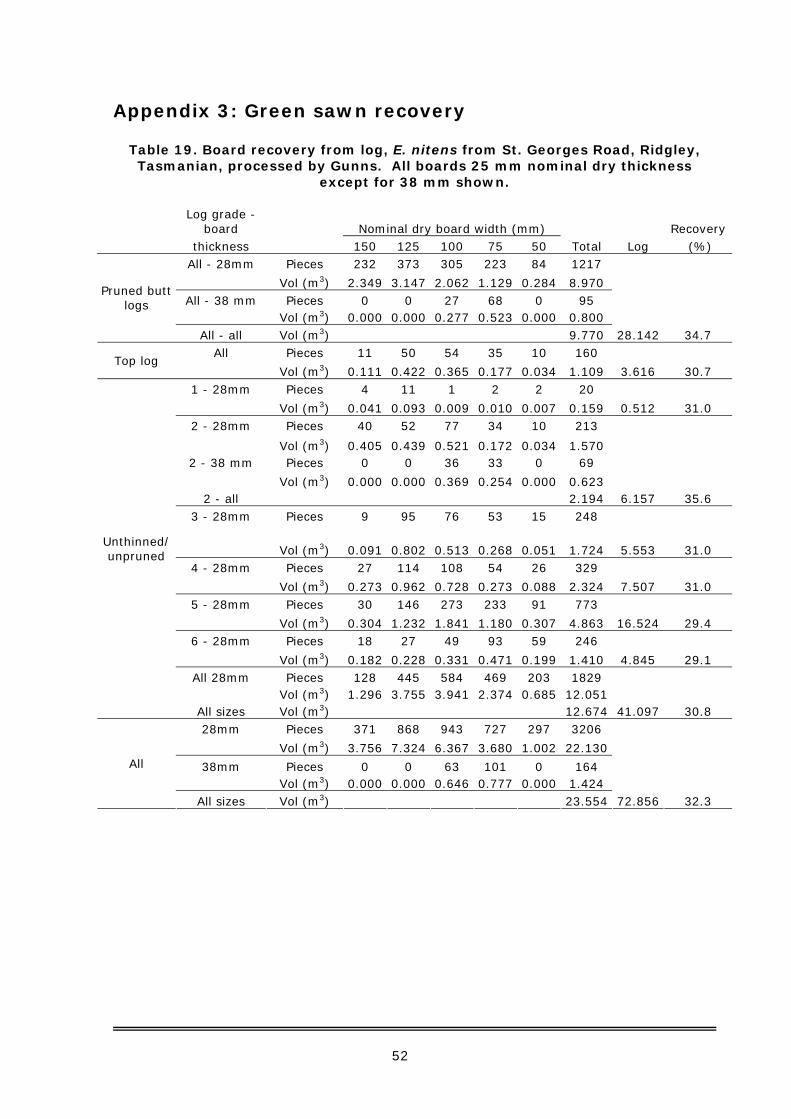
52
Appendix 3: Green sawn recovery
Table 19. Board recovery from log, E. nitens from St. Georges Road, Ridgley, Tasmanian, processed by Gunns. All boards 25 mm nominal dry thickness
except for 38 mm shown.
Log grade - board Nominal dry board width (mm) Recovery
thickness 150 125 100 75 50 Total Log (%) All - 28mm Pieces 232 373 305 223 84 1217
Vol (m3) 2.349 3.147 2.062 1.129 0.284 8.970 All - 38 mm Pieces 0 0 27 68 0 95
Vol (m3) 0.000 0.000 0.277 0.523 0.000 0.800
Pruned butt logs
All - all Vol (m3) 9.770 28.142 34.7 All Pieces 11 50 54 35 10 160
Top log Vol (m3) 0.111 0.422 0.365 0.177 0.034 1.109 3.616 30.7
1 - 28mm Pieces 4 11 1 2 2 20
Vol (m3) 0.041 0.093 0.009 0.010 0.007 0.159 0.512 31.0 2 - 28mm Pieces 40 52 77 34 10 213
Vol (m3) 0.405 0.439 0.521 0.172 0.034 1.570 2 - 38 mm Pieces 0 0 36 33 0 69
Vol (m3) 0.000 0.000 0.369 0.254 0.000 0.623 2 - all 2.194 6.157 35.6
3 - 28mm Pieces 9 95 76 53 15 248
Vol (m3) 0.091 0.802 0.513 0.268 0.051 1.724 5.553 31.0 4 - 28mm Pieces 27 114 108 54 26 329
Vol (m3) 0.273 0.962 0.728 0.273 0.088 2.324 7.507 31.0 5 - 28mm Pieces 30 146 273 233 91 773
Vol (m3) 0.304 1.232 1.841 1.180 0.307 4.863 16.524 29.4 6 - 28mm Pieces 18 27 49 93 59 246
Vol (m3) 0.182 0.228 0.331 0.471 0.199 1.410 4.845 29.1 All 28mm Pieces 128 445 584 469 203 1829
Vol (m3) 1.296 3.755 3.941 2.374 0.685 12.051
Unthinned/ unpruned
All sizes Vol (m3) 12.674 41.097 30.8 28mm Pieces 371 868 943 727 297 3206
Vol (m3) 3.756 7.324 6.367 3.680 1.002 22.130
38mm Pieces 0 0 63 101 0 164 Vol (m3) 0.000 0.000 0.646 0.777 0.000 1.424
All
All sizes Vol (m3) 23.554 72.856 32.3

53
Table 20. Board recovery from log, E. nitens from St. Georges Road, Ridgley, Tasmanian, processed by ITC. All boards 25 mm nominal dry thickness.
Log Board nominal dry width (mm) Recovery grade 200 150 125 100 75 50 Total Log (%)
Thinned 1 Pieces 3 255 203 150 85 73 769 32 pruned Vol (m3) 0.041 2.623 1.740 1.029 0.437 0.250 6.121 15.536 39.4
butt 2 Pieces 0 77 110 111 57 44 399 18 logs Vol (m3) 0.000 0.788 0.938 0.758 0.292 0.150 2.926 7.295 40.1
3 Pieces 0 15 31 28 12 7 93 5 Vol (m3) 0.000 0.153 0.264 0.191 0.061 0.024 0.693 1.719 40.3 4 Pieces 0 11 5 11 27 14 68 5 Vol (m3) 0 0.112 0.042 0.075 0.137 0.047 0.414 1.128 36.7
Unpruned 1 Pieces 0 1 4 8 5 2 20 1 top Vol (m3) 0 0.010 0.034 0.054 0.025 0.007 0.131 0.320 40.8 logs 2 Pieces 0 25 11 9 2 3 50 2
Vol (m3) 0 0.262 0.096 0.063 0.010 0.010 0.442 1.006 44.0 3 Pieces 2 94 80 63 38 28 305 13 Vol (m3) 0.028 0.974 0.691 0.435 0.197 0.097 2.420 5.712 42.4 4 Pieces 1 102 92 82 62 32 371 16 Vol (m3) 0.014 1.059 0.796 0.568 0.322 0.111 2.870 6.602 43.5 5 Pieces 0 206 357 413 222 109 1307 68 Vol (m3) 0.000 2.145 3.098 2.867 1.156 0.378 9.644 23.793 40.5
Unthinned 1 Pieces 2 39 29 32 17 14 133 5 unpruned Vol (m3) 0.027 0.398 0.247 0.218 0.087 0.048 1.023 2.549 40.2
logs 2 Pieces 0 15 15 18 9 6 63 2 Vol (m3) 0.000 0.153 0.127 0.122 0.046 0.020 0.469 1.074 43.6 5 Pieces 0 11 29 65 56 39 200 11 Vol (m3) 0.000 0.112 0.247 0.442 0.286 0.133 1.219 3.297 37.0 6 Pieces 0 0 0 9 14 3 26 2 Vol (m3) 0.000 0.000 0.000 0.061 0.071 0.010 0.141 0.367 38.5
Total Pieces 8 851 966 999 606 374 3804 180 Vol (m3) 0.110 8.790 8.320 6.881 3.127 1.286 28.513 70.399 40.5
Table 21. Board recovery from log, E. globulus from Ulverstone, Tasmanian, processed by Gunns. Boards 25 mm nominal dry thickness.
Log Board nominal dry width (mm) Recovery grade 150 125 100 75 50 Total Log (%)
1 Pieces 40 62 91 23 5 221 10
Vol (m3) 0.405 0.523 0.614 0.116 0.017 1.676 5.067 33.1 2 Pieces 82 142 216 31 10 481 28
Vol (m3) 0.830 1.198 1.458 0.157 0.034 3.677 11.946 30.8 3 Pieces 33 50 89 23 6 201 12
Vol (m3) 0.334 0.422 0.601 0.116 0.020 1.493 4.824 31.0 4 Pieces 23 27 23 8 4 85 5
Vol (m3) 0.233 0.228 0.155 0.041 0.014 0.670 1.958 34.2 5 Pieces 2 3 8 1 0 14 1
Vol (m3) 0.020 0.025 0.054 0.005 0.000 0.105 0.273 38.4 Total Pieces 180 284 427 86 25 1002 56
Vol (m3) 1.823 2.396 2.882 0.435 0.084 7.621 24.069 31.7
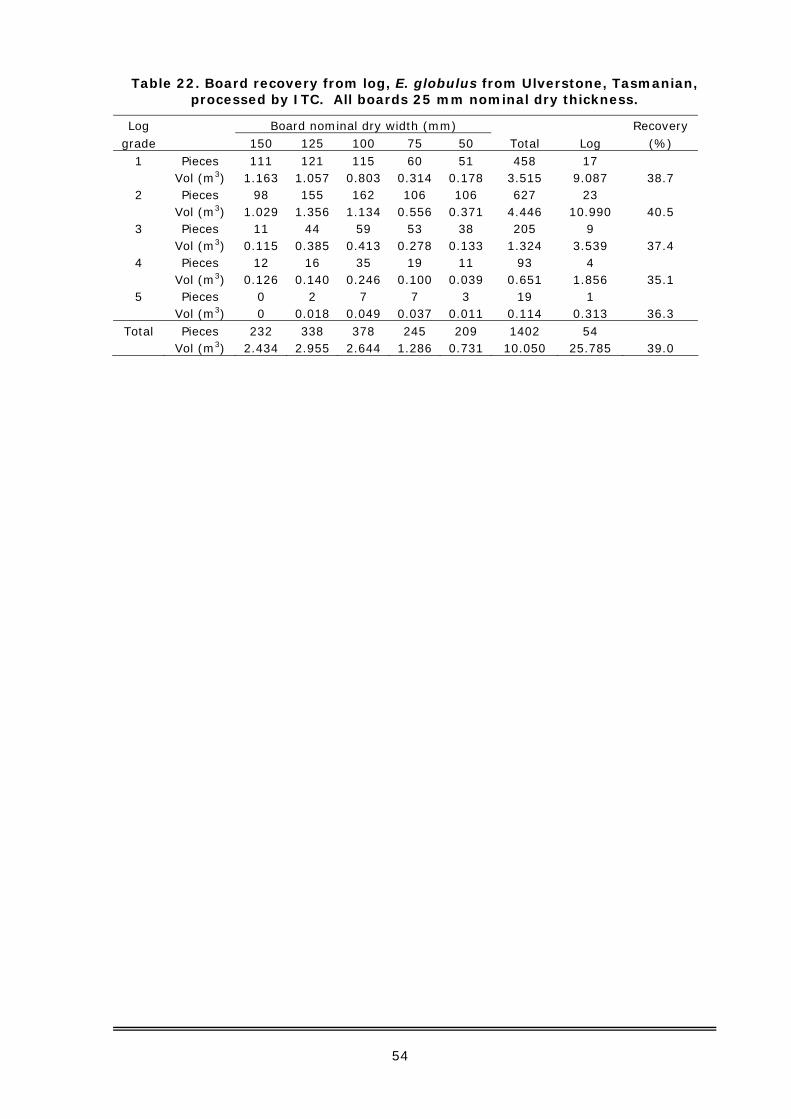
54
Table 22. Board recovery from log, E. globulus from Ulverstone, Tasmanian, processed by ITC. All boards 25 mm nominal dry thickness.
Log Board nominal dry width (mm) Recovery grade 150 125 100 75 50 Total Log (%)
1 Pieces 111 121 115 60 51 458 17 Vol (m3) 1.163 1.057 0.803 0.314 0.178 3.515 9.087 38.7 2 Pieces 98 155 162 106 106 627 23 Vol (m3) 1.029 1.356 1.134 0.556 0.371 4.446 10.990 40.5 3 Pieces 11 44 59 53 38 205 9 Vol (m3) 0.115 0.385 0.413 0.278 0.133 1.324 3.539 37.4 4 Pieces 12 16 35 19 11 93 4 Vol (m3) 0.126 0.140 0.246 0.100 0.039 0.651 1.856 35.1 5 Pieces 0 2 7 7 3 19 1 Vol (m3) 0 0.018 0.049 0.037 0.011 0.114 0.313 36.3
Total Pieces 232 338 378 245 209 1402 54 Vol (m3) 2.434 2.955 2.644 1.286 0.731 10.050 25.785 39.0

55
Appendix 4: Sawn board recovery by board grade, nominal board width and log grade Recovery is defined as the volume of sawn boards, without allowance for volume that would be lost/docked off the ends of boards, assuming boards to be 2.7m long, with the minimum graded length of 1.8m (i.e. if a 1.8m length of Select grade wood occurs a board would be graded as Select-grade independent of the defects occurring outside the 1.8m select length).
Areas shaded grey indicate no available results.
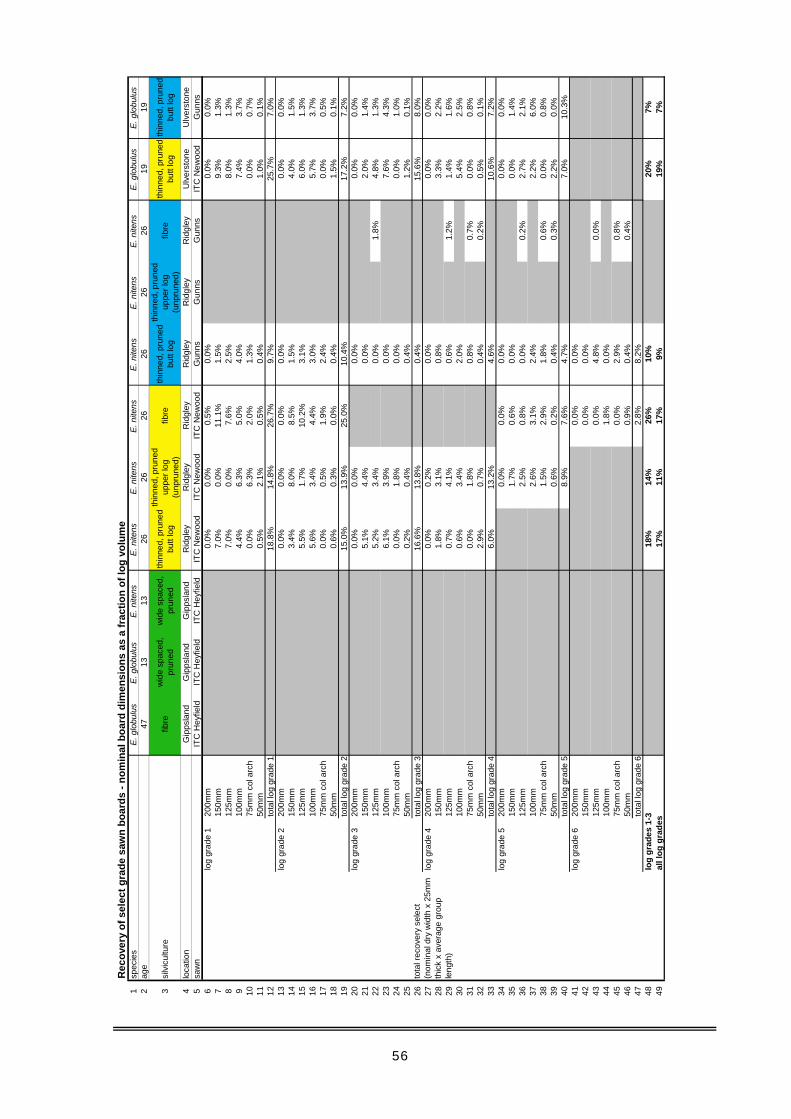
56
Rec
over
y of
sel
ect g
rade
saw
n bo
ards
- no
min
al b
oard
dim
ensi
ons
as a
frac
tion
of lo
g vo
lum
e1
spec
ies
E. g
lobu
lus
E. g
lobu
lus
E. n
itens
E. n
itens
E. n
itens
E. n
itens
E. n
itens
E. n
itens
E. n
itens
E. g
lobu
lus
E. g
lobu
lus
2ag
e47
1313
2626
2626
2626
1919
3si
lvic
ultu
refib
rew
ide
spac
ed,
prun
edw
ide
spac
ed,
prun
edth
inne
d, p
rune
d bu
tt lo
g
thin
ned,
pru
ned
uppe
r log
(u
npru
ned)
fibre
thin
ned,
pru
ned
butt
log
thin
ned,
pru
ned
uppe
r log
(u
npru
ned)
fibre
thin
ned,
pru
ned
butt
log
thin
ned,
pru
ned
butt
log
4lo
catio
nG
ipps
land
Gip
psla
ndG
ipps
land
Rid
gley
Rid
gley
Rid
gley
Rid
gley
Rid
gley
Rid
gley
Ulv
erst
one
Ulv
erst
one
5sa
wn
ITC
Hey
field
ITC
Hey
field
ITC
Hey
field
ITC
New
ood
ITC
New
ood
ITC
New
ood
Gun
nsG
unns
Gun
nsIT
C N
ewoo
dG
unns
6lo
g gr
ade
120
0mm
0.0%
0.0%
0.5%
0.0%
0.0%
0.0%
715
0mm
7.0%
0.0%
11.1
%1.
5%9.
3%1.
3%8
125m
m7.
0%0.
0%7.
6%2.
5%8.
0%1.
3%9
100m
m4.
4%6.
3%5.
0%4.
0%7.
4%3.
7%10
75m
m c
ol a
rch
0.0%
6.3%
2.0%
1.3%
0.0%
0.7%
1150
mm
0.5%
2.1%
0.5%
0.4%
1.0%
0.1%
12to
tal l
og g
rade
118
.8%
14.8
%26
.7%
9.7%
25.7
%7.
0%13
log
grad
e 2
200m
m0.
0%0.
0%0.
0%0.
0%0.
0%0.
0%14
150m
m3.
4%8.
0%8.
5%1.
5%4.
0%1.
5%15
125m
m5.
5%1.
7%10
.2%
3.1%
6.0%
1.3%
1610
0mm
5.6%
3.4%
4.4%
3.0%
5.7%
3.7%
1775
mm
col
arc
h0.
0%0.
5%1.
9%2.
4%0.
0%0.
5%18
50m
m0.
6%0.
3%0.
0%0.
4%1.
5%0.
1%19
tota
l log
gra
de 2
15.0
%13
.9%
25.0
%10
.4%
17.2
%7.
2%20
log
grad
e 3
200m
m0.
0%0.
0%0.
0%0.
0%0.
0%21
150m
m5.
1%4.
4%0.
0%2.
0%1.
4%22
125m
m5.
2%3.
4%0.
0%1.
8%4.
8%1.
3%23
100m
m6.
1%3.
9%0.
0%7.
6%4.
3%24
75m
m c
ol a
rch
0.0%
1.8%
0.0%
0.0%
1.0%
2550
mm
0.2%
0.4%
0.4%
1.2%
0.1%
26to
tal l
og g
rade
316
.6%
13.8
%0.
4%15
.6%
8.0%
27lo
g gr
ade
420
0mm
0.0%
0.2%
0.0%
0.0%
0.0%
2815
0mm
1.8%
3.1%
0.8%
3.3%
2.2%
2912
5mm
0.7%
4.1%
0.6%
1.2%
1.4%
1.6%
3010
0mm
0.6%
3.4%
2.0%
5.4%
2.5%
3175
mm
col
arc
h0.
0%1.
8%0.
8%0.
7%0.
0%0.
8%32
50m
m2.
9%0.
7%0.
4%0.
2%0.
5%0.
1%33
tota
l log
gra
de 4
6.0%
13.2
%4.
6%10
.6%
7.2%
34lo
g gr
ade
520
0mm
0.0%
0.0%
0.0%
0.0%
0.0%
3515
0mm
1.7%
0.6%
0.0%
0.0%
1.4%
3612
5mm
2.5%
0.8%
0.0%
0.2%
2.7%
2.1%
3710
0mm
2.6%
3.1%
2.4%
2.2%
6.0%
3875
mm
col
arc
h1.
5%2.
9%1.
8%0.
6%0.
0%0.
8%39
50m
m0.
6%0.
2%0.
4%0.
3%2.
2%0.
0%40
tota
l log
gra
de 5
8.9%
7.6%
4.7%
7.0%
10.3
%41
log
grad
e 6
200m
m0.
0%0.
0%42
150m
m0.
0%0.
0%43
125m
m0.
0%4.
8%0.
0%44
100m
m1.
8%0.
0%45
75m
m c
ol a
rch
0.0%
2.9%
0.8%
4650
mm
0.9%
0.4%
0.4%
47to
tal l
og g
rade
62.
8%8.
2%48
log
grad
es 1
-318
%14
%26
%10
%20
%7%
49al
l log
gra
des
17%
11%
17%
9%19
%7%
tota
l rec
over
y se
lect
(n
omin
al d
ry w
idth
x 2
5mm
th
ick
x av
erag
e gr
oup
leng
th)
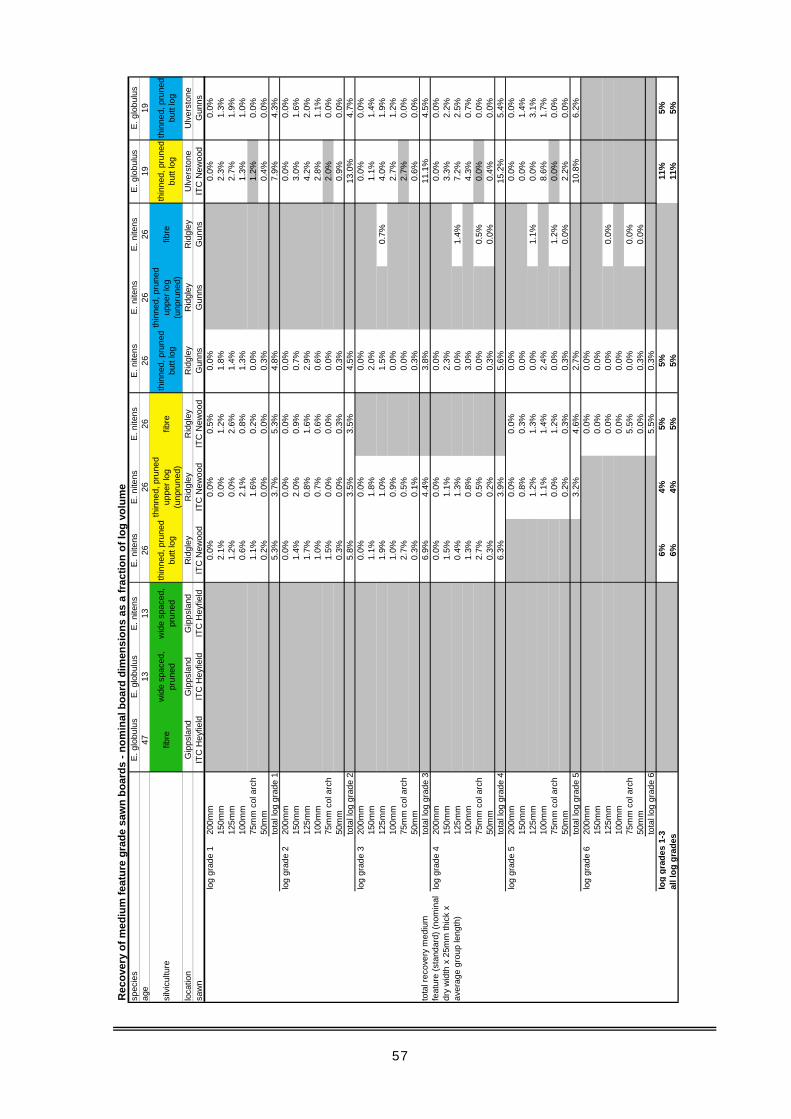
57
Rec
over
y of
med
ium
feat
ure
grad
e sa
wn
boar
ds -
nom
inal
boa
rd d
imen
sion
s as
a fr
actio
n of
log
volu
me
spec
ies
E. g
lobu
lus
E. g
lobu
lus
E. n
itens
E. n
itens
E. n
itens
E. n
itens
E. n
itens
E. n
itens
E. n
itens
E. g
lobu
lus
E. g
lobu
lus
age
4713
1326
2626
2626
2619
19
silv
icul
ture
fibre
wid
e sp
aced
, pr
uned
wid
e sp
aced
, pr
uned
thin
ned,
pru
ned
butt
log
thin
ned,
pru
ned
uppe
r log
(u
npru
ned)
fibre
thin
ned,
pru
ned
butt
log
thin
ned,
pru
ned
uppe
r log
(u
npru
ned)
fibre
thin
ned,
pru
ned
butt
log
thin
ned,
pru
ned
butt
log
loca
tion
Gip
psla
ndG
ipps
land
Gip
psla
ndR
idgl
eyR
idgl
eyR
idgl
eyR
idgl
eyR
idgl
eyR
idgl
eyU
lver
ston
eU
lver
ston
esa
wn
ITC
Hey
field
ITC
Hey
field
ITC
Hey
field
ITC
New
ood
ITC
New
ood
ITC
New
ood
Gun
nsG
unns
Gun
nsIT
C N
ewoo
dG
unns
log
grad
e 1
200m
m0.
0%0.
0%0.
5%0.
0%0.
0%0.
0%15
0mm
2.1%
0.0%
1.2%
1.8%
2.3%
1.3%
125m
m1.
2%0.
0%2.
6%1.
4%2.
7%1.
9%10
0mm
0.6%
2.1%
0.8%
1.3%
1.3%
1.0%
75m
m c
ol a
rch
1.1%
1.6%
0.2%
0.0%
1.2%
0.0%
50m
m0.
2%0.
0%0.
0%0.
3%0.
4%0.
0%to
tal l
og g
rade
15.
3%3.
7%5.
3%4.
8%7.
9%4.
3%lo
g gr
ade
220
0mm
0.0%
0.0%
0.0%
0.0%
0.0%
0.0%
150m
m1.
4%2.
0%0.
9%0.
7%3.
0%1.
6%12
5mm
1.7%
0.8%
1.6%
2.9%
4.2%
2.0%
100m
m1.
0%0.
7%0.
6%0.
6%2.
8%1.
1%75
mm
col
arc
h1.
5%0.
0%0.
0%0.
0%2.
0%0.
0%50
mm
0.3%
0.0%
0.3%
0.3%
0.9%
0.0%
tota
l log
gra
de 2
5.8%
3.5%
3.5%
4.5%
13.0
%4.
7%lo
g gr
ade
320
0mm
0.0%
0.0%
0.0%
0.0%
0.0%
150m
m1.
1%1.
8%2.
0%1.
1%1.
4%12
5mm
1.9%
1.0%
1.5%
0.7%
4.0%
1.9%
100m
m1.
0%0.
9%0.
0%2.
7%1.
2%75
mm
col
arc
h2.
7%0.
5%0.
0%2.
7%0.
0%50
mm
0.3%
0.1%
0.3%
0.6%
0.0%
tota
l log
gra
de 3
6.9%
4.4%
3.8%
11.1
%4.
5%lo
g gr
ade
420
0mm
0.0%
0.0%
0.0%
0.0%
0.0%
150m
m1.
5%1.
1%2.
3%3.
3%2.
2%12
5mm
0.4%
1.3%
0.0%
1.4%
7.2%
2.5%
100m
m1.
3%0.
8%3.
0%4.
3%0.
7%75
mm
col
arc
h2.
7%0.
5%0.
0%0.
5%0.
0%0.
0%50
mm
0.3%
0.2%
0.3%
0.0%
0.4%
0.0%
tota
l log
gra
de 4
6.3%
3.9%
5.6%
15.2
%5.
4%lo
g gr
ade
520
0mm
0.0%
0.0%
0.0%
0.0%
0.0%
150m
m0.
8%0.
3%0.
0%0.
0%1.
4%12
5mm
1.2%
1.3%
0.0%
1.1%
0.0%
3.1%
100m
m1.
1%1.
4%2.
4%8.
6%1.
7%75
mm
col
arc
h0.
0%1.
2%0.
0%1.
2%0.
0%0.
0%50
mm
0.2%
0.3%
0.3%
0.0%
2.2%
0.0%
tota
l log
gra
de 5
3.2%
4.6%
2.7%
10.8
%6.
2%lo
g gr
ade
620
0mm
0.0%
0.0%
150m
m0.
0%0.
0%12
5mm
0.0%
0.0%
0.0%
100m
m0.
0%0.
0%75
mm
col
arc
h5.
5%0.
0%0.
0%50
mm
0.0%
0.3%
0.0%
tota
l log
gra
de 6
5.5%
0.3%
log
grad
es 1
-36%
4%5%
5%11
%5%
all l
og g
rade
s6%
4%5%
5%11
%5%
tota
l rec
over
y m
ediu
m
feat
ure
(sta
ndar
d) (n
omin
al
dry
wid
th x
25m
m th
ick
x av
erag
e gr
oup
leng
th)
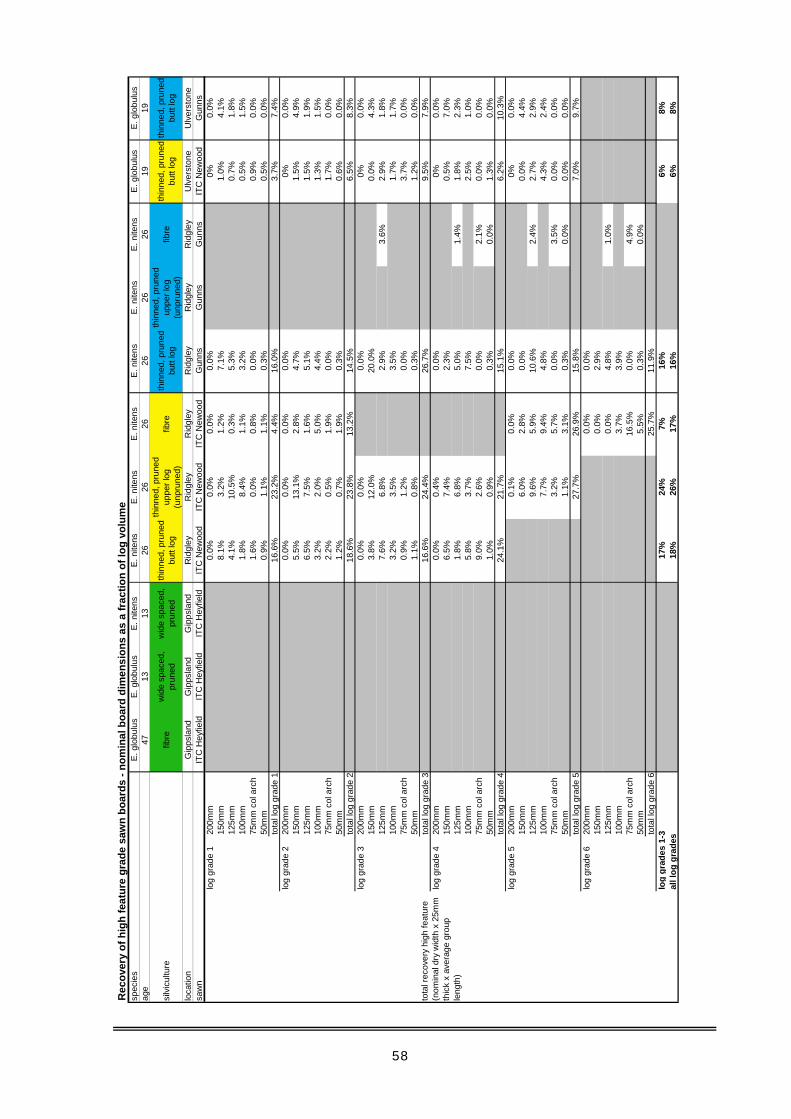
58
Rec
over
y of
hig
h fe
atur
e gr
ade
saw
n bo
ards
- no
min
al b
oard
dim
ensi
ons
as a
frac
tion
of lo
g vo
lum
esp
ecie
sE
. glo
bulu
sE.
glo
bulu
sE.
nite
nsE
. nite
nsE
. nite
nsE.
nite
nsE.
nite
nsE.
nite
nsE
. nite
nsE
. glo
bulu
sE
. glo
bulu
sag
e47
1313
2626
2626
2626
1919
silv
icul
ture
fibre
wid
e sp
aced
, pr
uned
wid
e sp
aced
, pr
uned
thin
ned,
pru
ned
butt
log
thin
ned,
pru
ned
uppe
r log
(u
npru
ned)
fibre
thin
ned,
pru
ned
butt
log
thin
ned,
pru
ned
uppe
r log
(u
npru
ned)
fibre
thin
ned,
pru
ned
butt
log
thin
ned,
pru
ned
butt
log
loca
tion
Gip
psla
ndG
ipps
land
Gip
psla
ndR
idgl
eyR
idgl
eyR
idgl
eyR
idgl
eyR
idgl
eyR
idgl
eyU
lver
ston
eU
lver
ston
esa
wn
ITC
Hey
field
ITC
Hey
field
ITC
Hey
field
ITC
New
ood
ITC
New
ood
ITC
New
ood
Gun
nsG
unns
Gun
nsIT
C N
ewoo
dG
unns
log
grad
e 1
200m
m0.
0%0.
0%0.
0%0.
0%0%
0.0%
150m
m8.
1%3.
2%1.
2%7.
1%1.
0%4.
1%12
5mm
4.1%
10.5
%0.
3%5.
3%0.
7%1.
8%10
0mm
1.8%
8.4%
1.1%
3.2%
0.5%
1.5%
75m
m c
ol a
rch
1.6%
0.0%
0.8%
0.0%
0.9%
0.0%
50m
m0.
9%1.
1%1.
1%0.
3%0.
5%0.
0%to
tal l
og g
rade
116
.6%
23.2
%4.
4%16
.0%
3.7%
7.4%
log
grad
e 2
200m
m0.
0%0.
0%0.
0%0.
0%0%
0.0%
150m
m5.
5%13
.1%
2.8%
4.7%
1.5%
4.9%
125m
m6.
5%7.
5%1.
6%5.
1%1.
5%1.
9%10
0mm
3.2%
2.0%
5.0%
4.4%
1.3%
1.5%
75m
m c
ol a
rch
2.2%
0.5%
1.9%
0.0%
1.7%
0.0%
50m
m1.
2%0.
7%1.
9%0.
3%0.
6%0.
0%to
tal l
og g
rade
218
.6%
23.8
%13
.2%
14.5
%6.
5%8.
3%lo
g gr
ade
320
0mm
0.0%
0.0%
0.0%
0%0.
0%15
0mm
3.8%
12.0
%20
.0%
0.0%
4.3%
125m
m7.
6%6.
8%2.
9%3.
6%2.
9%1.
8%10
0mm
3.2%
3.5%
3.5%
1.7%
1.7%
75m
m c
ol a
rch
0.9%
1.2%
0.0%
3.7%
0.0%
50m
m1.
1%0.
8%0.
3%1.
2%0.
0%to
tal l
og g
rade
316
.6%
24.4
%26
.7%
9.5%
7.9%
log
grad
e 4
200m
m0.
0%0.
4%0.
0%0%
0.0%
150m
m6.
5%7.
4%2.
3%0.
5%7.
0%12
5mm
1.8%
6.8%
5.0%
1.4%
1.8%
2.3%
100m
m5.
8%3.
7%7.
5%2.
5%1.
0%75
mm
col
arc
h9.
0%2.
6%0.
0%2.
1%0.
0%0.
0%50
mm
1.0%
0.9%
0.3%
0.0%
1.3%
0.0%
tota
l log
gra
de 4
24.1
%21
.7%
15.1
%6.
2%10
.3%
log
grad
e 5
200m
m0.
1%0.
0%0.
0%0%
0.0%
150m
m6.
0%2.
8%0.
0%0.
0%4.
4%12
5mm
9.6%
5.9%
10.6
%2.
4%2.
7%2.
9%10
0mm
7.7%
9.4%
4.8%
4.3%
2.4%
75m
m c
ol a
rch
3.2%
5.7%
0.0%
3.5%
0.0%
0.0%
50m
m1.
1%3.
1%0.
3%0.
0%0.
0%0.
0%to
tal l
og g
rade
527
.7%
26.9
%15
.8%
7.0%
9.7%
log
grad
e 6
200m
m0.
0%0.
0%15
0mm
0.0%
2.9%
125m
m0.
0%4.
8%1.
0%10
0mm
3.7%
3.9%
75m
m c
ol a
rch
16.5
%0.
0%4.
9%50
mm
5.5%
0.3%
0.0%
tota
l log
gra
de 6
25.7
%11
.9%
log
grad
es 1
-317
%24
%7%
16%
6%8%
all l
og g
rade
s18
%26
%17
%16
%6%
8%
tota
l rec
over
y hi
gh fe
atur
e (n
omin
al d
ry w
idth
x 2
5mm
th
ick
x av
erag
e gr
oup
leng
th)

59
Rec
over
y of
reje
ct g
rade
saw
n bo
ards
- no
min
al b
oard
dim
ensi
ons
as a
frac
tion
of lo
g vo
lum
esp
ecie
sE
. glo
bulu
sE.
glo
bulu
sE.
nite
nsE
. nite
nsE
. nite
nsE.
nite
nsE.
nite
nsE.
nite
nsE
. nite
nsE
. glo
bulu
sE
. glo
bulu
sag
e47
1313
2626
2626
2626
1919
silv
icul
ture
fibre
wid
e sp
aced
, pr
uned
wid
e sp
aced
, pr
uned
thin
ned,
pru
ned
butt
log
thin
ned,
pru
ned
uppe
r log
(u
npru
ned)
fibre
thin
ned,
pru
ned
butt
log
thin
ned,
pru
ned
uppe
r log
(u
npru
ned)
fibre
thin
ned,
pru
ned
butt
log
thin
ned,
pru
ned
butt
log
loca
tion
Gip
psla
ndG
ipps
land
Gip
psla
ndR
idgl
eyR
idgl
eyR
idgl
eyR
idgl
eyR
idgl
eyR
idgl
eyU
lver
ston
eU
lver
ston
esa
wn
ITC
Hey
field
ITC
Hey
field
ITC
Hey
field
ITC
New
ood
ITC
New
ood
ITC
New
ood
Gun
nsG
unns
Gun
nsIT
C N
ewoo
dG
unns
log
grad
e 1
200m
m0.
0%0.
0%15
0mm
0.0%
0.2%
125m
m0.
0%2.
7%10
0mm
0.0%
4.3%
75m
m c
ol a
rch
3.6%
1.2%
1.0%
50m
m0.
0%0.
2%to
tal l
og g
rade
13.
6%8.
5%lo
g gr
ade
220
0mm
0.0%
0.0%
150m
m0.
0%0.
3%12
5mm
0.0%
2.8%
100m
m0.
0%4.
4%75
mm
col
arc
h4.
0%1.
1%0.
7%50
mm
0.0%
0.2%
tota
l log
gra
de 2
4.0%
8.4%
log
grad
e 3
200m
m0.
0%0.
0%15
0mm
0.0%
0.3%
125m
m0.
0%4.
7%2.
7%10
0mm
0.0%
5.1%
75m
m c
ol a
rch
9.6%
1.1%
1.3%
50m
m0.
0%0.
3%to
tal l
og g
rade
39.
6%9.
6%lo
g gr
ade
420
0mm
0.0%
0.0%
150m
m0.
0%0.
4%12
5mm
0.0%
4.7%
3.4%
100m
m0.
0%3.
0%75
mm
col
arc
h5.
3%0.
0%5.
2%1.
0%50
mm
0.0%
0.7%
0.4%
tota
l log
gra
de 4
5.3%
8.3%
log
grad
e 5
200m
m0.
0%0.
0%15
0mm
0.0%
0.3%
125m
m0.
0%2.
0%4.
3%10
0mm
0.0%
7.1%
75m
m c
ol a
rch
5.4%
0.0%
11.3
%1.
1%50
mm
0.0%
1.0%
0.0%
tota
l log
gra
de 5
5.4%
12.8
%lo
g gr
ade
620
0mm
0.0%
150m
m0.
0%12
5mm
0.0%
2.6%
100m
m0.
0%75
mm
col
arc
h8.
7%0.
0%50
mm
0.0%
2.1%
tota
l log
gra
de 6
8.7%
log
grad
es 1
-30%
0%4%
0%9%
all l
og g
rade
s0%
0%0%
4%0%
9%
reje
ct (n
omin
al d
ry w
idth
x
25m
m th
ick
x av
erag
e gr
oup
leng
th)
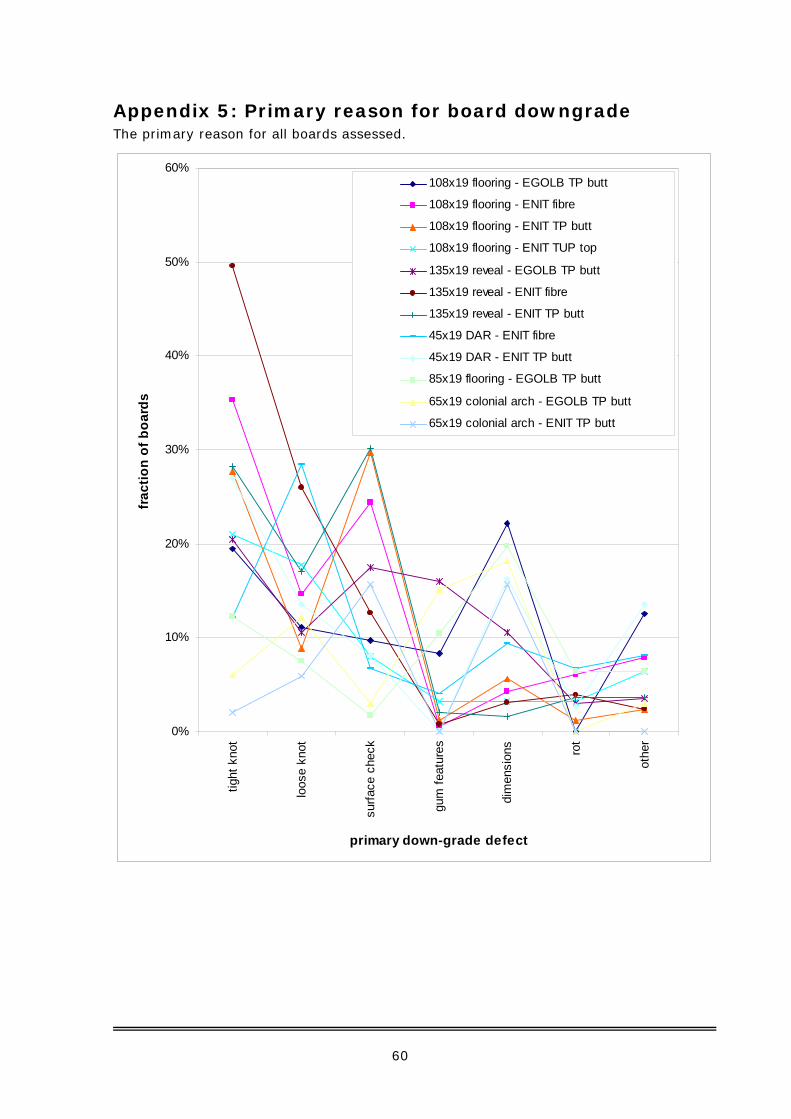
60
Appendix 5: Primary reason for board downgrade The primary reason for all boards assessed.
0%
10%
20%
30%
40%
50%
60%
tight
kno
t
loos
e kn
ot
surfa
ce c
heck
gum
feat
ures
dim
ensi
ons rot
othe
r
primary down-grade defect
frac
tion
of b
oard
s
108x19 flooring - EGOLB TP butt
108x19 flooring - ENIT fibre
108x19 flooring - ENIT TP butt
108x19 flooring - ENIT TUP top
135x19 reveal - EGOLB TP butt
135x19 reveal - ENIT fibre
135x19 reveal - ENIT TP butt
45x19 DAR - ENIT fibre
45x19 DAR - ENIT TP butt
85x19 flooring - EGOLB TP butt
65x19 colonial arch - EGOLB TP butt
65x19 colonial arch - ENIT TP butt
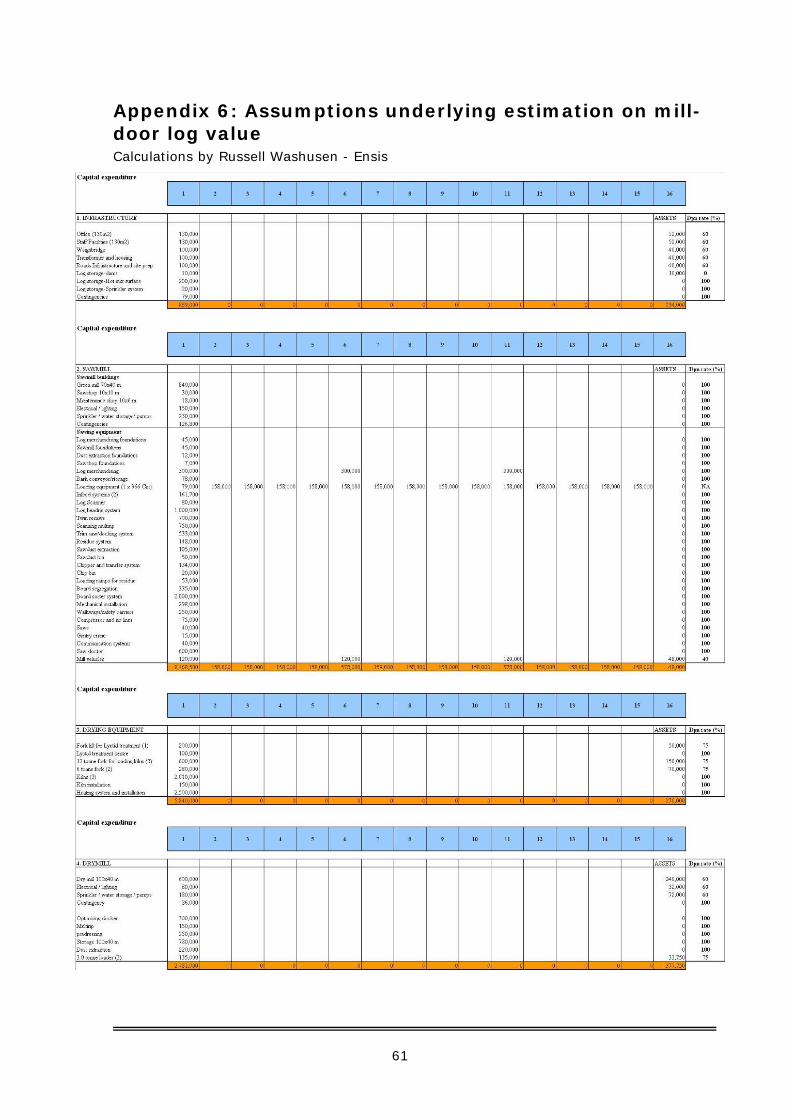
61
Appendix 6: Assumptions underlying estimation on mill-door log value Calculations by Russell Washusen - Ensis
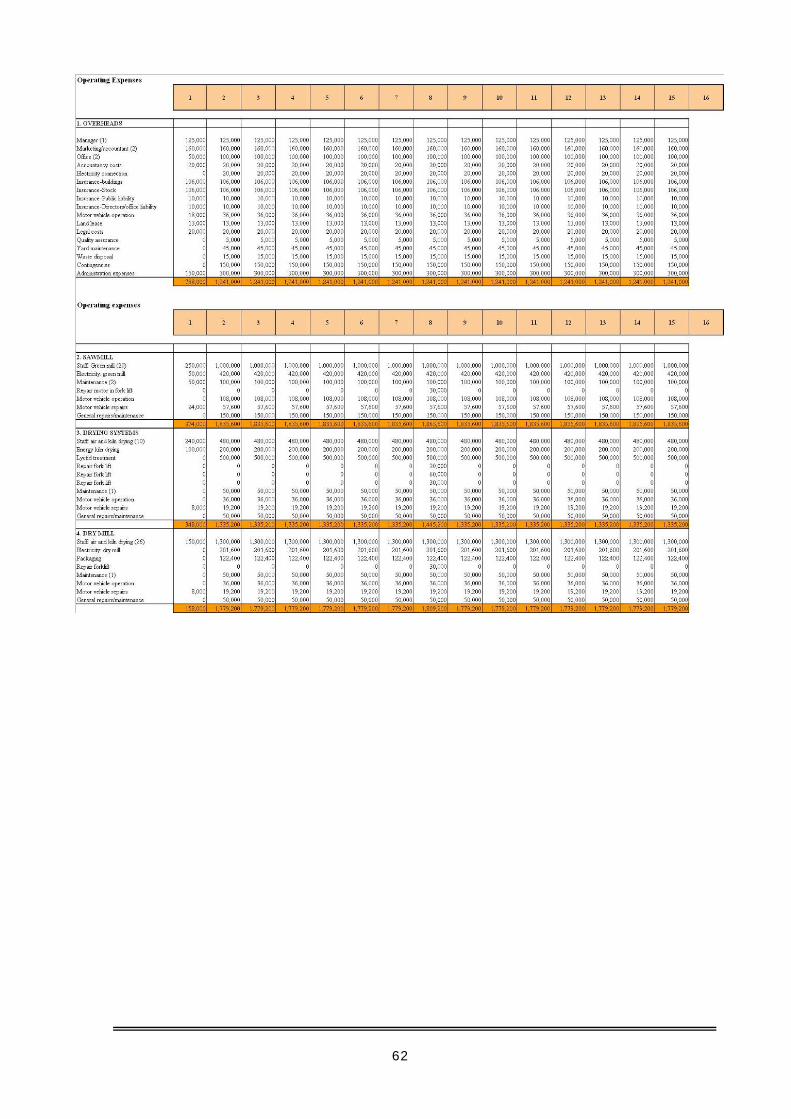
62
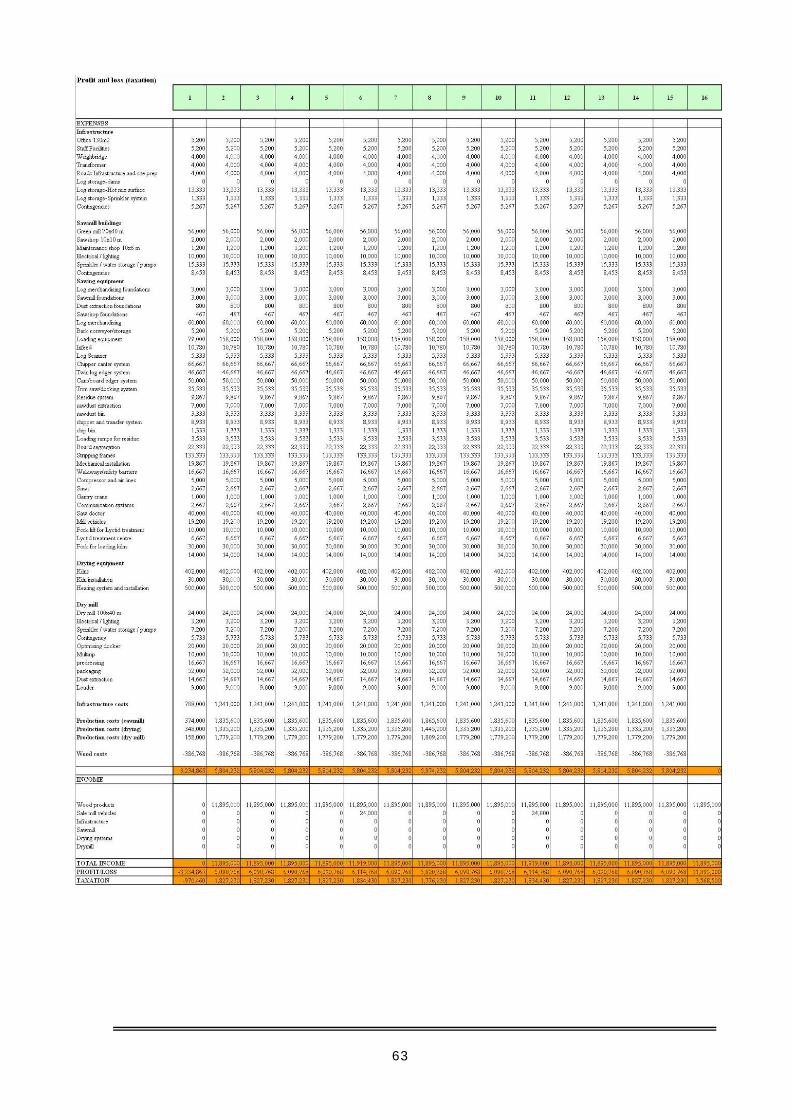
63

64
Appendix 7: ENSIS report on sawing trials in Victoria

Commercial in Confidence Client Report No. 1674
Determining the economics of processing project: Product quality and value from Victorian plantation-grown E. globulus and E. nitens using slab sawing and air-drying strategies. R. Washusen, A. Morrow and
M. Bojadzic

Commercial in Confidence Client Report No. 1674
Determining the economics of processing project: Product quality and value from Victorian plantation-grown E. globulus and E. nitens using slab sawing and air-drying strategies. R. Washusen, A. Morrow and
M. Bojadzic
Date: 31st May 2006
CLIENT: UNIVERSITY OF TASMANIA/FWPRDC
Contract No: FFP 04/231
Disclaimer:
The opinions provided in the Report have been prepared for the Client and its specified purposes. Accordingly, any person other than the Client uses the information in this report entirely at its own risk. The Report has been provided in good faith and on the basis that every endeavour has been made to be accurate and not misleading and to exercise reasonable care, skill and judgment in providing such opinions.
Neither Ensis nor its parent organisations, CSIRO and Scion, or any of its employees, contractors, agents or other persons acting on its behalf or under its control accept any responsibility or liability in respect of any opinion provided in this Report by Ensis.
CLIENT REPORT No:1674
EXECUTIVE SUMMARY
Objective The objectives of this study were:
• To determine the recovery of solid wood products and product value from available E. nitens and E. globulus plantations in Victoria using conventional slab sawing/air-drying strategies.
Key Results The major results of the study were:
• The stands assessed were 47-year old unpruned E. globulus, and 13-year old pruned E. nitens and E. globulus. The three plantations were located in Gippsland. In total 72.9 m3 of logs were made available for the trials.
• Prior to sawing all logs were graded into 6 sawlog grades (grades 1-6). Grades 1, 2, 3 and 4 corresponded to current Victorian Grades A, B, C and D. Grade 5 and 6 were below existing sawlog specifications.
• The overall sawlog quality from the 47 year-old E. globulus was good. 96% of the logs processed were Grade 1, 2 and 3. In contrast the sawlog quality was poorer from the 13-year-old pruned stands with 34% and 30% of logs Grade 1, 2 and 3 for the E. globulus and E. nitens respectively. The main reason for poorer quality was small diameter and surface defects that indicated the presence of kino pockets.
• The difference in log quality had a major impact on product quality and recovery. Product values ranged from $75 to $266 ($/m3 of log input) with values generally increasing in all resources as log quality improved.
Application of Results As with a number of earlier studies these results show that both pruned and unpruned plantation-grown E. globulus and E. nitens can produce good recoveries of high quality timber. However, the results clearly highlight the importance of log quality and the need to produce consistently high yields of logs at least equivalent to grade 2. This most likely will be achieved in pruned plantations by allowing them to grow to an older age before harvest. However, there were also some wood quality problems found in both pruned stands in the form of kino pockets that led to down-grading of logs. The reason that this defect was so prevalent in these stands is unclear.

CLIENT REPORT No: 1674
Determining the economics of processing project:
Product quality and value from Victorian plantation-grown E. globulus and E. nitens using slab sawing and air-drying strategies. R. Washusen, A. Morrow and M. Bojadzic
31st May 2006

CLIENT REPORT No:1674
TABLE OF CONTENTS EXECUTIVE SUMMARY .............................................................................1 OBJECTIVE ...............................................................................................1 KEY RESULTS............................................................................................1 APPLICATION OF RESULTS .............................................................................1
TABLE OF CONTENTS................................................................................3
INTRODUCTION........................................................................................1
MATERIALS AND METHODS ......................................................................1 LOG SELECTION .........................................................................................1 SAWLOG GRADING ......................................................................................1 SAWING ..................................................................................................2 DRYING, DRESSING AND PRODUCT GRADING ........................................................2 RECOVERY CALCULATIONS .............................................................................5 PRODUCT VALUE CALCULATIONS.......................................................................5
RESULTS AND DISCUSSION......................................................................6 LOG VOLUMES AND LOG QUALITY......................................................................6 PRODUCT RECOVERY AND VALUE ......................................................................8
CONCLUSIONS........................................................................................10
REFERENCES ..........................................................................................10
ACKNOWLEDGEMENTS............................................................................11
Information for Ensis abstracting:
Contract number FFP 04/231
Report ID number 1674
Products investigated Conventional appearance products
Wood species worked on Plantation grown E. globulus and E. nitens
Other materials used
Location Gippsland, Victoria
CLIENT REPORT No:1674
INTRODUCTION Eucalypt plantation forestry in southern Australia has developed rapidly in recent years. Much of the existing resource comprises E. globulus (mainly in Western Australia and Victoria) and E. nitens (mainly in Tasmania). While most of this resource is managed to provide logs for the pulp and paper industry there is potential for these plantations and future plantations to provide logs for the production of sawn timber, potentially supplementing supplies from native forests. While recent trials using both pruned and unpruned sawlogs in conventional hardwood mills have produced encouraging results (Washusen and McCormick 2002, Washusen et al. 2004, Washusen 2006) there is little economic data available to verify if plantation-grown resources can be processed profitably using the existing sawing and wood drying systems available to native forest sawmillers. This information is needed to improve the decision-making capacity of forest managers and the existing hardwood industry about utilization of young plantation-grown eucalypts.
The trials described in this report were a first step in determining the economics of processing plantation-grown eucalypts in existing hardwood mills. The resources selected for this present study were 13-year old pruned plantation grown E. nitens and E. globulus and 47 year-old unpruned E. globulus. Processing involved the application of conventional quarter-sawing and back-sawing strategies to produce slabs (boards dimensioned in thickness but not width) for uncontrolled air-drying followed by reconditioning and kiln drying.
MATERIALS AND METHODS
Log selection Logs for the processing trials were selected by the University of Tasmania and delivered to the Neville Smith Timbers Industries (now ITC) sawmill at Heyfield, Victoria. The plantations were 47-year-old unpruned E. globulus and 13-year-old pruned E. globulus and E. nitens. A single truck-load of logs was selected from each plantation. There were 27.7 m3, 25.4 m3 and 19.8 m3 of logs from the plantations respectively. At the mill the logs were cross-cut under direction from Ensis-Wood Quality staff to produce two sawlogs. Log lengths were 2.7 m and 2.8 m for the 47 year-old E. globulus and 3.2 m and 3.3 m for the 13-year-old E. globulus and E. nitens.
Sawlog grading The logs were graded using the Victorian log-grading card. Many of the 13-year-old E. globulus and E. nitens were below minimum sawlog specification because of small diameter and/or the presence of swellings associated with kino pockets that produced defective quarters on Victorian grading rules. These residual logs were retained in the trial by allocating two additional grades making 6 grades in all. The log quality indicators of the 6 grades are summarised in Figure 1. Figure 1 does not include pipe because this defect was not evident in any log. Grades 1, 2, 3 and 4 are equivalent to Victorian A, B, C and D.

CLIENT REPORT No:1674
Figure1: Summary of log quality indicators for the 6 grades of logs used in the trials
Sawing Sawing was conducted in the Neville Smith Timber Industries mill at Heyfield, Victoria. For the sawing the logs were grouped by species, plantation, log grade and diameter. Each log group was tracked through the mill by allocating a colour code to both log-ends using a sequence of 8 colours. In the case of Grade 3 and 4 logs from the 13-year-old stands small numbers of logs in one or both of the grades was overcome by combining the logs to simplify tracking of boards.
Logs smaller than 30.0 cm were back-sawn and the larger logs quarter-sawn. In both cases a slab sawing strategy was applied to produce a green slab thickness of 32 mm to allow for sawing thickness variation and shrinkage and to produce a nominal 25 mm thick board after drying and skip dressing. Small-dimensioned slabs and poor quality wood were resawn to produce nominal 50 x 25 mm tile battens. The remaining slabs were identified with a code relevant to each log group, racked and covered with Hessian for drying in July 2005. Recoveries of green tile battens were tallied at completion of sawing.
Drying, dressing and product grading The slabs were air-dried by Neville Smith Timbers Industries using the current production methods for ash timber. In April 2006, when the slabs were below fibre saturation point they were kiln dried to final moisture content using standard drying schedules for ash eucalypts.
1 2 3 4 5 625-30 SED 0 1+>30-35 SED 0 1 2+>35-40 SED 0 1 2 3+>40-45 SED 1 2 3 4>45-50 SED 1 2 3 4>50-55 SED 0 1 2 3 4>55-60 SED 0 1 2 3 4>60-65 SED 0 1 2 3 4>65-70 SED 0 1 2 3 4>70-75 SED 0 1 2 3 4>75-80 SED 0 1 2 3 4>80-85 SED 0 1 2 3 4>85-90 SED 0 1 2 3 4>90-95 SED 0 1 2 3 4>95-100 SED 0 1 2 3 4SweepGraintight kino <3mm width : length % of diameter 25 200tight kino >3mm width : length% of diameter 25 100loose kino/kino pockets/shakes : length % of diameter 100stain
allowable defective quarters
GRADE
<20% of diameter over 2.4 m length<1:8
ul<1:10
ul200
dark25
light

CLIENT REPORT No:1674
After drying, the boards were planed, edged, docked and graded by Neville Smith Timber Industries staff, according to the appearance grading criteria specified in Table 1.
After planing, edging and docking length, width, thickness and grade were tallied for each board by Ensis-Wood Quality staff.

CLIENT REPORT No:1674
Table 1: Summary of appearance grading criteria by Neville Smith Timber Industries
DEFECT 1. SELECT 2. STANDARD 3. MERCH
Graded To: 2 Faces/2 Edges 1 Face/2 Edges Worst Face
Internal Check Not Permitted Not Permitted No Limitation
Surface Checks Not Allowed Not to exceed 2mm in depth
No Limitation
Sound Knots/Burls
No greater than 20mm wide or 1/6 of width. One per 2m in length
No greater than 30mm wide or ¼ of width. One in any 1m length.
No Limitation
Tight Gum Vein Not greater than 2mm wide, and not exceeding ½ aggregate length of board.
Not greater than 5mm wide, and not exceeding aggregate length of board.
No Limitation.
Loose Gum Vein Not Permitted Not greater than 3mm wide, not intersecting an end. Aggregate length 1/6 of board.
Not greater than 5mm wide, and not exceeding aggregate length of board.
Brown Stain Slight No Limitation No Limitation
Hobnail No Limitation No Limitation No Limitation
Gum Pockets Not Permitted No greater than 6mm wide. Length max 75mm. Not exceeding 1 per 1500mm of length.
No Limitation
Black Speck Slight No Limitation No Limitation
Pinholes and Holes
Not Permitted No greater than 3mm in diameter. 6 per 100x100 area and not associated with decay.
Scattered
Decay Not Permitted Not Permitted Not Permitted
Heart Wood Not Permitted Not Permitted No Limitation
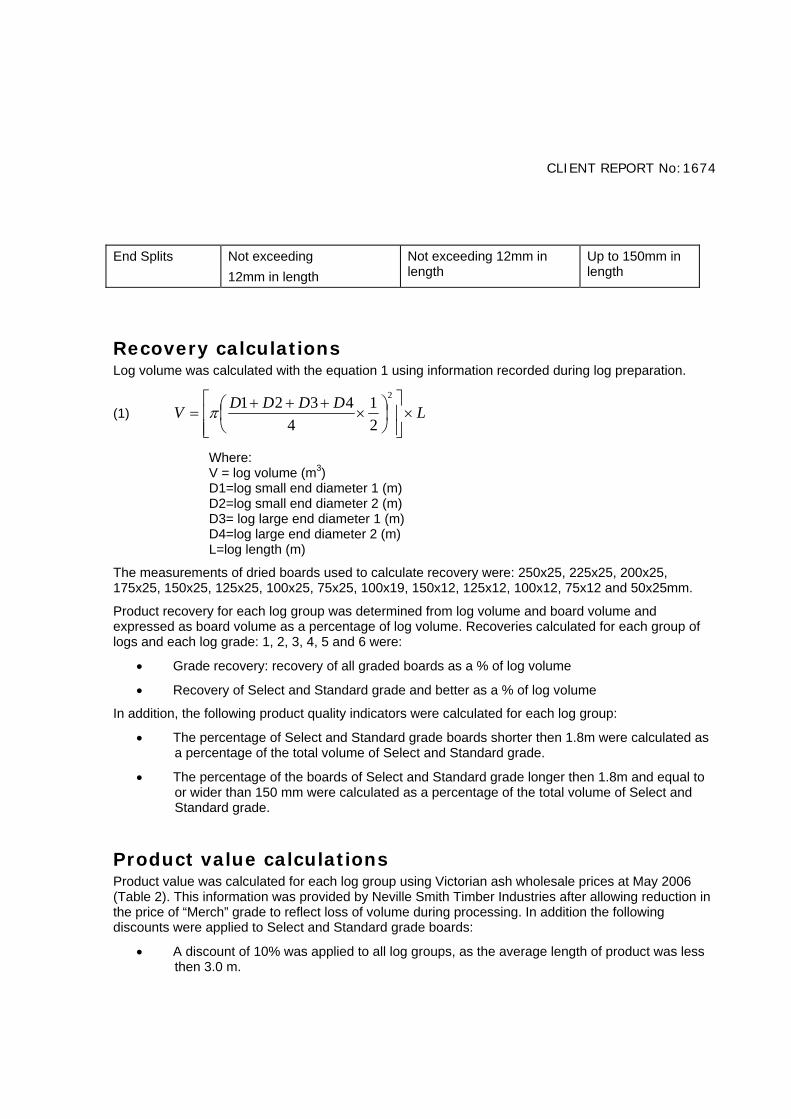
CLIENT REPORT No:1674
End Splits Not exceeding 12mm in length
Not exceeding 12mm in length
Up to 150mm in length
Recovery calculations Log volume was calculated with the equation 1 using information recorded during log preparation.
(1) LDDDDV ×⎥⎥⎦
⎤
⎢⎢⎣
⎡⎟⎠⎞
⎜⎝⎛ ×
+++=
2
21
44321π
Where: V = log volume (m3) D1=log small end diameter 1 (m) D2=log small end diameter 2 (m) D3= log large end diameter 1 (m) D4=log large end diameter 2 (m) L=log length (m)
The measurements of dried boards used to calculate recovery were: 250x25, 225x25, 200x25, 175x25, 150x25, 125x25, 100x25, 75x25, 100x19, 150x12, 125x12, 100x12, 75x12 and 50x25mm.
Product recovery for each log group was determined from log volume and board volume and expressed as board volume as a percentage of log volume. Recoveries calculated for each group of logs and each log grade: 1, 2, 3, 4, 5 and 6 were:
• Grade recovery: recovery of all graded boards as a % of log volume
• Recovery of Select and Standard grade and better as a % of log volume
In addition, the following product quality indicators were calculated for each log group:
• The percentage of Select and Standard grade boards shorter then 1.8m were calculated as a percentage of the total volume of Select and Standard grade.
• The percentage of the boards of Select and Standard grade longer then 1.8m and equal to or wider than 150 mm were calculated as a percentage of the total volume of Select and Standard grade.
Product value calculations Product value was calculated for each log group using Victorian ash wholesale prices at May 2006 (Table 2). This information was provided by Neville Smith Timber Industries after allowing reduction in the price of “Merch” grade to reflect loss of volume during processing. In addition the following discounts were applied to Select and Standard grade boards:
• A discount of 10% was applied to all log groups, as the average length of product was less then 3.0 m.
CLIENT REPORT No:1674
• A discount of 50% was applied to the volume of Select and Standard grade boards shorter then 1.8m in length to all log groups.
Table 2: Victorian ash wholesale price list May 2006.
WIDTH THICK SELECT STANDARD MERCH(mm) (mm) ($/m3) ($/m3) ($/m3)
50 1275 1275 16 1270.00 900.00 350.00
100 12.250 25 1215.00 970.00 350.00
125 12100 16 1400.00 1110.00 350.00150 1275 25 1360.00 1005.00 350.00
125 16 1400.00 1110.00 350.00150 16 1500.00 1200.00 350.00100 25 1455.00 1120.00 350.00125 25 1460.00 1165.00 350.00150 25 1510.00 1190.00 350.00175 25 1215.00 970.00 350.00200 25 1790.00 1535.00 350.00225 25 1440.00 1200.00 350.00250 25 1770.00 1225.00 350.00275 25 1770.00 1225.00 350.00
WHOLESALE TIMBER PRICE LIST at MAY 2006
RESULTS AND DISCUSSION
Log volumes and log quality The numbers, volumes and mean diameter of logs from the three plantations are presented in Table 3; and Table 4 and 5 show the number of logs in each grade category for the three resources, and their corresponding log volumes. Mean log volume data in each grade category for the three resources are presented in Table 6. Generally the log quality from the 2 pruned plantations was poor with only 34% and 30% of logs Grade 3 or better (Victorian C-grade and better) for the E. globulus and E. nitens respectively with most below the preferred log quality of the hardwood industry in Victoria. The main reason for poor quality was small diameter and the presence of surface defects on the logs usually associated with kino pockets. In contrast 96% of the logs processed from the 47-year-old E. globulus were Grade 3 or better.
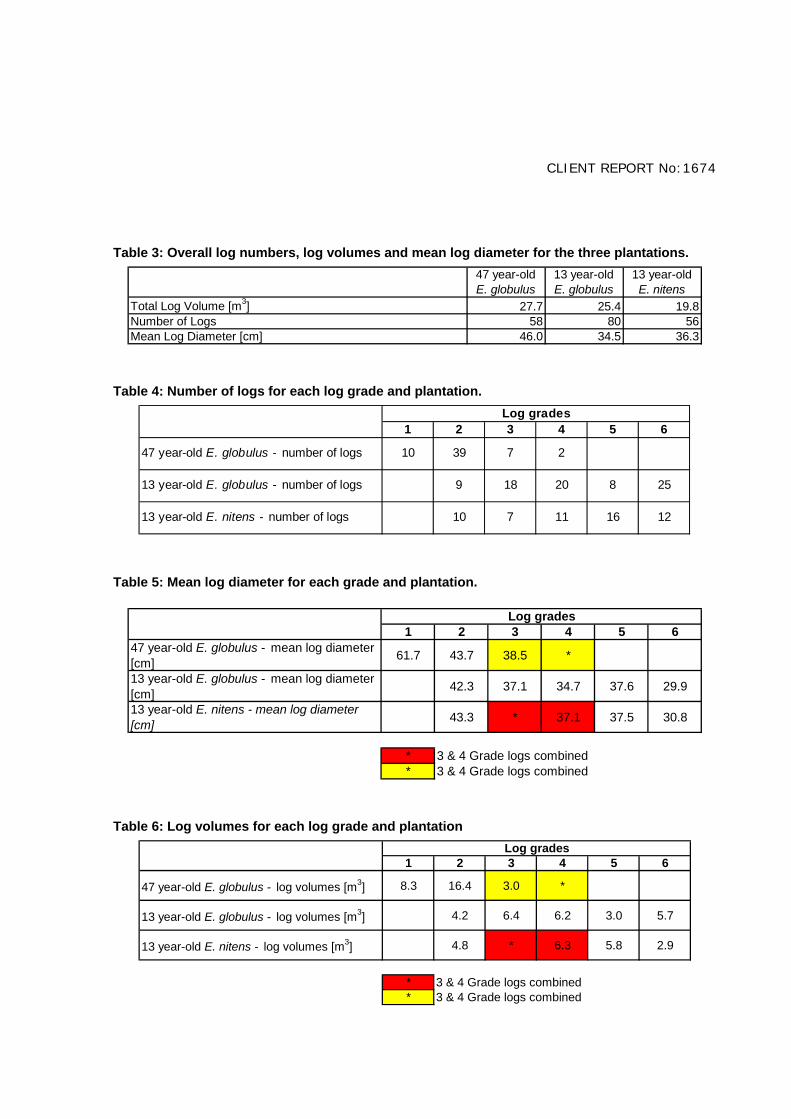
CLIENT REPORT No:1674
Table 3: Overall log numbers, log volumes and mean log diameter for the three plantations. 47 year-old E. globulus
13 year-old E. globulus
13 year-old E. nitens
Total Log Volume [m3] 27.7 25.4 19.8Number of Logs 58 80 56Mean Log Diameter [cm] 46.0 34.5 36.3
Table 4: Number of logs for each log grade and plantation.
1 2 3 4 5 6
47 year-old E. globulus - number of logs 10 39 7 2
13 year-old E. globulus - number of logs 9 18 20 8 25
13 year-old E. nitens - number of logs 10 7 11 16 12
Log grades
Table 5: Mean log diameter for each grade and plantation.
1 2 3 4 5 647 year-old E. globulus - mean log diameter [cm] 61.7 43.7 38.5 *
13 year-old E. globulus - mean log diameter [cm] 42.3 37.1 34.7 37.6 29.9
13 year-old E. nitens - mean log diameter [cm] 43.3 * 37.1 37.5 30.8
* 3 & 4 Grade logs combined* 3 & 4 Grade logs combined
Log grades
Table 6: Log volumes for each log grade and plantation
1 2 3 4 5 6
47 year-old E. globulus - log volumes [m3] 8.3 16.4 3.0 *
13 year-old E. globulus - log volumes [m3] 4.2 6.4 6.2 3.0 5.7
13 year-old E. nitens - log volumes [m3] 4.8 * 6.3 5.8 2.9
* 3 & 4 Grade logs combined* 3 & 4 Grade logs combined
Log grades

CLIENT REPORT No:1674
Product recovery and value Recovery of all boards as a % of log volume and recovery of Select and Standard grade as a % of log volume for each log grade and plantation are presented in Table 7 and Table 8. Information about product length and width are presented in Tables 9 and 10 and product value per log input in Table 11.
In general, product recovery, board lengths and product values declined with log quality. However, there was a great deal of variation in product quality between resources for a given log grade. For example, for grade 2 logs (equivalent to Victorian B-grade) the recovery of Select and Standard grade for the two E. globulus plantations ranged from 9.7 and 20.9 (% log vol) (Table 8) despite relatively similar total recoveries (Table 7). This led to some variation in product value between these two resources. The reason for this variation was not determined in this trial, however, data on grade limiting defects was collected and could be analysed if it were considered necessary to determine the cause of differences. One of the differences between these resources was that the 13-year-old trees had been pruned while the 47-year-old trees were unpruned. This single factor could account for the differences.
Table 7: Recovery of all boards for each log group as a % of log volume
1 2 3 4 5 647 year-old E. globulus recovery all boards (% of log volume) 33.1 28.3 23.4 *
13 year-old E. globulus recovery all boards (% of log volume) 32.7 25.9 23.0 22.1 22.2
13 year-old E. nitens recovery all boards (% of log volume) 24.3 * 27.6 26.2 18.7
* 3 & 4 Grade logs combined* 3 & 4 Grade logs combined
Log grades
Table 8: Recovery Select and Standard boards as a % of log volume for each log group
1 2 3 4 5 647 year-old E. globulus recovery select & standard grade (% of log volume) 19.6 9.7 6.7 *
13 year-old E. globulus recovery select & standard grade (% of log volume) 20.9 9.2 5.1 6.3 1.4
13 year-old E. nitens recovery select & standard grade (% of log volume) 13.2 * 10.3 8.0 1.6
* 3 & 4 Grade logs combined* 3 & 4 Grade logs combined
Log grades
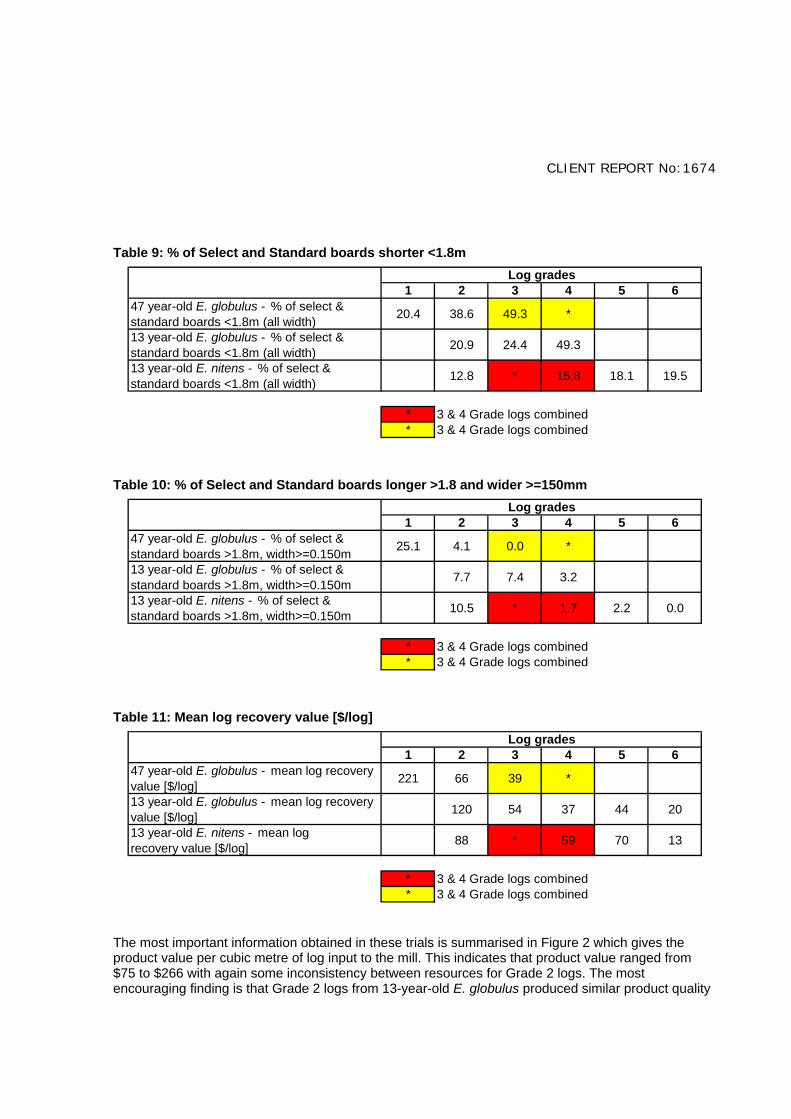
CLIENT REPORT No:1674
Table 9: % of Select and Standard boards shorter <1.8m
1 2 3 4 5 647 year-old E. globulus - % of select & standard boards <1.8m (all width) 20.4 38.6 49.3 *
13 year-old E. globulus - % of select & standard boards <1.8m (all width) 20.9 24.4 49.3
13 year-old E. nitens - % of select & standard boards <1.8m (all width) 12.8 * 15.8 18.1 19.5
* 3 & 4 Grade logs combined* 3 & 4 Grade logs combined
Log grades
Table 10: % of Select and Standard boards longer >1.8 and wider >=150mm
1 2 3 4 5 647 year-old E. globulus - % of select & standard boards >1.8m, width>=0.150m 25.1 4.1 0.0 *
13 year-old E. globulus - % of select & standard boards >1.8m, width>=0.150m 7.7 7.4 3.2
13 year-old E. nitens - % of select & standard boards >1.8m, width>=0.150m 10.5 * 1.7 2.2 0.0
* 3 & 4 Grade logs combined* 3 & 4 Grade logs combined
Log grades
Table 11: Mean log recovery value [$/log]
1 2 3 4 5 647 year-old E. globulus - mean log recovery value [$/log] 221 66 39 *
13 year-old E. globulus - mean log recovery value [$/log] 120 54 37 44 20
13 year-old E. nitens - mean log recovery value [$/log] 88 * 59 70 13
* 3 & 4 Grade logs combined* 3 & 4 Grade logs combined
Log grades
The most important information obtained in these trials is summarised in Figure 2 which gives the product value per cubic metre of log input to the mill. This indicates that product value ranged from $75 to $266 with again some inconsistency between resources for Grade 2 logs. The most encouraging finding is that Grade 2 logs from 13-year-old E. globulus produced similar product quality
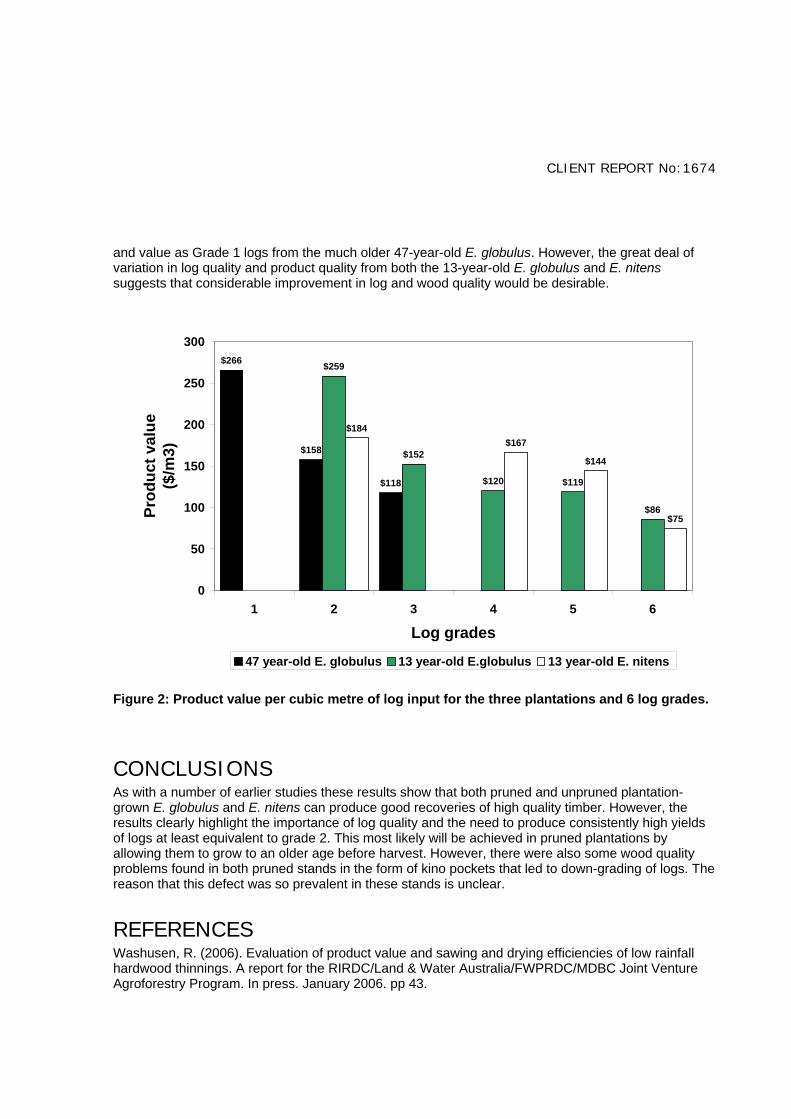
CLIENT REPORT No:1674
and value as Grade 1 logs from the much older 47-year-old E. globulus. However, the great deal of variation in log quality and product quality from both the 13-year-old E. globulus and E. nitens suggests that considerable improvement in log and wood quality would be desirable.
$266
$158
$118
$259
$152
$120 $119
$86
$184$167
$144
$75
0
50
100
150
200
250
300
1 2 3 4 5 6
Log grades
Prod
uct v
alue
($
/m3)
47 year-old E. globulus 13 year-old E.globulus 13 year-old E. nitens
Figure 2: Product value per cubic metre of log input for the three plantations and 6 log grades.
CONCLUSIONS As with a number of earlier studies these results show that both pruned and unpruned plantation-grown E. globulus and E. nitens can produce good recoveries of high quality timber. However, the results clearly highlight the importance of log quality and the need to produce consistently high yields of logs at least equivalent to grade 2. This most likely will be achieved in pruned plantations by allowing them to grow to an older age before harvest. However, there were also some wood quality problems found in both pruned stands in the form of kino pockets that led to down-grading of logs. The reason that this defect was so prevalent in these stands is unclear.
REFERENCES Washusen, R. (2006). Evaluation of product value and sawing and drying efficiencies of low rainfall hardwood thinnings. A report for the RIRDC/Land & Water Australia/FWPRDC/MDBC Joint Venture Agroforestry Program. In press. January 2006. pp 43.

CLIENT REPORT No:1674
Washusen, R., Reeves, K., Hingston, R. Davis, S. Menz, D. and Morrow, A. (2004). Processing pruned and un-pruned blue gum (Eucalyptus globulus) to produce high value products. Forest and Wood Products Research and Development Corporation Report PN03.1315. pp. 27.
Washusen, R. and McCormick, M. (2002). Recovery potential of quarter-sawn solid wood products from regrowth and plantation-grown Eucalyptus nitens. CSIRO-FFP Client report No. 1227 for NRE. December 2002. pp 15.
ACKNOWLEDGEMENTS This project was funded by the FWPRDC and administered through the University of Tasmania as part of the FWPRDC Economics of processing project. Dr Bruce Greaves from the University of Tasmania selected trees for this project and arranged delivery of the logs to Neville Smith Timber Industries mill at Heyfield. The pruned logs were made available by Mr Frank Hirst. The authors acknowledge the assistance of Mr Gary Henthorn and staff at Neville Smith Timbers Industries at Heyfield, Victoria.