Determining - Metallurgist & Mineral Processing Engineer · 2017-01-21 · Determining in-depth...
55
0
Transcript of Determining - Metallurgist & Mineral Processing Engineer · 2017-01-21 · Determining in-depth...

0

Determining
in-depth
plant performance
The primary tool for optimising
your plant process
Philip Stewart
2
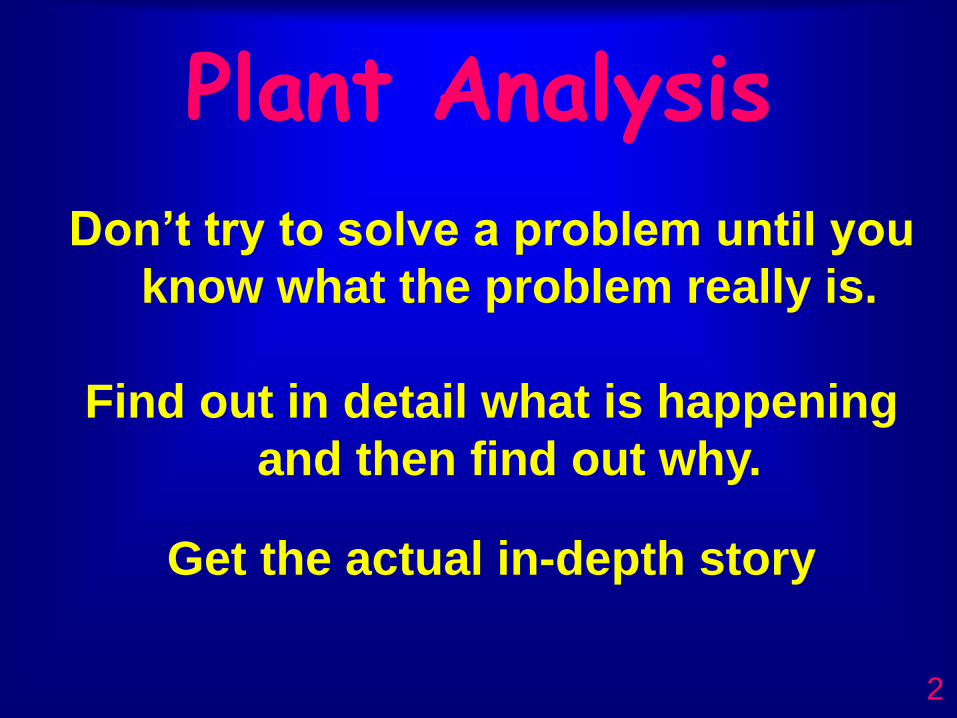
Plant Analysis
Don’t try to solve a problem until you
know what the problem really is.
Find out in detail what is happening
and then find out why.
Get the actual in-depth story

3
The best starting point is a detailed
Plant Survey
4
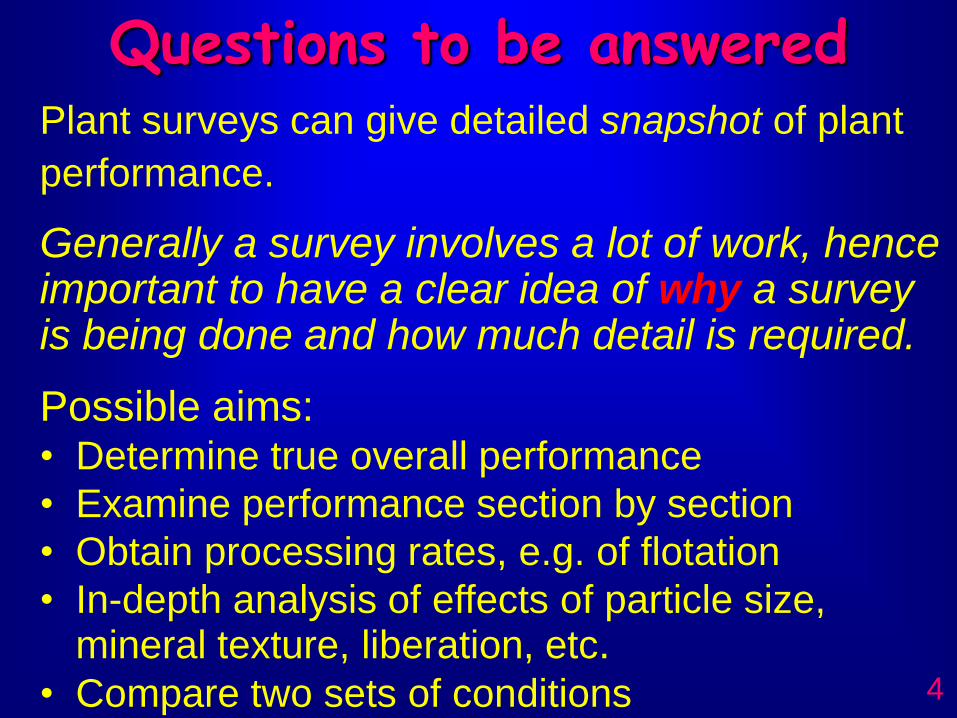
Questions to be answeredPlant surveys can give detailed snapshot of plant
performance.
Generally a survey involves a lot of work, henceimportant to have a clear idea of why a surveyis being done and how much detail is required.
Possible aims:• Determine true overall performance
• Examine performance section by section
• Obtain processing rates, e.g. of flotation
• In-depth analysis of effects of particle size, mineral texture, liberation, etc.
• Compare two sets of conditions
5
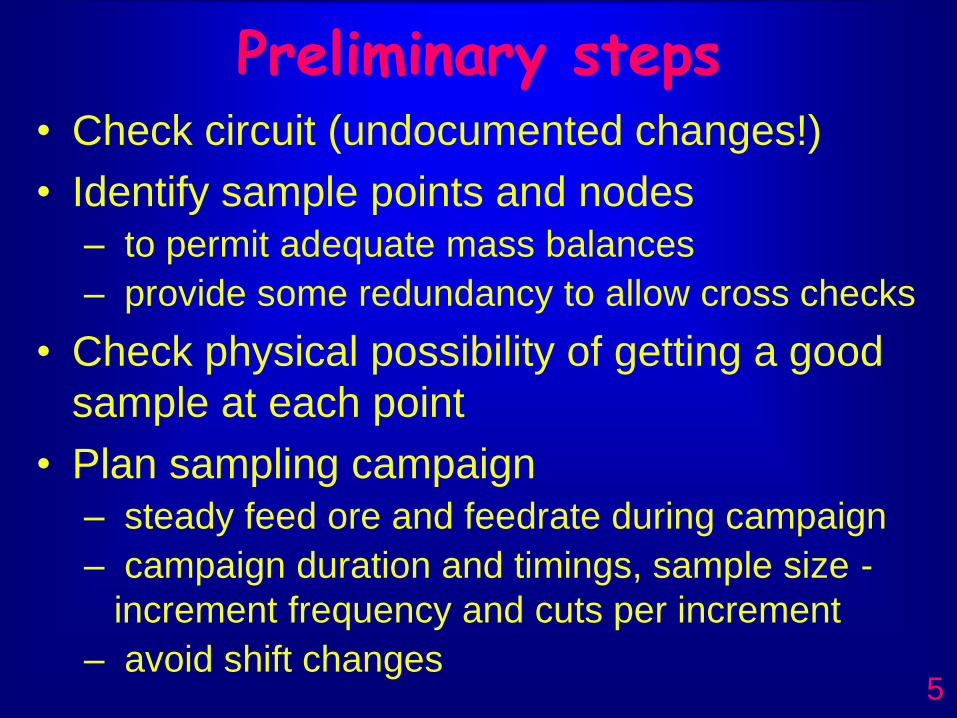
Preliminary steps• Check circuit (undocumented changes!)
• Identify sample points and nodes
– to permit adequate mass balances
– provide some redundancy to allow cross checks
• Check physical possibility of getting a good
sample at each point
• Plan sampling campaign
– steady feed ore and feedrate during campaign
– campaign duration and timings, sample size -
increment frequency and cuts per increment
– avoid shift changes
6
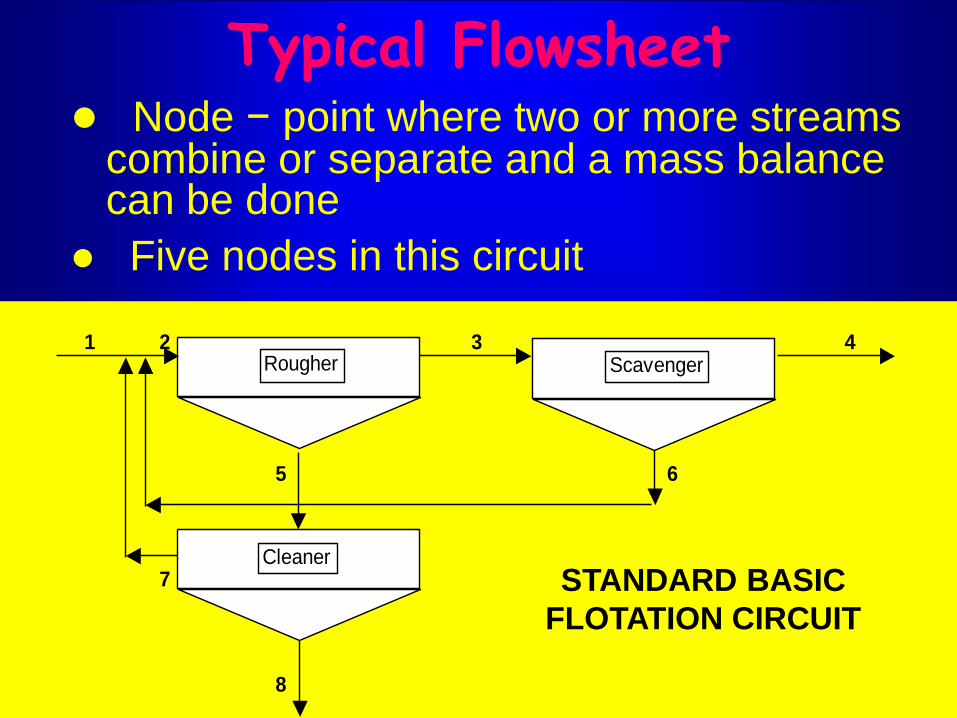
Typical Flowsheet
1 2 3 4
5 6
7
8
Rougher Scavenger
Cleaner
STANDARD BASIC
FLOTATION CIRCUIT
● Node − point where two or more streams combine or separate and a mass balance can be done
● Five nodes in this circuit

7
(1) Overall Balance
1 2 3 4
5 6
7
8
Rougher Scavenger
Cleaner
Overall balance 1 = 4 + 8 (1)
8
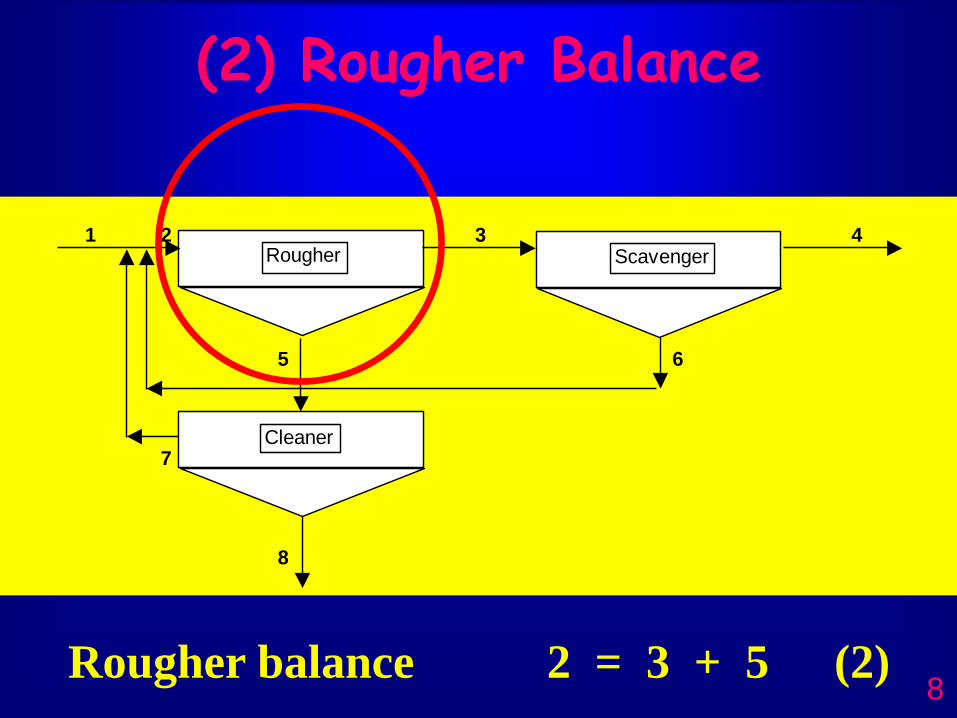
(2) Rougher Balance
1 2 3 4
5 6
7
8
Rougher Scavenger
Cleaner
Rougher balance 2 = 3 + 5 (2)
9
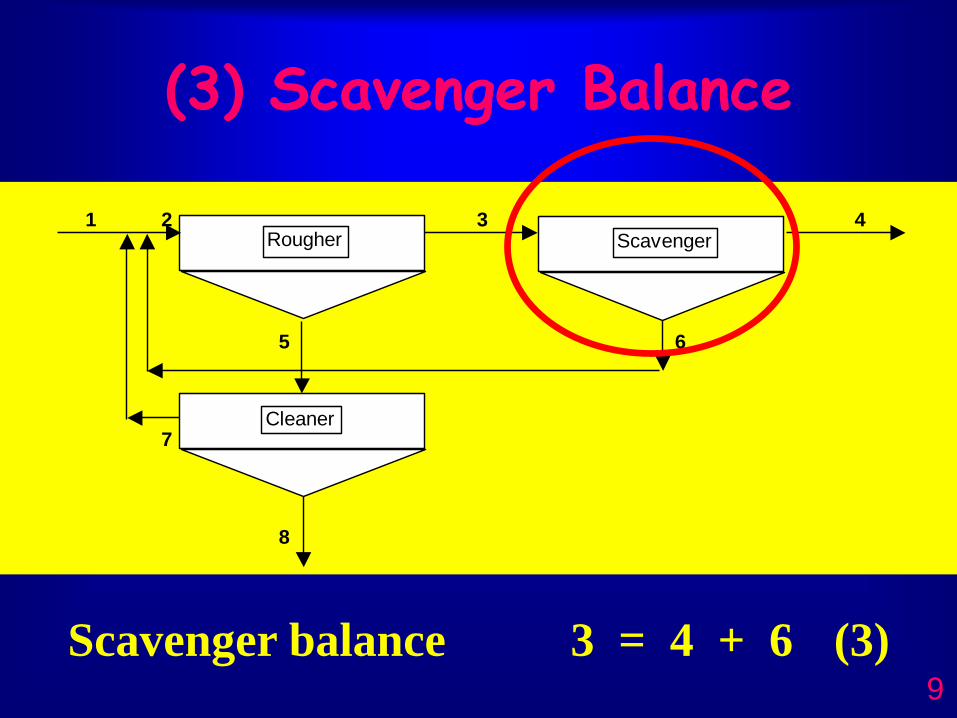
(3) Scavenger Balance
1 2 3 4
5 6
7
8
Rougher Scavenger
Cleaner
Scavenger balance 3 = 4 + 6 (3)
10
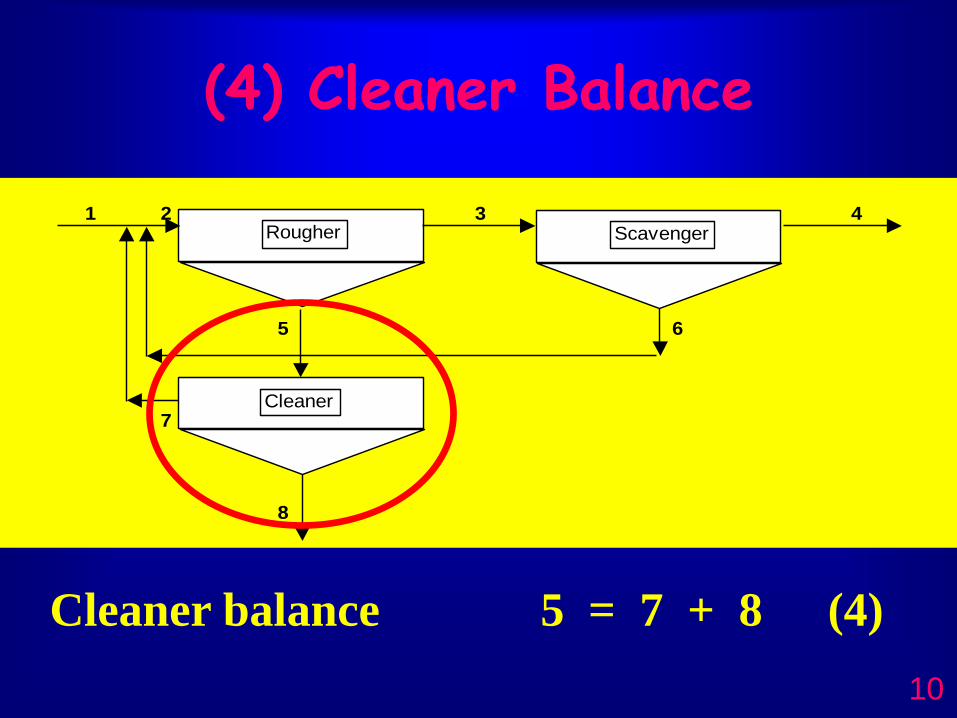
(4) Cleaner Balance
1 2 3 4
5 6
7
8
Rougher Scavenger
Cleaner
Cleaner balance 5 = 7 + 8 (4)
11
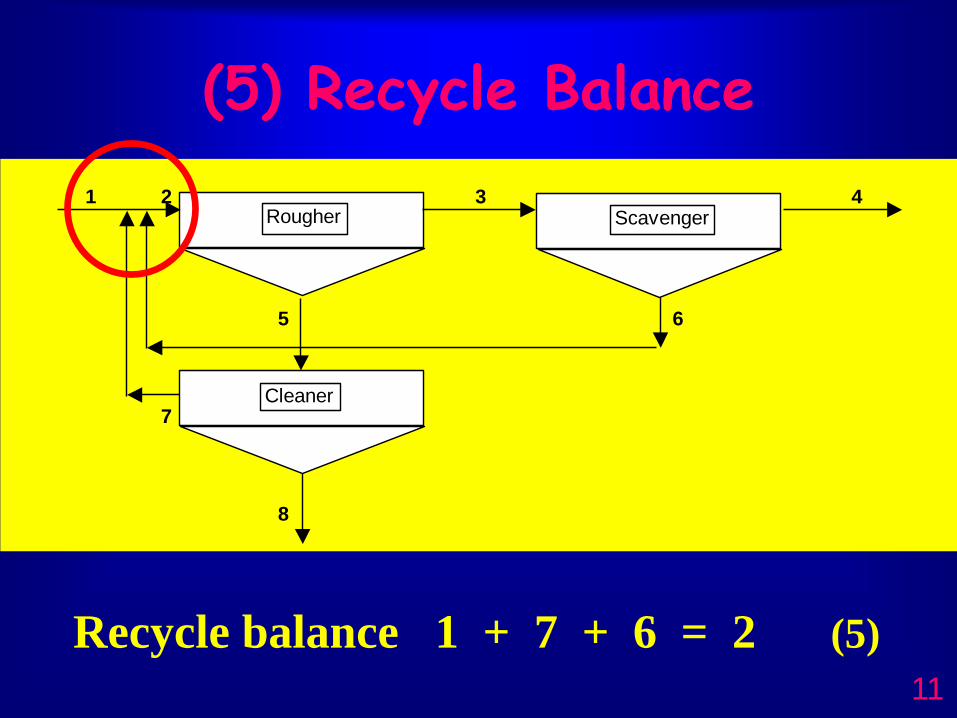
(5) Recycle Balance
1 2 3 4
5 6
7
8
Rougher Scavenger
Cleaner
Recycle balance 1 + 7 + 6 = 2 (5)
12
Fundamental rule for correct sampling
• All parts of the ore, stream or concentrate
being sampled must have an equal
probability of being collected and of
becoming part of the final sample for
subsequent analysis.
• Ask this fundamental question about every
sampling situation to test your procedure.
• If this rule is not respected, then bias is easily
introduced, and the sample may well be
unrepresentative of the stream.
13
Plant Sampling• The discharge point of a conveyor belt or process
stream where the stream is in free fall is very frequently the most suitable sampling location.
• Must make a complete traverse into and out of the ore or concentrate stream with each cut.
• Generally the cutter must have parallel edges and move at right angles to the flowing stream.
• The cutter speed must be constant.
• The movement must be quick enough to avoid buildup, blockage or spillage.
• Sampling devices or methods that take only part of the stream must be avoided at all cost.
14
Sample points• Choosing sample points seems reasonably easy!
BUT
• Check the plant to see if the points chosen CAN be sampled! e.g.
– large flows (no suitable sampling equipment)
– enclosed plant, submerged pipes
– congested pump boxes or bank feed boxes
– other inaccessible streams (e.g. intermediate float cell tails in a bank)
– a bad sample is never worth taking.
15
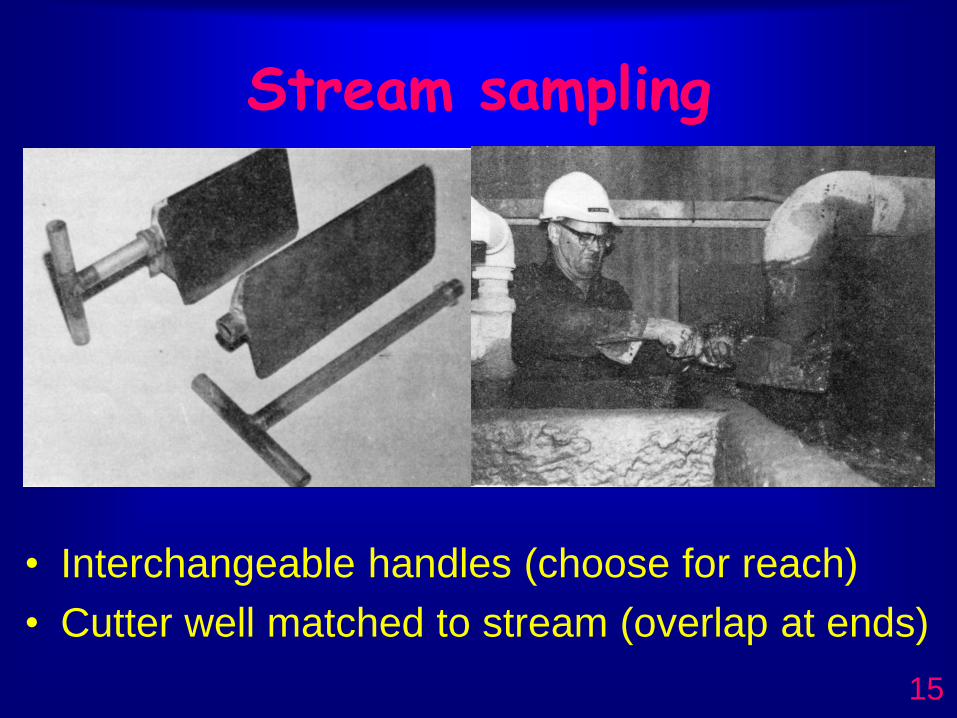
Stream sampling
• Interchangeable handles (choose for reach)
• Cutter well matched to stream (overlap at ends)
16
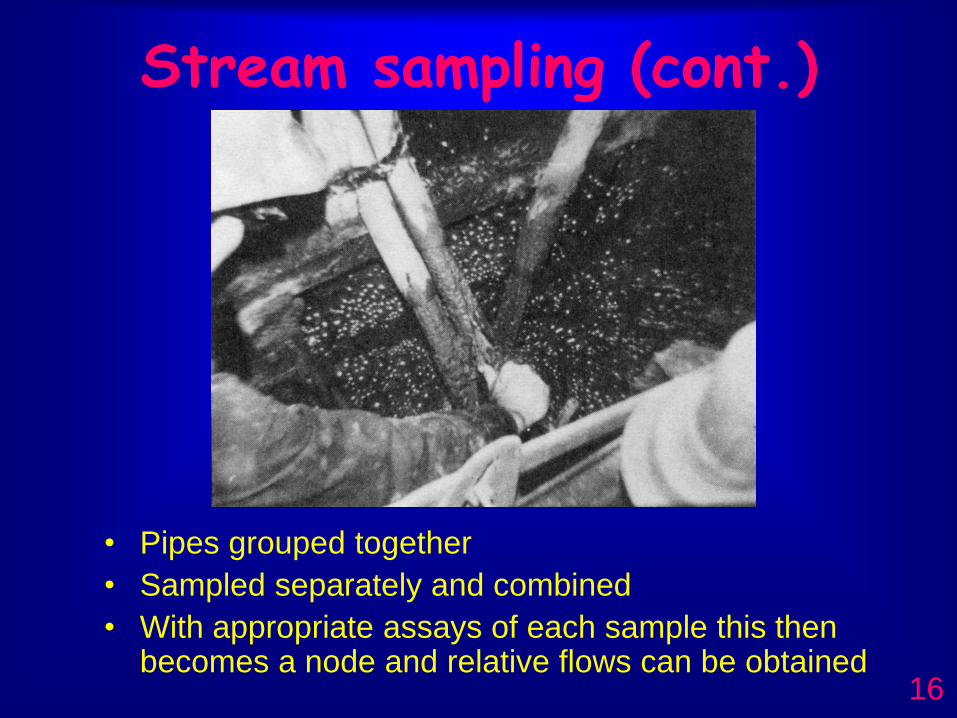
Stream sampling (cont.)
• Pipes grouped together
• Sampled separately and combined
• With appropriate assays of each sample this then becomes a node and relative flows can be obtained
17
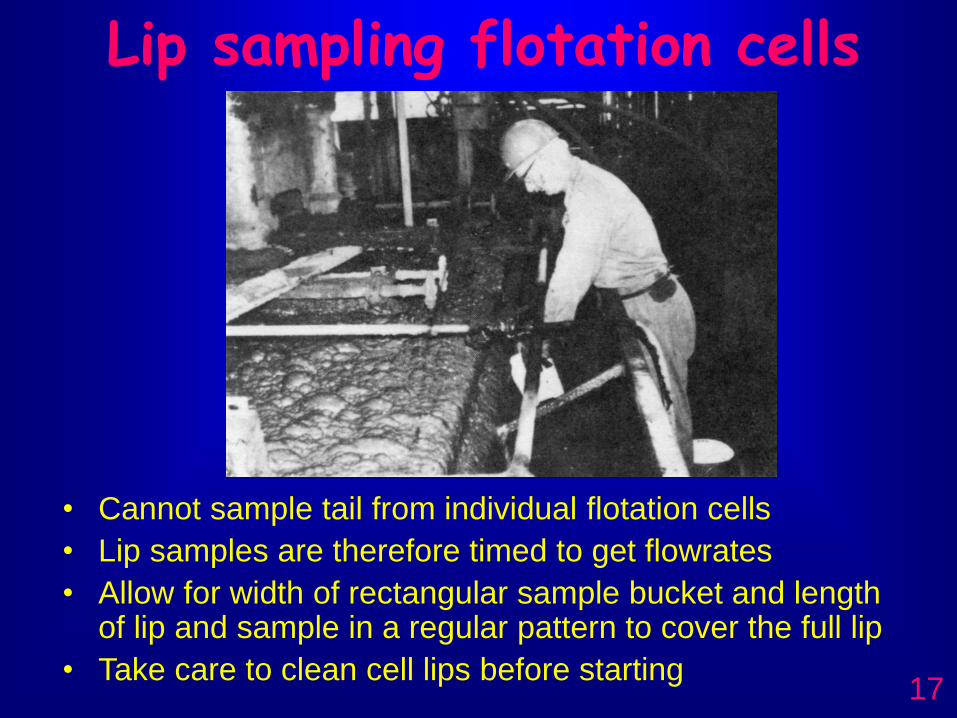
Lip sampling flotation cells
• Cannot sample tail from individual flotation cells
• Lip samples are therefore timed to get flowrates
• Allow for width of rectangular sample bucket and length of lip and sample in a regular pattern to cover the full lip
• Take care to clean cell lips before starting
18
Design criteria for automatic sample cutters
• The cutter must collect a complete cross-section of
the stream without sample loss
• The sample cutter must be non-restrictive and self-
clearing, discharging each increment to collection
without any overflow or undue hang-up.
• The cutting time at each point in the stream must
be equal (constant velocity)
• There are various automations of this type
19
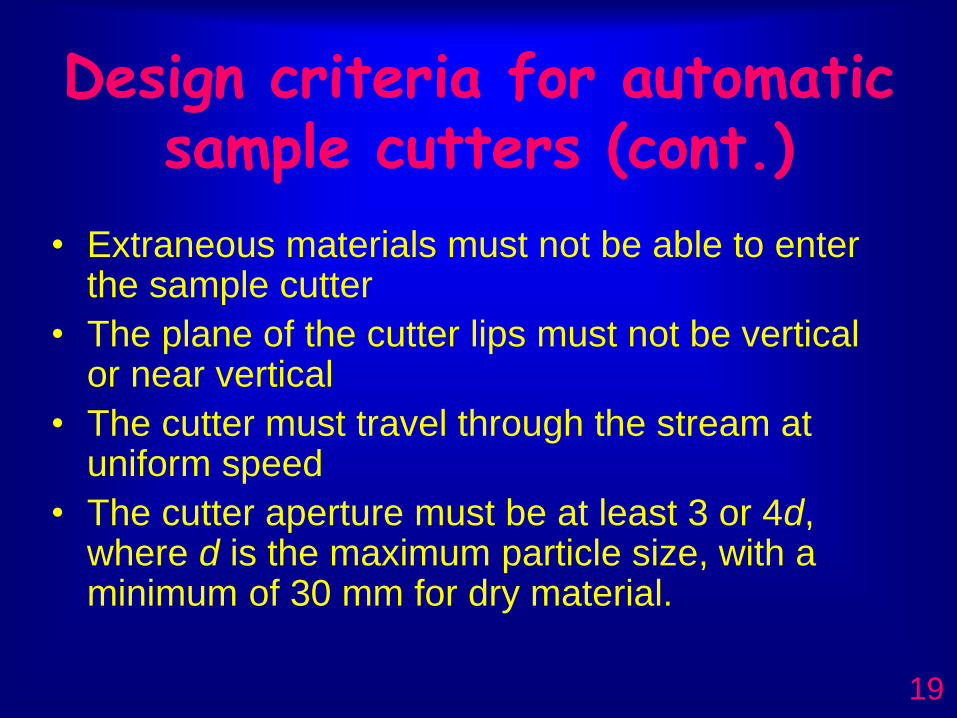
Design criteria for automatic sample cutters (cont.)
• Extraneous materials must not be able to enter the sample cutter
• The plane of the cutter lips must not be vertical or near vertical
• The cutter must travel through the stream at uniform speed
• The cutter aperture must be at least 3 or 4d, where d is the maximum particle size, with a minimum of 30 mm for dry material.
20
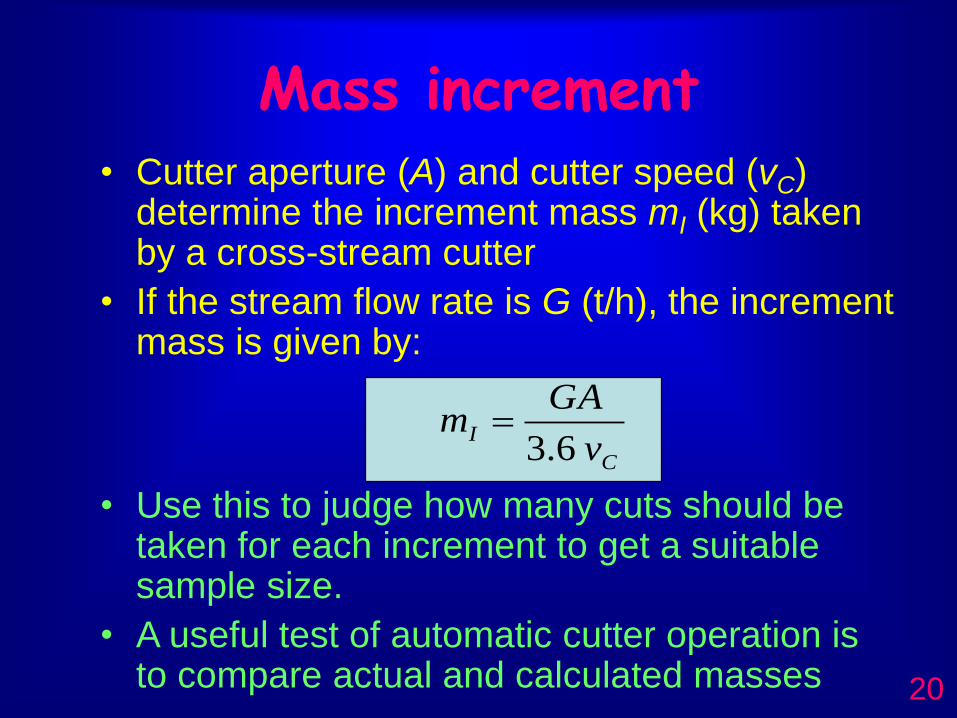
Mass increment• Cutter aperture (A) and cutter speed (vC)
determine the increment mass mI (kg) taken by a cross-stream cutter
• If the stream flow rate is G (t/h), the increment mass is given by:
• Use this to judge how many cuts should be taken for each increment to get a suitable sample size.
• A useful test of automatic cutter operation is to compare actual and calculated masses
C
Iv
GAm
6.3
21
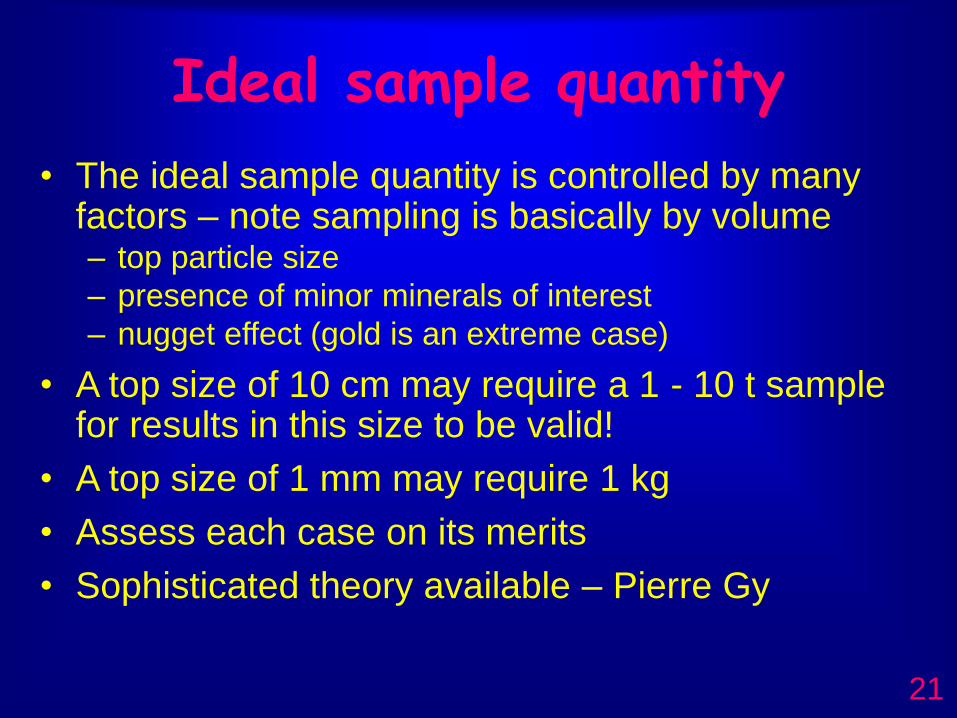
Ideal sample quantity
• The ideal sample quantity is controlled by many factors – note sampling is basically by volume– top particle size
– presence of minor minerals of interest
– nugget effect (gold is an extreme case)
• A top size of 10 cm may require a 1 - 10 t sample for results in this size to be valid!
• A top size of 1 mm may require 1 kg
• Assess each case on its merits
• Sophisticated theory available – Pierre Gy
22
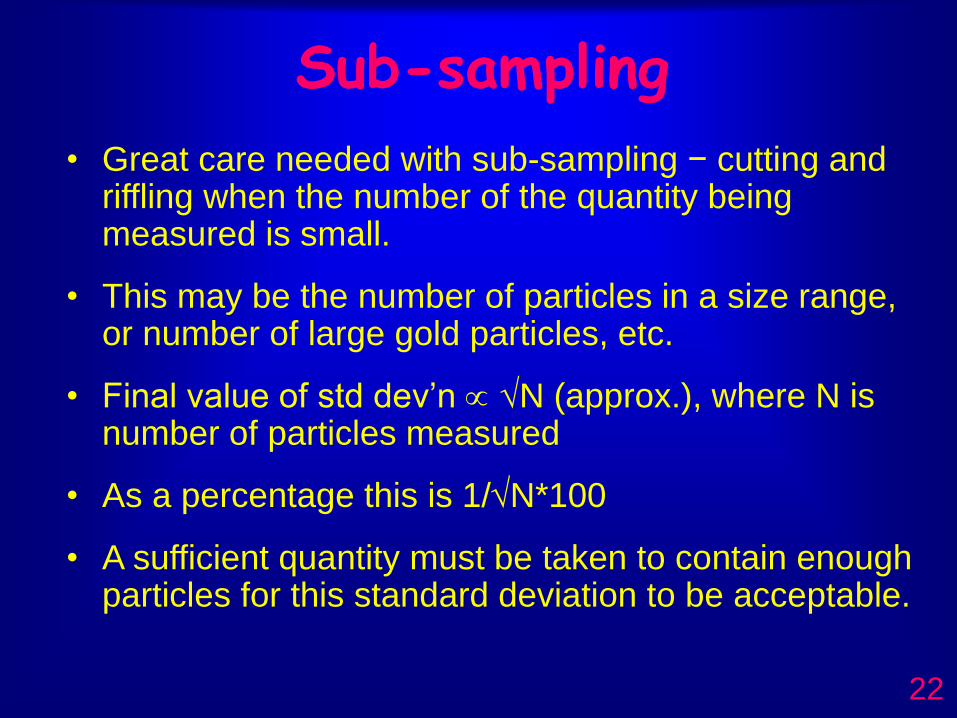
Sub-sampling
• Great care needed with sub-sampling − cutting and riffling when the number of the quantity being measured is small.
• This may be the number of particles in a size range, or number of large gold particles, etc.
• Final value of std dev’n N (approx.), where N is number of particles measured
• As a percentage this is 1/N*100
• A sufficient quantity must be taken to contain enough particles for this standard deviation to be acceptable.
23
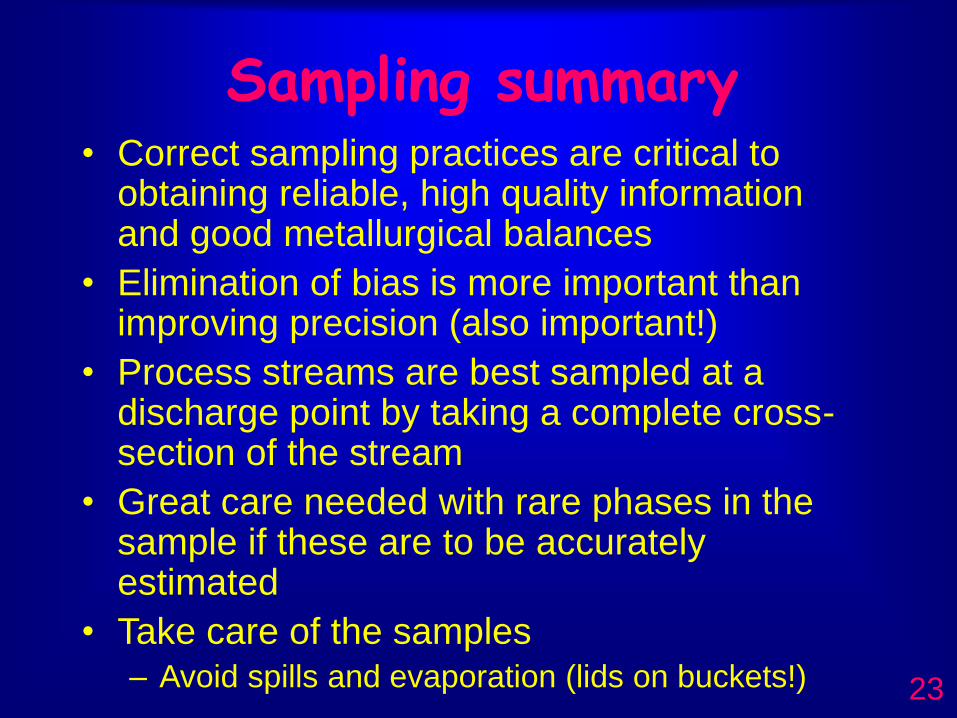
Sampling summary• Correct sampling practices are critical to
obtaining reliable, high quality information and good metallurgical balances
• Elimination of bias is more important than improving precision (also important!)
• Process streams are best sampled at a discharge point by taking a complete cross-section of the stream
• Great care needed with rare phases in the sample if these are to be accurately estimated
• Take care of the samples– Avoid spills and evaporation (lids on buckets!)
24
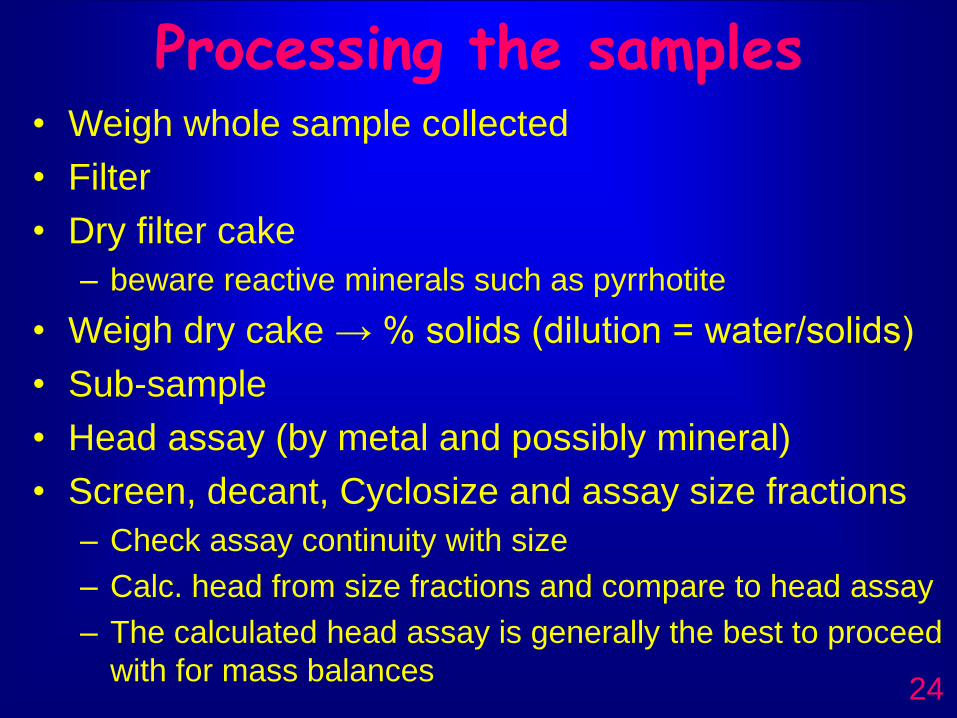
Processing the samples• Weigh whole sample collected
• Filter
• Dry filter cake
– beware reactive minerals such as pyrrhotite
• Weigh dry cake → % solids (dilution = water/solids)
• Sub-sample
• Head assay (by metal and possibly mineral)
• Screen, decant, Cyclosize and assay size fractions
– Check assay continuity with size
– Calc. head from size fractions and compare to head assay
– The calculated head assay is generally the best to proceed
with for mass balances

25
Metallurgical Balances
to obtain mass flows throughout the plant
26
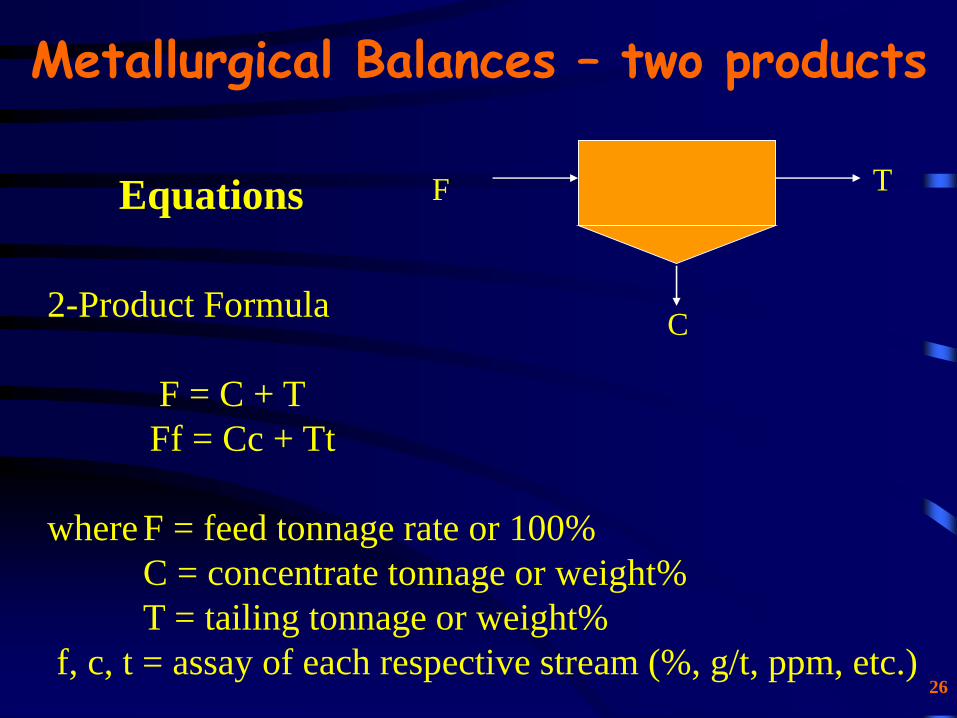
Metallurgical Balances – two products
Equations
2-Product Formula
F = C + T
Ff = Cc + Tt
where F = feed tonnage rate or 100%
C = concentrate tonnage or weight%
T = tailing tonnage or weight%
f, c, t = assay of each respective stream (%, g/t, ppm, etc.)
F
C
T
27
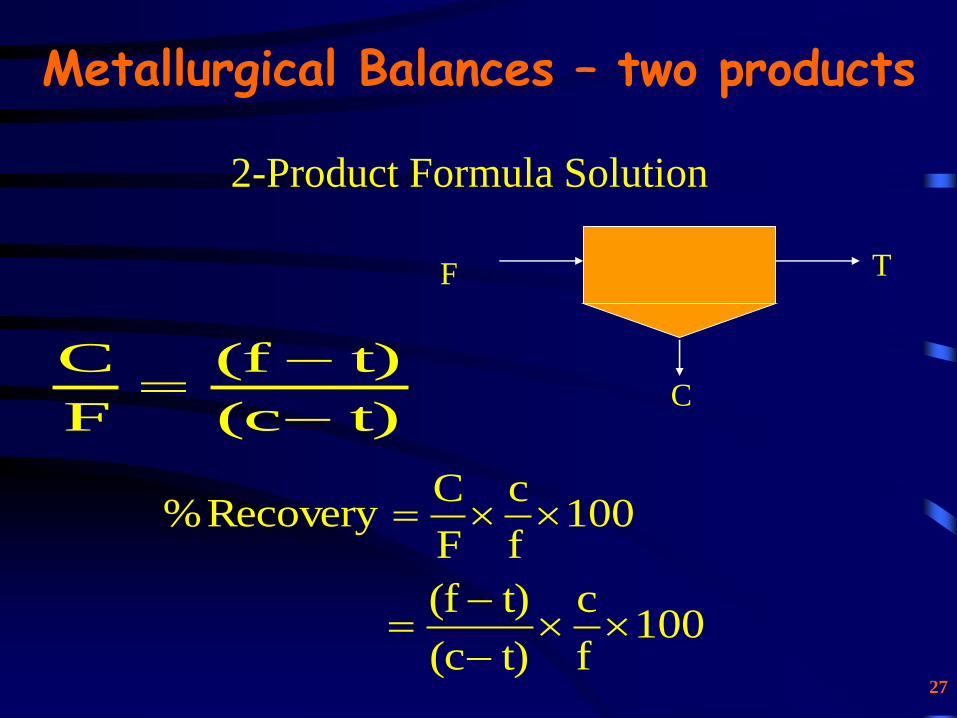
Metallurgical Balances – two products
100f
c
F
CRecovery%
t)(c
t)(f
F
C
2-Product Formula Solution
100f
c
t)(c
t)(f
F
C
T
28
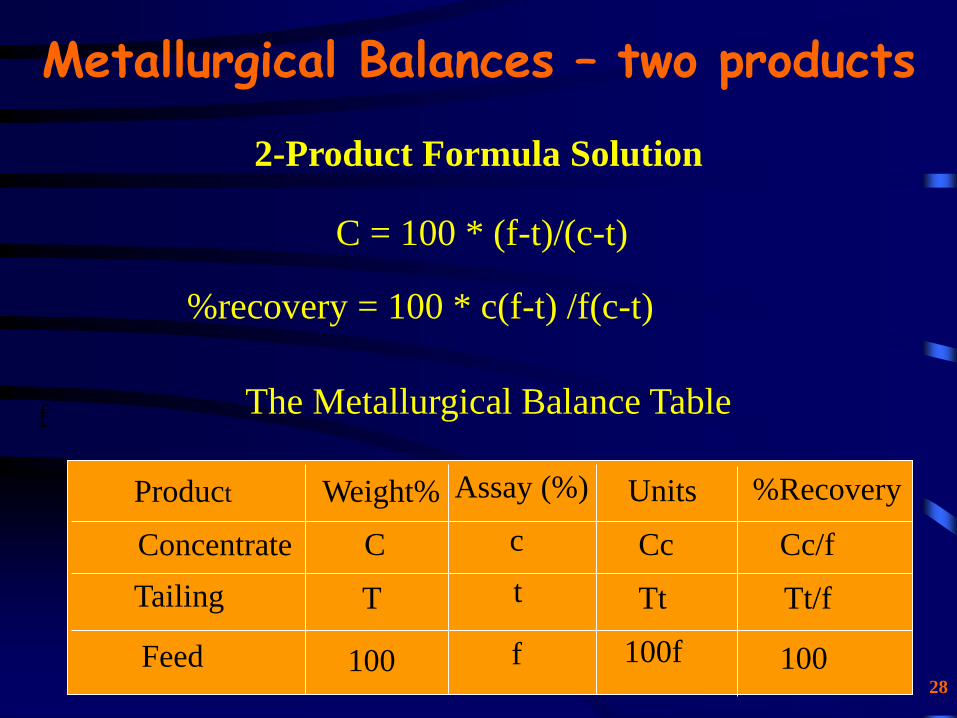
Metallurgical Balances – two products
C = 100 * (f-t)/(c-t)
%recovery = 100 * c(f-t) /f(c-t)
2-Product Formula Solution
The Metallurgical Balance Tablef
Weight% Assay (%) Units %RecoveryProduct
Concentrate
Tailing
Feed
T
100
C c
t
f
Tt
100f 100
Cc Cc/f
Tt/f
29
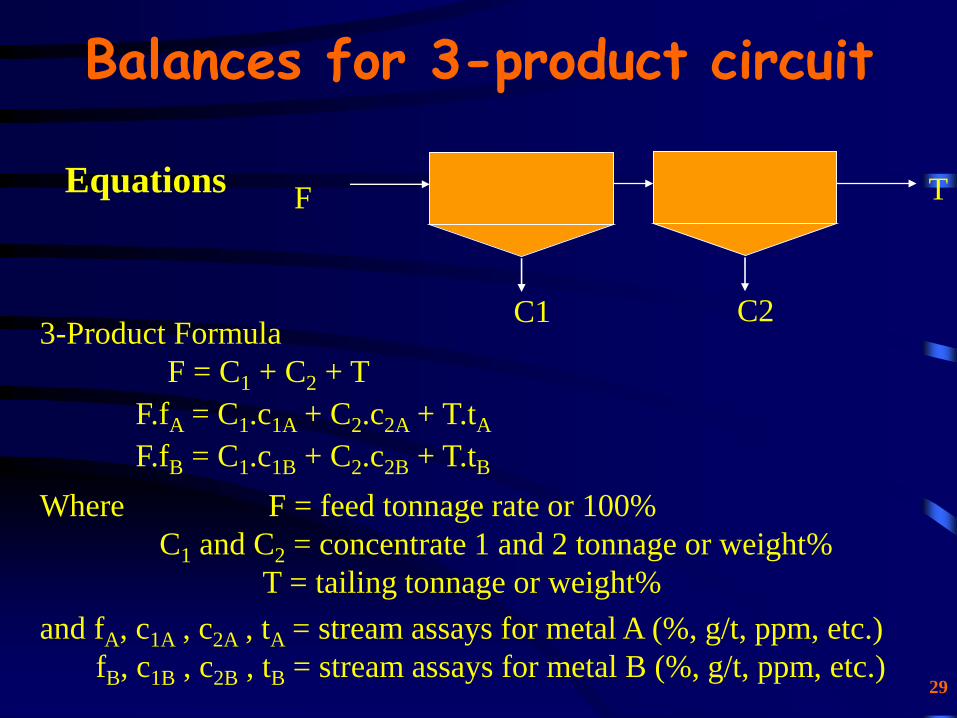
Balances for 3-product circuit
Equations
3-Product Formula
F = C1 + C2 + T
F.fA = C1.c1A + C2.c2A + T.tA
F.fB = C1.c1B + C2.c2B + T.tB
Where F = feed tonnage rate or 100%
C1 and C2 = concentrate 1 and 2 tonnage or weight%
T = tailing tonnage or weight%
and fA, c1A , c2A , tA = stream assays for metal A (%, g/t, ppm, etc.)
fB, c1B , c2B , tB = stream assays for metal B (%, g/t, ppm, etc.)
C2
TF
C1
30
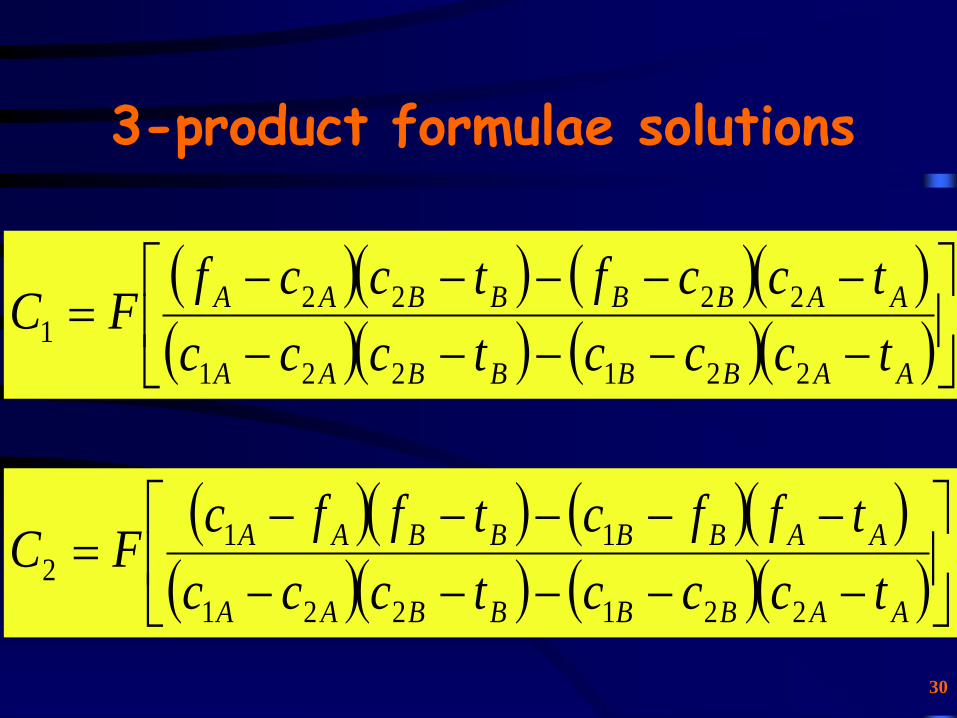
3-product formulae solutions
AABBBBAA
AABBBBAA
tccctccc
tccftccfFC
221221
22221
AABBBBAA
AABBBBAA
tccctccc
tffctffcFC
221221
112
31
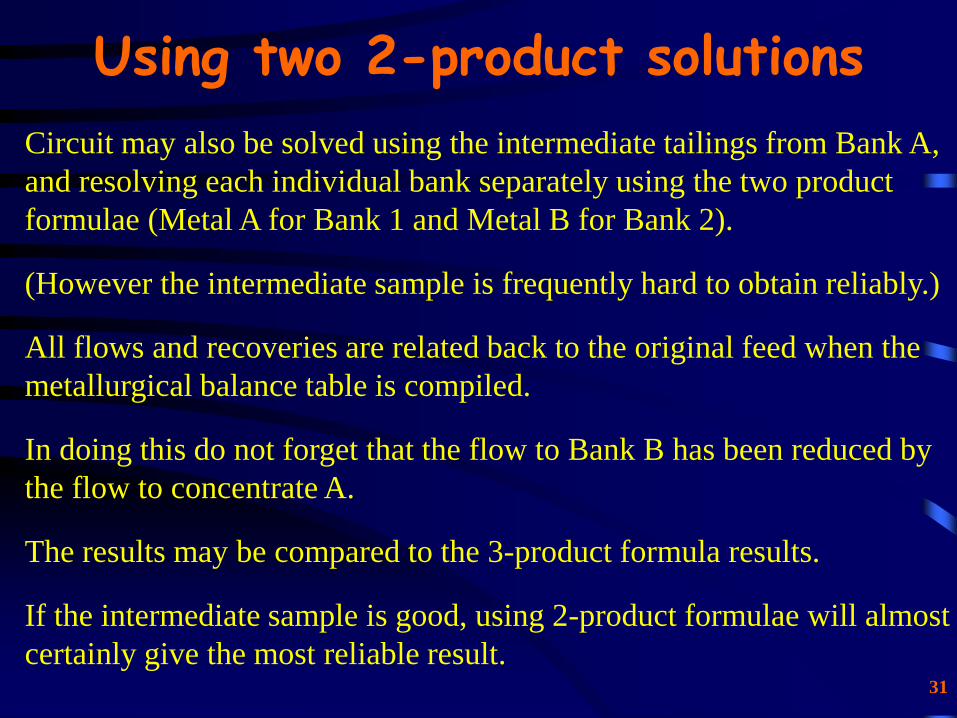
Using two 2-product solutions
Circuit may also be solved using the intermediate tailings from Bank A,
and resolving each individual bank separately using the two product
formulae (Metal A for Bank 1 and Metal B for Bank 2).
(However the intermediate sample is frequently hard to obtain reliably.)
All flows and recoveries are related back to the original feed when the
metallurgical balance table is compiled.
In doing this do not forget that the flow to Bank B has been reduced by
the flow to concentrate A.
The results may be compared to the 3-product formula results.
If the intermediate sample is good, using 2-product formulae will almost
certainly give the most reliable result.
32
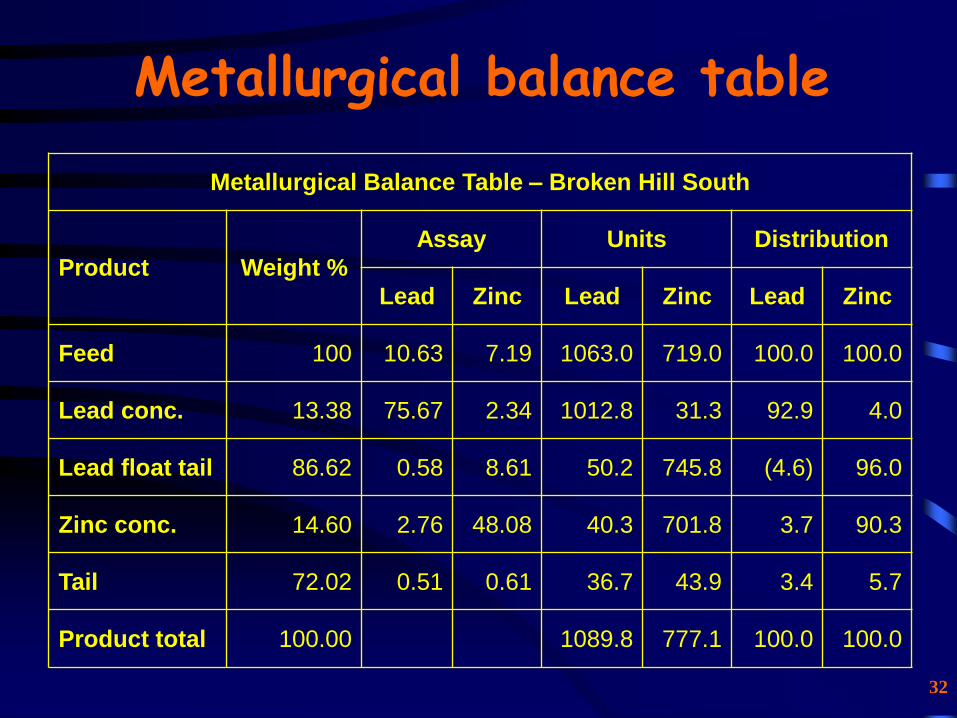
Metallurgical balance table
Metallurgical Balance Table – Broken Hill South
Product Weight %
Assay Units Distribution
Lead Zinc Lead Zinc Lead Zinc
Feed 100 10.63 7.19 1063.0 719.0 100.0 100.0
Lead conc. 13.38 75.67 2.34 1012.8 31.3 92.9 4.0
Lead float tail 86.62 0.58 8.61 50.2 745.8 (4.6) 96.0
Zinc conc. 14.60 2.76 48.08 40.3 701.8 3.7 90.3
Tail 72.02 0.51 0.61 36.7 43.9 3.4 5.7
Product total 100.00 1089.8 777.1 100.0 100.0
33
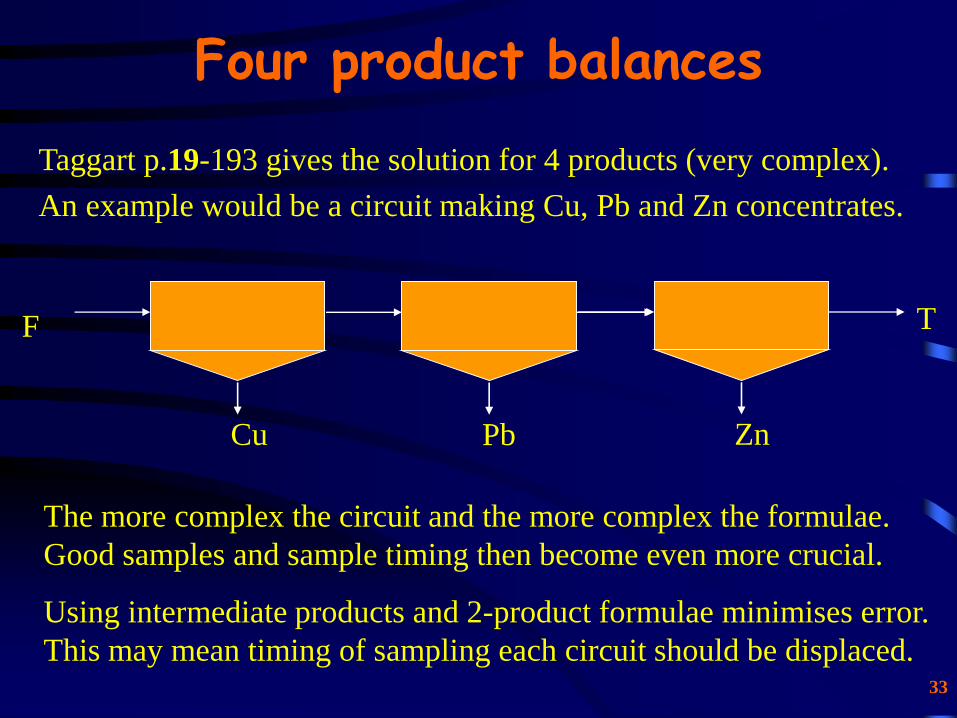
Four product balances
Taggart p.19-193 gives the solution for 4 products (very complex).
An example would be a circuit making Cu, Pb and Zn concentrates.
Pb
TF
Cu Zn
T
The more complex the circuit and the more complex the formulae.
Good samples and sample timing then become even more crucial.
Using intermediate products and 2-product formulae minimises error.
This may mean timing of sampling each circuit should be displaced.
34
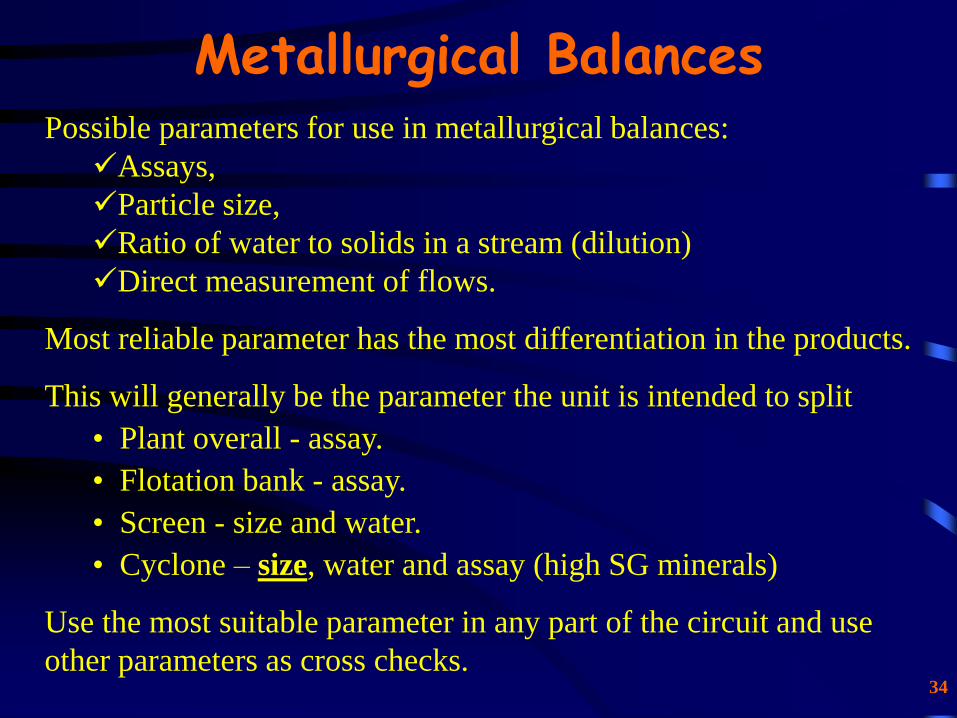
Metallurgical BalancesPossible parameters for use in metallurgical balances:
Assays,
Particle size,
Ratio of water to solids in a stream (dilution)
Direct measurement of flows.
Most reliable parameter has the most differentiation in the products.
This will generally be the parameter the unit is intended to split
• Plant overall - assay.
• Flotation bank - assay.
• Screen - size and water.
• Cyclone – size, water and assay (high SG minerals)
Use the most suitable parameter in any part of the circuit and use
other parameters as cross checks.
35
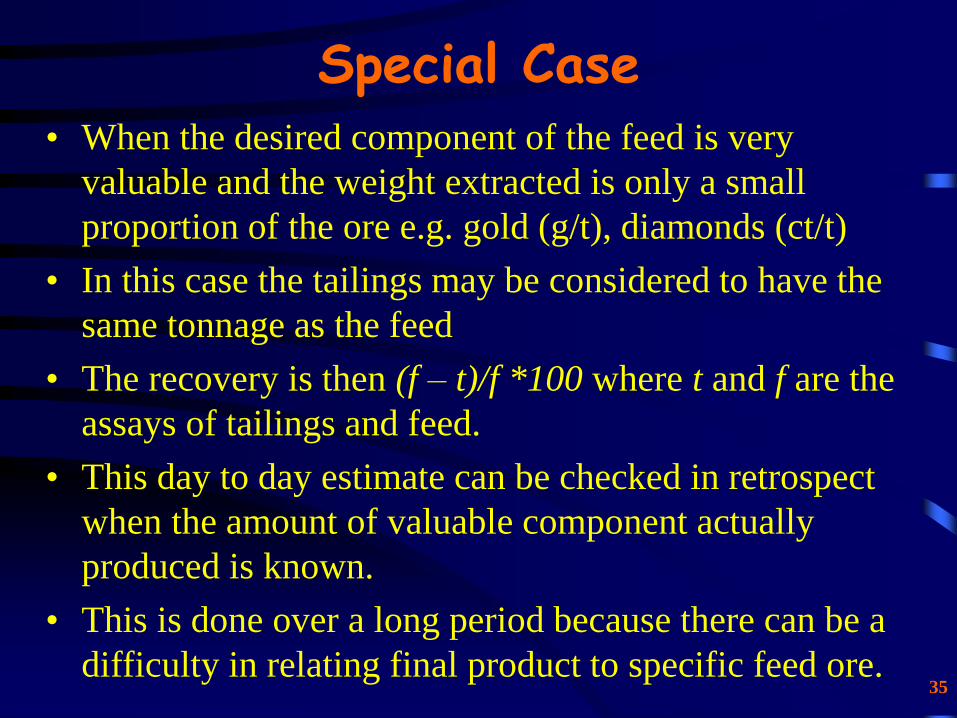
Special Case• When the desired component of the feed is very
valuable and the weight extracted is only a small
proportion of the ore e.g. gold (g/t), diamonds (ct/t)
• In this case the tailings may be considered to have the
same tonnage as the feed
• The recovery is then (f – t)/f *100 where t and f are the
assays of tailings and feed.
• This day to day estimate can be checked in retrospect
when the amount of valuable component actually
produced is known.
• This is done over a long period because there can be a
difficulty in relating final product to specific feed ore.
36
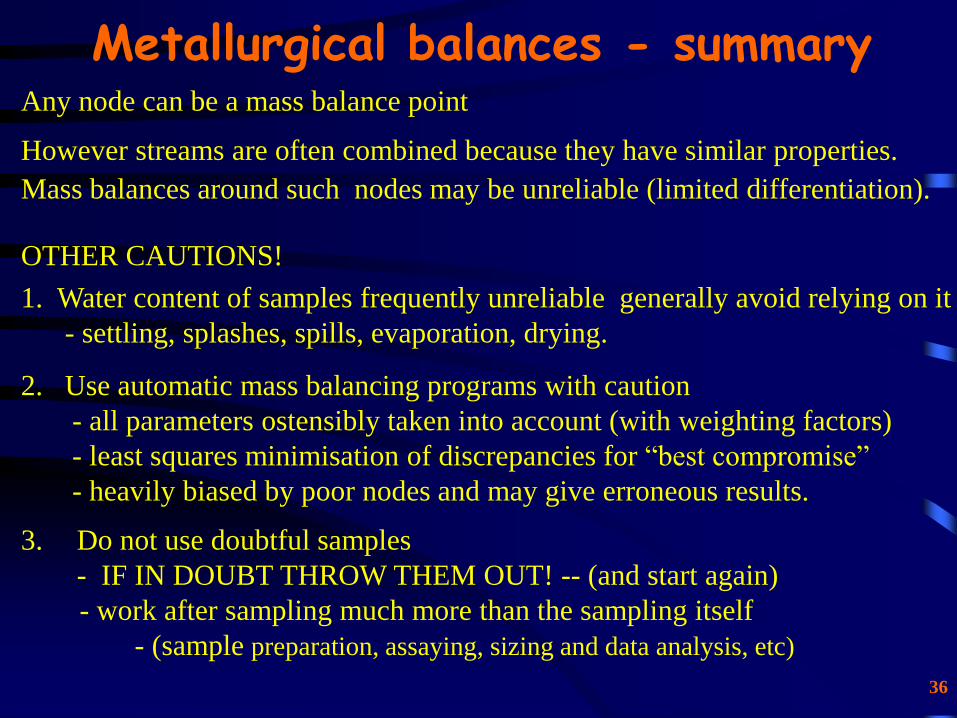
Any node can be a mass balance point
However streams are often combined because they have similar properties.
Mass balances around such nodes may be unreliable (limited differentiation).
OTHER CAUTIONS!
1. Water content of samples frequently unreliable generally avoid relying on it
- settling, splashes, spills, evaporation, drying.
2. Use automatic mass balancing programs with caution
- all parameters ostensibly taken into account (with weighting factors)
- least squares minimisation of discrepancies for “best compromise”
- heavily biased by poor nodes and may give erroneous results.
3. Do not use doubtful samples
- IF IN DOUBT THROW THEM OUT! -- (and start again)
- work after sampling much more than the sampling itself
- (sample preparation, assaying, sizing and data analysis, etc)
Metallurgical balances - summary

37
Interpreting the Data
What is happening ?
Why is it so?
38
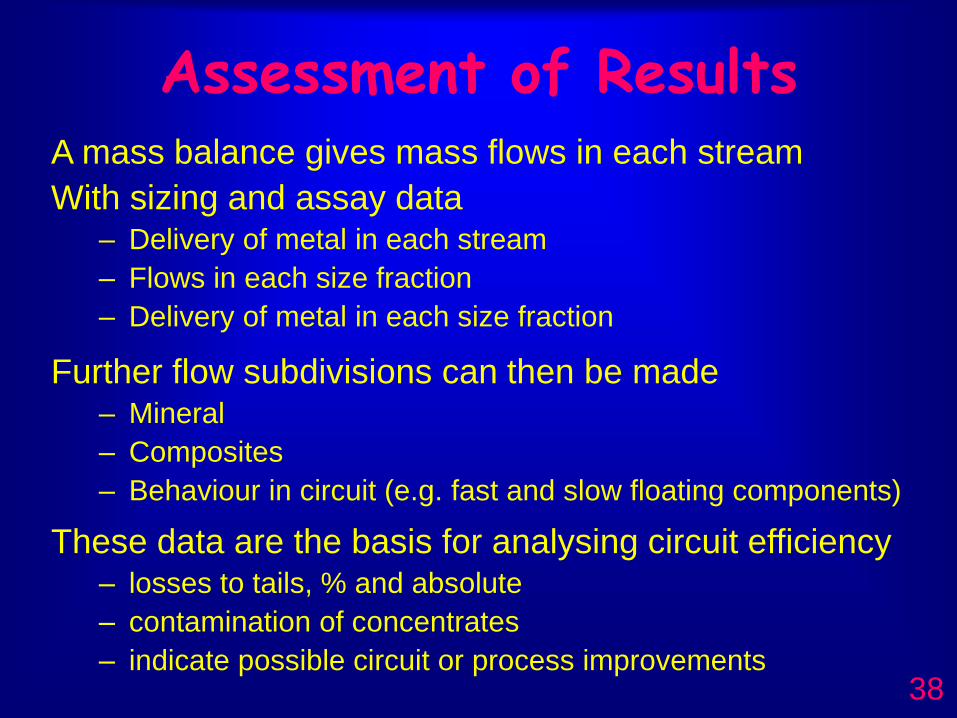
A mass balance gives mass flows in each stream
With sizing and assay data – Delivery of metal in each stream
– Flows in each size fraction
– Delivery of metal in each size fraction
Further flow subdivisions can then be made – Mineral
– Composites
– Behaviour in circuit (e.g. fast and slow floating components)
These data are the basis for analysing circuit efficiency– losses to tails, % and absolute
– contamination of concentrates
– indicate possible circuit or process improvements
Assessment of Results
39
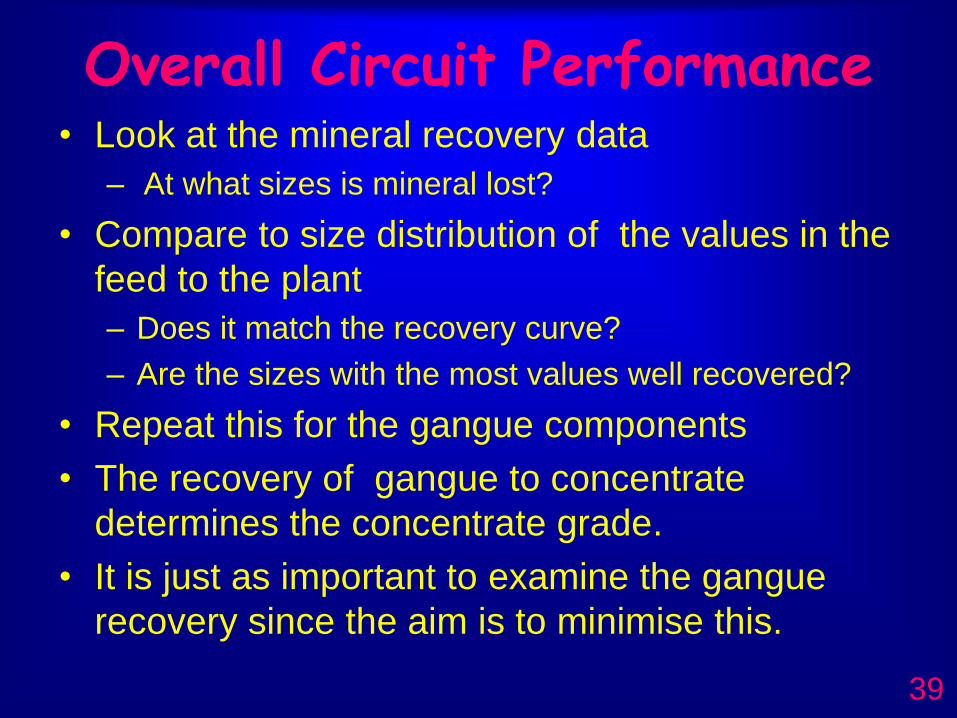
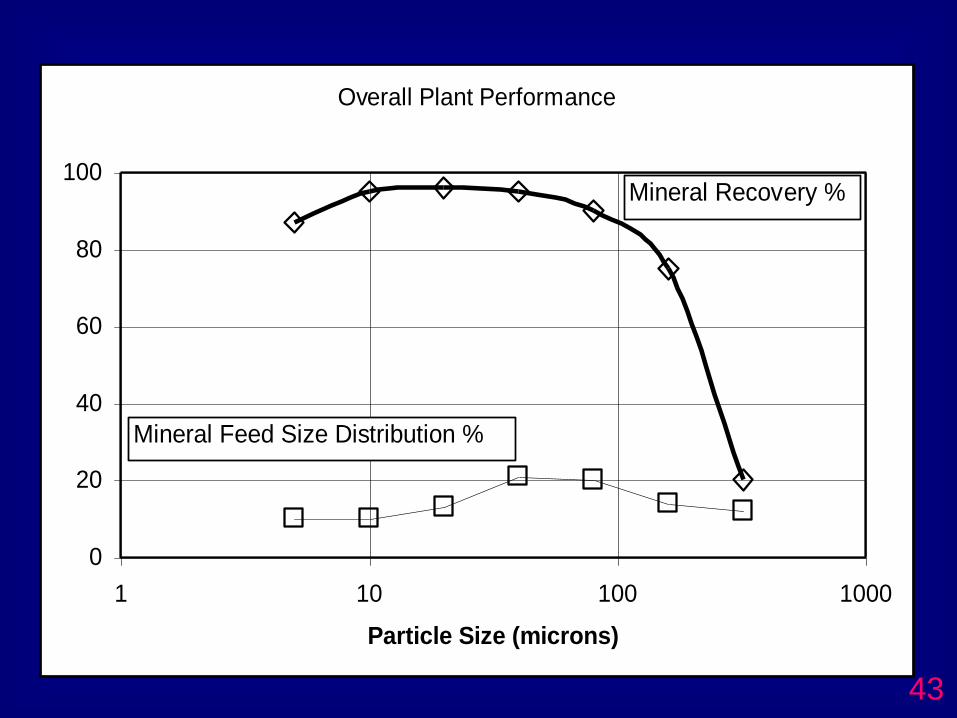
Overall Circuit Performance• Look at the mineral recovery data
– At what sizes is mineral lost?
• Compare to size distribution of the values in the
feed to the plant
– Does it match the recovery curve?
– Are the sizes with the most values well recovered?
• Repeat this for the gangue components
• The recovery of gangue to concentrate
determines the concentrate grade.
• It is just as important to examine the gangue
recovery since the aim is to minimise this.
40
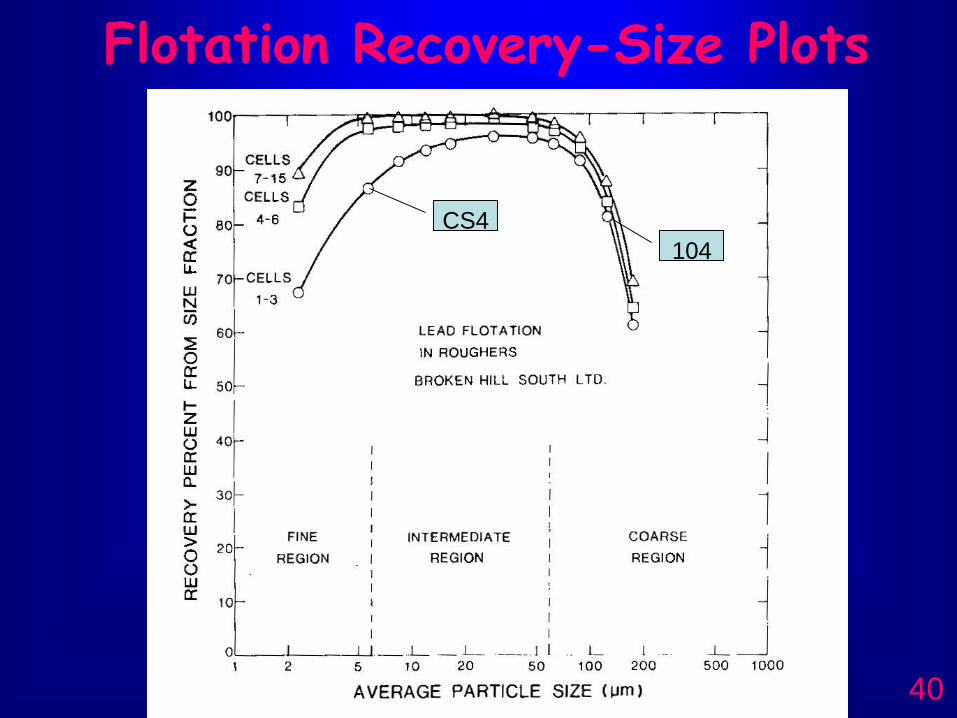
Flotation Recovery-Size Plots
104
CS4
41
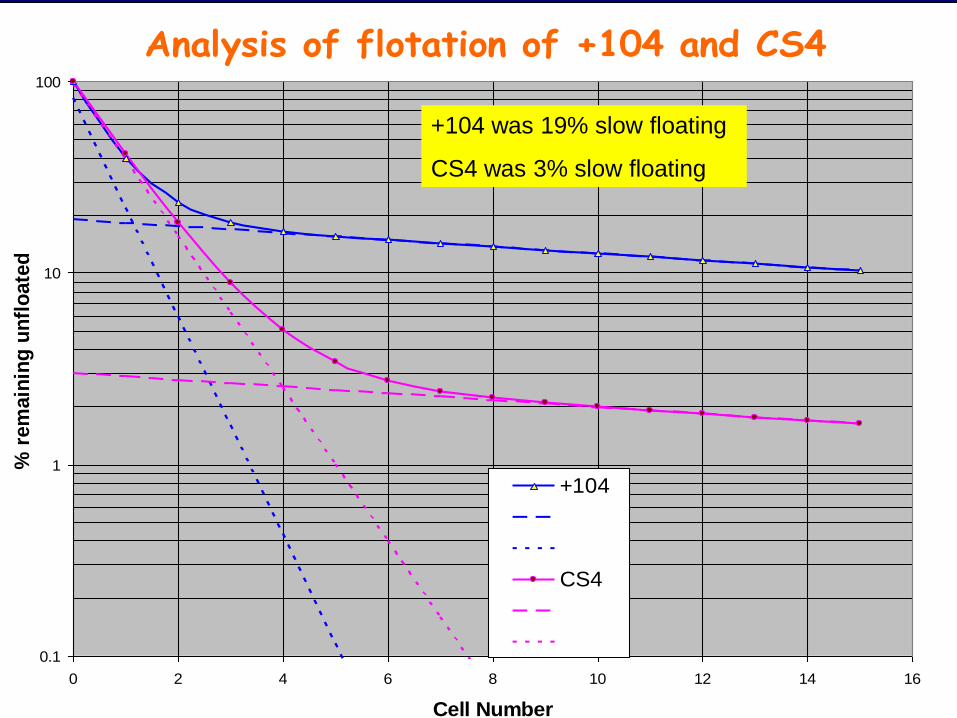
Analysis of flotation of +104 and CS4
0.1
1
10
100
0 2 4 6 8 10 12 14 16
Cell Number
% r
em
ain
ing
un
flo
ate
d
+104
CS4
+104 was 19% slow floating
CS4 was 3% slow floating
42
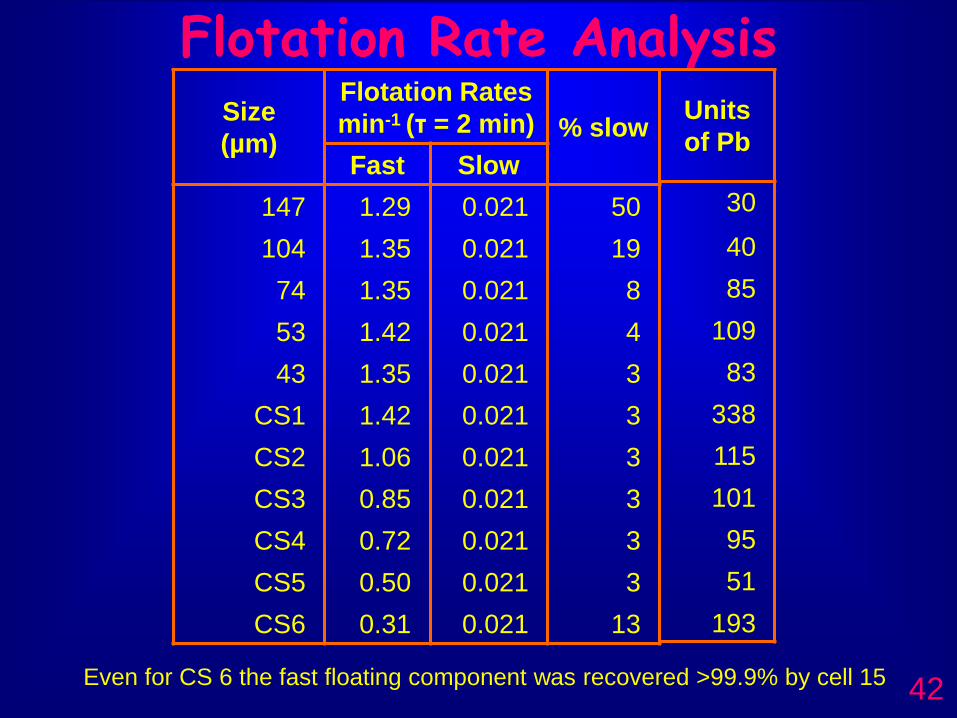
Flotation Rate AnalysisSize
(µm)
Flotation Rates
min-1 (τ = 2 min) % slow
Fast Slow
147 1.29 0.021 50
104 1.35 0.021 19
74 1.35 0.021 8
53 1.42 0.021 4
43 1.35 0.021 3
CS1 1.42 0.021 3
CS2 1.06 0.021 3
CS3 0.85 0.021 3
CS4 0.72 0.021 3
CS5 0.50 0.021 3
CS6 0.31 0.021 13
Units
of Pb
30
40
85
109
83
338
115
101
95
51
193
Even for CS 6 the fast floating component was recovered >99.9% by cell 15
43
Overall Plant Performance
0
20
40
60
80
100
1 10 100 1000
Particle Size (microns)
Mineral Recovery %
Mineral Feed Size Distribution %
44
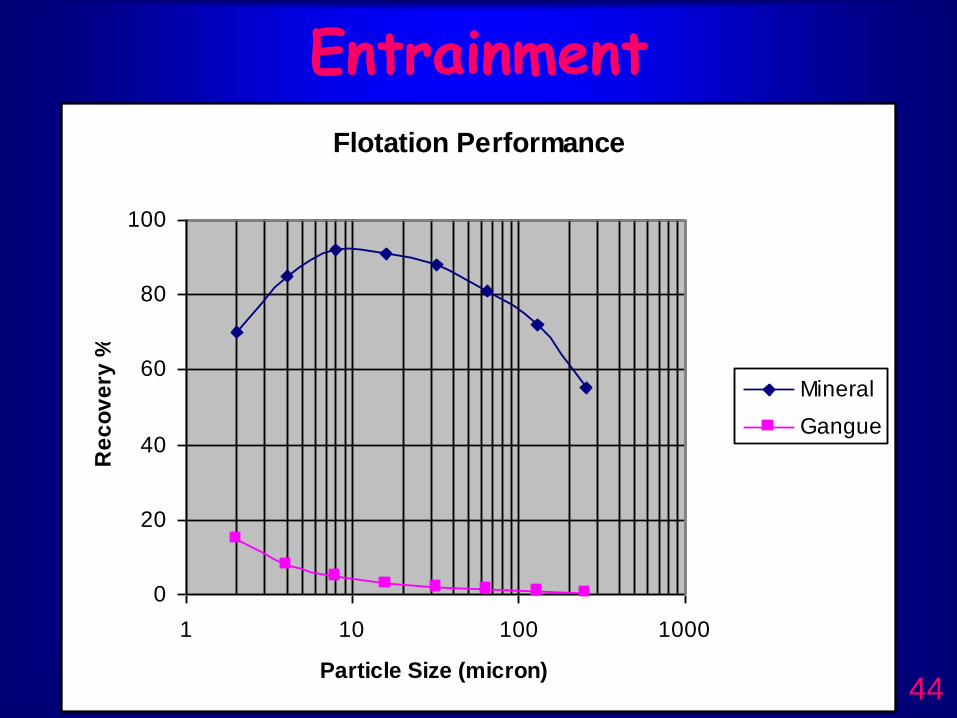
Entrainment
Flotation Performance
0
20
40
60
80
100
1 10 100 1000
Particle Size (micron)
Re
co
ve
ry %
Mineral
Gangue
45
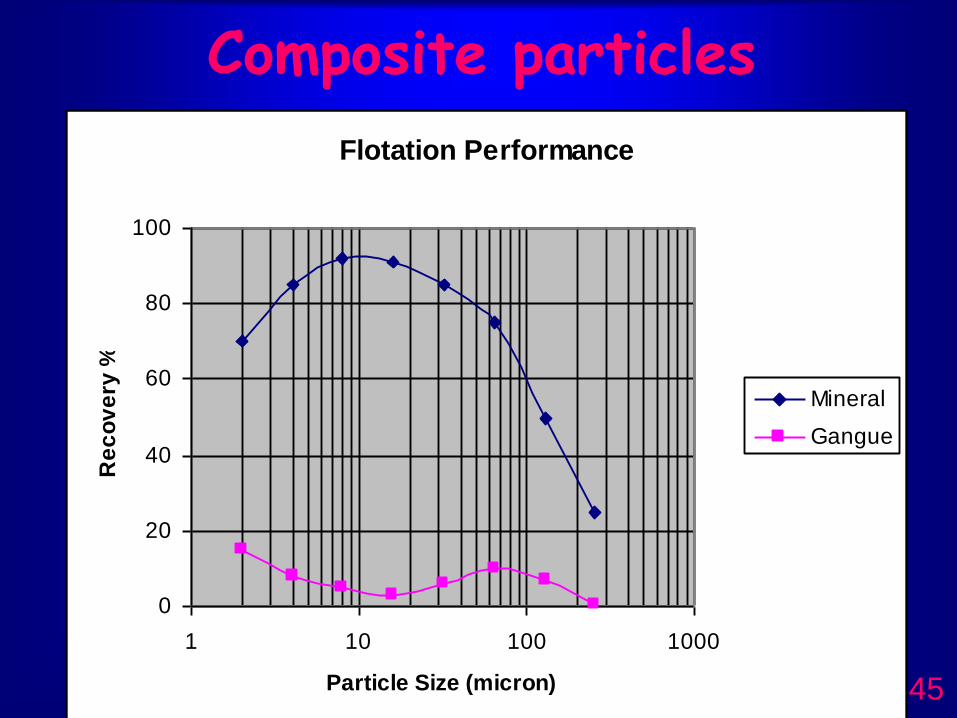
Flotation Performance
0
20
40
60
80
100
1 10 100 1000
Particle Size (micron)
Re
co
ve
ry %
Mineral
Gangue
Composite particles
46
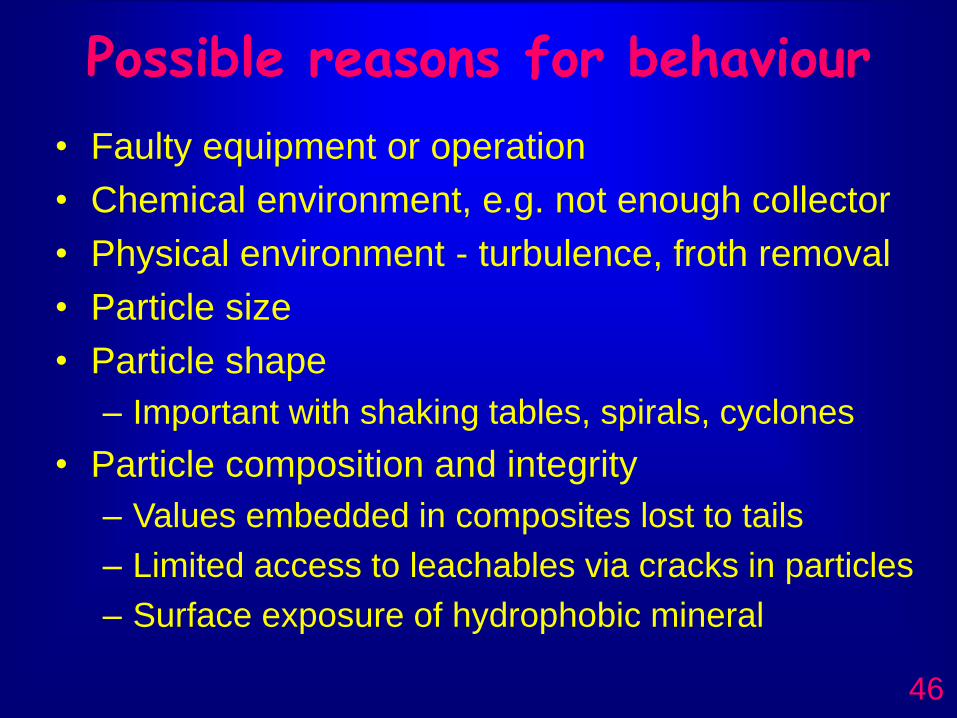
Possible reasons for behaviour
• Faulty equipment or operation
• Chemical environment, e.g. not enough collector
• Physical environment - turbulence, froth removal
• Particle size
• Particle shape
– Important with shaking tables, spirals, cyclones
• Particle composition and integrity
– Values embedded in composites lost to tails
– Limited access to leachables via cracks in particles
– Surface exposure of hydrophobic mineral
47
Recovery of coarse particles in flotation
• Recovery of coarse particles is only by true flotation.
– There is no significant contribution by entrainment.
• In some systems coarse particles can float very well.
• Recovery in coarse sizes is often the key to a good
overall result.
• Collector concentration can have a major influence on
coarse particles.
48
Flotation of coarse particlesThe flotation of coarse particles may be particularly influenced
by several factors which determine recovery:
• Liberation: – The coarser the size the higher the likelihood of composite particles.
– The lower the amount of potentially hydrophobic surface on a particle the lower the probability it will make a productive attachment to a bubble.
• Surface hydrophobicity– Lower hydrophobicity gives a less secure attachment with the
possibility that a particle will disengage from a bubble.
– Hydrophobicity is affected by the mineral species and by the general chemical conditions and the suitability and concentration of the collector in particular.
• Cell hydrodynamic conditions– Very turbulent conditions can cause bubble detachment
– Conditions can be very different at different parts of the cell
49
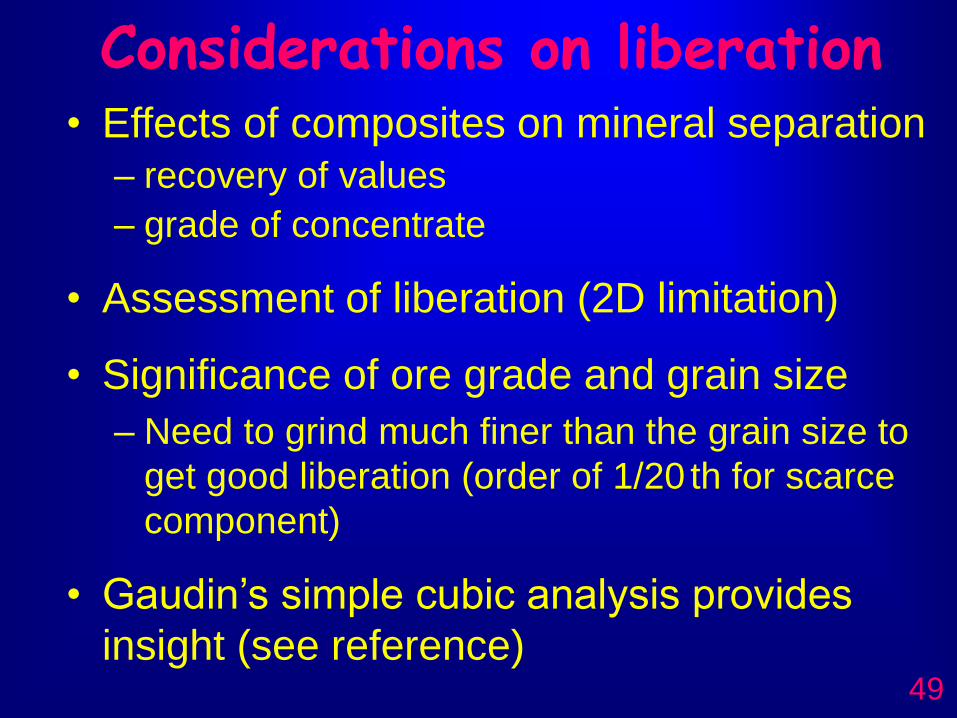
Considerations on liberation• Effects of composites on mineral separation
– recovery of values
– grade of concentrate
• Assessment of liberation (2D limitation)
• Significance of ore grade and grain size
– Need to grind much finer than the grain size to
get good liberation (order of 1/20 th for scarce
component)
• Gaudin’s simple cubic analysis provides
insight (see reference)
50
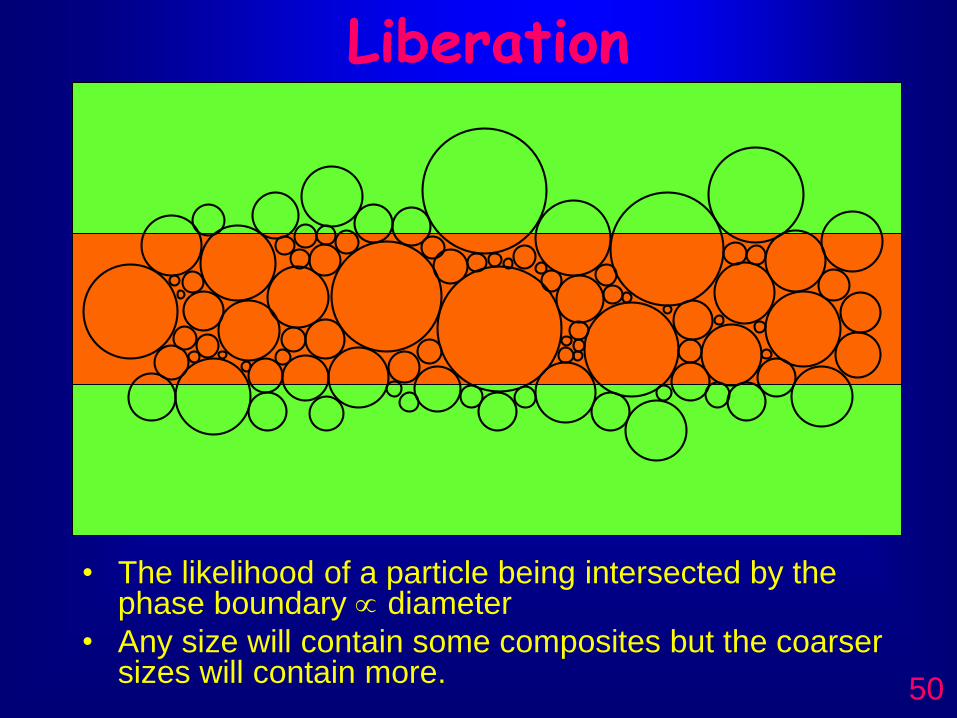
Liberation
• The likelihood of a particle being intersected by the phase boundary diameter
• Any size will contain some composites but the coarser sizes will contain more.

51
Liberation
Very dependent on • Texture of ore• Grain size of values• Grade of product• Size reduction
Some useful data from drill core but at this stage still need to check size fractions of products or grind and examine particles in size ranges of interest.
52
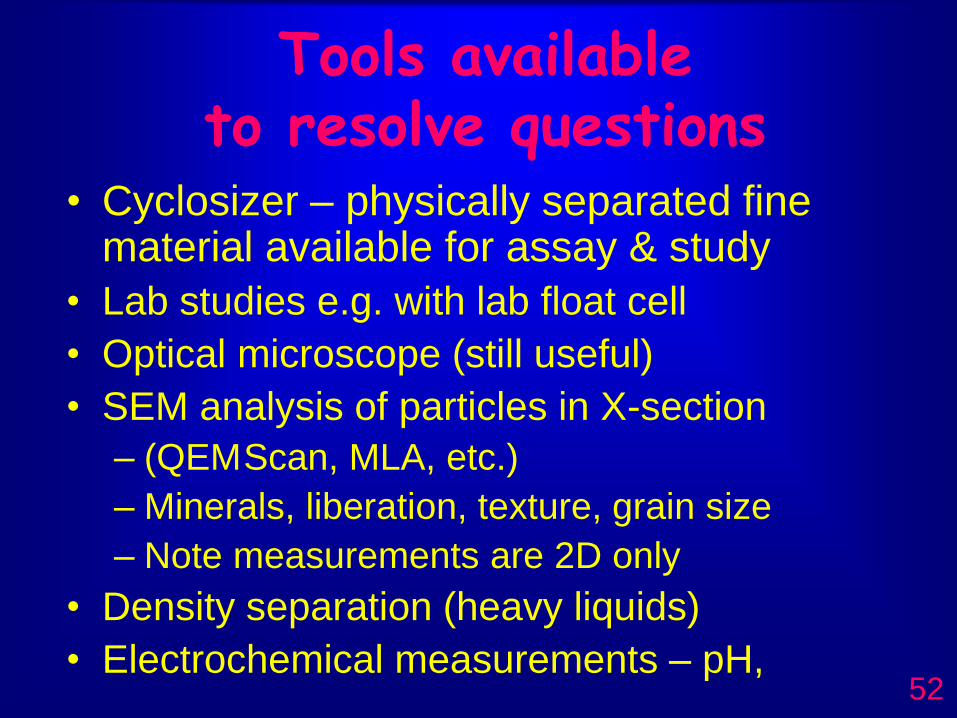
Tools available to resolve questions
• Cyclosizer – physically separated fine material available for assay & study
• Lab studies e.g. with lab float cell
• Optical microscope (still useful)
• SEM analysis of particles in X-section
– (QEMScan, MLA, etc.)
– Minerals, liberation, texture, grain size
– Note measurements are 2D only
• Density separation (heavy liquids)
• Electrochemical measurements – pH,
53
References• Greet, C. J., Flotation Plant Optimisation, AusIMM
Spectrum Series No 16, “A Metallurgical Guide to Identifying and Solving Problems in Flotation Plants”esp Ch. 2-4
• Gaudin, A. M., Principles of Mineral Dressing, Ch.4, “Liberation”, pp 70-91, McGraw-Hill NY , 1939
• Kelsall, D.F. Restarick, C.J. and Stewart, P.S.B."An improved Cyclosizing technique”, Proc. Aus.I.M.M.,
No.251, 9-15 (1974).

54


![GC-FID Method Development and Validation …pubs.sciepub.com/plant/2/3/2/plant-2-3-2.pdfof adulterants [4]. ... chemistry which deals with methods for determining the ... technique](https://static.fdocuments.us/doc/165x107/5b05f4967f8b9ac33f8c226f/gc-fid-method-development-and-validation-pubs-adulterants-4-chemistry-which.jpg)