Determining Golf Swing Patterns Using Motion … · Score. The normal and abnormal data were...
5
Abstract— Golf is a popular sport for exercise or socializing. It affects an increasing number of patients. Because of these reasons the researchers decided to focus on this problem. We presented the analysis golf swing using sensors named Razor IMU to detect golf swing motions. The rotation and acceleration data were gathered by sensors attached on the upper and lower back. These data were clustered by K-Mean Clustering. The data clusters were calculated boundaries by Z- Score. The normal and abnormal data were compared for the Back Swing-Half Swing to Top Swing position and Top Swing to impact position. From the experimental results, this algorithm can classify normal and abnormal data due to the significant differences. This paper can help to improve and correct swings and thus avoid injuries. Index Terms—Golf Swing Pattern, Injury Prevention, Gyroscope, Accelerometer, Polar Coordinate System, K-Mean Clustering, Standard Score I. INTRODUCTION resently, many people around the world like to play golf. The person who plays is at risk of many kinds of injury such as at the back, waist, spine, wrists and elbow. Records from Vibhavadi hospital [1]-[4] showed that 80% of golfers, both professional and amateurs, who paid a visit to the hospital, had painful injuries from playing golf, and the main cause was improper swing. The 8 basic stages of a swing are as shown in Fig.1 name posture name posture 1.Set up 2.Back Swing – Takeaway 3. Back Swing – Half Swing 4. Top Swing 5. Down Swing 6. Impact 7. Follow Through 8. Finish Fig.1. The 8 golf swing stages Manuscript received January 7, 2017; revised January 30, 2017. Wisan Tangwongcharoen and Wisut Titiroongruang are with Department of Electronics Engineering, Faculty of Engineering, King Mongkut’s Institute of Technology Ladkrabang, Bangkok, Thailand. (e-mail:[email protected], [email protected]). Because of the popularity of golf, there have been many research papers on detection of golf swing motion. A search of the literature showed us that swing motion detection were done mainly with 2 types of devices: using camera to capture the posture of golfer while he or she is swinging and using sensors attached to the golfer’s body parts. Using only one camera[5]-[6] may not capture all of the important body parts; adding more cameras at different locations around the golfer can fix this problem but it is very costly to do so. On the other hand, reliable results can be obtained using sensors[7]-[8] and the cost is much lower. This study investigated golf swing motion by using sensors with a new algorithm to classify proper and improper swings. Sensors were attached to 2 parts of the body where injuries have been most found at: upper back and lower back. Raw data were transformed into angular degree graphs. The graphs were then clustered by K-Mean Clustering in order to easily classify proper and improper swing. Subgroups of data processed by K-mean clustered were determined of their corresponding density by Z-Score. II. RELATED THEORIES A. Gyroscope A gyroscope [9] is a spinning wheel in which the axis of rotation is free to assume any orientation by itself. When rotating, the orientation of this axis is unaffected by tilting or rotation of the mounting, according to the conservation of angular momentum. Because of this, gyroscopes are useful for measuring or maintaining orientation. The rotation around X axis called “Pitch”. The rotation around Y axis called “Yaw” and Z axis called “Roll”. For Razor IMU tilt and swivel values are ±180. B. Accelerometer An accelerometer [10] is a device that measures proper acceleration in 3 dimension: x,y, and z. In this case proper acceleration is not the same as coordinate acceleration (rate of change of velocity). For Razor IMU acceleration values are ±16g. Wisan Tangwongcharoen and Wisut Titiroongruang Determining Golf Swing Patterns Using Motion Sensors for Injury Prevention P Fig. 2. The rotation around Yaw, Pitch, and Roll Fig. 3. The acceleration in X, Y and Z. Proceedings of the International MultiConference of Engineers and Computer Scientists 2017 Vol II, IMECS 2017, March 15 - 17, 2017, Hong Kong ISBN: 978-988-14047-7-0 ISSN: 2078-0958 (Print); ISSN: 2078-0966 (Online) IMECS 2017
Transcript of Determining Golf Swing Patterns Using Motion … · Score. The normal and abnormal data were...
Abstract— Golf is a popular sport for exercise or socializing.
It affects an increasing number of patients. Because of these
reasons the researchers decided to focus on this problem. We
presented the analysis golf swing using sensors named Razor
IMU to detect golf swing motions. The rotation and
acceleration data were gathered by sensors attached on the
upper and lower back. These data were clustered by K-Mean
Clustering. The data clusters were calculated boundaries by Z-
Score. The normal and abnormal data were compared for the
Back Swing-Half Swing to Top Swing position and Top Swing
to impact position. From the experimental results, this
algorithm can classify normal and abnormal data due to the
significant differences. This paper can help to improve and
correct swings and thus avoid injuries.
Index Terms—Golf Swing Pattern, Injury Prevention,
Gyroscope, Accelerometer, Polar Coordinate System, K-Mean
Clustering, Standard Score
I. INTRODUCTION
resently, many people around the world like to play golf.
The person who plays is at risk of many kinds of injury
such as at the back, waist, spine, wrists and elbow. Records
from Vibhavadi hospital [1]-[4] showed that 80% of golfers,
both professional and amateurs, who paid a visit to the
hospital, had painful injuries from playing golf, and the main
cause was improper swing. The 8 basic stages of a swing are
as shown in Fig.1
name posture name posture
1.Set up
2.Back Swing –
Takeaway
3. Back
Swing –
Half
Swing
4. Top Swing
5. Down
Swing
6. Impact
7. Follow
Through
8. Finish
Fig.1. The 8 golf swing stages
Manuscript received January 7, 2017; revised January 30, 2017.
Wisan Tangwongcharoen and Wisut Titiroongruang are with
Department of Electronics Engineering, Faculty of Engineering,
King Mongkut’s Institute of Technology Ladkrabang, Bangkok, Thailand.
(e-mail:[email protected], [email protected]).
Because of the popularity of golf, there have been many
research papers on detection of golf swing motion. A search
of the literature showed us that swing motion detection were
done mainly with 2 types of devices: using camera to capture
the posture of golfer while he or she is swinging and using
sensors attached to the golfer’s body parts. Using only one
camera[5]-[6] may not capture all of the important body
parts; adding more cameras at different locations around the
golfer can fix this problem but it is very costly to do so. On
the other hand, reliable results can be obtained using
sensors[7]-[8] and the cost is much lower. This study
investigated golf swing motion by using sensors with a new
algorithm to classify proper and improper swings. Sensors
were attached to 2 parts of the body where injuries have
been most found at: upper back and lower back. Raw data
were transformed into angular degree graphs. The graphs
were then clustered by K-Mean Clustering in order to easily
classify proper and improper swing. Subgroups of data
processed by K-mean clustered were determined of their
corresponding density by Z-Score.
II. RELATED THEORIES
A. Gyroscope
A gyroscope [9] is a spinning wheel in which the axis of
rotation is free to assume any orientation by itself. When
rotating, the orientation of this axis is unaffected by tilting or
rotation of the mounting, according to the conservation of
angular momentum. Because of this, gyroscopes are useful
for measuring or maintaining orientation. The rotation
around X axis called “Pitch”. The rotation around Y axis
called “Yaw” and Z axis called “Roll”. For Razor IMU tilt
and swivel values are ±180.
B. Accelerometer
An accelerometer [10] is a device that measures proper
acceleration in 3 dimension: x,y, and z. In this case proper
acceleration is not the same as coordinate acceleration (rate
of change of velocity). For Razor IMU acceleration values
are ±16g.
Wisan Tangwongcharoen and Wisut Titiroongruang
Determining Golf Swing Patterns Using
Motion Sensors for Injury Prevention
P
Fig. 2. The rotation around Yaw, Pitch, and Roll
Fig. 3. The acceleration in X, Y and Z.
Proceedings of the International MultiConference of Engineers and Computer Scientists 2017 Vol II, IMECS 2017, March 15 - 17, 2017, Hong Kong
ISBN: 978-988-14047-7-0 ISSN: 2078-0958 (Print); ISSN: 2078-0966 (Online)
IMECS 2017

C. Polar Coordinate System
In mathematics, the polar coordinate system is a two-
dimensional coordinate system in which each point on a
plane is determined by a distance from a reference point and
an angle from a reference direction. The reference point
(analogous to the origin of a Cartesian system) is called the
pole, and the ray from the pole in the reference direction is
the polar axis. The distance from the pole is called the radial
coordinate or radius, and the angle is called the angular
coordinate, polar angle, or azimuth.[11] as shown in Fig. 4.
D. The relation between Cartesian coordinate system and
Polar coordinate system
Both systems are related in trigonometry. The Polar
Coordinate System will convert between r and φ to Cartesian
System x and y using Sin and Cos as shown in (1) and (2)
Both equations illustrated in Fig.5
E. K-Mean Clustering
K-Mean Clustering[12] is the easiest unsupervised
clustering. This clustering will cut partitions. The data is
separated to K groups. Each cluster is represented by mean.
Means are used centroid in the clusters and used for
calculating distance between data in same group. The
distance between data is less when the data is in the same
group. If the distance is big, the data is in a different group.
The distances were calculated by Euclidean distance. Each
data is only one group. The properly data used K-Mean
Clustering is quantitative variable, interval scale or ration
scale. Start clustering by equation (3)
Where x is the data wanted to clustering
Ci is the cluster order i
ci is centroid of cluster order i
K is number of cluster
Using equation (4) for adjusting new centroid
Where mi is number of data in cluster order i
Equations (4) and (5) explains the algorithm as in Fig. 5.
From Fig.4, the nonclustered data were random centroid
and calculate distance between each data and centroid by
Euclidean distance as in equation (5)
Distance was checked for all data. When check was
finished, the new centroid was generated by equation (5)
until convergence.
F. Standard Score
Standard score [13] is the value using for comparing
between 2 data sets. When the data sets were compared,
there were problems, i.e. either the mean or SD were not
equal. The data cannot be compared if there is no standard.
The main idea of Standard value is to change the data to the
same standard. The most commonly used standard scores are
Z-scores, T-scores, and stanines. The Z score was used in
this paper because the data was not calculated in percentage
and only changed for calculating boundaries. The basic Z-
Score calculation as shown in equation (6)
Where Z is the clusters in X which are classified
X is the raw data
is the mean of the example data
SD is the standard deviation of the example data
n is number of data
When Z-Scores were calculated, the data was changed to the
normal curves to cut the boundaries. The boundaries were
calculated by the critical value (α) divided by 2 for equality
of upper bound and lower bound. The boundaries were
calculated by equation (7)
Where Z is standard score
μ is the Confidence Interval
is the mean of the example data
SD is the standard deviation of the example data
n is number of cluster data
(3)
(4)
(5)
Fig. 4. The relation between Cartesian System and Polar Coordinate
System [11]
Fig. 5. K Means algorithm[12]
(6)
(7)
(1)
(2)
Proceedings of the International MultiConference of Engineers and Computer Scientists 2017 Vol II, IMECS 2017, March 15 - 17, 2017, Hong Kong
ISBN: 978-988-14047-7-0 ISSN: 2078-0958 (Print); ISSN: 2078-0966 (Online)
IMECS 2017

III. METHODOLOGIES
The algorithm is showed in Fig. 6.
From Fig.6, shows the raw data obtained from the Razor
IMU sensor developed by Sparkfun Co. Ltd. These sensors
were wireless, using Bluetooth for data transfer and battery
usage. These sensors were contained in an acrylic box and
there was a body suit for the tester to wear as shown Fig.
7(a) and (b). The motion sensors was attached to the upper
and lower back as shown in Fig. 7(c)
We tested with 10 testers: five were normal subjects and
five were abnormal subjects. Each subject swung five times.
The raw data were transformed to linear graphs. Linear
graphs were transformed to angular degree graphs (Euler’s
graphs) by equation (2) and (3) and time variables were
represented by t1, t2 and t3 in second unit. Euler’s graphs
were classified by K-Mean Clustering to separate normal
cases and abnormal cases by equation (4) and adjusting
centroid by equation (5) From the K test, K=3 was suitable
in this case. Each group had some sub data with obvious
density. Standard deviations were calculated by Z-Score in
equation (6) and boundaries of densities were calculated by
equation (7) for bolded densities data.
IV. EXPERIMENTAL RESULTS
A. Sensor data
Two data sets were obtained from motion sensors as
shown in Fig. 8
From Fig. 8 shows the data obtained from the sensors on
both the upper and lower back. Linear graphs are separated
into 3 ranges followed by the basic stages of golf swing,
which are Set up to Top Swing, Down Swing to Impact and
Follow through to Finish. There are two types of data, which
are the tilt and swivel data as shown in Fig. 8(a) left and
acceleration data as shown in Fig. 8(a) right. Tilt and swivel
data has 3 data types: yaw, roll, and pitch. Yaw and pitch
data around range 4 to 6 shows extreme change, but roll data
shows a steady graph. The acceleration has 3 data types: x,
y, and z, changed from the end of range 5 to 6. In Fig.8 (b)
the tilt and acceleration data of lower back shows change
from range 3 to range 8.
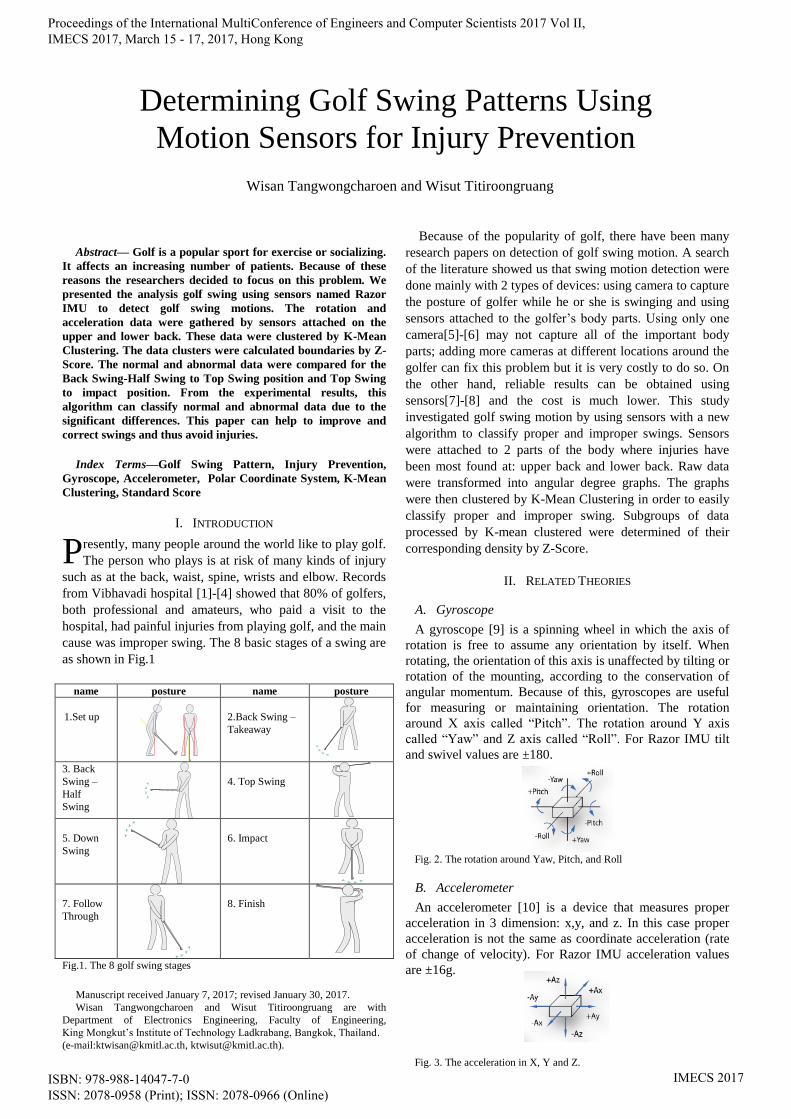
B. Euler’s Graphs
The raw data from sensors were transformed to Euler’s
graph as shown in Fig. 9
(
2
)
(
3
)
Fig.6. The motion sensor and how-to attached sensors to the tester
body [13]
(a)
(b) (c)
(a)
(b)
Fig.8. the tilt and acceleration graphs
Fig.6. The algorithm stages
Upper back (1)
Lower back (1)
(2) (3) (4)
(3) (2) (4)
Proceedings of the International MultiConference of Engineers and Computer Scientists 2017 Vol II, IMECS 2017, March 15 - 17, 2017, Hong Kong
ISBN: 978-988-14047-7-0 ISSN: 2078-0958 (Print); ISSN: 2078-0966 (Online)
IMECS 2017
From Fig.9 shows that the pitch and roll axis graphs for
normal cases are different when compared to graphs for
abnormal cases. The graph for normal cases in pitch axis has
the density only center, but for the graph for abnormal cases
in pitch axis, the data is distributed. The graph for normal
cases in roll axis also has more density than the graph for
abnormal cases.
From Fig.9 the normal acceleration graphs in 3 axis can
see difference clearly. The normal graph has pattern more
than abnormal case.
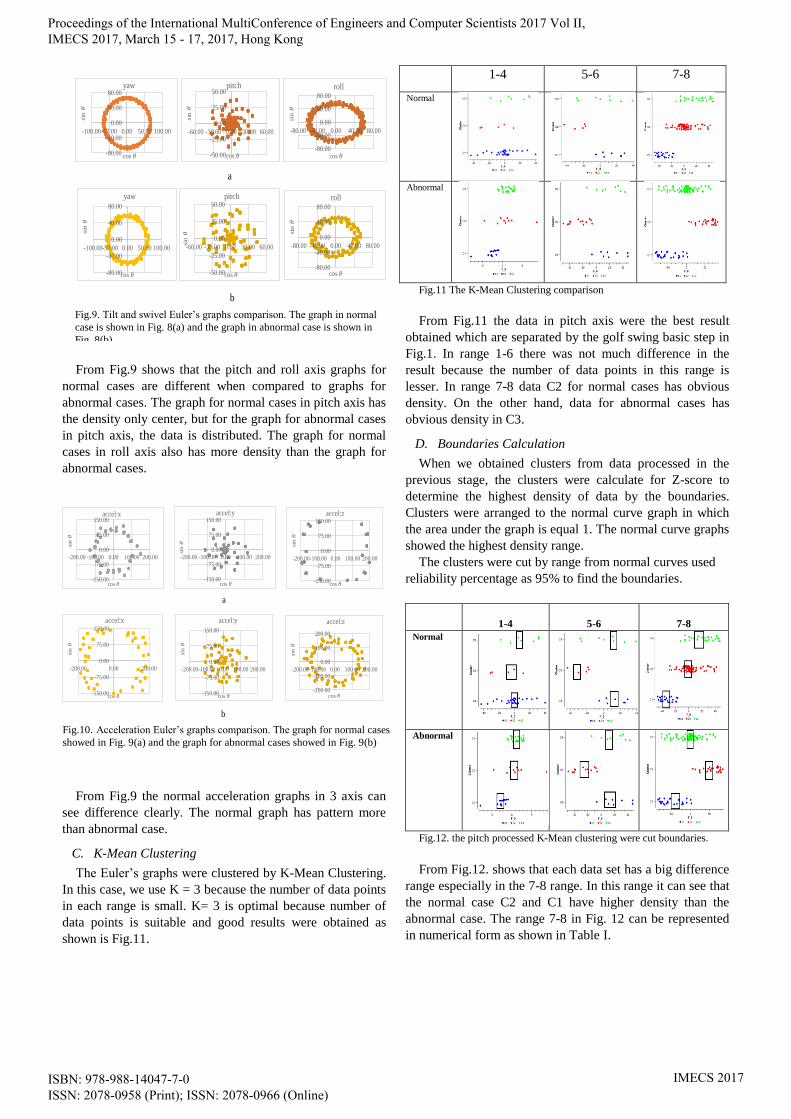
C. K-Mean Clustering
The Euler’s graphs were clustered by K-Mean Clustering.
In this case, we use K = 3 because the number of data points
in each range is small. K= 3 is optimal because number of
data points is suitable and good results were obtained as
shown is Fig.11.
1-4 5-6 7-8
Normal
Abnormal
Fig.11 The K-Mean Clustering comparison
From Fig.11 the data in pitch axis were the best result
obtained which are separated by the golf swing basic step in
Fig.1. In range 1-6 there was not much difference in the
result because the number of data points in this range is
lesser. In range 7-8 data C2 for normal cases has obvious
density. On the other hand, data for abnormal cases has
obvious density in C3.
D. Boundaries Calculation
When we obtained clusters from data processed in the
previous stage, the clusters were calculate for Z-score to
determine the highest density of data by the boundaries.
Clusters were arranged to the normal curve graph in which
the area under the graph is equal 1. The normal curve graphs
showed the highest density range.
The clusters were cut by range from normal curves used
reliability percentage as 95% to find the boundaries.
1-4
5-6
7-8
Normal
Abnormal
Fig.12. the pitch processed K-Mean clustering were cut boundaries.
From Fig.12. shows that each data set has a big difference
range especially in the 7-8 range. In this range it can see that
the normal case C2 and C1 have higher density than the
abnormal case. The range 7-8 in Fig. 12 can be represented
in numerical form as shown in Table I.
-80.00
-40.00
0.00
40.00
80.00
-100.00-50.00 0.00 50.00 100.00
sin �
cos �
yaw
-50.00
-25.00
0.00
25.00
50.00
-60.00 -30.00 0.00 30.00 60.00
sin �
cos �
pitch
-80.00
-40.00
0.00
40.00
80.00
-80.00 -40.00 0.00 40.00 80.00
sin �
cos �
roll
a
-80.00
-40.00
0.00
40.00
80.00
-100.00-50.00 0.00 50.00 100.00
sin �
cos �
yaw
b
-50.00
-25.00
0.00
25.00
50.00
-60.00 -30.00 0.00 30.00 60.00
sin �
cos �
pitch
-80.00
-40.00
0.00
40.00
80.00
-80.00 -40.00 0.00 40.00 80.00
sin �
cos �
roll
Fig.9. Tilt and swivel Euler’s graphs comparison. The graph in normal
case is shown in Fig. 8(a) and the graph in abnormal case is shown in
Fig. 8(b)
-150.00
-75.00
0.00
75.00
150.00
-200.00-100.00 0.00 100.00 200.00
sin �
cos �
accel:z
-150.00
-75.00
0.00
75.00
150.00
-200.00 -100.00 0.00 100.00 200.00
sin �
cos �
accel:y
-150.00
-75.00
0.00
75.00
150.00
-200.00 -100.00 0.00 100.00 200.00
sin �
cos �
accel:x
-150.00
-75.00
0.00
75.00
150.00
-200.00 0.00 200.00
sin �
cos �
accel:x
-200.00
-100.00
0.00
100.00
200.00
-200.00-100.00 0.00 100.00 200.00
sin �
cos �
accel:z
-150.00
-75.00
0.00
75.00
150.00
-200.00-100.00 0.00 100.00 200.00
sin �
cos �
accel:y
a
b
Fig.10. Acceleration Euler’s graphs comparison. The graph for normal cases
showed in Fig. 9(a) and the graph for abnormal cases showed in Fig. 9(b)
Proceedings of the International MultiConference of Engineers and Computer Scientists 2017 Vol II, IMECS 2017, March 15 - 17, 2017, Hong Kong
ISBN: 978-988-14047-7-0 ISSN: 2078-0958 (Print); ISSN: 2078-0966 (Online)
IMECS 2017

TABLE I
BOUNDARIES COMPARISON
Pitch range 1-4 Normal Abnormal
1 -1.36,[-2.41,0] -2.7,[-5.4,0]
2 -11.54,[-23.07,0] 0.99,[0,1.98]
3 11.28,[0,22.56] 1.19,[0,2.39]
Pitch range 5-6 Normal Abnormal
1 13.66,[0,27.32] 21.47,[0,42.94]
2 -26.25,[-52.49,0] -26.04,[-52.08,0]
3 3.35,[0,6.70] 18.78,[0,37.56]
Pitch range 7-8 Normal Abnormal
1 -33.19,[-66.37,0] -48.62,[-97.25,0]
2 18.44,[-26.52,0] 56.73,[0,113.46]
3 21.71,[0,43.43] -2.41,[-4.82,0]
From Table I. Due to the clusters having 3 groups: C1, C2,
and C3, the range shows mean, upper and lower bound
values in the bracket. We show only the range 7-8 because
we can see the difference more easily in this range than the
pitch 1-4 and 5-6. The number in each range can represent
both the normal and abnormal case. Table I. can classify
between normal and abnormal cases.
V. CONCLUSION
This paper is about golf swing analysis using motion
sensors to detect golf swing motions for classifying normal
and abnormal cases. Our work used 2 sensors attached on
the upper back and lower back for gathering data from 10
testers. The raw data from sensors were transformed to
Euler’s graph. The Euler’s graphs were classified by K-
Mean Clustering and data was arranged to normal curves to
find the highest density part in the sub data. From the
experimental results, it is clear that this algorithm can
classify between normal and abnormal. This paper can
improve the golf swing in new players and avoid further
injuries.
REFERENCES
[1] W. Chaopreecha. “Golf Injuries” Orthopedic Center, Vibhavadi
Hospital. Search from
http://www.vibhavadi.com/orthopedic/resourcesdetail.php?id=83 on
2016-12-21
[2] M.R. Farrally and A.J. Cochran (1998). Science and Golf Ⅲ.
Human Kinetics.
[3] McCarroll, J.R., and Gioe, T.J. (1982). Professional golfers and
the price they pay.
[4] McCarroll, J.R., Retting, A., and Shelbourne, K. (1990). Injuries in
the amateur golfer.
[5] C. N. K. Nam, H. J. Kang, Y. S. Suh, "Golf Swing Motion Tracking
U sing Inertial Sensors and a Stereo Camera", IEEE Transactions on
Instrumentation and Measurement, vol. 63, no. 4, pp. 943-952, April
2014. [6] H. Negoro, M. Ueda, K. Watanabe, K. Kobayashi, Y. Kurihara,
"Measurement and Analysis of Golf Swing Using 3D Acceleration
and Gyroscopic Sensors", SICE Annual Conference 2011 Waseda
University Tokyo Japan, pp. 1111-1114, 2011.
[7] K. Shirota, K. Watanabe, Y. Kurihara, "Measurement and analysis of
golf swing using 3-D acceleration and gyro sensor", SICE Annual
Conference Akita University, pp. 356-360, 2012.
[8] Y. Chen, Y. Hung, "Using Real-time Acceleration Data for Exercise
Movement Training with a Decision Tree Approach", Expert Systems
with Applications 2012, vol. 37, no. 12, pp. 7552-7556.
[9] D. MacKenzie.“Inventing Accuracy: A Historical Sociology of
Nuclear Missile Guidance”. Cambridge: MIT Press, 1990. pp. 40-42.
ISBN 0-262-13258-3
[10] A. Einstein(1920). "20". Relativity: The Special and General Theory.
New York: Henry Holt. p. 168. ISBN 1-58734-092-5.
[11] B. G. Richard(1997). Andrew M. Gleason, ed. Advanced
Mathematics: Precalculus with Discrete Mathematics and Data
Analysis. Evanston, Illinois: McDougal Littell. ISBN 0-395-77114-5.
[12] J. Phanitchart, and W. Kimpan(2015).Phase Graphs Applying Used
in Analyzing Scapular Patients. Chonburi, Thailand: The 7th
conference of Electrical Engineering Network of Rajamangala
University of Technology, pp. 137-140
[13] P.M. Tan, M. Steinbach, and V. Kumar(2005). Introduction of Data
Mining. Pearson Addison Wesley, pp. 497-502.ISBN-13: 978-
0321321367
[14] B. Gerstman(2008). Basic Biostatistics Statistics for Public Health
Practice. Jones and Bartlett Publishers, pp.129-139. ISBN-13: 978-
1284036015
[15] N. Reintrakulchai and W. Kimpan, "The design of golf swing pattern
analysis from motion sensors," 2014 International Computer Science
and Engineering Conference (ICSEC), Khon Kaen, 2014, pp. 222-
227.N. Meghanathan and G. W. Skelton, “Risk Notification Message
Dissemination Protocol for Energy Efficient Broadcast in Vehicular
Ad hoc Networks,” IAENG International Journal of Computer
Science, vol. 37, no. 1, pp. 1–10, Jul. 2010.
Proceedings of the International MultiConference of Engineers and Computer Scientists 2017 Vol II, IMECS 2017, March 15 - 17, 2017, Hong Kong
ISBN: 978-988-14047-7-0 ISSN: 2078-0958 (Print); ISSN: 2078-0966 (Online)
IMECS 2017