Determining Biological Sex via an Individual Marker
24
University at Albany, State University of New York University at Albany, State University of New York Scholars Archive Scholars Archive Anthropology Honors College 5-2018 Determining Biological Sex via an Individual Marker Determining Biological Sex via an Individual Marker Eden Alin University at Albany, State University of New York Follow this and additional works at: https://scholarsarchive.library.albany.edu/honorscollege_anthro Part of the Anthropology Commons Recommended Citation Recommended Citation Alin, Eden, "Determining Biological Sex via an Individual Marker" (2018). Anthropology. 19. https://scholarsarchive.library.albany.edu/honorscollege_anthro/19 This Honors Thesis is brought to you for free and open access by the Honors College at Scholars Archive. It has been accepted for inclusion in Anthropology by an authorized administrator of Scholars Archive. For more information, please contact [email protected].
Transcript of Determining Biological Sex via an Individual Marker

University at Albany, State University of New York University at Albany, State University of New York
Scholars Archive Scholars Archive
Anthropology Honors College
5-2018
Determining Biological Sex via an Individual Marker Determining Biological Sex via an Individual Marker
Eden Alin University at Albany, State University of New York
Follow this and additional works at: https://scholarsarchive.library.albany.edu/honorscollege_anthro
Part of the Anthropology Commons
Recommended Citation Recommended Citation Alin, Eden, "Determining Biological Sex via an Individual Marker" (2018). Anthropology. 19. https://scholarsarchive.library.albany.edu/honorscollege_anthro/19
This Honors Thesis is brought to you for free and open access by the Honors College at Scholars Archive. It has been accepted for inclusion in Anthropology by an authorized administrator of Scholars Archive. For more information, please contact [email protected].
Determining Biological Sex via an Individual Marker
An honors thesis presented to the
Department of Human Biology,
University at Albany, State University of New York
in partial fulfillment of the requirements
for graduation with Honors in Human Biology
and
graduation from the Honors College
Eden Alin
Research Mentor: Erica Brunelle
Jan Halámek, Ph.D.
Second Reader: Adam Gordon, Ph.D.
May 2018
2
Abstract
For decades, fingerprints have been a key tool in forensic analysis for the purpose of
identifying criminals. However, when deposited at a crime scene, there is often a small chance that
the fingerprint will match one in the FBI’s database of millions of files called, the Automated
Fingerprint Identification System, or AFIS. Beyond their unique image, fingerprints contain and
may unveil far more information about an individual. In this study, a chemical assay, the Sakaguchi
test, was further developed for the analysis of a single amino acid, arginine, found within
fingerprint sweat. Although arginine has significantly low concentration levels, the test proved to
be able to accurately determine the biological sex of the originator. Additionally, the test showed
high accuracy in differentiating male from female fingerprints even when they were collected from
crime scene scenario surfaces. Forensic science may be greatly advanced with the aptitude of
targeting a single analyte that can be correlated to multiple attributes of the originator such as
ethnicity, food habits or possible health status. This would allow for the creation of a profile
containing multiple characteristics of an individual from one fingerprint without additional
laborious processes. The quick and fairly straightforward methods in this experiment have the
potential to be utilized by law enforcement on-site without the need for intensive training or
scientific knowledge.

3
Acknowledgements
I would like to thank Professor Halámek for giving me the opportunity to join his research
team. I would also like to thank my mentor, Erica Brunelle for her patience, attentiveness and
constant support through all of my endeavors. Her knowledge and guidance has helped me inside
and outside of the lab. She is an excellent example of an educator and I am beyond happy to have
had the opportunity to work alongside her. My achievements would not have been possible without
the love and support from my dear friends, especially Josh Wauchope and Natasha Permaul. And
of course, I would like to thank my family for their endless encouragement throughout my
education.

4
Table of Contents
Abstract………………………………………………………………………………………...…2
Acknowledgments……………………………………………………………………………...…3
Introduction……………………………………………………………………………………….5
Materials and Methods…………………………………………………………………………....8
Results and Discussion…………………………………………………………………….…….12
Conclusion…………………………………………………………………………………….…17
Future Implication……………………………………………………………………………….18
References……………………………………………………………………………………….20
Appendix 1: Reprint Permission………………………………………………………………...22

5
Introduction
Each human has a unique pattern of frictional ridges on his or her finger and its impression
leaves behind a wealth of information about the individual. Fingerprints have been used for
identification purposes since prehistoric times. The practice of signing documents with a
thumbprint goes as far back as the third century BC in China and dispersed into Japan and India,
where it was documented in the first century AD.1 The late 19th century discovery of the unvarying
nature of human fingerprints throughout a lifetime and the technique of producing its inked
impression by the Scottish medical missionary Henry Faulds, opened the door for the use of these
patterns in forensic investigations.2 Fingerprints had become a tool in the advancement of justice.
They could now be used to narrow down a suspect at a crime scene or eliminate a suspect from
further scrutiny.
The study of fingerprints is known as fingerprint analysis, which can be broken down into
three distinct classifications; patent, plastic, or latent impressions.3 Patent prints happen when an
individual has a substance on his or her finger that leaves an evident mark, including blood, ink,
or mud. Plastic prints create an impression on a pliable surface, such as tacky paint, clay, heavy
grease or wax. Lastly, latent fingerprints, which are utilized in this paper, are made from the oils
and residues on hands. Specially trained investigators search for fingerprints at crime scenes in
areas where things seem to have been broken or disturbed.4 On a federal level, once there are any
found, the fingerprints may be photographed, recorded for distinctive features and entered into a
computerized database called Automated Fingerprint Identification System (AFIS). Although the
system has achieved exceptionally high matching accuracies, there are still problems that arise
such complicated background noise as well as poor quality of the fingerprint image.5 Additionally,

6
latent fingerprints are often not complete or smeared, making their search for a match far more
time consuming and challenging.
Finding a match alone presents an issue because the suspects fingerprint must already be
in the database. Similarly, DNA analysis, which is often an extremely useful and accurate
identification factor, presents investigators with issues much like fingerprint images. The process
may take anywhere between a few weeks to months with limited room for improvement in speed
due to the sensitivity of the tasks required to complete the full analysis.6 Moreover, infringement
of privacy of large scale personal data collection introduces a host of issues, including the need for
permission in the release of such information and high risk of its leakage.7 The research presented
in this paper may be utilized to not replace but fill in information gaps, if subsequent methods are
lacking.
Fingerprints are mainly made up of sweat and sebum, which contains metabolites created
by the body as a result of the many processes related to metabolism, regulated by a combination
of multiple hormone-based control mechanisms.8 Therefore, metabolism can be considered as a
function of physical characteristics including age, ethnicity, health status and/or biological sex.
The amino acid content of an individual only minimally changes depending on the physiological
state of the individual’s metabolism.9 These slight variations often happen over several hours and
can be distorted by some medications or after eating certain foods.10 However, research has shown
that the levels have greater variation between people in different demographic groups such as
males and females.10 Due to this difference, biological or biochemical content from sweat in
fingerprints may be manipulated to gain some information on a suspect connected to a crime scene.
The main aim of this research is to manipulate a chemical assay, which uses a sequence of
chemical reactions to target specific analyte(s). Initial examination of fingerprints using a chemical

7
assay started with ninhydrin. This fundamental biochemical reagent was accidentally developed
by Siegfried Ruhemann in 1911, when he observed the distinctive color reaction, a Ruhemann’s
purple, of ninhydrin with amino acids and peptides.11 In 1954, investigators Svante Oden and
Bengt von Hofsten proposed using ninhydrin for latent fingerprint development.12 The assay
targets all amino acids except proline and in the Halámek study specifically the overall
concentration of 23 amino acids. Ninhydrin showed a fairly high determination percentage
between male and female fingerprints, with females having a greater concentration.10 However,
multianalyte assays that target a larger number of amino acids cannot be fully reliable because
more than a single attribute can effect the output of the assay, which makes it difficult to identify
the actual attribute that is causing the difference in the assays response.13 Therefore, a transition
towards targeting fewer amino acids, with the goal of not compromising the sensitivity or
selectivity was further explored with the Bradford reagent.
The commonly used Bradford assay in biochemistry for protein quantification incorporates
the dye Coomassie Brilliant Blue G-250, which can also be used in staining protein gels. When
compared to similar methods, the Bradford assay is not as effected by common biochemical
reagents and non-protein components of biological samples. The assay targets six amino acids;
arginine, histidine, lysine, tyrosine, tryptophan and phenylalanine.14 Results of this experiment
confirmed that even with fewer amino acids, biological sex could still be identified with high
accuracy.13 Once again, since the Bradford assay was still multianalyte, it was not entirely reliable
due to the same reasons as the Ninhydrin assay. The findings in the previous two experiments led
to the further development of the Sakaguchi test discussed in this paper, which helped to eliminate
much of the issues faced with the chemical assays by only targeting a single analyte.
8
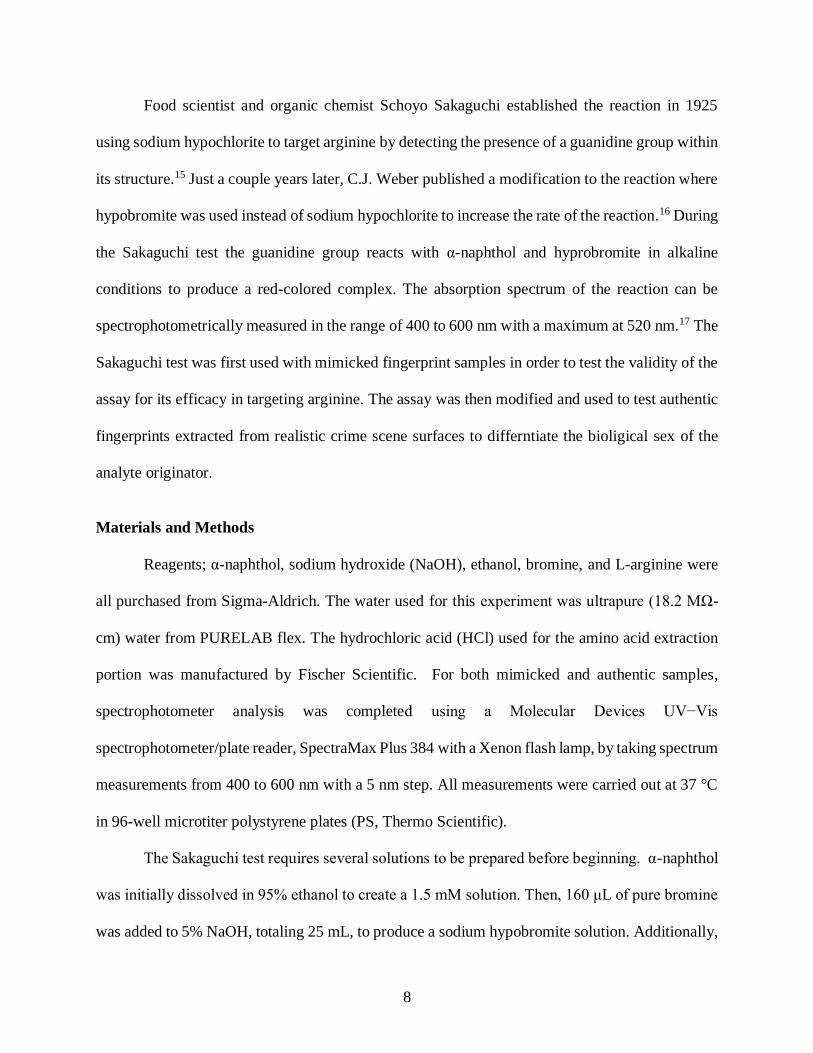
Food scientist and organic chemist Schoyo Sakaguchi established the reaction in 1925
using sodium hypochlorite to target arginine by detecting the presence of a guanidine group within
its structure.15 Just a couple years later, C.J. Weber published a modification to the reaction where
hypobromite was used instead of sodium hypochlorite to increase the rate of the reaction.16 During
the Sakaguchi test the guanidine group reacts with α-naphthol and hyprobromite in alkaline
conditions to produce a red-colored complex. The absorption spectrum of the reaction can be
spectrophotometrically measured in the range of 400 to 600 nm with a maximum at 520 nm.17 The
Sakaguchi test was first used with mimicked fingerprint samples in order to test the validity of the
assay for its efficacy in targeting arginine. The assay was then modified and used to test authentic
fingerprints extracted from realistic crime scene surfaces to differntiate the bioligical sex of the
analyte originator.
Materials and Methods
Reagents; α-naphthol, sodium hydroxide (NaOH), ethanol, bromine, and L-arginine were
all purchased from Sigma-Aldrich. The water used for this experiment was ultrapure (18.2 MΩ-
cm) water from PURELAB flex. The hydrochloric acid (HCl) used for the amino acid extraction
portion was manufactured by Fischer Scientific. For both mimicked and authentic samples,
spectrophotometer analysis was completed using a Molecular Devices UV−Vis
spectrophotometer/plate reader, SpectraMax Plus 384 with a Xenon flash lamp, by taking spectrum
measurements from 400 to 600 nm with a 5 nm step. All measurements were carried out at 37 °C
in 96-well microtiter polystyrene plates (PS, Thermo Scientific).
The Sakaguchi test requires several solutions to be prepared before beginning. α-naphthol
was initially dissolved in 95% ethanol to create a 1.5 mM solution. Then, 160 μL of pure bromine
was added to 5% NaOH, totaling 25 mL, to produce a sodium hypobromite solution. Additionally,

9
a separate 10% NaOH solution was needed and prepared.
After it was confirmed that the Sakaguchi assay could show the difference between a
variation of standard concentrations, mimicked fingerprint samples were prepared. Using
previously reported data, buffer-based solutions were made to mimic the physiological
concentrations of the 23 amino acids found in male and female sweat.9 The values for the amino
acids stated in these statistical studies were positively skewed as opposed to being normally
distributed and were consistent with a log-normal distribution. The bounds of the log-normal
distribution were only available for the overall amino concentrations, but the distribution bounds
for the male and female mimicked samples originated from logarithmic untransformed data. The
existing bounds for a normal distribution was therefore modified for a log-normal distribution.
Using R-project software, for each of the 23 amino acids present in fingerprint sweat, random
values agreeing with the recalculated bounds of the log-normal distribution in males and females
were established.18 Consequently, two sets of concentration values of all 23 amino acids were
statistically generated, resulting in a total of 575 different amino acid concentrations for each
biological sex. These concentrations were then randomly grouped to generate 25 samples
representing males and 25 samples representing females.
In order to create the fingerprint samples, an extraction protocol was used. Fingerprints
were placed directly on a generic plastic wrap or Polyethylene film (PEF) and a 2 cm x 1 cm square
was cut out of each fingerprint on the PEF. Tweezers were used to place the cut out PEF into the
bottom of a 1.5 mL Eppendorf tube. Then, 120 L of 10 mM HCl was placed into the tube, making
sure the plastic was completely submerged in HCl. The samples in the Eppendorf tubes were then
vortexed for 2 minutes at the same time. To ensure that all of the HCl was at the bottom of the
Eppendorf tubes the samples were briefly centrifuged. The plastic wrap had to be fully submerged
10
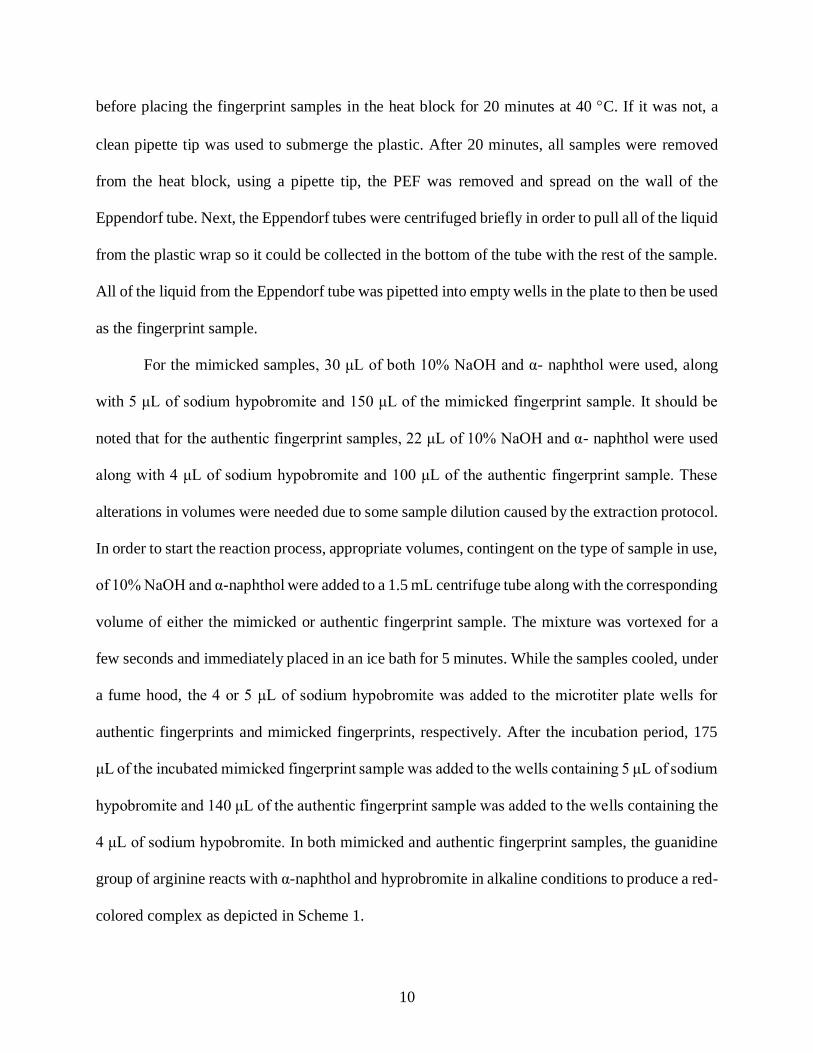
before placing the fingerprint samples in the heat block for 20 minutes at 40 C. If it was not, a
clean pipette tip was used to submerge the plastic. After 20 minutes, all samples were removed
from the heat block, using a pipette tip, the PEF was removed and spread on the wall of the
Eppendorf tube. Next, the Eppendorf tubes were centrifuged briefly in order to pull all of the liquid
from the plastic wrap so it could be collected in the bottom of the tube with the rest of the sample.
All of the liquid from the Eppendorf tube was pipetted into empty wells in the plate to then be used
as the fingerprint sample.
For the mimicked samples, 30 μL of both 10% NaOH and α- naphthol were used, along
with 5 μL of sodium hypobromite and 150 μL of the mimicked fingerprint sample. It should be
noted that for the authentic fingerprint samples, 22 μL of 10% NaOH and α- naphthol were used
along with 4 μL of sodium hypobromite and 100 μL of the authentic fingerprint sample. These
alterations in volumes were needed due to some sample dilution caused by the extraction protocol.
In order to start the reaction process, appropriate volumes, contingent on the type of sample in use,
of 10% NaOH and α-naphthol were added to a 1.5 mL centrifuge tube along with the corresponding
volume of either the mimicked or authentic fingerprint sample. The mixture was vortexed for a
few seconds and immediately placed in an ice bath for 5 minutes. While the samples cooled, under
a fume hood, the 4 or 5 μL of sodium hypobromite was added to the microtiter plate wells for
authentic fingerprints and mimicked fingerprints, respectively. After the incubation period, 175
μL of the incubated mimicked fingerprint sample was added to the wells containing 5 μL of sodium
hypobromite and 140 μL of the authentic fingerprint sample was added to the wells containing the
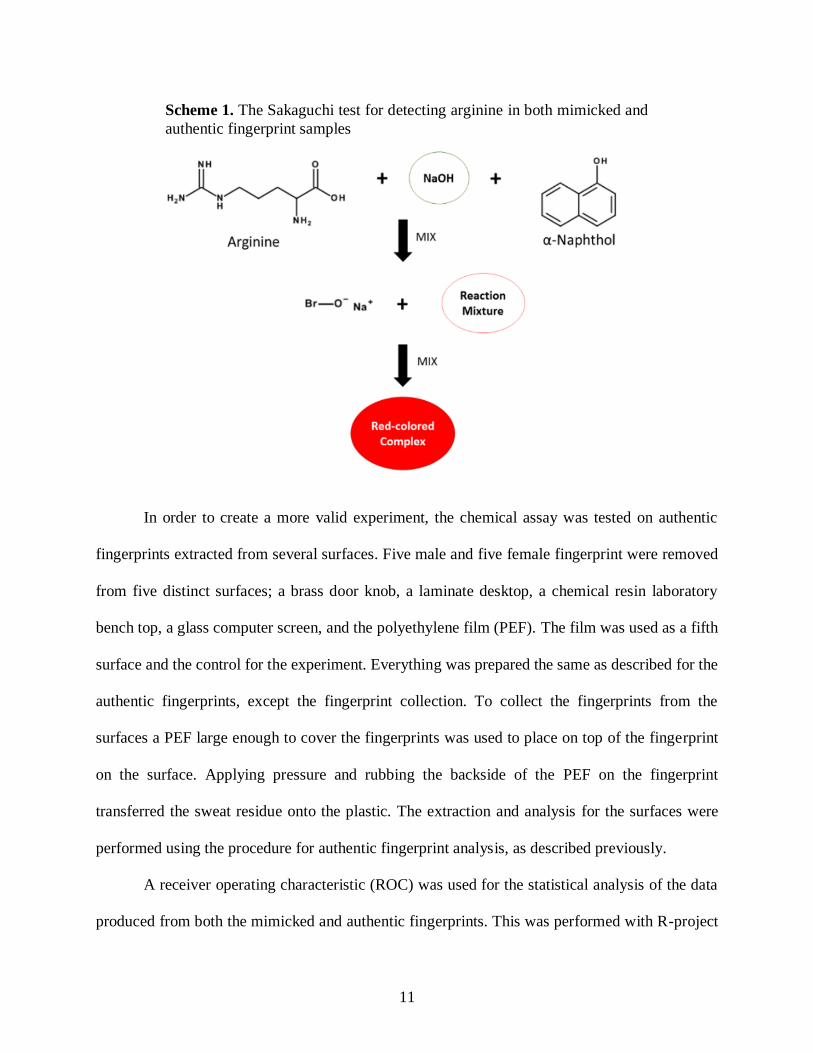
4 μL of sodium hypobromite. In both mimicked and authentic fingerprint samples, the guanidine
group of arginine reacts with α-naphthol and hyprobromite in alkaline conditions to produce a red-
colored complex as depicted in Scheme 1.
11
In order to create a more valid experiment, the chemical assay was tested on authentic
fingerprints extracted from several surfaces. Five male and five female fingerprint were removed
from five distinct surfaces; a brass door knob, a laminate desktop, a chemical resin laboratory
bench top, a glass computer screen, and the polyethylene film (PEF). The film was used as a fifth
surface and the control for the experiment. Everything was prepared the same as described for the
authentic fingerprints, except the fingerprint collection. To collect the fingerprints from the
surfaces a PEF large enough to cover the fingerprints was used to place on top of the fingerprint
on the surface. Applying pressure and rubbing the backside of the PEF on the fingerprint
transferred the sweat residue onto the plastic. The extraction and analysis for the surfaces were
performed using the procedure for authentic fingerprint analysis, as described previously.
A receiver operating characteristic (ROC) was used for the statistical analysis of the data
produced from both the mimicked and authentic fingerprints. This was performed with R-project
Scheme 1. The Sakaguchi test for detecting arginine in both mimicked and
authentic fingerprint samples
12
software to decide the diagnostic potential, the ability to correctly categorize an unknown value as
male or female fingerprint based on the output absorbance values. To estimate the discriminatory
power, the ROC curve and the area under the curve (AUC) were calculated using the trapezoidal
method of integration including the corresponding 95% confidence intervals (CI) as explained by
De Long et al.19 The best threshold, the point where the signal changes corresponds to only one of
the groups, gives maximum accuracy. ROC analysis was chosen for performance evaluation over
other methods because the AUC is considered a strong index for meaningful interpretation and
understanding in diagnostic and forensic accuracy situations.13
Results and Discussion:
Unlike previous work with the Ninhydrin and Bradford assays, which relied on multiple
analytes, the Sakaguchi test solely targets arginine. The concentrations of arginine were based off
of previously published data, but there is a clear distinction that exists between male and female
as seen in Table 1.
Table 1. The average concentrations (mM) of arginine for females and males in sweat
Amino Acid Female Concentration (mM) Male Concentration (mM)
Arginine (Arg) 0.0948 0.0540
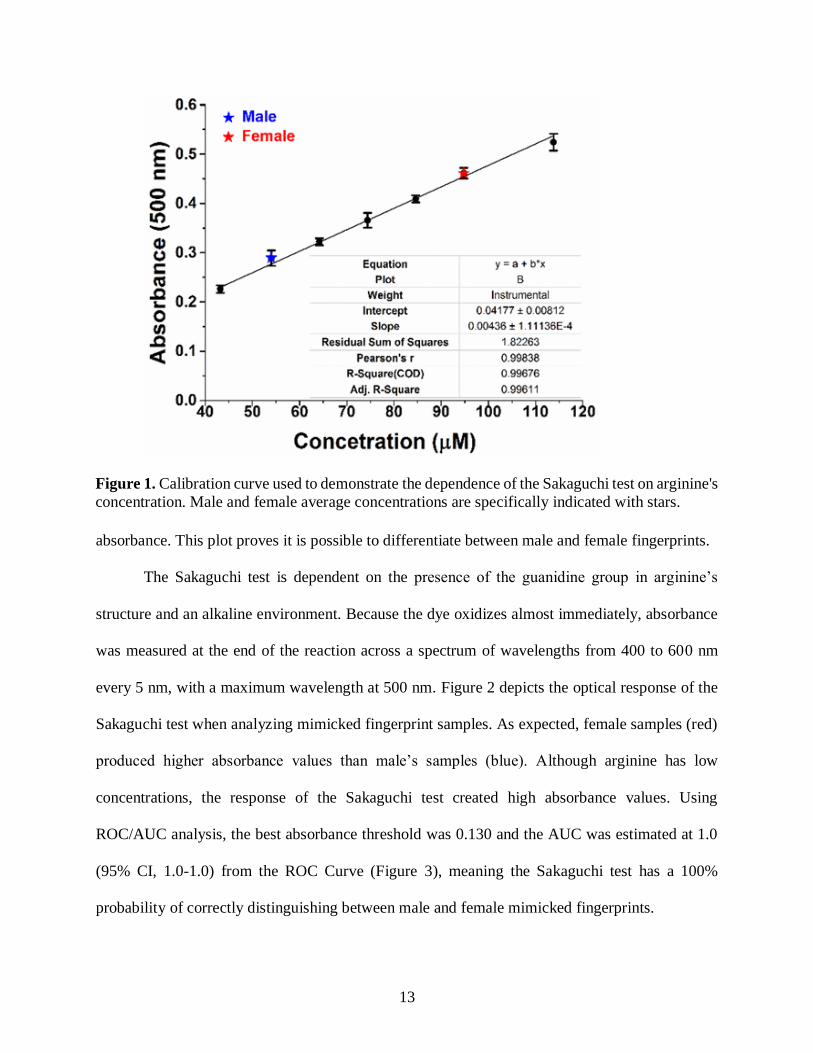
Since biological sex was never attempted to be identified with a single analyte, a calibration
curve was created to have a general idea of the range of concentrations for arginine. Figure 1 shows
a calibration curve for the expected range of arginine values that was made using the Sakaguchi
test, including the average male and female arginine concentrations that have been previously
reported. This calibration plot cannot be used to determine the sex associated with a fingerprint,
however it is a depiction of the positively linear correlation between arginine concentration and
13
absorbance. This plot proves it is possible to differentiate between male and female fingerprints.
The Sakaguchi test is dependent on the presence of the guanidine group in arginine’s
structure and an alkaline environment. Because the dye oxidizes almost immediately, absorbance
was measured at the end of the reaction across a spectrum of wavelengths from 400 to 600 nm
every 5 nm, with a maximum wavelength at 500 nm. Figure 2 depicts the optical response of the
Sakaguchi test when analyzing mimicked fingerprint samples. As expected, female samples (red)
produced higher absorbance values than male’s samples (blue). Although arginine has low
concentrations, the response of the Sakaguchi test created high absorbance values. Using
ROC/AUC analysis, the best absorbance threshold was 0.130 and the AUC was estimated at 1.0
(95% CI, 1.0-1.0) from the ROC Curve (Figure 3), meaning the Sakaguchi test has a 100%
probability of correctly distinguishing between male and female mimicked fingerprints.
Figure 1. Calibration curve used to demonstrate the dependence of the Sakaguchi test on arginine's
concentration. Male and female average concentrations are specifically indicated with stars.

14
Figure 3. Absorbance of red-colored complex produced by the Sakaguchi test using mimicked
fingerprint samples with wavelength from 400 to 600 nm and 5 nm step. Maximum absorbance was
identified at 500 nm. The red lines correspond to mimicked female fingerprint samples and the blue
lines correspond to mimicked male fingerprint samples.
Figure 2. Trade-off between sensitivity and specificity is indicated as an ROC curve with an AUC of
100%. This represents the the probability for the assay to correctly differentiate between male and
female fingerprint samples based on their respected amino acid concentrations. The optimal cut off
point was chosen with a sensitivity of 100% and specificity of 100%. Random choice is designated
by the gray diagonal line.

15
Due to the significant response of the Sakaguchi test using mimicked fingerprints, a
successful outcome was expected with authentic fingerprints. 25 authentic female fingerprints and
25 authentic male fingerprints were analyzed with the Sakaguchi test. As mentioned previously in
Methods and Materials, the protocol for analyzing the authentic fingerprints was slightly altered
because of sample dilution. Figure 4 shows the optical readout for the authentic fingerprint
samples. Although there were numerous steps that could have decreased the concentration of
arginine in the sample, such as the transfer to the PEF and the dilution during the extraction, the
absorbance values only had a minor decrease. For statistical comparison, ROC/AUC analysis was
performed as with the mimicked fingerprints. The best absorbance threshold was identified as
0.079 and the AUC was estimated at 1.0 (95% CI, 1.0−1.0) from the ROC curve (Figure 5). Once
again, this proves that the Sakaguchi test assay has a 100% probability of correctly distinguishing
between authentic male and female fingerprints.
Figure 4. Absorbance of red-colored complex produced by the Sakaguchi test using authentic
fingerprint samples with wavelength from 400 to 600 nm and 5 nm step. Maximum absorbance
was identified at 500 nm. The red lines correspond to authentic female fingerprint samples and the
blue lines correspond to authentic male fingerprint samples.
16
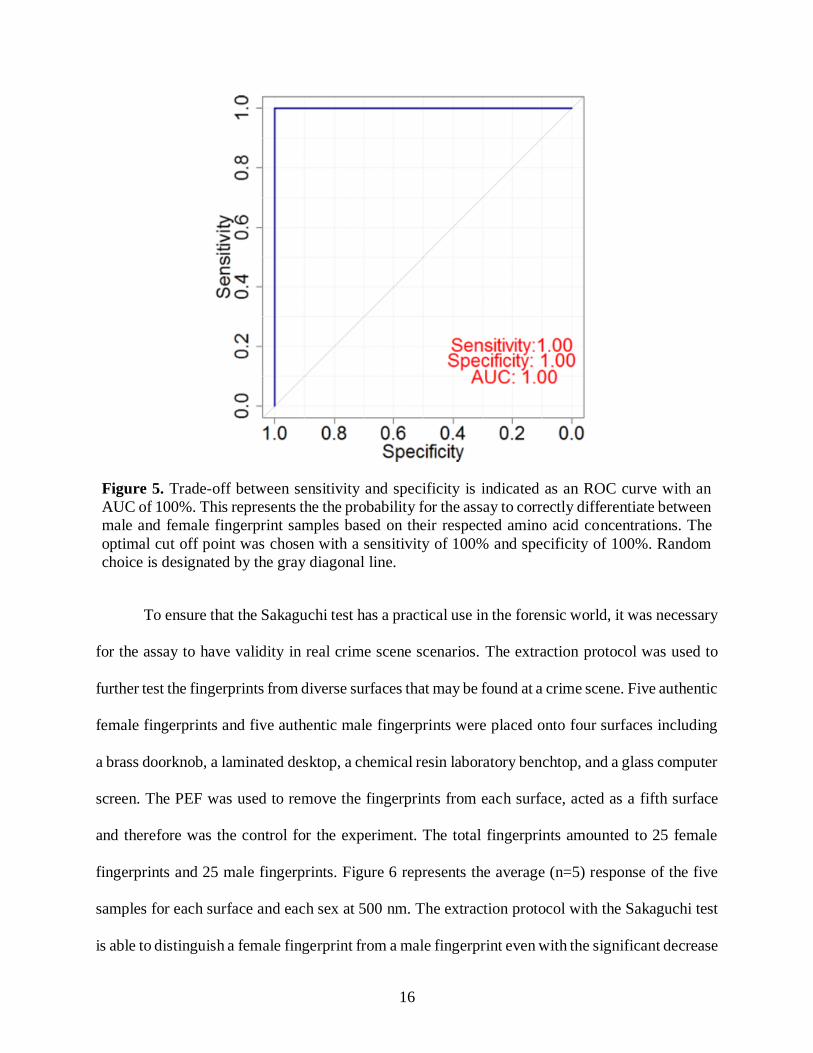
To ensure that the Sakaguchi test has a practical use in the forensic world, it was necessary
for the assay to have validity in real crime scene scenarios. The extraction protocol was used to
further test the fingerprints from diverse surfaces that may be found at a crime scene. Five authentic
female fingerprints and five authentic male fingerprints were placed onto four surfaces including
a brass doorknob, a laminated desktop, a chemical resin laboratory benchtop, and a glass computer
screen. The PEF was used to remove the fingerprints from each surface, acted as a fifth surface
and therefore was the control for the experiment. The total fingerprints amounted to 25 female
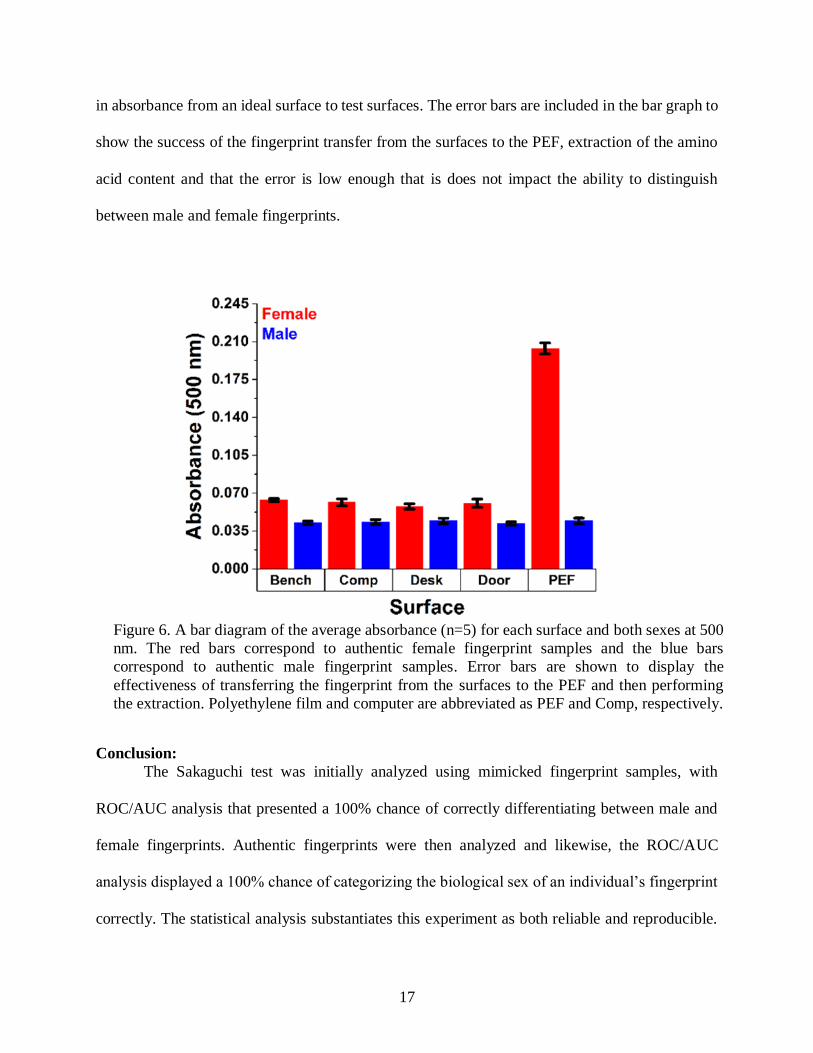
fingerprints and 25 male fingerprints. Figure 6 represents the average (n=5) response of the five
samples for each surface and each sex at 500 nm. The extraction protocol with the Sakaguchi test
is able to distinguish a female fingerprint from a male fingerprint even with the significant decrease
Figure 5. Trade-off between sensitivity and specificity is indicated as an ROC curve with an
AUC of 100%. This represents the the probability for the assay to correctly differentiate between
male and female fingerprint samples based on their respected amino acid concentrations. The
optimal cut off point was chosen with a sensitivity of 100% and specificity of 100%. Random
choice is designated by the gray diagonal line.
17
in absorbance from an ideal surface to test surfaces. The error bars are included in the bar graph to
show the success of the fingerprint transfer from the surfaces to the PEF, extraction of the amino
acid content and that the error is low enough that is does not impact the ability to distinguish
between male and female fingerprints.
Conclusion:
The Sakaguchi test was initially analyzed using mimicked fingerprint samples, with
ROC/AUC analysis that presented a 100% chance of correctly differentiating between male and
female fingerprints. Authentic fingerprints were then analyzed and likewise, the ROC/AUC
analysis displayed a 100% chance of categorizing the biological sex of an individual’s fingerprint
correctly. The statistical analysis substantiates this experiment as both reliable and reproducible.
Figure 6. A bar diagram of the average absorbance (n=5) for each surface and both sexes at 500
nm. The red bars correspond to authentic female fingerprint samples and the blue bars
correspond to authentic male fingerprint samples. Error bars are shown to display the
effectiveness of transferring the fingerprint from the surfaces to the PEF and then performing
the extraction. Polyethylene film and computer are abbreviated as PEF and Comp, respectively.
18
To validate the chemical assay as a potentially practical tool in actual crime scene situations the
Sakaguchi test was verified with fingerprints on a variety of surfaces. As expected, female
fingerprints had a detectably higher absorbance than male fingerprints on each surface.
Fingerprints left at a crime scene contain a great deal of information about an individual
that can be utilized by investigators. The Sakaguchi test proved that biological sex can be
determined from the difference of male and female concentration ranges of arginine, an amino
acid found in sweat. Because arginine can be utilized for detection of biological sex even with its
fairly low concentrations, this indicates that other amino acids could possibly be used. The findings
of this paper open up the door for the study of other single biological markers, amino acids or
metabolites that could be directly correlated to multiple attributes of an individual. Such endeavors
are currently being exploited in the Halámek laboratory.
Future Implications:
Using similar methods to the ones depicted in this paper, the Halámek research group has
been able to employ several metabolites to differentiate individuals from one another simply by
using sweat. This biological fluid that exists on the skin of every human, not only contains amino
acids but additional low molecular weight compounds. Each one of us is different due to specific
factors that make us up, including, genes, the environment, and a variety of lifestyles. Therefore,
the biochemical composition of each person is incredibly different. A current experimental
endeavor being looked at is based on concentrations of lactate, urea and glutamate. The purpose
of the study is to determine the number of suspects that left any trace amounts of sweat at the scene
of the crime based on the number of different profiles identified through the analysis of metabolic
content.
The methods of this study go beyond the field of forensic science and may be implemented
19
in cybersecurity systems that would allow access to confidential information based solely on a
person’s metabolic sweat composition. For example, a potential security issue that any individual
with a smartphone faces, is how simple it is to break into a phone using a fingerprint for touch
identification. Hacks and tricks may easily be found online and can be as straightforward as using
PlayDoh to copy the image of a fingerprint. To bypass this potential issue, by using measurable
amounts of a specific metabolic compounds found on the surface of skin, authentication for
smartphone access may be determined.
Additionally, further research with biocatalytic and chemical assays have potential in
emergency response protocols. The Halámek group is currently looking into the optimal targets
that may be applied to soldiers in combat zones or civilians unable to escape areas that have
minimal healthcare available. Soldiers are highly susceptible to malnutrition, infection and injury
that could both negatively affect the individual and team. Similar to to civilians, athletes active
during competitions, may also be in situations where immediate care is unavailable. In both
scenarios a quick, portable and simple method that could monitor an individual’s health status
would be extremely helpful in determining the severity of an ailment. The research group is
focusing on using enzymatic systems that would allow early detection of abnormalities in amino
acid levels present in sweat.
The methods being exploited in the Halámek lab require little amounts of sweat, enzymes
and substrates. They are straightforward, demanding minimal training, and only take a few minutes
to complete with proper preparation. It is therefore possible to see them developed and modified
into a field kit for on-site testing of various metabolites. These quick and easy methods may reduce
demand for DNA analysis and other time-consuming and expensive processes.
20
References:
1 Paton, A., "Fingerprint" Faulds: The Rehabilitation of Henry Faulds (1843-1930). Journal of
Medical Biography. 2001, 9 (3), 132-136.
2 Faulds, H., On the Skin-furrows of the Hand. Nature. 1880, 22, 605.
3 Yamashita, B., Fingerprint Sourcebook - Chapter 7: Latent Print Development. U.S. Dept. of
Justice, Office of Justice Programs, National Institute of Justice: 2010.
4 History of Fingerprint Analysis. 2 ed.; Gale Research Inc: 2016; Vol. 1.
5 Jain, K. A.; Cao, K., Fingerprint Image Analysis: Role of Orientation Patch and Ridge
Structure Dictionaries. In Geometry Driven Statistics, 2015; Vol. 121.
6 Sargent, H. DNA Testing Timeline http://www.patc.com/weeklyarticles/dnatimeline.shtml.
7 Roewer, L., DNA Fingerprinting in Forensics: Past, Present, Future. Investigative
Genetics. 2013, 4 (22).
8 Thody, A.; Shuster, S., Control and Function of Sebaceous Glands. Physiological
Reviews 1989, 69 (2), 383-416.
9 Huynh, C.; Brunelle, E.; Halámková, L.; Agudelo, J.; Halámek, J., Forensic Identification of
Gender from Fingerprints. Analytical Chemistry. 2015, 87 (22), 11531-11536.
10 Brunelle, E.; Huynh, C.; Minh Le, A.; Halámková, L.; Agudelo, J.; Halámek, J., New
Horizons for Ninhydrin: Colorimetric Determination of Gender from Fingerprints. Analytical
Chemistry. 2016, 88 (4), 2413-2420.
11 West, R., Siegfried Ruhemann and the Discovery of Ninhydrin. Journal of Chemical
Education. 1965, 42 (7), 386.
12 Oden, S.; Von Hofsten, B., Detection of Fingerprints by the Ninhydrin
Reaction. Nature. 1954, 173, 449-459.
13 Brunelle, E.; Minh Le, A.; Huynh, C.; Wingfield, K.; Halámková, L.; Agudelo, J.; Halámek,
J., Coomassie Brilliant Blue G-250 Dye: An Application for Forensic Fingerprint
Analysis. Analytical Chemistry. 2017, 89 (7), 4314-4316.
14 Compton, S.; Jones, C., Mechanism of Dye Response and Interference in the Bradford Protein
Assay. Analytical Chemistry. 1985, 151 (2), 369-374.
15 Sakaguchi, S., Siegfried Ruhemann and the Discovery of Ninhydrin. Journal of
Biochemistry. 1925, 5 (1), 13-24.

21
16 Weber, C. J., A Modification of Sakaguchi's Reaction for the Quantitative Determination of
Arginine. The Journal of Biological Chemistry. 1930, 86, 217-222.
17 Ke, S.; Haselkorn, R., The Sakaguchi Reaction Product Quenches Phycobilisome
Fluorescence, Allowing Determination of the Arginine Concentration in Cells of Anabaena
Strain PCC 7120. Journal of Bacteriology. 2013, 195 (1), 25-28.
18 Hair, M.; Mathis, A.; Brunelle E.; Halámková, L.; Halámek, Jan., Metabolite Biometrics for
Differentiation of Individuals. Analytical Chemistry. 2018, 90 (8), 5322-5328.
19 Delong, E.; Delong, D.; Clarke-Pearson, D., Comparing the areas under two or more
correlated receiver operating characteristic curves: a nonparametric
approach. Biometrics. 1988, 44 (3), 837-845.

22
Appendix 1: Reprint Permissions

23