
Determining a Function for the Damping Coefficient of a ...
10
DOI: 10.24352/UB.OVGU-2017-093 TECHNISCHE MECHANIK, 37, 2-5, (2017), 161 – 170 submitted: June 29, 2017 Determining a Function for the Damping Coefficient of a laminated Stack C. Zahalka, K. Ellermann The design of electrical machines is determined by electrical as well as mechanical requirements. Possible losses due to eddy currents in the stator or the rotor are commonly reduced by using stacks of laminated sheet metal. On the other hand, the design of the stator and the rotor has a significant influence on the mechanical properties: Vibrations depend on the stiffness and the damping of the laminated stack. There are different methods to determine the stiffness coefficient of a stack, but it is much more difficult to obtain suitable values for the damping as there are more influencing factors. This paper describes an experimental procedure, which determines the influence of different parameters on the damping of a stack. The stack used during the experiments consists of 200 quadratic steel sheets with a side length of 80 mm and a thickness of 0.5 mm. In accordance with the measurement data, a functional dependance based on three variables is derived. The first one is the surface pressure between the steel sheets, the second one is the frequency of the applied lateral force, and the third one is the displacement between the steel sheets. It is the aim of this investigation to determine the influence of variations of these parameter values on the damping. The forces are applied onto the stack with hydraulic cylinders. The mechanical deformation of the stacked metal sheets is measured by a laser-speckle-based measurement system. This system detects the displacement of single steel sheets. The displacement is measured on two steel sheets, but they are not side by side. The difference between the two measurement points is equal to the displacement of the stack. Through the synchronization of the time signal of the lateral force and the displacement of the stack, a hysteresis loop can be calculated. This hysteresis depends on the lateral force and the displacement of the stack. The area of the hysteresis corresponds to the dissipation energy between the two measurement points on the stack, 140 sheets apart from each other. This area is calculated by numerical integration based on the trapezoidal rule. Through the conservation of energy for this system, it is possible to calculate an effective damping coefficient for the stack. Considering different influencing parameters, a function for the damping coefficient can be identified by the least square method. This function can be used for the parameters in a numerical simulation of an electrical machine. Nomenclature A [m] Amplitude of the displacement of the dynamic cylinder d [ Ns m ] Structural damping f E [Hz] Excitation frequency F D [N] Dynamic force ˆ F D [N] Amplitude of the dynamic force F Stat [N] Static force m [kg] Mass p [ N m 2 ] Surface pressure t [s] Time x [m] Displacement ˆ x [m] Amplitude of the displacement W Diss [Nm] Dissipation energy η [-] Loss factor ψ [rad] Phase shift ω 0 [ rad s ] Angular eigen frequency ω E [ rad s ] Angular excitation frequency 161
Transcript of Determining a Function for the Damping Coefficient of a ...
DOI: 10.24352/UB.OVGU-2017-093 TECHNISCHE MECHANIK, 37, 2-5, (2017), 161 – 170submitted: June 29, 2017
Determining a Function for the Damping Coefficient of a laminated Stack
C. Zahalka, K. Ellermann
The design of electrical machines is determined by electrical as well as mechanical requirements. Possible lossesdue to eddy currents in the stator or the rotor are commonly reduced by using stacks of laminated sheet metal.On the other hand, the design of the stator and the rotor has a significant influence on the mechanical properties:Vibrations depend on the stiffness and the damping of the laminated stack. There are different methods to determinethe stiffness coefficient of a stack, but it is much more difficult to obtain suitable values for the damping as thereare more influencing factors.
This paper describes an experimental procedure, which determines the influence of different parameters on thedamping of a stack. The stack used during the experiments consists of 200 quadratic steel sheets with a side lengthof 80 mm and a thickness of 0.5 mm. In accordance with the measurement data, a functional dependance basedon three variables is derived. The first one is the surface pressure between the steel sheets, the second one is thefrequency of the applied lateral force, and the third one is the displacement between the steel sheets.
It is the aim of this investigation to determine the influence of variations of these parameter values on the damping.The forces are applied onto the stack with hydraulic cylinders. The mechanical deformation of the stacked metalsheets is measured by a laser-speckle-based measurement system. This system detects the displacement of singlesteel sheets. The displacement is measured on two steel sheets, but they are not side by side. The difference betweenthe two measurement points is equal to the displacement of the stack.
Through the synchronization of the time signal of the lateral force and the displacement of the stack, a hysteresisloop can be calculated. This hysteresis depends on the lateral force and the displacement of the stack. The area ofthe hysteresis corresponds to the dissipation energy between the two measurement points on the stack, 140 sheetsapart from each other. This area is calculated by numerical integration based on the trapezoidal rule. Throughthe conservation of energy for this system, it is possible to calculate an effective damping coefficient for the stack.Considering different influencing parameters, a function for the damping coefficient can be identified by the leastsquare method. This function can be used for the parameters in a numerical simulation of an electrical machine.
Nomenclature
A [m] Amplitude of the displacement of the dynamic cylinderd [Ns
m ] Structural dampingfE [Hz] Excitation frequencyFD [N] Dynamic forceFD [N] Amplitude of the dynamic forceFStat [N] Static forcem [kg] Massp [ N
m2 ] Surface pressuret [s] Timex [m] Displacementx [m] Amplitude of the displacementWDiss [Nm] Dissipation energyη [−] Loss factorψ [rad] Phase shiftω0 [ rads ] Angular eigen frequencyωE [ rads ] Angular excitation frequency
161

1 Introduction
Information about the material properties of the laminated stack is necessary to simulate the dynamics of a rotoror a stator of an electrical machine. Due to the structure of the stack, the material properties vary in the differentdirections: in radial direction, the metal of the sheets dominates the tensile stiffness. Different layers of the stackact in parallel and the material with the highest value of Young’s modulus contributes most significantly to theeffective stiffness of the stack. In axial direction, the contact- and lamination-zone between the sheets becomesmuch more important as layers act in series. In this direction, the material with the smallest value of Young’smodulus influences the tensile stiffness much more. These zones are also considered to be highly important fornon-conservative effects: The transversal deformation of the stack due to a shearing motion between the metalsheets contributes significantly to the overall damping of the structure. This is mainly due to the softer material inthe lamination zone.
The stiffness of a component can be determined experimentally or numerically – given the geometry and tabulatedmaterial properties. Damping values are much harder to determine and are rarely available in literature. In thispaper, an experimental set-up is described in order to determine a function for the damping coefficient of a stackcaused by a shearing motion in transversal direction. There are many different parameters which have an influenceon the structural damping of a component. In this work, three variables are considered: The surface pressurebetween the steel sheets, the frequency of the lateral force and the amplitude of the displacement of the stack. Allothers, like the height of the stack or the size of the steel sheets, are being kept constant.
In practice, the displacement and the frequency vary with the operating states. The pressure on the other handis mostly caused by the design and by compressing the stack in the production process: In electrical machines,the laminated sheets are – more or less loosely – stacked, then compressed and finally held in place by a weldedstructure of tension elements and end plates. This design and production process make the pressure difficult to bedetermined – leading possibly to significant variations in mechanical parameters of the machine.
There are different methods to determine the stiffness and the structural damping of a laminated stack. Luchschei-der et al. (2012) describes a set-up to measure the stiffness of a lamination stack. Two plungers compress nine cir-cular samples, cut out from a typical lamination sheet material. With two extensometers, clamped on the plungers,and a load cell, a force-displacement diagram is created. With this diagram the stiffness in stacked direction of thelaminated stack can be derived.
Mogenier et al. (2010) predicted the modal parameters of an induction motor with an undamped finite-elementmodel. The minimation of the error between the predicted and the measured modal parameters with the Levenberg-Marquardt algorithm. This leads to the equivalents constitutive properties of the laminated stack.
Clappier and Gaul (2015) and Clappier et al. (2015) determine the structural damping and the stiffness in axialand in shear direction of a laminated stack. The measurement set-up for this evaluation consists of two laminatedstacks and three plates. The stack is axial pretensioned with a screw connection between the plates. The excitationis effected with a shaker to one of the plates. To calculate the stiffness and the structural damping, the accelerationof the plates and the force on the excitated plate are measured. The structural damping is calculated through thedetermination of the dissipated energy. The same principle is used by Bograd et al. (2008). The difference betweenthese works is that Bograd determines the structural damping in shear direction from a thin layer element and notfrom a laminated stack.
2 Experimental set-up
The complete test stand is placed on a foundation, which is isolated from the surrounding with an air suspension.This is necessary to be independent from the environmental influences of the building. The measurement systemis not placed on this foundation, but the offset between the measurement system and the test bench can be removedthrough an differential measurement of the displacement. The test bench consists of two hydraulic cylinders andthe clamping device for the stack (see Fig. 1). The vertical cylinder (4) applies the surface pressure on the laminatedstack. To avoid an inclined position of the pressure plate, there are four linear guides in axial directions aroundthe laminated stack. These guides are not shown in Fig. 1. The second cylinder (1) on the right side applies theoscillating lateral force on the stack.
162

Figure 1: Experimental set-up 1. Dynamic hydraulic cylinder 2. Load cell 3. Flexure 4. Static hydraulic cylinder5. Ball joint 6. Upper lamination stack 7. Intermediate plate 8. Lower lamination stack 9. Pressure plate
There are two stacks, one is above the intermediate plate and the other one is below. Each of the stacks consists of200 steel sheets with a side length of 80 mm and a thickness of 0.5 mm. Between the static hydraulic cylinder andthe pressure plate are a load cell and a ball joint. The load cell measures the force for the surface pressure in thelaminated stack and the ball joint corrects the inaccuracies of the concentricity between the pressure plate and thecylinder. A load cell and a flexure are situated between the dynamic cylinder and the intermediate plate. The loadcell records the damping force and the flexure is used for the correction of the vertical position of the intermediateplate. This is necessary, because the vertical position of the intermediate plate depends on the surface pressure inthe laminated stack. The static hydraulic cylinder is force controlled based on the load cell and the second one isstroke controlled based on the magnetostrictive measurement method of the cylinder. Both systems are controlledwith one dual-channel controlling system.
The basic construction of the measurement system for the displacement of the steel sheets was described in Halderet al. (2014) based on the laser-speckle principle. For the application in the test bench, the measurement systemhas been adapted. The measurement construction is positioned so that the axes of the two high speed camerasare orthogonal to the front site of the laminated stack, shown on the left picture of Fig. 2. This cameras recordthe Regions of Interest (RoI) and the software calculates the displacement of each RoI. The displacement of thelaminated stack is the difference between the two RoI in horizontal direction. The maximum sampling rate ofthe system is 150 Hz by recording two measure points at each RoI. In combination with the maximum excitationfrequency of 12.5 Hz, there are at least twelve measurement points during one vibration period. In order to getdifferent measurement points in the hysteresis loop, the sampling frequency is not an integral multiple of theexcitation frequency.
The position of the two RoI is shown on the right side of Fig. 2 and marked with a red rectangle. The distancebetween the RoI is limited by the image of the camera in relation to the thickness of the sheets. For the setup underconsideration the RoI are separated by 140 sheets of steel. The speckle pattern is produced through a laser lightbeam which is redirected with an mirror to a beam expander. This expanded beam is divided into two beams withan splitter cube and must be projected exactly on the two RoI. The detailed description of this measurement systemis in Halder et al. (2014).
163
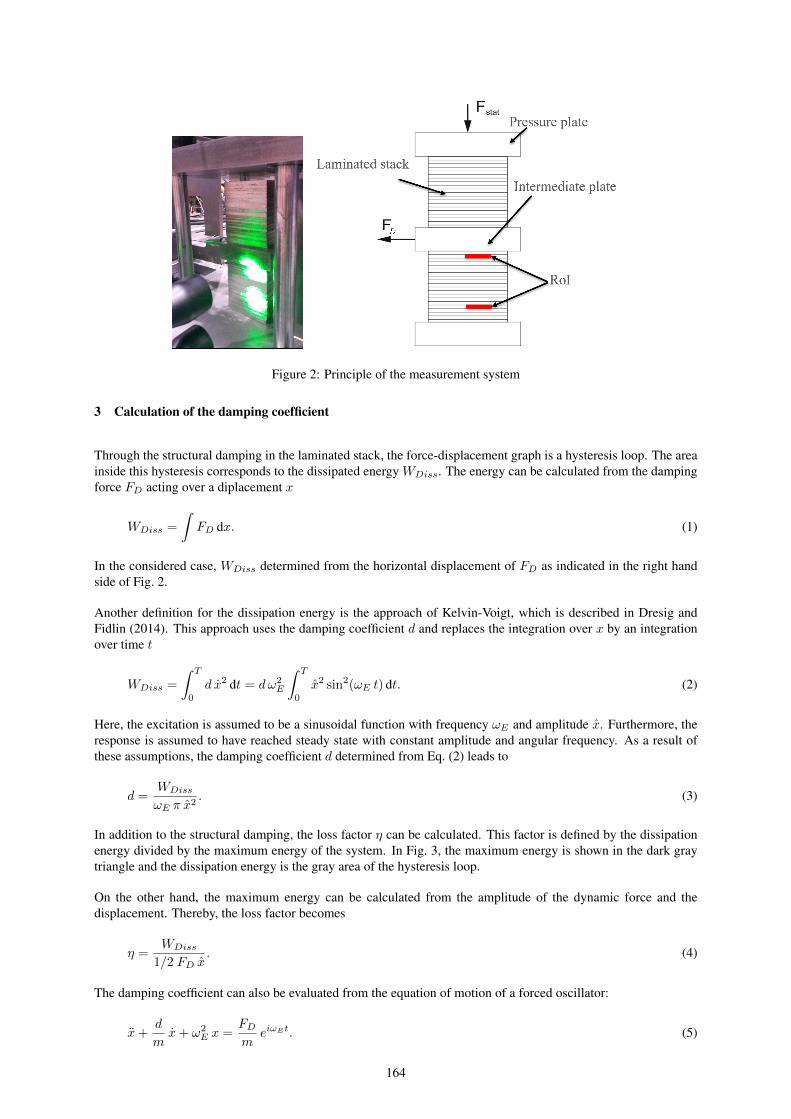
Figure 2: Principle of the measurement system
3 Calculation of the damping coefficient
Through the structural damping in the laminated stack, the force-displacement graph is a hysteresis loop. The areainside this hysteresis corresponds to the dissipated energy WDiss. The energy can be calculated from the dampingforce FD acting over a diplacement x
WDiss =
∫FD dx. (1)
In the considered case, WDiss determined from the horizontal displacement of FD as indicated in the right handside of Fig. 2.
Another definition for the dissipation energy is the approach of Kelvin-Voigt, which is described in Dresig andFidlin (2014). This approach uses the damping coefficient d and replaces the integration over x by an integrationover time t
WDiss =
∫ T
0
d x2 dt = dω2E
∫ T
0
x2 sin2(ωE t) dt. (2)
Here, the excitation is assumed to be a sinusoidal function with frequency ωE and amplitude x. Furthermore, theresponse is assumed to have reached steady state with constant amplitude and angular frequency. As a result ofthese assumptions, the damping coefficient d determined from Eq. (2) leads to
d =WDiss
ωE π x2. (3)
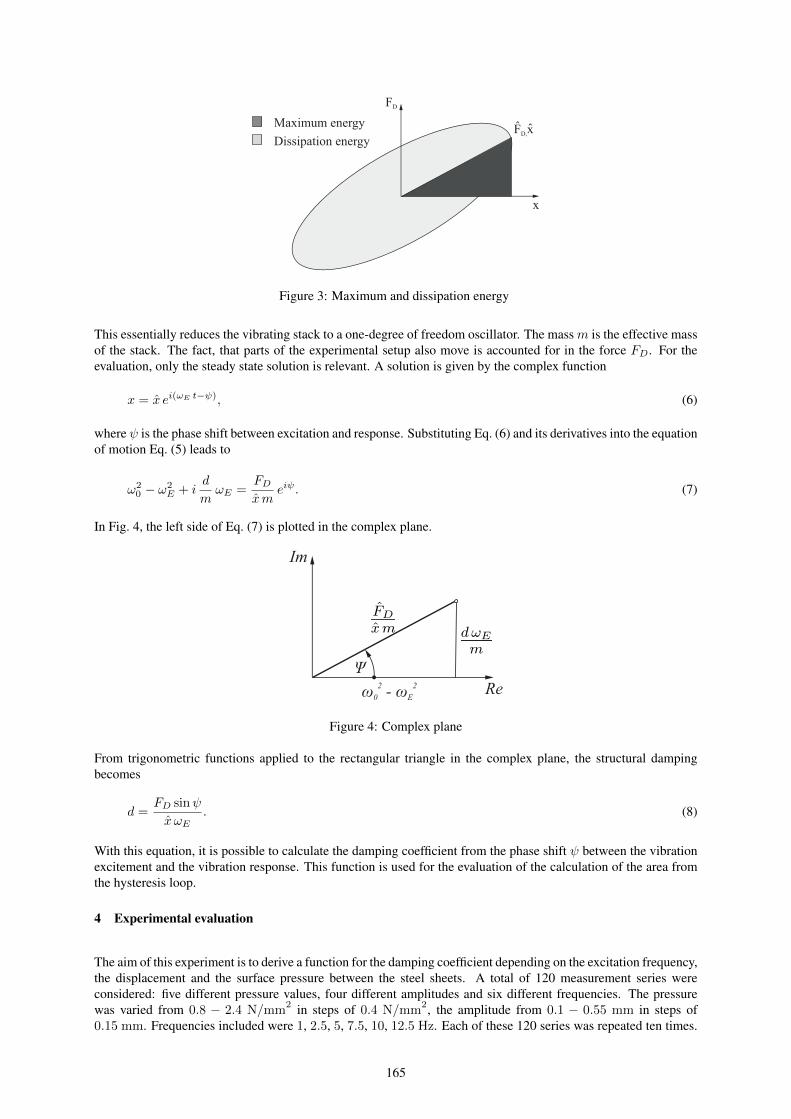
In addition to the structural damping, the loss factor η can be calculated. This factor is defined by the dissipationenergy divided by the maximum energy of the system. In Fig. 3, the maximum energy is shown in the dark graytriangle and the dissipation energy is the gray area of the hysteresis loop.
On the other hand, the maximum energy can be calculated from the amplitude of the dynamic force and thedisplacement. Thereby, the loss factor becomes
η =WDiss
1/2 FD x. (4)
The damping coefficient can also be evaluated from the equation of motion of a forced oscillator:
x+d
mx+ ω2
E x =FDm
eiωEt. (5)
164
x
FD
F xD,
Maximum energy
Dissipation energy
Figure 3: Maximum and dissipation energy
This essentially reduces the vibrating stack to a one-degree of freedom oscillator. The massm is the effective massof the stack. The fact, that parts of the experimental setup also move is accounted for in the force FD. For theevaluation, only the steady state solution is relevant. A solution is given by the complex function
x = x ei(ωE t−ψ), (6)
where ψ is the phase shift between excitation and response. Substituting Eq. (6) and its derivatives into the equationof motion Eq. (5) leads to
ω20 − ω2
E + id
mωE =
FDxm
eiψ. (7)
In Fig. 4, the left side of Eq. (7) is plotted in the complex plane.
Re
Im
Ψ2 2ω - ω0 E
Figure 4: Complex plane
From trigonometric functions applied to the rectangular triangle in the complex plane, the structural dampingbecomes
d =FD sinψ
x ωE. (8)
With this equation, it is possible to calculate the damping coefficient from the phase shift ψ between the vibrationexcitement and the vibration response. This function is used for the evaluation of the calculation of the area fromthe hysteresis loop.
4 Experimental evaluation
The aim of this experiment is to derive a function for the damping coefficient depending on the excitation frequency,the displacement and the surface pressure between the steel sheets. A total of 120 measurement series wereconsidered: five different pressure values, four different amplitudes and six different frequencies. The pressurewas varied from 0.8 − 2.4 N/mm
2 in steps of 0.4 N/mm2, the amplitude from 0.1 − 0.55 mm in steps of
0.15 mm. Frequencies included were 1, 2.5, 5, 7.5, 10, 12.5 Hz. Each of these 120 series was repeated ten times.
165
In order to exclude systematic measurement errors, the chronological order of the measurement was randomized.All of these measurements were considered in this study, but for the illustration of the method, we subsequentlyfocus on the measurement series with a pressure of 1.2 N/mm
2 as given in Table 1.
Table 1: Measurement series with p = 1.2N/mm2
Series fE [Hz] A [mm] Series fE [Hz] A [mm]25 1 0.1 37 7.5 0.126 1 0.25 38 7.5 0.2527 1 0.4 39 7.5 0.428 1 0.55 40 7.5 0.5529 2.5 0.1 41 10 0.130 2.5 0.25 42 10 0.2531 2.5 0.4 43 10 0.432 2.5 0.55 44 10 0.5533 5 0.1 45 12.5 0.134 5 0.25 46 12.5 0.2535 5 0.4 47 12.5 0.436 5 0.55 48 12.5 0.55
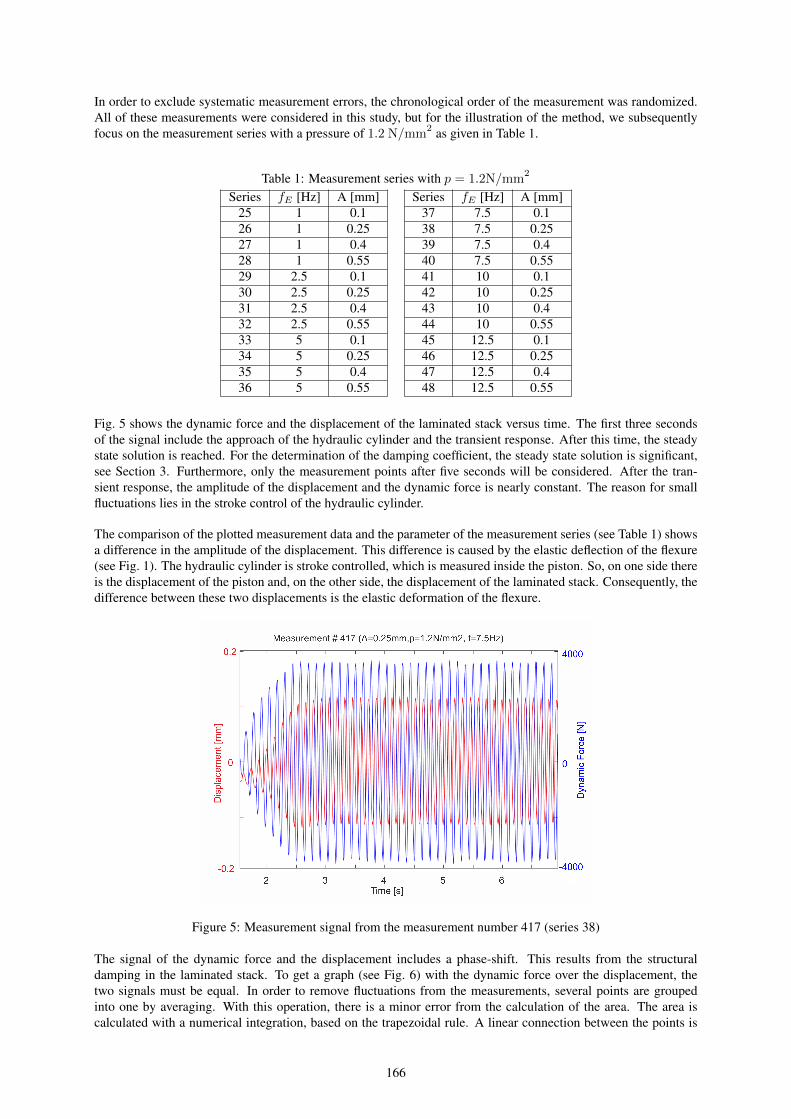
Fig. 5 shows the dynamic force and the displacement of the laminated stack versus time. The first three secondsof the signal include the approach of the hydraulic cylinder and the transient response. After this time, the steadystate solution is reached. For the determination of the damping coefficient, the steady state solution is significant,see Section 3. Furthermore, only the measurement points after five seconds will be considered. After the tran-sient response, the amplitude of the displacement and the dynamic force is nearly constant. The reason for smallfluctuations lies in the stroke control of the hydraulic cylinder.
The comparison of the plotted measurement data and the parameter of the measurement series (see Table 1) showsa difference in the amplitude of the displacement. This difference is caused by the elastic deflection of the flexure(see Fig. 1). The hydraulic cylinder is stroke controlled, which is measured inside the piston. So, on one side thereis the displacement of the piston and, on the other side, the displacement of the laminated stack. Consequently, thedifference between these two displacements is the elastic deformation of the flexure.
Figure 5: Measurement signal from the measurement number 417 (series 38)
The signal of the dynamic force and the displacement includes a phase-shift. This results from the structuraldamping in the laminated stack. To get a graph (see Fig. 6) with the dynamic force over the displacement, thetwo signals must be equal. In order to remove fluctuations from the measurements, several points are groupedinto one by averaging. With this operation, there is a minor error from the calculation of the area. The area iscalculated with a numerical integration, based on the trapezoidal rule. A linear connection between the points is
166

satisfactory exact, because the error from the measurement is higher than the error through the linearization. Suchlinear connections are shown in the right graph of Fig. 6.
Figure 6: Hysteresis loop left: measurement data; right: linearized data
Fig. 7 shows the boxplots of the measurement series with a surface pressure of 1.2N/mm2. All measurements
which are in one marked rectangle have the same excitation frequency and from left to right an increasing amplitude(see Table 1). The damping coefficient decreases with an ascending amplitude and by an ascending frequency.Both of these connections have a similar behavior and can be approximated through an exponential function with anegativ exponent. Another detail is shown in Fig. 7: Lower amplitudes and frequencies lead to a larger differencebetween the first and the third quartile. The reason for this lies in the absolut measurement and calculation errorwhich is in all cases roughly the same, but through the smaller measurement values the relative error is muchbigger.
Figure 7: Boxplot of the measurement series with a surface pressure of 1.2 N/mm2
Corresponding to the five different pressure values, five different functions for the damping coefficient are deter-mined. These functions depend on the frequency and the displacement of the laminated stack and are assumed totake the form
d(f,A) =C1
f+C2
A+C3
f A. (9)
Parameters C1, C2 and C3 are calculated from a least squares approximation separately for each pressure value:For each variation of the parameters (C1, C2, C3) the sum of all squared differences between each measurementpoint and the function value is calculated. The best approximation of the function is found when the sum reaches
167

a minimum. In order to control the quality of the solution, the coefficient of determination (R2) is calculated. It isdefined in Birkes and Dodge (1993) as
R2 =
∑(yi − y)2∑(yi − y)2
. (10)
The range of R2 is from 0 to 1, whereby 1 correspondents to the best approximation of the data values.
As an example, the function for a constant surface pressure of 1.2 N/mm2 is found to be
d(f,A) =386.64
f+
3 · 10−3
A+
5.15 · 10−3
f A
[Ns
m
]. (11)
Figure 8: Damping coefficient for a surface pressure of 1.2 N/mm2 and an excitation frequency of 7.5 Hz
Fig. 8 illustrates Eq. (11) using a frequency of 7.5 Hz and the results of the corresponding measurements. Insertingthe value of the frequency into eq. (11) gives
d(A) =3.69 · 10−3
A+ 51.552
[Ns
m
]. (12)
Again, as an example, the function for the damping coefficient at a surface pressure of 1.2 N/mm2 in Fig. 9 is
shown. The measurement points are marked with red crosses in this figure. The two-sided 95 % confidence intervalis built from all 120 measurement series. The calculation of the confidence interval is described in Mittag (2015).The complete function is inside most of the confidence intervals.
Comparing the results from the different pressure values, only the parameterC1 is found to differ significantly. Thecorrelation between the parameter values and the associated pressures is nearly linear. With a linear regression, thecomplete function for the damping coefficient can be derived and this function is
d(f,A, p) =0.3072 · 10−3 p+ 18
f+
3 · 10−3
A+
5.15 · 10−3
f A
[Ns
m
]. (13)
168

Figure 9: Damping coefficient for a surface pressure of 1.2N/mm2
5 Conclusion
This paper describes a method to identify a parametric model for a damping coefficient of a stack of sheet metal.This function depends on the surface pressure, the excitation frequency and the displacement of the stack. Atest stand was developed and 120 measurement series were recorded. From this measurement data, the dampingcoefficient was determined by means of the dissipated energy. In order to control the obtained coefficients, asecond approach was used. All the calculated damping coefficients were fitted into a global function. The bestapproximating function was derived by the least square method. At last, the function was compared with theconfidence interval of the measurement data.
The function reveals a significant dependance of the damping on the different parameters for the considered testcase. The results may be used for multibody simulation analyses of a stack, which is loaded by an oscillated forcewith a constant excitation frequency.
References
Birkes, D.; Dodge, Y.: Other Methods, pages 205–213. John Wiley & Sons, Inc. (1993).
Bograd, S.; Schmidt, A.; Gaul, L.: Joint damping prediction by thin layer elements. In: Proceedings of the IMACXXVI: Conference & Exposition on Structural Dynamics, Orlando, FL, USA (2008).
Clappier, C.; Gaul, L.; Westkmper, E.: Experimental determination of material properties in stacking directionof laminated stacks belonging to electrical machine rotors using a dilatation test. In: Proceedings of the 22ndInternational Congress on Sound and Vibration, Florence, Italy (2015).
Clappier, M.; Gaul, L.: Experimental Investigation of Structural Damping of Laminated Stacks of Electrical Ma-chine Rotors, pages 613–624. Springer International Publishing, Cham (2015).
Dresig, H.; Fidlin, A.: Schwingungen mechanischer Antriebssysteme: Modellbildung, Berechnung, Analyse, Syn-these. Springer Berlin Heidelberg (2014).
Halder, C.; Thurner, T.; Mair, M.: Development of a laser-speckle-based measurement principle for the evaluationof mechanical deformation of stacked metal sheets. In: Proc. SPIE, vol. 9132, pages 91321F–91321F–8 (2014).
Luchscheider, V.; Willner, K.; Maidorn, M.: Development of a model to describe the stiffness of an electric motorlamination stack. In: 2012 2nd International Electric Drives Production Conference (EDPC), pages 1–5 (Oct2012).
169

Mittag, H.: Statistik: Eine Einfuhrung mit interaktiven Elementen. Springer-Lehrbuch, Springer Berlin Heidelberg(2015).
Mogenier, G.; Dufour, R.; Ferraris-Besso, G.; Durantay, L.; Barras, N.: Identification of lamination stack proper-ties: Application to high-speed induction motors. IEEE Transactions on Industrial Electronics, 57, 1, (2010),281–287.
Address: Graz University of Technology, Institute for Mechanics, Kopernikusgasse 24/IV, Graz, A-8010 Austriaemail: [email protected]
170


![1, 2 ID - VGTUdspace.vgtu.lt/bitstream/1/3750/1/symmetry-10-00205.pdfLINMAP method [1], mathematical programming models for determining the criteria weights [19], the correlation coefficient](https://static.fdocuments.us/doc/165x107/6118fe0a56a75477b771d794/1-2-id-linmap-method-1-mathematical-programming-models-for-determining-the.jpg)


