Determinations of Heat Stable Amine Salts and Amines in...
7
Determinations of Heat Stable Amine Salts and Amines in Amine Scrubbing Solutions Using Suppressed Conductivity and Charge Detection Terri Christison, Monika Verma, Pranathi Perati, Linda Lopez Thermo Fisher Scientific, Sunnyvale, CA, USA
Transcript of Determinations of Heat Stable Amine Salts and Amines in...

Determinations of Heat Stable Amine Salts and Amines in Amine Scrubbing Solutions Using Suppressed Conductivity and Charge Detection Terri Christison, Monika Verma, Pranathi Perati, Linda Lopez Thermo Fisher Scientific, Sunnyvale, CA, USA

2 Determinations of Heat Stable Amine Salts and Amines in Amine Scrubbing Solutions Using Suppressed Conductivity and Charge Detection
All trademarks are the property of Thermo Fisher Scientific and its subsidiaries.
This information is not intended to encourage use of these products in any manners that might infringe the intellectual property rights of others.
Determinations of Heat Stable Amine Salts and Amines in Amine Scrubbing Solutions Using Suppressed Conductivity and Charge Detection Terri Christison, Monika Verma, Pranathi Perati, Linda Lopez; Thermo Fisher Scientific, Sunnyvale, CA, USA
PO7118_E 05/14S
Overview Heat stable amine (HSA) salts, such as organic acids, inorganic anions, and sulfur
based salts, in amine scrubber solutions were separated by anion-exchange on a 4 µm particle high-efficiency capillary column.
This method utilizes two different but complementary detectors, suppressed conductivity and charge detection. Charge detection provides higher relative responses for multi-charged anions, such as found in heat stable amine salt solutions, than chloride and sulfate.
Using these two detectors with different responses were used to confirm peak purity and the presence of co-eluting peaks, thereby improving reporting accuracy.
Introduction Sour crude natural gas (methane) is typically treated with amine rich scrubber solutions to neutralize carbon dioxide and remove hydrogen sulfide gas impurities before it can be sold as a pure natural gas product.1,2 When the neutralizing capacity is deemed inefficient, the amine solutions are regenerated and stripped of elemental sulfur. Dissolved salts (heat stable amine salts) remain, building up over time resulting in higher maintenance costs, and higher incidents of corrosion.2,3 Analysis of both the amine concentrations and the heat stable amine salts are needed to ensure a pure product and an efficient scrubbing process. The Thermo Scientific™ Dionex™ QD Charge Detector promotes complete dissociation of many weakly dissociated compounds as a result, the charge responses of singly-charged, doubly-charged, and triply-charged ions are proportionally higher than conductivity. CD and QD detector provided different responses were used to confirm peak identity and the presence of unknown co-eluting peaks. Methods
Samples / Sample Preparation Sour gas amine samples were diluted 100-fold with deionized water. Some amine samples were treated with Thermo Scientific™ Dionex™ OnGuard™ II RP and Dionex OnGuard II Na cartridges to remove interfering cations and organic compounds.
Instrumentation
Thermo Scientific™ Dionex™ ICS-5000+ HPIC™ Ion Chromatography dual capillary system.
DP Dual Pump, EG Eluent Generator, DC Detector Chromatography, and Thermo Scientific™ Dionex™ IC Cube™ modules
Thermo Scientific Dionex Detectors: CD Conductivity Detector, QD Charge Detector with Thermo Scientific Dionex QDC 300 Cell
Autosampler: Thermo Scientific Dionex AS-AP Autosampler
Data Analysis:
Thermo Scientific™ Dionex™ Chromeleon™ Chromatography Data System
Conditions: Columns: Thermo Scientific™ Dionex™ IonPac™ AG11HC-4µm, Dionex IonPac AS11HC-4µm, 0.4 250 mm Eluent Source: Thermo Scientific Dionex EGC KOH cartridge, capillary Gradient: 1 mM KOH (-7–8 min), 1–30 mM (8–28 min), 30–85 mM (28–38 min), 85 mM (38–45 min) Flow Rate: 0.015 mL/min Column Temp.: 30 C Inj. Volume: 0.4 µL Detection: A: Suppressed conductivity, Thermo Scientific™ Dionex™ ACES™ 300 Anion Capillary Eleyctolytic Suppressor, recycle mode; 13 mA B: Charge detection, Dionex QDC 300 cell, 6 V
FIGURE 7–8: Anion determinations in 100-fold diluted amine scrubber solution.
Conclusion • Heat stable amine salts are challenging samples for analysis with many sulfur species,
organic acids and high concentrations of inorganic anions.
• Here we demonstrated an IC method needed by the gas industry to analyze heat stable amine salts in amines samples.
• This method has high efficiency separations made possible on a 4 µm particle capillary-size Dionex IonPac AS11-HC-4µm column and facilitated by a high-pressure (HPIC) capillary IC system.
• Using different detectors, such as the CD conductivity detector and the QD charge
detector provide advantages in improved peak identification and peak detection which result in improved reporting accuracy and information.
References 1. Natural Gas.org Home Page. http://naturalgas.org/ (accessed April 17, 2014). 2. Rooney, P.C.; Bacon, T.R.; DuPart, M.S. Effect of Heat Stable Salts on MDEA
Corrosivity, Parts 1 and 2. Hydrocarbon Processing, 1996, Mar, 95–103; 1997, Apr, 65–71.
3. Thermo Fisher Scientific Technical Note 122: Separation of Heat Stable Amine Salts in Methyldiethanolamine (MDEA) Solutions. Thermo Scientific P/N TN70192_E, Sunnyvale, CA, 2013. [Online] http://www.thermoscientific.com/content/dam/tfs/ATG/CMD/CMD%20Documents/Application%20&%20Technical%20Notes/Chromatography/Ion%20Chromatography/IC%20and%20RFIC%20Systems/TN-122-Separation-Heat-Stable-Amine-Salts-Methyldiethanolamine-Solutions-TN70192-E.pdf (accessed April 17, 2014).
FIGURE 6. Separation of mixed standard using CD and QD detection
FIGURE 2. Dionex IC Cube with capillary modules
Figure 6 shows the separation of a standard containing 15 inorganic anions, organic acids, and sulfur-based anions typically found as heat stable amine salts. QD responses were normalized to the nitrite peak. Peak 10 which is doubly charged and Peaks 13 and 14 which are triply charged have higher QD response than strongly ionized singlely charged nitrite. Thiocyanate is a singly charged ion which had a comparable relative response when normalized to nitrite.
FIGURE 1. Flow diagram for the IC system using CD and QD detectors.
FIGURE 3. Mechanism of QD Charged Detector
FIGURE 4. Using CD and QD detection for peak analysis.
Example 1: QD confirmation.
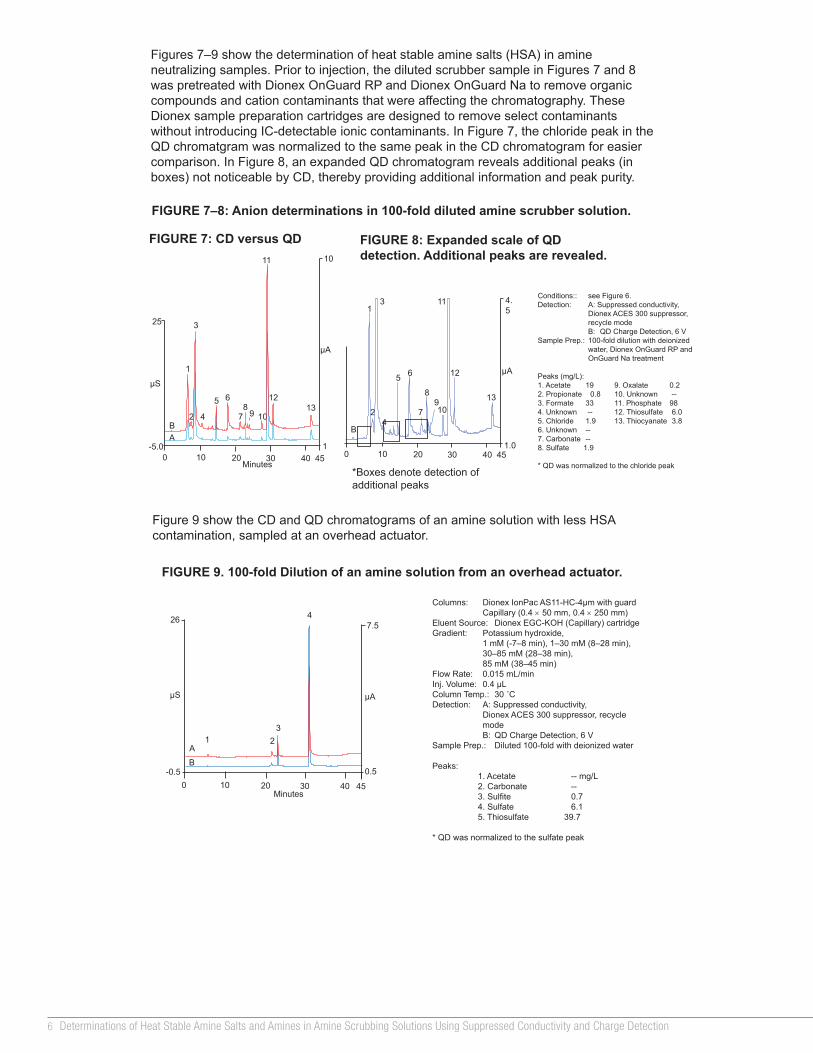
Figures 7–9 show the determination of heat stable amine salts (HSA) in amine neutralizing samples. Prior to injection, the diluted scrubber sample in Figures 7 and 8 was pretreated with Dionex OnGuard RP and Dionex OnGuard Na to remove organic compounds and cation contaminants that were affecting the chromatography. These Dionex sample preparation cartridges are designed to remove select contaminants without introducing IC-detectable ionic contaminants. In Figure 7, the chloride peak in the QD chromatgram was normalized to the same peak in the CD chromatogram for easier comparison. In Figure 8, an expanded QD chromatogram reveals additional peaks (in boxes) not noticeable by CD, thereby providing additional information and peak purity.
Figures 4–5 demonstrate how the different peak responses by the CD and QD can be used for improved data analysis.
Data Management
Conductivity Detector
High-Pressure Non-Metallic Pump
Waste
H20
CR-TC
Electrolytic Eluent
Suppressor
Separation Column Charge Detector
Eluent Generator (OH–)
Figure 2 shows the Dionex IC Cube module and Dionex QDC 300 Charge Detector cell. The Dionex IC Cube is designed to minimize the flow path needed for a capillary flow rate system by containing the columns and consumables in close proximity. .
Dionex Conductivity Detector (CD)
Dionex QDC 300 Charge Detector Cell
Guard and Separation Column tray Thermo Scientific Dionex CRD 180 Carbonate Removal Device cartridge
4-Port Injection Valve
Thermo Scientific Dionex Degas cartridge Dionex ACES 300
Suppressor
Dionex IC Cube
Results Charge Detection The Dionex QD Charge Detector promotes complete dissociation of many weakly dissociated compounds by drawing a current at a fixed potential (Figure 3). As a result, the charge responses of singly-charged, doubly-charged, and triply-charged ions are proportionally higher than conductivity.
.
Cation-Exchange Membrane
Anion-Exchange Membrane
A+ Y2-
H20
A+
H20
Cathode Anode 6 V
A+
Y2-
Figure 4 shows an example where the peaks have with the same response by CD detection (R1) which could be either C1 or C2 concentrations; but with QD detection (R3 and R4) clearly defines the concentrations.
Figure 5 illustrates another example were QD detection (R4) correspond to both C1 and C2 concentrations but is clarified by CD detection where R1 and R2 confirm C2 concentration.
Concentration Concentration
A
B
C1 C2 C1 C2 R
1
R3
R4
CD QD A or B
Concentration C1 C2
R4
QD A or B
Concentration
A
B
C1 C2
R2
R1
CD
FIGURE 9. 100-fold Dilution of an amine solution from an overhead actuator.
Columns: Dionex IonPac AS11-HC-4µm with guard Capillary (0.4 50 mm, 0.4 250 mm) Eluent Source: Dionex, EGC-KOH (Capillary) cartridge Gradient: Potassium hydroxide 1 mM (-7–8 min), 1–30 mM (8–28 min), 30–85 mM (28–38 min), 85 mM (38–45 min) Flow Rate: 0.015 mL/min Inj. Volume: 0.4 µL Column Temp.: 30 ˚C Detection: A: Suppressed conductivity, Dionex ACES 300 suppressor, recycle mode B: Dionex QD Charge Detection, 6 V Sample Prep.: Peaks: 1. Fluoride 0.4 mg/L 9. Carbonate 10 mg/L 2. Acetate 2.0 10. Sulfite 20 3. Propionate 2.0 11. Sulfate* 20 4. Formate 2.0 12. Oxalate 4 5. Chloride* 20 13. Phosphate 4 6. Nitrite 2.0 14. Thiosulfate 2 7. Bromide 2.0 15. Thiocyanate 2 8. Nitrate 20 * CD response for chloride and sulfate was truncated at 20 µS. QD chromatogram was normalized at the nitrite peak.
FIGURE 5. Using CD and QD detection for peak analysis.
Example 2: CD confirmation.
-0.5
7.5
Minutes 0
20
10 20 30 45
1 2 4
5
14
6
7 9
10
13
3
8
12
11
15
µS
40
µA
0.5 A B
-0.5
7.5
Minutes 0
26
10 20 30 45
1 2
4
3
µS
40
µA
0.5
A B
-5.0
10
Minutes 0
25
10 20 30 45
1
2 4 8
7
6
11
13
3
9
12
10
µS
40
µA
1 A B
5
4.5
0 10 20 30 45
1
2 4
8
7
6
11
13
3
9
12
10
40
µA
1.0
B
5
Conditions:: see Figure 6. Detection: A: Suppressed conductivity, Dionex ACES 300 suppressor, recycle mode B: QD Charge Detection, 6 V Sample Prep.: 100-fold dilution with deionized water, Dionex OnGuard RP and OnGuard Na treatment Peaks (mg/L): 1. Acetate 19 9. Oxalate 0.2 2. Propionate 0.8 10. Unknown -- 3. Formate 33 11. Phosphate 98 4. Unknown -- 12. Thiosulfate 6.0 5. Chloride 1.9 13. Thiocyanate 3.8 6. Unknown -- 7. Carbonate -- 8. Sulfate 1.9 * QD was normalized to the chloride peak
FIGURE 8: Expanded scale of QD detection. Additional peaks are revealed.
FIGURE 7: CD versus QD
Figure 9 show the CD and QD chromatograms of an amine solution with less HSA contamination, sampled at an overhead actuator.
Columns: Dionex IonPac AS11-HC-4µm with guard Capillary (0.4 50 mm, 0.4 250 mm) Eluent Source: Dionex EGC-KOH (Capillary) cartridge Gradient: Potassium hydroxide, 1 mM (-7–8 min), 1–30 mM (8–28 min), 30–85 mM (28–38 min), 85 mM (38–45 min) Flow Rate: 0.015 mL/min Inj. Volume: 0.4 µL Column Temp.: 30 ˚C Detection: A: Suppressed conductivity, Dionex ACES 300 suppressor, recycle mode B: QD Charge Detection, 6 V Sample Prep.: Diluted 100-fold with deionized water Peaks: 1. Acetate -- mg/L 2. Carbonate -- 3. Sulfite 0.7 4. Sulfate 6.1 5. Thiosulfate 39.7 * QD was normalized to the sulfate peak
*Boxes denote detection of additional peaks

3Thermo Scientific Poster Note • PN71118_HPLC_2014_E_05/14S
All trademarks are the property of Thermo Fisher Scientific and its subsidiaries.
This information is not intended to encourage use of these products in any manners that might infringe the intellectual property rights of others.
Determinations of Heat Stable Amine Salts and Amines in Amine Scrubbing Solutions Using Suppressed Conductivity and Charge Detection Terri Christison, Monika Verma, Pranathi Perati, Linda Lopez; Thermo Fisher Scientific, Sunnyvale, CA, USA
PO7118_E 05/14S
Overview Heat stable amine (HSA) salts, such as organic acids, inorganic anions, and sulfur
based salts, in amine scrubber solutions were separated by anion-exchange on a 4 µm particle high-efficiency capillary column.
This method utilizes two different but complementary detectors, suppressed conductivity and charge detection. Charge detection provides higher relative responses for multi-charged anions, such as found in heat stable amine salt solutions, than chloride and sulfate.
Using these two detectors with different responses were used to confirm peak purity and the presence of co-eluting peaks, thereby improving reporting accuracy.
Introduction Sour crude natural gas (methane) is typically treated with amine rich scrubber solutions to neutralize carbon dioxide and remove hydrogen sulfide gas impurities before it can be sold as a pure natural gas product.1,2 When the neutralizing capacity is deemed inefficient, the amine solutions are regenerated and stripped of elemental sulfur. Dissolved salts (heat stable amine salts) remain, building up over time resulting in higher maintenance costs, and higher incidents of corrosion.2,3 Analysis of both the amine concentrations and the heat stable amine salts are needed to ensure a pure product and an efficient scrubbing process. The Thermo Scientific™ Dionex™ QD Charge Detector promotes complete dissociation of many weakly dissociated compounds as a result, the charge responses of singly-charged, doubly-charged, and triply-charged ions are proportionally higher than conductivity. CD and QD detector provided different responses were used to confirm peak identity and the presence of unknown co-eluting peaks. Methods
Samples / Sample Preparation Sour gas amine samples were diluted 100-fold with deionized water. Some amine samples were treated with Thermo Scientific™ Dionex™ OnGuard™ II RP and Dionex OnGuard II Na cartridges to remove interfering cations and organic compounds.
Instrumentation
Thermo Scientific™ Dionex™ ICS-5000+ HPIC™ Ion Chromatography dual capillary system.
DP Dual Pump, EG Eluent Generator, DC Detector Chromatography, and Thermo Scientific™ Dionex™ IC Cube™ modules
Thermo Scientific Dionex Detectors: CD Conductivity Detector, QD Charge Detector with Thermo Scientific Dionex QDC 300 Cell
Autosampler: Thermo Scientific Dionex AS-AP Autosampler
Data Analysis:
Thermo Scientific™ Dionex™ Chromeleon™ Chromatography Data System
Conditions: Columns: Thermo Scientific™ Dionex™ IonPac™ AG11HC-4µm, Dionex IonPac AS11HC-4µm, 0.4 250 mm Eluent Source: Thermo Scientific Dionex EGC KOH cartridge, capillary Gradient: 1 mM KOH (-7–8 min), 1–30 mM (8–28 min), 30–85 mM (28–38 min), 85 mM (38–45 min) Flow Rate: 0.015 mL/min Column Temp.: 30 C Inj. Volume: 0.4 µL Detection: A: Suppressed conductivity, Thermo Scientific™ Dionex™ ACES™ 300 Anion Capillary Eleyctolytic Suppressor, recycle mode; 13 mA B: Charge detection, Dionex QDC 300 cell, 6 V
FIGURE 7–8: Anion determinations in 100-fold diluted amine scrubber solution.
Conclusion • Heat stable amine salts are challenging samples for analysis with many sulfur species,
organic acids and high concentrations of inorganic anions.
• Here we demonstrated an IC method needed by the gas industry to analyze heat stable amine salts in amines samples.
• This method has high efficiency separations made possible on a 4 µm particle capillary-size Dionex IonPac AS11-HC-4µm column and facilitated by a high-pressure (HPIC) capillary IC system.
• Using different detectors, such as the CD conductivity detector and the QD charge
detector provide advantages in improved peak identification and peak detection which result in improved reporting accuracy and information.
References 1. Natural Gas.org Home Page. http://naturalgas.org/ (accessed April 17, 2014). 2. Rooney, P.C.; Bacon, T.R.; DuPart, M.S. Effect of Heat Stable Salts on MDEA
Corrosivity, Parts 1 and 2. Hydrocarbon Processing, 1996, Mar, 95–103; 1997, Apr, 65–71.
3. Thermo Fisher Scientific Technical Note 122: Separation of Heat Stable Amine Salts in Methyldiethanolamine (MDEA) Solutions. Thermo Scientific P/N TN70192_E, Sunnyvale, CA, 2013. [Online] http://www.thermoscientific.com/content/dam/tfs/ATG/CMD/CMD%20Documents/Application%20&%20Technical%20Notes/Chromatography/Ion%20Chromatography/IC%20and%20RFIC%20Systems/TN-122-Separation-Heat-Stable-Amine-Salts-Methyldiethanolamine-Solutions-TN70192-E.pdf (accessed April 17, 2014).
FIGURE 6. Separation of mixed standard using CD and QD detection
FIGURE 2. Dionex IC Cube with capillary modules
Figure 6 shows the separation of a standard containing 15 inorganic anions, organic acids, and sulfur-based anions typically found as heat stable amine salts. QD responses were normalized to the nitrite peak. Peak 10 which is doubly charged and Peaks 13 and 14 which are triply charged have higher QD response than strongly ionized singlely charged nitrite. Thiocyanate is a singly charged ion which had a comparable relative response when normalized to nitrite.
FIGURE 1. Flow diagram for the IC system using CD and QD detectors.
FIGURE 3. Mechanism of QD Charged Detector
FIGURE 4. Using CD and QD detection for peak analysis.
Example 1: QD confirmation.
Figures 7–9 show the determination of heat stable amine salts (HSA) in amine neutralizing samples. Prior to injection, the diluted scrubber sample in Figures 7 and 8 was pretreated with Dionex OnGuard RP and Dionex OnGuard Na to remove organic compounds and cation contaminants that were affecting the chromatography. These Dionex sample preparation cartridges are designed to remove select contaminants without introducing IC-detectable ionic contaminants. In Figure 7, the chloride peak in the QD chromatgram was normalized to the same peak in the CD chromatogram for easier comparison. In Figure 8, an expanded QD chromatogram reveals additional peaks (in boxes) not noticeable by CD, thereby providing additional information and peak purity.
Figures 4–5 demonstrate how the different peak responses by the CD and QD can be used for improved data analysis.
Data Management
Conductivity Detector
High-Pressure Non-Metallic Pump
Waste
H20
CR-TC
Electrolytic Eluent
Suppressor
Separation Column Charge Detector
Eluent Generator (OH–)
Figure 2 shows the Dionex IC Cube module and Dionex QDC 300 Charge Detector cell. The Dionex IC Cube is designed to minimize the flow path needed for a capillary flow rate system by containing the columns and consumables in close proximity. .
Dionex Conductivity Detector (CD)
Dionex QDC 300 Charge Detector Cell
Guard and Separation Column tray Thermo Scientific Dionex CRD 180 Carbonate Removal Device cartridge
4-Port Injection Valve
Thermo Scientific Dionex Degas cartridge Dionex ACES 300
Suppressor
Dionex IC Cube
Results Charge Detection The Dionex QD Charge Detector promotes complete dissociation of many weakly dissociated compounds by drawing a current at a fixed potential (Figure 3). As a result, the charge responses of singly-charged, doubly-charged, and triply-charged ions are proportionally higher than conductivity.
.
Cation-Exchange Membrane
Anion-Exchange Membrane
A+ Y2-
H20
A+
H20
Cathode Anode 6 V
A+
Y2-
Figure 4 shows an example where the peaks have with the same response by CD detection (R1) which could be either C1 or C2 concentrations; but with QD detection (R3 and R4) clearly defines the concentrations.
Figure 5 illustrates another example were QD detection (R4) correspond to both C1 and C2 concentrations but is clarified by CD detection where R1 and R2 confirm C2 concentration.
Concentration Concentration
A
B
C1 C2 C1 C2
R1
R3
R4
CD QD A or B
Concentration C1 C2
R4
QD A or B
Concentration
A
B
C1 C2
R2
R1
CD
FIGURE 9. 100-fold Dilution of an amine solution from an overhead actuator.
Columns: Dionex IonPac AS11-HC-4µm with guard Capillary (0.4 50 mm, 0.4 250 mm) Eluent Source: Dionex, EGC-KOH (Capillary) cartridge Gradient: Potassium hydroxide 1 mM (-7–8 min), 1–30 mM (8–28 min), 30–85 mM (28–38 min), 85 mM (38–45 min) Flow Rate: 0.015 mL/min Inj. Volume: 0.4 µL Column Temp.: 30 ˚C Detection: A: Suppressed conductivity, Dionex ACES 300 suppressor, recycle mode B: Dionex QD Charge Detection, 6 V Sample Prep.: Peaks: 1. Fluoride 0.4 mg/L 9. Carbonate 10 mg/L 2. Acetate 2.0 10. Sulfite 20 3. Propionate 2.0 11. Sulfate* 20 4. Formate 2.0 12. Oxalate 4 5. Chloride* 20 13. Phosphate 4 6. Nitrite 2.0 14. Thiosulfate 2 7. Bromide 2.0 15. Thiocyanate 2 8. Nitrate 20 * CD response for chloride and sulfate was truncated at 20 µS. QD chromatogram was normalized at the nitrite peak.
FIGURE 5. Using CD and QD detection for peak analysis.
Example 2: CD confirmation.
-0.5
7.5
Minutes 0
20
10 20 30 45
1 2 4
5
14
6
7 9
10
13
3
8
12
11
15
µS
40
µA
0.5 A B
-0.5
7.5
Minutes 0
26
10 20 30 45
1 2
4
3
µS
40
µA
0.5
A B
-5.0
10
Minutes 0
25
10 20 30 45
1
2 4 8
7
6
11
13
3
9
12
10
µS
40
µA
1 A B
5
4.5
0 10 20 30 45
1
2 4
8
7
6
11
13
3
9
12
10
40
µA
1.0
B
5
Conditions:: see Figure 6. Detection: A: Suppressed conductivity, Dionex ACES 300 suppressor, recycle mode B: QD Charge Detection, 6 V Sample Prep.: 100-fold dilution with deionized water, Dionex OnGuard RP and OnGuard Na treatment Peaks (mg/L): 1. Acetate 19 9. Oxalate 0.2 2. Propionate 0.8 10. Unknown -- 3. Formate 33 11. Phosphate 98 4. Unknown -- 12. Thiosulfate 6.0 5. Chloride 1.9 13. Thiocyanate 3.8 6. Unknown -- 7. Carbonate -- 8. Sulfate 1.9 * QD was normalized to the chloride peak
FIGURE 8: Expanded scale of QD detection. Additional peaks are revealed.
FIGURE 7: CD versus QD
Figure 9 show the CD and QD chromatograms of an amine solution with less HSA contamination, sampled at an overhead actuator.
Columns: Dionex IonPac AS11-HC-4µm with guard Capillary (0.4 50 mm, 0.4 250 mm) Eluent Source: Dionex EGC-KOH (Capillary) cartridge Gradient: Potassium hydroxide, 1 mM (-7–8 min), 1–30 mM (8–28 min), 30–85 mM (28–38 min), 85 mM (38–45 min) Flow Rate: 0.015 mL/min Inj. Volume: 0.4 µL Column Temp.: 30 ˚C Detection: A: Suppressed conductivity, Dionex ACES 300 suppressor, recycle mode B: QD Charge Detection, 6 V Sample Prep.: Diluted 100-fold with deionized water Peaks: 1. Acetate -- mg/L 2. Carbonate -- 3. Sulfite 0.7 4. Sulfate 6.1 5. Thiosulfate 39.7 * QD was normalized to the sulfate peak
*Boxes denote detection of additional peaks

4 Determinations of Heat Stable Amine Salts and Amines in Amine Scrubbing Solutions Using Suppressed Conductivity and Charge Detection
All trademarks are the property of Thermo Fisher Scientific and its subsidiaries.
This information is not intended to encourage use of these products in any manners that might infringe the intellectual property rights of others.
Determinations of Heat Stable Amine Salts and Amines in Amine Scrubbing Solutions Using Suppressed Conductivity and Charge Detection Terri Christison, Monika Verma, Pranathi Perati, Linda Lopez; Thermo Fisher Scientific, Sunnyvale, CA, USA
PO7118_E 05/14S
Overview Heat stable amine (HSA) salts, such as organic acids, inorganic anions, and sulfur
based salts, in amine scrubber solutions were separated by anion-exchange on a 4 µm particle high-efficiency capillary column.
This method utilizes two different but complementary detectors, suppressed conductivity and charge detection. Charge detection provides higher relative responses for multi-charged anions, such as found in heat stable amine salt solutions, than chloride and sulfate.
Using these two detectors with different responses were used to confirm peak purity and the presence of co-eluting peaks, thereby improving reporting accuracy.
Introduction Sour crude natural gas (methane) is typically treated with amine rich scrubber solutions to neutralize carbon dioxide and remove hydrogen sulfide gas impurities before it can be sold as a pure natural gas product.1,2 When the neutralizing capacity is deemed inefficient, the amine solutions are regenerated and stripped of elemental sulfur. Dissolved salts (heat stable amine salts) remain, building up over time resulting in higher maintenance costs, and higher incidents of corrosion.2,3 Analysis of both the amine concentrations and the heat stable amine salts are needed to ensure a pure product and an efficient scrubbing process. The Thermo Scientific™ Dionex™ QD Charge Detector promotes complete dissociation of many weakly dissociated compounds as a result, the charge responses of singly-charged, doubly-charged, and triply-charged ions are proportionally higher than conductivity. CD and QD detector provided different responses were used to confirm peak identity and the presence of unknown co-eluting peaks. Methods
Samples / Sample Preparation Sour gas amine samples were diluted 100-fold with deionized water. Some amine samples were treated with Thermo Scientific™ Dionex™ OnGuard™ II RP and Dionex OnGuard II Na cartridges to remove interfering cations and organic compounds.
Instrumentation
Thermo Scientific™ Dionex™ ICS-5000+ HPIC™ Ion Chromatography dual capillary system.
DP Dual Pump, EG Eluent Generator, DC Detector Chromatography, and Thermo Scientific™ Dionex™ IC Cube™ modules
Thermo Scientific Dionex Detectors: CD Conductivity Detector, QD Charge Detector with Thermo Scientific Dionex QDC 300 Cell
Autosampler: Thermo Scientific Dionex AS-AP Autosampler
Data Analysis:
Thermo Scientific™ Dionex™ Chromeleon™ Chromatography Data System
Conditions: Columns: Thermo Scientific™ Dionex™ IonPac™ AG11HC-4µm, Dionex IonPac AS11HC-4µm, 0.4 250 mm Eluent Source: Thermo Scientific Dionex EGC KOH cartridge, capillary Gradient: 1 mM KOH (-7–8 min), 1–30 mM (8–28 min), 30–85 mM (28–38 min), 85 mM (38–45 min) Flow Rate: 0.015 mL/min Column Temp.: 30 C Inj. Volume: 0.4 µL Detection: A: Suppressed conductivity, Thermo Scientific™ Dionex™ ACES™ 300 Anion Capillary Eleyctolytic Suppressor, recycle mode; 13 mA B: Charge detection, Dionex QDC 300 cell, 6 V
FIGURE 7–8: Anion determinations in 100-fold diluted amine scrubber solution.
Conclusion • Heat stable amine salts are challenging samples for analysis with many sulfur species,
organic acids and high concentrations of inorganic anions.
• Here we demonstrated an IC method needed by the gas industry to analyze heat stable amine salts in amines samples.
• This method has high efficiency separations made possible on a 4 µm particle capillary-size Dionex IonPac AS11-HC-4µm column and facilitated by a high-pressure (HPIC) capillary IC system.
• Using different detectors, such as the CD conductivity detector and the QD charge
detector provide advantages in improved peak identification and peak detection which result in improved reporting accuracy and information.
References 1. Natural Gas.org Home Page. http://naturalgas.org/ (accessed April 17, 2014). 2. Rooney, P.C.; Bacon, T.R.; DuPart, M.S. Effect of Heat Stable Salts on MDEA
Corrosivity, Parts 1 and 2. Hydrocarbon Processing, 1996, Mar, 95–103; 1997, Apr, 65–71.
3. Thermo Fisher Scientific Technical Note 122: Separation of Heat Stable Amine Salts in Methyldiethanolamine (MDEA) Solutions. Thermo Scientific P/N TN70192_E, Sunnyvale, CA, 2013. [Online] http://www.thermoscientific.com/content/dam/tfs/ATG/CMD/CMD%20Documents/Application%20&%20Technical%20Notes/Chromatography/Ion%20Chromatography/IC%20and%20RFIC%20Systems/TN-122-Separation-Heat-Stable-Amine-Salts-Methyldiethanolamine-Solutions-TN70192-E.pdf (accessed April 17, 2014).
FIGURE 6. Separation of mixed standard using CD and QD detection
FIGURE 2. Dionex IC Cube with capillary modules
Figure 6 shows the separation of a standard containing 15 inorganic anions, organic acids, and sulfur-based anions typically found as heat stable amine salts. QD responses were normalized to the nitrite peak. Peak 10 which is doubly charged and Peaks 13 and 14 which are triply charged have higher QD response than strongly ionized singlely charged nitrite. Thiocyanate is a singly charged ion which had a comparable relative response when normalized to nitrite.
FIGURE 1. Flow diagram for the IC system using CD and QD detectors.
FIGURE 3. Mechanism of QD Charged Detector
FIGURE 4. Using CD and QD detection for peak analysis.
Example 1: QD confirmation.
Figures 7–9 show the determination of heat stable amine salts (HSA) in amine neutralizing samples. Prior to injection, the diluted scrubber sample in Figures 7 and 8 was pretreated with Dionex OnGuard RP and Dionex OnGuard Na to remove organic compounds and cation contaminants that were affecting the chromatography. These Dionex sample preparation cartridges are designed to remove select contaminants without introducing IC-detectable ionic contaminants. In Figure 7, the chloride peak in the QD chromatgram was normalized to the same peak in the CD chromatogram for easier comparison. In Figure 8, an expanded QD chromatogram reveals additional peaks (in boxes) not noticeable by CD, thereby providing additional information and peak purity.
Figures 4–5 demonstrate how the different peak responses by the CD and QD can be used for improved data analysis.
Data Management
Conductivity Detector
High-Pressure Non-Metallic Pump
Waste
H20
CR-TC
Electrolytic Eluent
Suppressor
Separation Column Charge Detector
Eluent Generator (OH–)
Figure 2 shows the Dionex IC Cube module and Dionex QDC 300 Charge Detector cell. The Dionex IC Cube is designed to minimize the flow path needed for a capillary flow rate system by containing the columns and consumables in close proximity. .
Dionex Conductivity Detector (CD)
Dionex QDC 300 Charge Detector Cell
Guard and Separation Column tray Thermo Scientific Dionex CRD 180 Carbonate Removal Device cartridge
4-Port Injection Valve
Thermo Scientific Dionex Degas cartridge Dionex ACES 300
Suppressor
Dionex IC Cube
Results Charge Detection The Dionex QD Charge Detector promotes complete dissociation of many weakly dissociated compounds by drawing a current at a fixed potential (Figure 3). As a result, the charge responses of singly-charged, doubly-charged, and triply-charged ions are proportionally higher than conductivity.
.
Cation-Exchange Membrane
Anion-Exchange Membrane
A+ Y2-
H20
A+
H20
Cathode Anode 6 V
A+
Y2-
Figure 4 shows an example where the peaks have with the same response by CD detection (R1) which could be either C1 or C2 concentrations; but with QD detection (R3 and R4) clearly defines the concentrations.
Figure 5 illustrates another example were QD detection (R4) correspond to both C1 and C2 concentrations but is clarified by CD detection where R1 and R2 confirm C2 concentration.
Concentration Concentration
A
B
C1 C2 C1 C2
R1
R3
R4
CD QD A or B
Concentration C1 C2
R4
QD A or B
Concentration
A
B
C1 C2
R2
R1
CD
FIGURE 9. 100-fold Dilution of an amine solution from an overhead actuator.
Columns: Dionex IonPac AS11-HC-4µm with guard Capillary (0.4 50 mm, 0.4 250 mm) Eluent Source: Dionex, EGC-KOH (Capillary) cartridge Gradient: Potassium hydroxide 1 mM (-7–8 min), 1–30 mM (8–28 min), 30–85 mM (28–38 min), 85 mM (38–45 min) Flow Rate: 0.015 mL/min Inj. Volume: 0.4 µL Column Temp.: 30 ˚C Detection: A: Suppressed conductivity, Dionex ACES 300 suppressor, recycle mode B: Dionex QD Charge Detection, 6 V Sample Prep.: Peaks: 1. Fluoride 0.4 mg/L 9. Carbonate 10 mg/L 2. Acetate 2.0 10. Sulfite 20 3. Propionate 2.0 11. Sulfate* 20 4. Formate 2.0 12. Oxalate 4 5. Chloride* 20 13. Phosphate 4 6. Nitrite 2.0 14. Thiosulfate 2 7. Bromide 2.0 15. Thiocyanate 2 8. Nitrate 20 * CD response for chloride and sulfate was truncated at 20 µS. QD chromatogram was normalized at the nitrite peak.
FIGURE 5. Using CD and QD detection for peak analysis.
Example 2: CD confirmation.
-0.5
7.5
Minutes 0
20
10 20 30 45
1 2 4
5
14
6
7 9
10
13
3
8
12
11
15
µS
40
µA
0.5 A B
-0.5
7.5
Minutes 0
26
10 20 30 45
1 2
4
3
µS
40
µA
0.5
A B
-5.0
10
Minutes 0
25
10 20 30 45
1
2 4 8
7
6
11
13
3
9
12
10
µS
40
µA
1 A B
5
4.5
0 10 20 30 45
1
2 4
8
7
6
11
13
3
9
12
10
40
µA
1.0
B
5
Conditions:: see Figure 6. Detection: A: Suppressed conductivity, Dionex ACES 300 suppressor, recycle mode B: QD Charge Detection, 6 V Sample Prep.: 100-fold dilution with deionized water, Dionex OnGuard RP and OnGuard Na treatment Peaks (mg/L): 1. Acetate 19 9. Oxalate 0.2 2. Propionate 0.8 10. Unknown -- 3. Formate 33 11. Phosphate 98 4. Unknown -- 12. Thiosulfate 6.0 5. Chloride 1.9 13. Thiocyanate 3.8 6. Unknown -- 7. Carbonate -- 8. Sulfate 1.9 * QD was normalized to the chloride peak
FIGURE 8: Expanded scale of QD detection. Additional peaks are revealed.
FIGURE 7: CD versus QD
Figure 9 show the CD and QD chromatograms of an amine solution with less HSA contamination, sampled at an overhead actuator.
Columns: Dionex IonPac AS11-HC-4µm with guard Capillary (0.4 50 mm, 0.4 250 mm) Eluent Source: Dionex EGC-KOH (Capillary) cartridge Gradient: Potassium hydroxide, 1 mM (-7–8 min), 1–30 mM (8–28 min), 30–85 mM (28–38 min), 85 mM (38–45 min) Flow Rate: 0.015 mL/min Inj. Volume: 0.4 µL Column Temp.: 30 ˚C Detection: A: Suppressed conductivity, Dionex ACES 300 suppressor, recycle mode B: QD Charge Detection, 6 V Sample Prep.: Diluted 100-fold with deionized water Peaks: 1. Acetate -- mg/L 2. Carbonate -- 3. Sulfite 0.7 4. Sulfate 6.1 5. Thiosulfate 39.7 * QD was normalized to the sulfate peak
*Boxes denote detection of additional peaks

5Thermo Scientific Poster Note • PN71118_HPLC_2014_E_05/14S
All trademarks are the property of Thermo Fisher Scientific and its subsidiaries.
This information is not intended to encourage use of these products in any manners that might infringe the intellectual property rights of others.
Determinations of Heat Stable Amine Salts and Amines in Amine Scrubbing Solutions Using Suppressed Conductivity and Charge Detection Terri Christison, Monika Verma, Pranathi Perati, Linda Lopez; Thermo Fisher Scientific, Sunnyvale, CA, USA
PO7118_E 05/14S
Overview Heat stable amine (HSA) salts, such as organic acids, inorganic anions, and sulfur
based salts, in amine scrubber solutions were separated by anion-exchange on a 4 µm particle high-efficiency capillary column.
This method utilizes two different but complementary detectors, suppressed conductivity and charge detection. Charge detection provides higher relative responses for multi-charged anions, such as found in heat stable amine salt solutions, than chloride and sulfate.
Using these two detectors with different responses were used to confirm peak purity and the presence of co-eluting peaks, thereby improving reporting accuracy.
Introduction Sour crude natural gas (methane) is typically treated with amine rich scrubber solutions to neutralize carbon dioxide and remove hydrogen sulfide gas impurities before it can be sold as a pure natural gas product.1,2 When the neutralizing capacity is deemed inefficient, the amine solutions are regenerated and stripped of elemental sulfur. Dissolved salts (heat stable amine salts) remain, building up over time resulting in higher maintenance costs, and higher incidents of corrosion.2,3 Analysis of both the amine concentrations and the heat stable amine salts are needed to ensure a pure product and an efficient scrubbing process. The Thermo Scientific™ Dionex™ QD Charge Detector promotes complete dissociation of many weakly dissociated compounds as a result, the charge responses of singly-charged, doubly-charged, and triply-charged ions are proportionally higher than conductivity. CD and QD detector provided different responses were used to confirm peak identity and the presence of unknown co-eluting peaks. Methods
Samples / Sample Preparation Sour gas amine samples were diluted 100-fold with deionized water. Some amine samples were treated with Thermo Scientific™ Dionex™ OnGuard™ II RP and Dionex OnGuard II Na cartridges to remove interfering cations and organic compounds.
Instrumentation
Thermo Scientific™ Dionex™ ICS-5000+ HPIC™ Ion Chromatography dual capillary system.
DP Dual Pump, EG Eluent Generator, DC Detector Chromatography, and Thermo Scientific™ Dionex™ IC Cube™ modules
Thermo Scientific Dionex Detectors: CD Conductivity Detector, QD Charge Detector with Thermo Scientific Dionex QDC 300 Cell
Autosampler: Thermo Scientific Dionex AS-AP Autosampler
Data Analysis:
Thermo Scientific™ Dionex™ Chromeleon™ Chromatography Data System
Conditions: Columns: Thermo Scientific™ Dionex™ IonPac™ AG11HC-4µm, Dionex IonPac AS11HC-4µm, 0.4 250 mm Eluent Source: Thermo Scientific Dionex EGC KOH cartridge, capillary Gradient: 1 mM KOH (-7–8 min), 1–30 mM (8–28 min), 30–85 mM (28–38 min), 85 mM (38–45 min) Flow Rate: 0.015 mL/min Column Temp.: 30 C Inj. Volume: 0.4 µL Detection: A: Suppressed conductivity, Thermo Scientific™ Dionex™ ACES™ 300 Anion Capillary Eleyctolytic Suppressor, recycle mode; 13 mA B: Charge detection, Dionex QDC 300 cell, 6 V
FIGURE 7–8: Anion determinations in 100-fold diluted amine scrubber solution.
Conclusion • Heat stable amine salts are challenging samples for analysis with many sulfur species,
organic acids and high concentrations of inorganic anions.
• Here we demonstrated an IC method needed by the gas industry to analyze heat stable amine salts in amines samples.
• This method has high efficiency separations made possible on a 4 µm particle capillary-size Dionex IonPac AS11-HC-4µm column and facilitated by a high-pressure (HPIC) capillary IC system.
• Using different detectors, such as the CD conductivity detector and the QD charge
detector provide advantages in improved peak identification and peak detection which result in improved reporting accuracy and information.
References 1. Natural Gas.org Home Page. http://naturalgas.org/ (accessed April 17, 2014). 2. Rooney, P.C.; Bacon, T.R.; DuPart, M.S. Effect of Heat Stable Salts on MDEA
Corrosivity, Parts 1 and 2. Hydrocarbon Processing, 1996, Mar, 95–103; 1997, Apr, 65–71.
3. Thermo Fisher Scientific Technical Note 122: Separation of Heat Stable Amine Salts in Methyldiethanolamine (MDEA) Solutions. Thermo Scientific P/N TN70192_E, Sunnyvale, CA, 2013. [Online] http://www.thermoscientific.com/content/dam/tfs/ATG/CMD/CMD%20Documents/Application%20&%20Technical%20Notes/Chromatography/Ion%20Chromatography/IC%20and%20RFIC%20Systems/TN-122-Separation-Heat-Stable-Amine-Salts-Methyldiethanolamine-Solutions-TN70192-E.pdf (accessed April 17, 2014).
FIGURE 6. Separation of mixed standard using CD and QD detection
FIGURE 2. Dionex IC Cube with capillary modules
Figure 6 shows the separation of a standard containing 15 inorganic anions, organic acids, and sulfur-based anions typically found as heat stable amine salts. QD responses were normalized to the nitrite peak. Peak 10 which is doubly charged and Peaks 13 and 14 which are triply charged have higher QD response than strongly ionized singlely charged nitrite. Thiocyanate is a singly charged ion which had a comparable relative response when normalized to nitrite.
FIGURE 1. Flow diagram for the IC system using CD and QD detectors.
FIGURE 3. Mechanism of QD Charged Detector
FIGURE 4. Using CD and QD detection for peak analysis.
Example 1: QD confirmation.
Figures 7–9 show the determination of heat stable amine salts (HSA) in amine neutralizing samples. Prior to injection, the diluted scrubber sample in Figures 7 and 8 was pretreated with Dionex OnGuard RP and Dionex OnGuard Na to remove organic compounds and cation contaminants that were affecting the chromatography. These Dionex sample preparation cartridges are designed to remove select contaminants without introducing IC-detectable ionic contaminants. In Figure 7, the chloride peak in the QD chromatgram was normalized to the same peak in the CD chromatogram for easier comparison. In Figure 8, an expanded QD chromatogram reveals additional peaks (in boxes) not noticeable by CD, thereby providing additional information and peak purity.
Figures 4–5 demonstrate how the different peak responses by the CD and QD can be used for improved data analysis.
Data Management
Conductivity Detector
High-Pressure Non-Metallic Pump
Waste
H20
CR-TC
Electrolytic Eluent
Suppressor
Separation Column Charge Detector
Eluent Generator (OH–)
Figure 2 shows the Dionex IC Cube module and Dionex QDC 300 Charge Detector cell. The Dionex IC Cube is designed to minimize the flow path needed for a capillary flow rate system by containing the columns and consumables in close proximity. .
Dionex Conductivity Detector (CD)
Dionex QDC 300 Charge Detector Cell
Guard and Separation Column tray Thermo Scientific Dionex CRD 180 Carbonate Removal Device cartridge
4-Port Injection Valve
Thermo Scientific Dionex Degas cartridge Dionex ACES 300
Suppressor
Dionex IC Cube
Results Charge Detection The Dionex QD Charge Detector promotes complete dissociation of many weakly dissociated compounds by drawing a current at a fixed potential (Figure 3). As a result, the charge responses of singly-charged, doubly-charged, and triply-charged ions are proportionally higher than conductivity.
.
Cation-Exchange Membrane
Anion-Exchange Membrane
A+ Y2-
H20
A+
H20
Cathode Anode 6 V
A+
Y2-
Figure 4 shows an example where the peaks have with the same response by CD detection (R1) which could be either C1 or C2 concentrations; but with QD detection (R3 and R4) clearly defines the concentrations.
Figure 5 illustrates another example were QD detection (R4) correspond to both C1 and C2 concentrations but is clarified by CD detection where R1 and R2 confirm C2 concentration.
Concentration Concentration
A
B
C1 C2 C1 C2
R1
R3
R4
CD QD A or B
Concentration C1 C2
R4
QD A or B
Concentration
A
B
C1 C2
R2
R1
CD
FIGURE 9. 100-fold Dilution of an amine solution from an overhead actuator.
Columns: Dionex IonPac AS11-HC-4µm with guard Capillary (0.4 50 mm, 0.4 250 mm) Eluent Source: Dionex, EGC-KOH (Capillary) cartridge Gradient: Potassium hydroxide 1 mM (-7–8 min), 1–30 mM (8–28 min), 30–85 mM (28–38 min), 85 mM (38–45 min) Flow Rate: 0.015 mL/min Inj. Volume: 0.4 µL Column Temp.: 30 ˚C Detection: A: Suppressed conductivity, Dionex ACES 300 suppressor, recycle mode B: Dionex QD Charge Detection, 6 V Sample Prep.: Peaks: 1. Fluoride 0.4 mg/L 9. Carbonate 10 mg/L 2. Acetate 2.0 10. Sulfite 20 3. Propionate 2.0 11. Sulfate* 20 4. Formate 2.0 12. Oxalate 4 5. Chloride* 20 13. Phosphate 4 6. Nitrite 2.0 14. Thiosulfate 2 7. Bromide 2.0 15. Thiocyanate 2 8. Nitrate 20 * CD response for chloride and sulfate was truncated at 20 µS. QD chromatogram was normalized at the nitrite peak.
FIGURE 5. Using CD and QD detection for peak analysis.
Example 2: CD confirmation.
-0.5
7.5
Minutes 0
20
10 20 30 45
1 2 4
5
14
6
7 9
10
13
3
8
12
11
15
µS
40
µA
0.5 A B
-0.5
7.5
Minutes 0
26
10 20 30 45
1 2
4
3
µS
40
µA
0.5
A B
-5.0
10
Minutes 0
25
10 20 30 45
1
2 4 8
7
6
11
13
3
9
12
10
µS
40
µA
1 A B
5
4.5
0 10 20 30 45
1
2 4
8
7
6
11
13
3
9
12
10
40
µA
1.0
B
5
Conditions:: see Figure 6. Detection: A: Suppressed conductivity, Dionex ACES 300 suppressor, recycle mode B: QD Charge Detection, 6 V Sample Prep.: 100-fold dilution with deionized water, Dionex OnGuard RP and OnGuard Na treatment Peaks (mg/L): 1. Acetate 19 9. Oxalate 0.2 2. Propionate 0.8 10. Unknown -- 3. Formate 33 11. Phosphate 98 4. Unknown -- 12. Thiosulfate 6.0 5. Chloride 1.9 13. Thiocyanate 3.8 6. Unknown -- 7. Carbonate -- 8. Sulfate 1.9 * QD was normalized to the chloride peak
FIGURE 8: Expanded scale of QD detection. Additional peaks are revealed.
FIGURE 7: CD versus QD
Figure 9 show the CD and QD chromatograms of an amine solution with less HSA contamination, sampled at an overhead actuator.
Columns: Dionex IonPac AS11-HC-4µm with guard Capillary (0.4 50 mm, 0.4 250 mm) Eluent Source: Dionex EGC-KOH (Capillary) cartridge Gradient: Potassium hydroxide, 1 mM (-7–8 min), 1–30 mM (8–28 min), 30–85 mM (28–38 min), 85 mM (38–45 min) Flow Rate: 0.015 mL/min Inj. Volume: 0.4 µL Column Temp.: 30 ˚C Detection: A: Suppressed conductivity, Dionex ACES 300 suppressor, recycle mode B: QD Charge Detection, 6 V Sample Prep.: Diluted 100-fold with deionized water Peaks: 1. Acetate -- mg/L 2. Carbonate -- 3. Sulfite 0.7 4. Sulfate 6.1 5. Thiosulfate 39.7 * QD was normalized to the sulfate peak
*Boxes denote detection of additional peaks
6 Determinations of Heat Stable Amine Salts and Amines in Amine Scrubbing Solutions Using Suppressed Conductivity and Charge Detection
All trademarks are the property of Thermo Fisher Scientific and its subsidiaries.
This information is not intended to encourage use of these products in any manners that might infringe the intellectual property rights of others.
Determinations of Heat Stable Amine Salts and Amines in Amine Scrubbing Solutions Using Suppressed Conductivity and Charge Detection Terri Christison, Monika Verma, Pranathi Perati, Linda Lopez; Thermo Fisher Scientific, Sunnyvale, CA, USA
PO7118_E 05/14S
Overview Heat stable amine (HSA) salts, such as organic acids, inorganic anions, and sulfur
based salts, in amine scrubber solutions were separated by anion-exchange on a 4 µm particle high-efficiency capillary column.
This method utilizes two different but complementary detectors, suppressed conductivity and charge detection. Charge detection provides higher relative responses for multi-charged anions, such as found in heat stable amine salt solutions, than chloride and sulfate.
Using these two detectors with different responses were used to confirm peak purity and the presence of co-eluting peaks, thereby improving reporting accuracy.
Introduction Sour crude natural gas (methane) is typically treated with amine rich scrubber solutions to neutralize carbon dioxide and remove hydrogen sulfide gas impurities before it can be sold as a pure natural gas product.1,2 When the neutralizing capacity is deemed inefficient, the amine solutions are regenerated and stripped of elemental sulfur. Dissolved salts (heat stable amine salts) remain, building up over time resulting in higher maintenance costs, and higher incidents of corrosion.2,3 Analysis of both the amine concentrations and the heat stable amine salts are needed to ensure a pure product and an efficient scrubbing process. The Thermo Scientific™ Dionex™ QD Charge Detector promotes complete dissociation of many weakly dissociated compounds as a result, the charge responses of singly-charged, doubly-charged, and triply-charged ions are proportionally higher than conductivity. CD and QD detector provided different responses were used to confirm peak identity and the presence of unknown co-eluting peaks. Methods
Samples / Sample Preparation Sour gas amine samples were diluted 100-fold with deionized water. Some amine samples were treated with Thermo Scientific™ Dionex™ OnGuard™ II RP and Dionex OnGuard II Na cartridges to remove interfering cations and organic compounds.
Instrumentation
Thermo Scientific™ Dionex™ ICS-5000+ HPIC™ Ion Chromatography dual capillary system.
DP Dual Pump, EG Eluent Generator, DC Detector Chromatography, and Thermo Scientific™ Dionex™ IC Cube™ modules
Thermo Scientific Dionex Detectors: CD Conductivity Detector, QD Charge Detector with Thermo Scientific Dionex QDC 300 Cell
Autosampler: Thermo Scientific Dionex AS-AP Autosampler
Data Analysis:
Thermo Scientific™ Dionex™ Chromeleon™ Chromatography Data System
Conditions: Columns: Thermo Scientific™ Dionex™ IonPac™ AG11HC-4µm, Dionex IonPac AS11HC-4µm, 0.4 250 mm Eluent Source: Thermo Scientific Dionex EGC KOH cartridge, capillary Gradient: 1 mM KOH (-7–8 min), 1–30 mM (8–28 min), 30–85 mM (28–38 min), 85 mM (38–45 min) Flow Rate: 0.015 mL/min Column Temp.: 30 C Inj. Volume: 0.4 µL Detection: A: Suppressed conductivity, Thermo Scientific™ Dionex™ ACES™ 300 Anion Capillary Eleyctolytic Suppressor, recycle mode; 13 mA B: Charge detection, Dionex QDC 300 cell, 6 V
FIGURE 7–8: Anion determinations in 100-fold diluted amine scrubber solution.
Conclusion • Heat stable amine salts are challenging samples for analysis with many sulfur species,
organic acids and high concentrations of inorganic anions.
• Here we demonstrated an IC method needed by the gas industry to analyze heat stable amine salts in amines samples.
• This method has high efficiency separations made possible on a 4 µm particle capillary-size Dionex IonPac AS11-HC-4µm column and facilitated by a high-pressure (HPIC) capillary IC system.
• Using different detectors, such as the CD conductivity detector and the QD charge
detector provide advantages in improved peak identification and peak detection which result in improved reporting accuracy and information.
References 1. Natural Gas.org Home Page. http://naturalgas.org/ (accessed April 17, 2014). 2. Rooney, P.C.; Bacon, T.R.; DuPart, M.S. Effect of Heat Stable Salts on MDEA
Corrosivity, Parts 1 and 2. Hydrocarbon Processing, 1996, Mar, 95–103; 1997, Apr, 65–71.
3. Thermo Fisher Scientific Technical Note 122: Separation of Heat Stable Amine Salts in Methyldiethanolamine (MDEA) Solutions. Thermo Scientific P/N TN70192_E, Sunnyvale, CA, 2013. [Online] http://www.thermoscientific.com/content/dam/tfs/ATG/CMD/CMD%20Documents/Application%20&%20Technical%20Notes/Chromatography/Ion%20Chromatography/IC%20and%20RFIC%20Systems/TN-122-Separation-Heat-Stable-Amine-Salts-Methyldiethanolamine-Solutions-TN70192-E.pdf (accessed April 17, 2014).
FIGURE 6. Separation of mixed standard using CD and QD detection
FIGURE 2. Dionex IC Cube with capillary modules
Figure 6 shows the separation of a standard containing 15 inorganic anions, organic acids, and sulfur-based anions typically found as heat stable amine salts. QD responses were normalized to the nitrite peak. Peak 10 which is doubly charged and Peaks 13 and 14 which are triply charged have higher QD response than strongly ionized singlely charged nitrite. Thiocyanate is a singly charged ion which had a comparable relative response when normalized to nitrite.
FIGURE 1. Flow diagram for the IC system using CD and QD detectors.
FIGURE 3. Mechanism of QD Charged Detector
FIGURE 4. Using CD and QD detection for peak analysis.
Example 1: QD confirmation.
Figures 7–9 show the determination of heat stable amine salts (HSA) in amine neutralizing samples. Prior to injection, the diluted scrubber sample in Figures 7 and 8 was pretreated with Dionex OnGuard RP and Dionex OnGuard Na to remove organic compounds and cation contaminants that were affecting the chromatography. These Dionex sample preparation cartridges are designed to remove select contaminants without introducing IC-detectable ionic contaminants. In Figure 7, the chloride peak in the QD chromatgram was normalized to the same peak in the CD chromatogram for easier comparison. In Figure 8, an expanded QD chromatogram reveals additional peaks (in boxes) not noticeable by CD, thereby providing additional information and peak purity.
Figures 4–5 demonstrate how the different peak responses by the CD and QD can be used for improved data analysis.
Data Management
Conductivity Detector
High-Pressure Non-Metallic Pump
Waste
H20
CR-TC
Electrolytic Eluent
Suppressor
Separation Column Charge Detector
Eluent Generator (OH–)
Figure 2 shows the Dionex IC Cube module and Dionex QDC 300 Charge Detector cell. The Dionex IC Cube is designed to minimize the flow path needed for a capillary flow rate system by containing the columns and consumables in close proximity. .
Dionex Conductivity Detector (CD)
Dionex QDC 300 Charge Detector Cell
Guard and Separation Column tray Thermo Scientific Dionex CRD 180 Carbonate Removal Device cartridge
4-Port Injection Valve
Thermo Scientific Dionex Degas cartridge Dionex ACES 300
Suppressor
Dionex IC Cube
Results Charge Detection The Dionex QD Charge Detector promotes complete dissociation of many weakly dissociated compounds by drawing a current at a fixed potential (Figure 3). As a result, the charge responses of singly-charged, doubly-charged, and triply-charged ions are proportionally higher than conductivity.
.
Cation-Exchange Membrane
Anion-Exchange Membrane
A+ Y2-
H20
A+
H20
Cathode Anode 6 V
A+
Y2-
Figure 4 shows an example where the peaks have with the same response by CD detection (R1) which could be either C1 or C2 concentrations; but with QD detection (R3 and R4) clearly defines the concentrations.
Figure 5 illustrates another example were QD detection (R4) correspond to both C1 and C2 concentrations but is clarified by CD detection where R1 and R2 confirm C2 concentration.
Concentration Concentration
A
B
C1 C2 C1 C2
R1
R3
R4
CD QD A or B
Concentration C1 C2
R4
QD A or B
Concentration
A
B
C1 C2
R2
R1
CD
FIGURE 9. 100-fold Dilution of an amine solution from an overhead actuator.
Columns: Dionex IonPac AS11-HC-4µm with guard Capillary (0.4 50 mm, 0.4 250 mm) Eluent Source: Dionex, EGC-KOH (Capillary) cartridge Gradient: Potassium hydroxide 1 mM (-7–8 min), 1–30 mM (8–28 min), 30–85 mM (28–38 min), 85 mM (38–45 min) Flow Rate: 0.015 mL/min Inj. Volume: 0.4 µL Column Temp.: 30 ˚C Detection: A: Suppressed conductivity, Dionex ACES 300 suppressor, recycle mode B: Dionex QD Charge Detection, 6 V Sample Prep.: Peaks: 1. Fluoride 0.4 mg/L 9. Carbonate 10 mg/L 2. Acetate 2.0 10. Sulfite 20 3. Propionate 2.0 11. Sulfate* 20 4. Formate 2.0 12. Oxalate 4 5. Chloride* 20 13. Phosphate 4 6. Nitrite 2.0 14. Thiosulfate 2 7. Bromide 2.0 15. Thiocyanate 2 8. Nitrate 20 * CD response for chloride and sulfate was truncated at 20 µS. QD chromatogram was normalized at the nitrite peak.
FIGURE 5. Using CD and QD detection for peak analysis.
Example 2: CD confirmation.
-0.5
7.5
Minutes 0
20
10 20 30 45
1 2 4
5
14
6
7 9
10
13
3
8
12
11
15
µS
40
µA
0.5 A B
-0.5
7.5
Minutes 0
26
10 20 30 45
1 2
4
3
µS
40
µA
0.5
A B
-5.0
10
Minutes 0
25
10 20 30 45
1
2 4 8
7
6
11
13
3
9
12
10
µS
40
µA
1 A B
5
4.5
0 10 20 30 45
1
2 4
8
7
6
11
13
3
9
12
10
40
µA
1.0
B
5
Conditions:: see Figure 6. Detection: A: Suppressed conductivity, Dionex ACES 300 suppressor, recycle mode B: QD Charge Detection, 6 V Sample Prep.: 100-fold dilution with deionized water, Dionex OnGuard RP and OnGuard Na treatment Peaks (mg/L): 1. Acetate 19 9. Oxalate 0.2 2. Propionate 0.8 10. Unknown -- 3. Formate 33 11. Phosphate 98 4. Unknown -- 12. Thiosulfate 6.0 5. Chloride 1.9 13. Thiocyanate 3.8 6. Unknown -- 7. Carbonate -- 8. Sulfate 1.9 * QD was normalized to the chloride peak
FIGURE 8: Expanded scale of QD detection. Additional peaks are revealed.
FIGURE 7: CD versus QD
Figure 9 show the CD and QD chromatograms of an amine solution with less HSA contamination, sampled at an overhead actuator.
Columns: Dionex IonPac AS11-HC-4µm with guard Capillary (0.4 50 mm, 0.4 250 mm) Eluent Source: Dionex EGC-KOH (Capillary) cartridge Gradient: Potassium hydroxide, 1 mM (-7–8 min), 1–30 mM (8–28 min), 30–85 mM (28–38 min), 85 mM (38–45 min) Flow Rate: 0.015 mL/min Inj. Volume: 0.4 µL Column Temp.: 30 ˚C Detection: A: Suppressed conductivity, Dionex ACES 300 suppressor, recycle mode B: QD Charge Detection, 6 V Sample Prep.: Diluted 100-fold with deionized water Peaks: 1. Acetate -- mg/L 2. Carbonate -- 3. Sulfite 0.7 4. Sulfate 6.1 5. Thiosulfate 39.7 * QD was normalized to the sulfate peak
*Boxes denote detection of additional peaks

Thermo Fisher Scientific, Sunnyvale, CA USA is ISO 9001:2008 Certified.
www.thermoscientific.com©2014 Thermo Fisher Scientific Inc. All rights reserved. ISO is a trademark of the International Standards Organization. All other trademarks are the property of Thermo Fisher Scientific Inc. and its subsidiaries. This information is presented as an example of the capabilities of Thermo Fisher Scientific Inc. products. It is not intended to encourage use of these products in any manners that might infringe the intellectual property rights of others. Specifications, terms and pricing are subject to change. Not all products are available in all countries. Please consult your local sales representative for details.
PN71118_E 05/14S
Africa +43 1 333 50 34 0Australia +61 3 9757 4300Austria +43 810 282 206Belgium +32 53 73 42 41Brazil +55 11 3731 5140Canada +1 800 530 8447China 800 810 5118 (free call domestic)
400 650 5118
Denmark +45 70 23 62 60Europe-Other +43 1 333 50 34 0Finland +358 9 3291 0200France +33 1 60 92 48 00Germany +49 6103 408 1014India +91 22 6742 9494Italy +39 02 950 591
Japan +81 6 6885 1213Korea +82 2 3420 8600Latin America +1 561 688 8700Middle East +43 1 333 50 34 0Netherlands +31 76 579 55 55 New Zealand +64 9 980 6700 Norway +46 8 556 468 00
Russia/CIS +43 1 333 50 34 0Singapore +65 6289 1190Sweden +46 8 556 468 00 Switzerland +41 61 716 77 00Taiwan +886 2 8751 6655UK/Ireland +44 1442 233555USA +1 800 532 4752
All trademarks are the property of Thermo Fisher Scientific and its subsidiaries.
This information is not intended to encourage use of these products in any manners that might infringe the intellectual property rights of others.
Determinations of Heat Stable Amine Salts and Amines in Amine Scrubbing Solutions Using Suppressed Conductivity and Charge Detection Terri Christison, Monika Verma, Pranathi Perati, Linda Lopez; Thermo Fisher Scientific, Sunnyvale, CA, USA
PO7118_E 05/14S
Overview Heat stable amine (HSA) salts, such as organic acids, inorganic anions, and sulfur
based salts, in amine scrubber solutions were separated by anion-exchange on a 4 µm particle high-efficiency capillary column.
This method utilizes two different but complementary detectors, suppressed conductivity and charge detection. Charge detection provides higher relative responses for multi-charged anions, such as found in heat stable amine salt solutions, than chloride and sulfate.
Using these two detectors with different responses were used to confirm peak purity and the presence of co-eluting peaks, thereby improving reporting accuracy.
Introduction Sour crude natural gas (methane) is typically treated with amine rich scrubber solutions to neutralize carbon dioxide and remove hydrogen sulfide gas impurities before it can be sold as a pure natural gas product.1,2 When the neutralizing capacity is deemed inefficient, the amine solutions are regenerated and stripped of elemental sulfur. Dissolved salts (heat stable amine salts) remain, building up over time resulting in higher maintenance costs, and higher incidents of corrosion.2,3 Analysis of both the amine concentrations and the heat stable amine salts are needed to ensure a pure product and an efficient scrubbing process. The Thermo Scientific™ Dionex™ QD Charge Detector promotes complete dissociation of many weakly dissociated compounds as a result, the charge responses of singly-charged, doubly-charged, and triply-charged ions are proportionally higher than conductivity. CD and QD detector provided different responses were used to confirm peak identity and the presence of unknown co-eluting peaks. Methods
Samples / Sample Preparation Sour gas amine samples were diluted 100-fold with deionized water. Some amine samples were treated with Thermo Scientific™ Dionex™ OnGuard™ II RP and Dionex OnGuard II Na cartridges to remove interfering cations and organic compounds.
Instrumentation
Thermo Scientific™ Dionex™ ICS-5000+ HPIC™ Ion Chromatography dual capillary system.
DP Dual Pump, EG Eluent Generator, DC Detector Chromatography, and Thermo Scientific™ Dionex™ IC Cube™ modules
Thermo Scientific Dionex Detectors: CD Conductivity Detector, QD Charge Detector with Thermo Scientific Dionex QDC 300 Cell
Autosampler: Thermo Scientific Dionex AS-AP Autosampler
Data Analysis:
Thermo Scientific™ Dionex™ Chromeleon™ Chromatography Data System
Conditions: Columns: Thermo Scientific™ Dionex™ IonPac™ AG11HC-4µm, Dionex IonPac AS11HC-4µm, 0.4 250 mm Eluent Source: Thermo Scientific Dionex EGC KOH cartridge, capillary Gradient: 1 mM KOH (-7–8 min), 1–30 mM (8–28 min), 30–85 mM (28–38 min), 85 mM (38–45 min) Flow Rate: 0.015 mL/min Column Temp.: 30 C Inj. Volume: 0.4 µL Detection: A: Suppressed conductivity, Thermo Scientific™ Dionex™ ACES™ 300 Anion Capillary Eleyctolytic Suppressor, recycle mode; 13 mA B: Charge detection, Dionex QDC 300 cell, 6 V
FIGURE 7–8: Anion determinations in 100-fold diluted amine scrubber solution.
Conclusion • Heat stable amine salts are challenging samples for analysis with many sulfur species,
organic acids and high concentrations of inorganic anions.
• Here we demonstrated an IC method needed by the gas industry to analyze heat stable amine salts in amines samples.
• This method has high efficiency separations made possible on a 4 µm particle capillary-size Dionex IonPac AS11-HC-4µm column and facilitated by a high-pressure (HPIC) capillary IC system.
• Using different detectors, such as the CD conductivity detector and the QD charge
detector provide advantages in improved peak identification and peak detection which result in improved reporting accuracy and information.
References 1. Natural Gas.org Home Page. http://naturalgas.org/ (accessed April 17, 2014). 2. Rooney, P.C.; Bacon, T.R.; DuPart, M.S. Effect of Heat Stable Salts on MDEA
Corrosivity, Parts 1 and 2. Hydrocarbon Processing, 1996, Mar, 95–103; 1997, Apr, 65–71.
3. Thermo Fisher Scientific Technical Note 122: Separation of Heat Stable Amine Salts in Methyldiethanolamine (MDEA) Solutions. Thermo Scientific P/N TN70192_E, Sunnyvale, CA, 2013. [Online] http://www.thermoscientific.com/content/dam/tfs/ATG/CMD/CMD%20Documents/Application%20&%20Technical%20Notes/Chromatography/Ion%20Chromatography/IC%20and%20RFIC%20Systems/TN-122-Separation-Heat-Stable-Amine-Salts-Methyldiethanolamine-Solutions-TN70192-E.pdf (accessed April 17, 2014).
FIGURE 6. Separation of mixed standard using CD and QD detection
FIGURE 2. Dionex IC Cube with capillary modules
Figure 6 shows the separation of a standard containing 15 inorganic anions, organic acids, and sulfur-based anions typically found as heat stable amine salts. QD responses were normalized to the nitrite peak. Peak 10 which is doubly charged and Peaks 13 and 14 which are triply charged have higher QD response than strongly ionized singlely charged nitrite. Thiocyanate is a singly charged ion which had a comparable relative response when normalized to nitrite.
FIGURE 1. Flow diagram for the IC system using CD and QD detectors.
FIGURE 3. Mechanism of QD Charged Detector
FIGURE 4. Using CD and QD detection for peak analysis.
Example 1: QD confirmation.
Figures 7–9 show the determination of heat stable amine salts (HSA) in amine neutralizing samples. Prior to injection, the diluted scrubber sample in Figures 7 and 8 was pretreated with Dionex OnGuard RP and Dionex OnGuard Na to remove organic compounds and cation contaminants that were affecting the chromatography. These Dionex sample preparation cartridges are designed to remove select contaminants without introducing IC-detectable ionic contaminants. In Figure 7, the chloride peak in the QD chromatgram was normalized to the same peak in the CD chromatogram for easier comparison. In Figure 8, an expanded QD chromatogram reveals additional peaks (in boxes) not noticeable by CD, thereby providing additional information and peak purity.
Figures 4–5 demonstrate how the different peak responses by the CD and QD can be used for improved data analysis.
Data Management
Conductivity Detector
High-Pressure Non-Metallic Pump
Waste
H20
CR-TC
Electrolytic Eluent
Suppressor
Separation Column Charge Detector
Eluent Generator (OH–)
Figure 2 shows the Dionex IC Cube module and Dionex QDC 300 Charge Detector cell. The Dionex IC Cube is designed to minimize the flow path needed for a capillary flow rate system by containing the columns and consumables in close proximity. .
Dionex Conductivity Detector (CD)
Dionex QDC 300 Charge Detector Cell
Guard and Separation Column tray Thermo Scientific Dionex CRD 180 Carbonate Removal Device cartridge
4-Port Injection Valve
Thermo Scientific Dionex Degas cartridge Dionex ACES 300
Suppressor
Dionex IC Cube
Results Charge Detection The Dionex QD Charge Detector promotes complete dissociation of many weakly dissociated compounds by drawing a current at a fixed potential (Figure 3). As a result, the charge responses of singly-charged, doubly-charged, and triply-charged ions are proportionally higher than conductivity.
.
Cation-Exchange Membrane
Anion-Exchange Membrane
A+ Y2-
H20
A+
H20
Cathode Anode 6 V
A+
Y2-
Figure 4 shows an example where the peaks have with the same response by CD detection (R1) which could be either C1 or C2 concentrations; but with QD detection (R3 and R4) clearly defines the concentrations.
Figure 5 illustrates another example were QD detection (R4) correspond to both C1 and C2 concentrations but is clarified by CD detection where R1 and R2 confirm C2 concentration.
Concentration Concentration
A
B
C1 C2 C1 C2
R1
R3
R4
CD QD A or B
Concentration C1 C2
R4
QD A or B
Concentration
A
B
C1 C2
R2
R1
CD
FIGURE 9. 100-fold Dilution of an amine solution from an overhead actuator.
Columns: Dionex IonPac AS11-HC-4µm with guard Capillary (0.4 50 mm, 0.4 250 mm) Eluent Source: Dionex, EGC-KOH (Capillary) cartridge Gradient: Potassium hydroxide 1 mM (-7–8 min), 1–30 mM (8–28 min), 30–85 mM (28–38 min), 85 mM (38–45 min) Flow Rate: 0.015 mL/min Inj. Volume: 0.4 µL Column Temp.: 30 ˚C Detection: A: Suppressed conductivity, Dionex ACES 300 suppressor, recycle mode B: Dionex QD Charge Detection, 6 V Sample Prep.: Peaks: 1. Fluoride 0.4 mg/L 9. Carbonate 10 mg/L 2. Acetate 2.0 10. Sulfite 20 3. Propionate 2.0 11. Sulfate* 20 4. Formate 2.0 12. Oxalate 4 5. Chloride* 20 13. Phosphate 4 6. Nitrite 2.0 14. Thiosulfate 2 7. Bromide 2.0 15. Thiocyanate 2 8. Nitrate 20 * CD response for chloride and sulfate was truncated at 20 µS. QD chromatogram was normalized at the nitrite peak.
FIGURE 5. Using CD and QD detection for peak analysis.
Example 2: CD confirmation.
-0.5
7.5
Minutes 0
20
10 20 30 45
1 2 4
5
14
6
7 9
10
13
3
8
12
11
15
µS
40
µA
0.5 A B
-0.5
7.5
Minutes 0
26
10 20 30 45
1 2
4
3
µS
40
µA
0.5
A B
-5.0
10
Minutes 0
25
10 20 30 45
1
2 4 8
7
6
11
13
3
9
12
10
µS
40
µA
1 A B
5
4.5
0 10 20 30 45
1
2 4
8
7
6
11
13
3
9
12
10
40
µA
1.0
B
5
Conditions:: see Figure 6. Detection: A: Suppressed conductivity, Dionex ACES 300 suppressor, recycle mode B: QD Charge Detection, 6 V Sample Prep.: 100-fold dilution with deionized water, Dionex OnGuard RP and OnGuard Na treatment Peaks (mg/L): 1. Acetate 19 9. Oxalate 0.2 2. Propionate 0.8 10. Unknown -- 3. Formate 33 11. Phosphate 98 4. Unknown -- 12. Thiosulfate 6.0 5. Chloride 1.9 13. Thiocyanate 3.8 6. Unknown -- 7. Carbonate -- 8. Sulfate 1.9 * QD was normalized to the chloride peak
FIGURE 8: Expanded scale of QD detection. Additional peaks are revealed.
FIGURE 7: CD versus QD
Figure 9 show the CD and QD chromatograms of an amine solution with less HSA contamination, sampled at an overhead actuator.
Columns: Dionex IonPac AS11-HC-4µm with guard Capillary (0.4 50 mm, 0.4 250 mm) Eluent Source: Dionex EGC-KOH (Capillary) cartridge Gradient: Potassium hydroxide, 1 mM (-7–8 min), 1–30 mM (8–28 min), 30–85 mM (28–38 min), 85 mM (38–45 min) Flow Rate: 0.015 mL/min Inj. Volume: 0.4 µL Column Temp.: 30 ˚C Detection: A: Suppressed conductivity, Dionex ACES 300 suppressor, recycle mode B: QD Charge Detection, 6 V Sample Prep.: Diluted 100-fold with deionized water Peaks: 1. Acetate -- mg/L 2. Carbonate -- 3. Sulfite 0.7 4. Sulfate 6.1 5. Thiosulfate 39.7 * QD was normalized to the sulfate peak
*Boxes denote detection of additional peaks