Determination of the molecular mass distribution of synthetic polymers by size-exclusion...
11
924 (2001) 239–249 Journal of Chromatography A, www.elsevier.com / locate / chroma Determination of the molecular mass distribution of synthetic polymers by size-exclusion electrochromatography 1 * Feng Ding , Remco Stol, Wim Th. Kok , Hans Poppe Polymer Analysis Group, Department of Chemical Engineering, University of Amsterdam, Nieuwe Achtergracht 166, 1018 WV Amsterdam, The Netherlands Abstract The performance of size-exclusion electrochromatography (SEEC) for the mass distribution analysis of synthetic polymers was studied and compared to conventional, pressure-driven size-exclusion chromatography (SEC). Electroosmotic flow control, within-day, day-to-day and column-to-column repeatability were determined for SEEC with respect to retention and separation efficiency. It was shown that by using the retention ratio instead of the migration time, the precision of the mass distribution calculations is sufficiently high, and that similar distributions were obtained for a sample analyzed by pressure-driven SEC and by SEEC. Furthermore, hexafluoroisopropanol was demonstrated to be a new and potent solvent for SEEC. It was used for the separation of narrow polymethylmethacrylate standards and several commercially important polymers such as polycarbonate, polycaprolactam and poly(ethylene terephthalate), using UV detection in the deep UV region (195–230 nm). 2001 Elsevier Science B.V. All rights reserved. Keywords: Electrochromatography; Size-exclusion electrochromatography; Molecular mass; Hexafluoroisopropanol; Poly- methylmethacrylate; Polycarbonate; Polycaprolactam; Poly(ethylene terephthalate); Polystyrene 1. Introduction field is applied over a (packed) capillary column generating an electroosmotic flow (EOF) which Capillary electrochromatography (CEC) is a sepa- carries the solvent and the solutes through the ration technique which currently enjoys attention column. Limitations for particle dimensions with throughout the analytical science community. The respect to flow development are less restrictive in attractive features of CEC, the fertile combination of electrochromatography than in HPLC. Highly effi- the high separation efficiency of electrokinetic tech- cient separations have been shown on columns niques with the high selectivity offered by various packed with particles of 1.5-mm diameter and small- forms of liquid chromatography, have been exten- er [1,2]. Moreover, since the EOF velocity is virtual- sively demonstrated in practice. In CEC an electric ly independent of the flow channel width, a homoge- neous flow velocity profile over the column cross section is obtained, resulting in a reduced peak *Corresponding author. Tel.: 131-20-525-6539; fax: 131-20- broadening compared to pressure-driven chromatog- 525-5604. raphy [3–5]. The occurrence of a significant liquid E-mail address: [email protected] (W.T. Kok). 1 flow through the pores of stationary phase particles Permanent address: Evidence Identification Group, Liaoning may further improve the separation efficiency [6– Criminal Scientific and Technical Research Institute, Qishanzhong Road 2, Shengyang, Liaoning, China. 11]. A general advantage of capillary separation 0021-9673 / 01 / $ – see front matter 2001 Elsevier Science B.V. All rights reserved. PII: S0021-9673(01)00795-6
Transcript of Determination of the molecular mass distribution of synthetic polymers by size-exclusion...

924 (2001) 239–249Journal of Chromatography A,www.elsevier.com/ locate /chroma
Determination of the molecular mass distribution of syntheticpolymers by size-exclusion electrochromatography
1 *Feng Ding , Remco Stol, Wim Th. Kok , Hans PoppePolymer Analysis Group, Department of Chemical Engineering, University of Amsterdam, Nieuwe Achtergracht 166,
1018 WV Amsterdam, The Netherlands
Abstract
The performance of size-exclusion electrochromatography (SEEC) for the mass distribution analysis of synthetic polymerswas studied and compared to conventional, pressure-driven size-exclusion chromatography (SEC). Electroosmotic flowcontrol, within-day, day-to-day and column-to-column repeatability were determined for SEEC with respect to retention andseparation efficiency. It was shown that by using the retention ratio instead of the migration time, the precision of the massdistribution calculations is sufficiently high, and that similar distributions were obtained for a sample analyzed bypressure-driven SEC and by SEEC. Furthermore, hexafluoroisopropanol was demonstrated to be a new and potent solvent forSEEC. It was used for the separation of narrow polymethylmethacrylate standards and several commercially importantpolymers such as polycarbonate, polycaprolactam and poly(ethylene terephthalate), using UV detection in the deep UVregion (195–230 nm). 2001 Elsevier Science B.V. All rights reserved.
Keywords: Electrochromatography; Size-exclusion electrochromatography; Molecular mass; Hexafluoroisopropanol; Poly-methylmethacrylate; Polycarbonate; Polycaprolactam; Poly(ethylene terephthalate); Polystyrene
1. Introduction field is applied over a (packed) capillary columngenerating an electroosmotic flow (EOF) which
Capillary electrochromatography (CEC) is a sepa- carries the solvent and the solutes through theration technique which currently enjoys attention column. Limitations for particle dimensions withthroughout the analytical science community. The respect to flow development are less restrictive inattractive features of CEC, the fertile combination of electrochromatography than in HPLC. Highly effi-the high separation efficiency of electrokinetic tech- cient separations have been shown on columnsniques with the high selectivity offered by various packed with particles of 1.5-mm diameter and small-forms of liquid chromatography, have been exten- er [1,2]. Moreover, since the EOF velocity is virtual-sively demonstrated in practice. In CEC an electric ly independent of the flow channel width, a homoge-
neous flow velocity profile over the column crosssection is obtained, resulting in a reduced peak
*Corresponding author. Tel.: 131-20-525-6539; fax: 131-20- broadening compared to pressure-driven chromatog-525-5604. raphy [3–5]. The occurrence of a significant liquid
E-mail address: [email protected] (W.T. Kok).1 flow through the pores of stationary phase particlesPermanent address: Evidence Identification Group, Liaoning
may further improve the separation efficiency [6–Criminal Scientific and Technical Research Institute, QishanzhongRoad 2, Shengyang, Liaoning, China. 11]. A general advantage of capillary separation
0021-9673/01/$ – see front matter 2001 Elsevier Science B.V. All rights reserved.PI I : S0021-9673( 01 )00795-6

924 (2001) 239–249240 F. Ding et al. / J. Chromatogr. A
methods such as CEC is the low amount of station- (Geel, Belgium). HFIP, tetra-n-butylammoniumtet-ary phase material required and low solvent con- rafluoroborate (TBATFB) and lithium chloride camesumption. This may facilitate the use of special from Merck (Darmstadt, Germany). The narrowstationary phases for, e.g. chiral separations [12] or polystyrene standards were obtained from Merck,the use of expensive or toxic solvents. Polymer Labs. (Church Stretton, UK) and Polysci-
Different selectivity modes have been applied in ence (Warrington, PA, USA). The poly(methylmeth-CEC, such as reversed-phase [3–4,10–11], normal- acrylate) (PMMA) standards were obtained fromphase [13] and (dynamic) ion-exchange [14,15] Polymer Labs. All standards had a polydispersitysystems. ,1.2, as stated by the suppliers. Two broad PS
Recently, size-exclusion electrochromatography samples with different mass (PS 1 and PS 2) were(SEEC) has been introduced [6–10]. It was shown prepared in the laboratory by free radical poly-that SEEC can offer high-speed and high-efficiency merization in toluene as described elsewhere [16].molecular-size separations of (synthetic) polymers, The two polycarbonate (polybisphenol-A) sampleswith minimal consumption of organic solvent. So far, with different molecular mass (PC 1 and PC 2)SEEC has been studied only in the separation of well where a kind gift from Dr. E. Venema (Generaldefined, narrow polystyrene (PS) standards using Electric Plastics, Bergen op Zoom, Netherlands). TheN,N-dimethylformamide (DMF) as the mobile phase. poly(ethyleneterephthalate) (PET) sample wasSince PS is UV active and DMF has a relatively high scraped from a plastic bottle and the poly(caprolac-dielectric constant, this combination was a logical tam) sample was bought from Polyscience. Of eachfirst selection to explore the potential of SEEC for of the polymer samples a stock solution was pre-polymer separations. However, before SEEC can be pared in the appropriate solvent at a concentration of
21regarded as a valuable alternative for classical size- 10 mg ml . A stock solution of toluene in DMF21exclusion chromatography (SEC), its potential and was prepared at a concentration of 100 ml ml .
performance in practical applications has to be Samples were prepared by mixing appropriate vol-studied further. umes of the stock solutions and pure solvent to
21In this paper results are presented of a study on the obtain concentrations of approximately 1.0 mg ml .practical applicability of SEEC for the characteriza- Polycarbonate was injected at a concentration of 10
21 21tion of various synthetic polymers. The quality of mg ml in DMF and at 1.0 mg ml in HFIP. Eitherflow control, injection repeatability and column-to- toluene (in DMF) or acetone (in HFIP) served as thecolumn repeatability have been assessed. Molecular totally permeating markers, added to all samples at a
21mass distributions of real-life polymer samples as concentration of 10 ml ml .obtained by SEEC have been compared with SEC For the SEEC experiments, the mobile phaseresults. Special attention has been given to the consisted either of DMF to which LiCl was added atapplication of 1,1,1,3,3,3-hexafluoroiospropanol a concentration of 0.1 mM, or HFIP to which(HFIP) as solvent. HFIP is a potent solvent for a TBATFB at a concentration of 1.0 mM was added.variety of polymer types that are insoluble in com- Unmodified silica particles with a diameter of 5mon organic solvents. However, the toxicity and mm and a nominal pore size of 30 nm (Nucleosil
¨excessively high price of HFIP are serious draw- 5-300; Macherey–Nagel, Duren, Germany) werebacks for its application as a solvent in conventional used as the stationary phase for separations in DMF.SEC and the low solvent consumption of SEEC may With HFIP as the mobile phase, 10-mm sulfonic acidbe a real advantage here. modified particles (Nucleosil SA-10, nominal pore
size 10 nm Macherey–Nagel) were used.
2. Experimental 2.2. Instrumentation for size-exclusionelectrochromatography
2.1. ChemicalsAll electrokinetic experiments were performed on
3DDMF, non-stabilised tetrahydrofuran (THF), a HP CE system (Hewlett-Packard, Waldbronn,methanol and toluene were obtained from Acros Germany). During separation a pressure of 10 bar

924 (2001) 239–249 241F. Ding et al. / J. Chromatogr. A
was applied at both ends of the column, which was one end of a 40-cm length of fused-silica tubing (100thermostatted at 208C. UV detection was performed mm I.D.3375 mm O.D., Polymicro Technologies,at 260 and 270 nm (DMF) or at 195 and 220 nm Phoenix, AZ, USA) a temporary frit was prepared(HFIP). through heating of a 1–2 mm plug of bare silica
Injections were performed electrokinetically particles (Nucleosil 100-5) with a small gas flame. A21through the application of 5 kV for 10 s unless slurry containing 10 mg ml of the respective
specified otherwise. Experiments were performed in packing material in methanol was prepared andduplicate unless otherwise stated and the mean placed in the slurry chamber, which was a 20 cmvalues were used for further calculations. Migration length of stainless steel tubing (I.D. of 1 /16 in.; 1times and plate numbers were calculated using the in.52.54 cm) The capillary was connected to theCHEMSTATION software (Hewlett-Packard). slurry chamber and high pressure was used to drive
the particles into the column.2.3. Instrumentation for conventional size-exclusion High pressure was delivered by a high-pressurechromatography membrane pump operated at a maximal pressure of
500 bar. After 1 h, the pressure was relieved fromTwo different instrumental set-ups were used for the column, which was subsequently flushed with
conventional pressure-driven SEC (PD-SEC). With water at a pressure of 150 bar for 1 h. Next,both instruments non-stabilized THF was used as the permanent frits were prepared at a distance ofmobile phase. approximately 25 cm from each other, by heating the
The first system (SEC 1) consisted of a Spectro- packed section using an electrically resistively heatedflow 400 solvent delivery system (ABI, Ramsey, NJ, metal strip device. Then the pressure was relievedUSA) operated in the constant flow mode at 1.0 carefully from the column, which was then reversely
21ml min connected to a Rheodyne type 7010 injec- connected to the pump in order to remove the excesstor (Rheodyne, Berkeley, CA, USA) equipped with a of particles. Next a 3-mm wide detection window20-m1 sample loop. The column was a single 6003 was prepared adjacent to the outlet frit, by burning7.5 mm PL-GEL 5 mm Mixed-C column from off the protective coating. When DMF was used asPolymer Labs. Detection was performed using a the mobile phase the column was connected to aSpectroflow 757 variable-wavelength UV detector standard HPLC pump (Spectroflow 400, ABI)(ABI) operated at 254 nm (polystyrenes) or 265 nm equipped with a laboratory-made flow splitter and(polycarbonate). The detector signal was recorded on flushed with the mobile phase at a constant pressurea flat-bed recorder (BD-41, Kipp en Zonen, Delft, of |50 bar. The column was then cut to the desiredNetherlands) and was simultaneously digitised using length and installed into the SEEC instrument.a Smartlink model KNM-DCV 12-RS232-C D/A When HFIP was used as the mobile phase aconverter (Keithley Instruments, Cleveland, OH, pressure of 10 bar was applied onto the column inletUSA). Data analysis was performed using custom- for 60 min to flush the column with the mobilemade software. The second system (SEC 2) con- phase. The columns were electrokinetically con-sisted of a Waters Alliance 2690 separations module ditioned by the application of a ramped voltage(Milford, MA, USA) operated at a flow-rate of 0.35 gradient of up to 15 kV across the column over 30
21ml min connected to a Waters 410 differential min.refractometer as the detector. With this system aWaters Styragel HR-4E and a Styragel HR-S columnwere used in series. Both columns were 30 cm37.8 3. Results and discussionmm I.D. and were thermostatted at 358C.
3.1. Repeatability studies2.4. Column preparation for size-exclusionelectrochromatography Many factors affect the magnitude and direction of
the EOF: the sign and density of the charge on theThe preparation of the capillary columns for SEEC surface of the silica particles, the ionic strength of
has been described in detail elsewhere [8]. Briefly, at the mobile phase and the dielectric constant of the

924 (2001) 239–249242 F. Ding et al. / J. Chromatogr. A
Table 1Run-to-run repeatability (n520) of the migration time, the retention ratio and the separation efficiency of SEEC; mobile phase: 0.1 mMLiCl in DMF; stationary phase: 5 mm Nucleosil 300; UV detection at 260 nm
Standard Migration time Retention ratio Plate height
Compound M Average (min) RSD (%) Average RSD (%) Average (mm) RSD (%)r
PS 675 000 5.13 0.9 0.671 0.5 40 6.1PS 43 900 5.76 1.3 0.754 0.1 30 7.9PS 2100 7.22 1.3 0.946 0.1 25 2.0Toluene 7.64 1.3 N/A N/A 8.3 1.3
solvent [5]. The general experience in CEC is that it using only the migration times of standards such ais often difficult to maintain a constant EOF over a precision is too low. When the migration times werelarge number of experiments. corrected for the migration time of the completely
To test the EOF repeatability for the SEEC permeating marker (toluene), the spread in the resultssystem, a sample containing three different PS was strongly reduced. The imprecision of the re-standards and toluene was injected repeatedly. The tention ratio was reduced to approximately 0.1%,mobile phase consisted of DMF to which 0.1 mM which generally suffices for the determination ofLiCl was added and a separation voltage of 15 kV polymer mass distributions.was applied. Soon it was found that a single buffer The run-to-run repeatability of the separationvial could not be used repeatedly when precise flow efficiency was worse than for the migration times,control is desired. The observed drift of migration with RDS values up to |8.0% for the plate heights.times can be explained by the lack of buffering Still, with reduced plate heights in the order of 5–8capacity of the mobile phase. During electrophoresis for the PS standards the efficiency of the SEECa change of the pH of the solution in the inlet vial system was completely satisfactory.will be induced by the electrochemical processes at Next, the day-to-day repeatability of the migrationthe electrode. Therefore, in further experiments the times and the separation efficiency was tested bymobile phase was refreshed after each single experi- injection of a sample mixture onto the same columnment. five times repeatedly on 6 different days (Table 2).
With a fresh mobile phase solution in the inlet vial Again a relatively large variance in the migrationfor each run, a large number (n520) of repeated runs time is observed and a substantial improvement ofwas performed. Both the retention times of the the repeatability can be obtained by using theinjected components were recorded as well as the retention ratio instead. The day-to-day repeatabilityplate heights of the separated components. The data of the separation efficiency is not worse than theobtained are summarized in Table 1. The variance in within-day repeatability.the migration time is relatively low at approximately The column-to-column repeatability, which is1%. Still, for mass calibration of SEEC columns often considered to be the most problematic factor to
Table 2Day-to-day repeatability (5 consecutive runs on 6 different days) of the migration time, the retention ratio and the separation efficiency ofSEEC; mobile phase: 0.1 mM LiCl in DMF; stationary phase: 5 mm Nucleosil 300; UV detection at 260 nm
Standard Migration time Retention ratio Plate height
Compound M Average (min) RSD (%) Average RSD (%) Average (mm) RSD (%)r
PS 675 000 5.34 21.1 0.696 0.3 34 39PS 43 900 5.96 2.1 0.777 0.1 36 2.8PS 7600 6.78 2.0 0.884 0.1 38 0.7PS 2100 7.26 1.9 0.946 0.1 24 0.7Toluene 7.67 2.0 N/A N/A 8.2 2.0
924 (2001) 239–249 243F. Ding et al. / J. Chromatogr. A
control in electrochromatography, was also tested.This was done by injecting the same sample mixturesix times repeatedly on six different columns ondifferent days (Table 3). The variance in retentiontimes from column-to-column is in the order of 10%.For the retention ratio it is seen that the column-to-column repeatability is in the order of only 2%. Thelargest variation was observed for the separationefficiency which was in excess of 25%. However,when a closer look was taken at the rough data it wasfound that one of the columns (column 3) wasperforming less efficiently than the others. When thedata for this column where left out, the divergence inthe separation efficiency decreased significantly(Table 3). Surprisingly, the deviating columnshowed no abnormalities with respect to the migra-tion times or the retention ratios. Apparently, themost problematic factor in column preparation forSEEC is not to make columns with the same
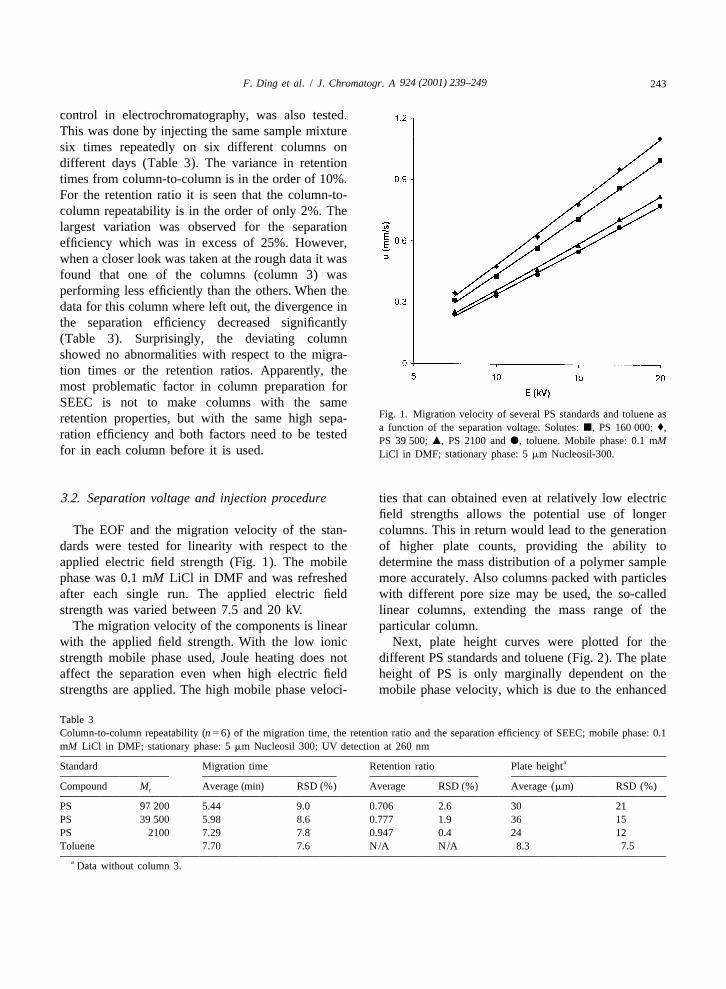
Fig. 1. Migration velocity of several PS standards and toluene asretention properties, but with the same high sepa-a function of the separation voltage. Solutes: j, PS 160 000; ♦,
ration efficiency and both factors need to be tested PS 39 500; m, PS 2100 and d, toluene. Mobile phase: 0.1 mMfor in each column before it is used. LiCl in DMF; stationary phase: 5 mm Nucleosil-300.
3.2. Separation voltage and injection procedure ties that can obtained even at relatively low electricfield strengths allows the potential use of longer
The EOF and the migration velocity of the stan- columns. This in return would lead to the generationdards were tested for linearity with respect to the of higher plate counts, providing the ability toapplied electric field strength (Fig. 1). The mobile determine the mass distribution of a polymer samplephase was 0.1 mM LiCl in DMF and was refreshed more accurately. Also columns packed with particlesafter each single run. The applied electric field with different pore size may be used, the so-calledstrength was varied between 7.5 and 20 kV. linear columns, extending the mass range of the
The migration velocity of the components is linear particular column.with the applied field strength. With the low ionic Next, plate height curves were plotted for thestrength mobile phase used, Joule heating does not different PS standards and toluene (Fig. 2). The plateaffect the separation even when high electric field height of PS is only marginally dependent on thestrengths are applied. The high mobile phase veloci- mobile phase velocity, which is due to the enhanced
Table 3Column-to-column repeatability (n56) of the migration time, the retention ratio and the separation efficiency of SEEC; mobile phase: 0.1mM LiCl in DMF; stationary phase: 5 mm Nucleosil 300; UV detection at 260 nm
aStandard Migration time Retention ratio Plate height
Compound M Average (min) RSD (%) Average RSD (%) Average (mm) RSD (%)r
PS 97 200 5.44 9.0 0.706 2.6 30 21PS 39 500 5.98 8.6 0.777 1.9 36 15PS 2100 7.29 7.8 0.947 0.4 24 12Toluene 7.70 7.6 N/A N/A 8.3 7.5
a Data without column 3.

924 (2001) 239–249244 F. Ding et al. / J. Chromatogr. A
7.5 nl. The injection plug length is 2.0% of thecolumn length. However, the separation efficiency isstill not affected by such a prolonged injection.
3.3. Determination of molecular mass distributions
Using the preferred specified experimental con-ditions and a 0.1 mM LiCl in DMF as the mobilephase, a mass calibration curve for PS was con-structed for SEEC. Mixtures of narrow PS standardswere injected three times onto the column and theaveraged retention ratios were used (Fig. 4). A thirdorder polynomial function was fitted through the datapoints that was used for further calculations. Next,the broad PS and PC samples were injected. Forcalculation of the mass distribution of the PS sam-ples the UV trace at 260 nm was taken, while for thePC samples the UV trace at 270 nm was used. Forboth polymers it holds that the UV signal is directly
Fig. 2. Plate height curves for several of the PS standards and proportional to the number concentration of mono-toluene. Solutes: j, PS 160 000; ♦, PS 39 500; m, PS 2100 and mers of the respective polymer, thereby allowingd, toluene. Mobile phase: 0.1 mM LiCl in DMF. Stationary
simple calculation of the concentration of the PS atphase: 5 mm Nucleosil-300.each time interval.
In Fig. 5 the calculated mass distributions of theseparation efficiency as a result of faster mass broad synthetic polymers shown. Parameters charac-transfer kinetics [9–11]. terizing these distributions, such as the M , M andtop n
Since both selectivity and separation efficiency do M , which correspond to the most abundant molecu-w
not diverge with the applied electric field strength, lar mass, the number-averaged molecular mass andSEEC may be performed relatively quickly com- the mass-averaged molecular mass, respectively, andpared to PD-SEC, where the application of higher the polydispersity, P, were calculated from themobile phase velocities strongly affects the sepa- chromatograms. Similar calculations were performedration efficiency and separations are commonly using data obtained by PD-SEC on either one or bothperformed using low mobile phase velocities re- available SEC instruments to allow comparison withsulting in extended separation times. the SEEC results (Table 4). For all samples approxi-
For quantitative analysis, injection procedures mately the same numbers are found for the massshould be very precise and no sample discrimination distribution parameters obtained by SEC or electro-should occur. Also overloading of the column should chromatography. The differences observed betweenbe prevented. With electrokinetic injection, which is the SEEC and the SEC results were of the samecommonly employed in electrochromatography, the order of magnitude as the differences found when theinjected sample amount can be varied by changing two SEC instruments were compared. Equivalentthe electric field strength and the injection time. Both differences in mass distribution parameters werethese factors where tested for linearity with respect found when in another study different PD-SECto peak height and peak area. Fig. 3 shows that all instruments and columns were compared [17].tested factors are linear with the injection voltageand duration up to at least 7 kV for 10 s (70 kV s). 3.4. Experiences with HFIP as a mobile phase forThe estimated injection plug length for such a large SEECinjection time is approximately 0.5 cm, corre-sponding to an injection volume of approximately One of the primary advantages of SEEC is that the

924 (2001) 239–249 245F. Ding et al. / J. Chromatogr. A
Fig. 3. Effect of injection conditions (time and voltage) on the peak height (A), peak area (B) and the separation efficiency (C) of somepolystyrene standards. Solutes: j, PS 97 200; ♦, PS 39 500; m, PS 2100 and d, toluene. Mobile phase: 0.1 mM LiCl in DMF. Stationaryphase: 5 mm Nucleosil-300.
capillary dimensions of the column provides a be a real advantage. HFIP may be a good solvent forsignificant reduction of the solvent consumption SEEC, since it has very good UV transmissioncompared to conventional SEC. For solvents such as properties (UV cut-of ,190 nm) and it has aHFIP, which is a toxic and expensive, but common relatively high dielectric constant (´ 520).r
solvent for a variety of synthetic polymers, this may First several salts were tested for solubility in

924 (2001) 239–249246 F. Ding et al. / J. Chromatogr. A
Fig. 4. Mass calibration curve for polystyrene in SEEC. Mobilephase: 0.1 mM LiCl in DMF; stationary phase: 5 mm Nucleosil-300; separation voltage: 20 kV.
HFIP. The linearity between current conduction incapillary electrophoresis and the concentration ofTBATFB demonstrated that this salt dissociates inHFIP. In all further experiments TBATFB was addedto HFIP at a concentration of 1.0 mM.
It was found that the EOF in open capillaries andin columns packed with bare silica particles was toolow to be used for separation by electrochroma-tography, when HFIP containing 1.0 mM TBATFBwas used as the mobile phase. This may be due tothe acidity of the solvent itself, or to the presence ofrelatively high concentrations of impurities such ashydrofluoric acid, which prevents silanolic acidgroups from dissociating and developing charge onthe surface. When sulphonic acid modified (strongcation-exchange) particles, which are more easilycharged at low pH, were used as the stationaryphase, a relatively high EOF was obtained. The EOFvelocity measured at 20 kV was 0.38 mm/s, which isstill 3–4 slower than the EOF mobility found for the
Fig. 5. Mass distributions of the two broad polystyrene samplessame particles with DMF as the mobile phase under(A) and the polycarbonate samples (B) as determined by SEEC.otherwise identical conditions. However, it proved toMobile phase: 0.1 mM LiCl in DMF; stationary phase: 5 mm
be much more difficult to generate a stable EOF, 21Nucleosil-300; applied electric field: 20 kV; samples: 5.0 mg mleven when the mobile phase was refreshed after each in DMF; separation voltage: 20 kV; UV detection at 260 nm (A)run or when the retention ratio was used instead of and 270 nm (B).

924 (2001) 239–249 247F. Ding et al. / J. Chromatogr. A
Table 4Mass distribution parameters calculated for the broad syntheticpolymers as obtained by the different techniques
Technique M M M Ptop n w
Polystyrene sample 1 (PS 1)SEEC 137 850 162 710 226 130 1.39SEC 1 130 710 149 010 226 200 1.52SEC 2 133 120 173 390 232 540 1.34
Polystyrene sample 2 (PS 2)SEEC 92 830 115 650 149 280 1.29SEC 1 95 850 105 720 146 350 1.38SEC 2 81 000 119 620 176 510 1.48
Polycarbonate sample 1 (PC 1)a a aSEEC 20 090 22 090 34 240 1.55a a aSEC 1 20 040 21 040 31 380 1.49
SEC 2 – – – –
Polycarbonate sample 2 (PC 2)a a aSEEC 63 050 65 230 101 110 1.55a a aSEC 1 75 760 75 410 112 250 1.49
Fig. 6. Mass calibration curve for PMMA in SEEC. MobileSEC 2 – – – –phase: 0.1 mM TBATFB in HFIP. Stationary phase: 10 mma In polystyrene units. Nucleosil SA-100; separation voltage: 25 kV; UV detection at 220nm.
the actual retention time. Still, the feasibility andattractiveness of using HFIP as a solvent for SEECcould be demonstrated.
A mass calibration curve was constructed forPMMA through the separation of a number ofPMMA standards (Fig. 6). The retention ratios of thePMMA standards were calculated using acetone asthe totally permeating marker. The curve shows thatthe mass (size) range of PMMA standards that can beseparated on the column material is relatively small
˚compared to the mass range available with the 300 Abare silica material used for the separations withDMF as the mobile phase. This is due to the largerpore diameter of the latter particle types.
An example of a separation of three PMMAstandards of different mass by SEEC using HFIP asthe mobile phase can be seen in Fig. 7. Using HFIPas the mobile phase, the PMMA standards werenicely resolved and could be detected at 220 nm. Atthis wavelength the acetone produced a negative
Fig. 7. Separation of three different PMMA standards by SEECpeak, therefore the migration time of acetone wasusing 1.0 mM TBATFB in HFIP as the mobile phase. Solutes: (1)determined from the UV trace at 254 nm wherePMMA 67 000; (2) PMMA 15 100; (3) PMMA 2400 and (4)
acetone is highly UV active. acetone. Mobile phase: 0.1 mM TBATFB in HFIP; stationaryExamples of SEEC separations of some commer- phase: 10 mm Nucleosil SA-100; separation voltage: 25 kV; UV
cially relevant polymer samples are shown in Fig. 8. detection at 220 nm.

924 (2001) 239–249248 F. Ding et al. / J. Chromatogr. A
Fig. 8. Separation of several commercially important, HFIP soluble synthetic polymers by means of SEEC. Samples: (A) PC; (B) PET and(C) polycaprolactam. Mobile phase: 0.1 mM TBATFB in HFIP. Stationary phase: 10 mm Nucleosil SA-100; separation voltage: 25 kV; UVdetection at 195 nm.
Again, the high UV transmission properties of HFIP detection at 195 nm resulting in an |500-foldallow for a high sensitivity and the ability to use low increase of the sensitivity compared to UV detectionUV wavelengths for detection. For example the two at 265 nm as applied with DMF as the solvent. UsingPC samples were also subjected to SEEC analysis UV detection at 195 nm highly sensitive detectionusing HFIP instead of DMF as the solvent. The very could also be performed for PET and polycaprolac-good UV transmission properties of HFIP allowed tam samples.

924 (2001) 239–249 249F. Ding et al. / J. Chromatogr. A
4. Conclusions (NWO) under grant 79.030. F.D. is indebted to theChinese Scholarship Council for financially support-
It has been established that EOF can be well ing his work under project number 98921026.controlled in SEEC. In addition, the injection pro-cedure and the the repeatability of the retention andefficiency are precise enough to allow SEEC to be Referencesused for the quantitative analysis of mass distribu-tions of synthetic polymers. Comparison of mass [1] R.M. Seifar, J.C. Kraak, W.T. Kok, H. Poppe, Chromato-
graphia 46 (1997) 131.distributions as determined from SEEC and PD-SEC[2] S. Luedtke, T. Adam, N. VonDoehren, K.K. Unger, J.data show that there is no significant difference
Chromatogr. A 887 (2000) 339.between the two methodologies. The main advan- [3] J.H. Knox, I.H. Grant, Chromatographia 24 (1987) 135.tages of SEEC over PD-SEC are the ability to [4] H. Knox, I.H. Grant, Chromatographia 32 (1991) 317.perform relatively fast separations, and the small [5] C.L. Rice, R.J. Whitehead, Phys. Chem. 69 (1965) 4017.
[6] E. Venema, J.C. Kraak, R. Tijssen, H. Poppe, Chromato-dimensions of the separation system.graphia 48 (1998) 347.The feasibility of using SEEC for the mass
´[7] E.C. Peters, M. Petro, F. Svec, J.M.J. Frechet, Anal. Chem.analysis of a variety of synthetic polymers is demon- 70 (1998) 2296.strated by using HFIP as a new mobile phase for [8] R. Stol, H. Poppe, W.Th. Kok, J. Chromatogr. A 887 (2000)SEEC. Here, the potential of SEEC is even higher 199.
[9] R. Stol, W.Th. Kok, H. Poppe, J. Chromatogr. A 914 (2001)due to the small mobile phase consumption, resulting201.in a large reduction of analysis costs. Future de-
[10] R. Stol, W.Th. Kok, H. Poppe, J. Chromatogr. A 853 (1999)velopment of SEEC will mostly rely on demon- 45.strating new solvents and applications for SEEC and [11] P.T. Vallano, V.T. Remcho, Anal. Chem. 72 (2000) 4255.
¨the development of miniaturized detectors, other than [12] M. Lammerhofer, E. Tobler, W. Linder, J. Chromatogr. A887 (2000) 421.UV, suitable for (synthetic) polymers.
[13] A. Maruska, U. Pyell, Chromatographia 45 (1997) 229.´[14] J. Zhang, X. Huang, S.H. Zhang, Cs. Horvath, Anal. Chem.
72 (2000) 3022.Acknowledgements [15] M.G. Cikalo, K.D. Bartle, P. Myers, Anal. Chem. 71 (1999)
1820.[16] H.A. Lousberg, H.F.M. Boelens, H.C.J. Hoefsloot, P.J.The authors would like to acknowledge Hans
Schoenmakers, A.K. Smilde, Polymer Anal. Character., inBoelens, Paul le Comte and Viet Nguyen from thepress.
University of Amsterdam for developing the data [17] Y. Van der Heyden, C. Hartmann, D.L. Massart, A.M.J.developing software and their assistance with the Hollands, P. Nuyten, P.J. Schoenmakers, J. Chromatogr. ASEC measurements. The work of R.S. is sponsored 756 (1996) 89.
by the Dutch Organization for Scientific Research


![Laurence W. McKeen, PhD - Pentasil Used in Medical Devices.pdf · of branched polymers include star polymers, comb polymers, brush polymers, dendronized polymers [1], ladders, and](https://static.fdocuments.us/doc/165x107/5fd30108783da00f76371237/laurence-w-mckeen-phd-pentasil-used-in-medical-devicespdf-of-branched-polymers.jpg)