Determination of the Manning Coefficient From Measured Bed ...
53
COEY Determination of the Manning Coefficient From Measured Bed Roughness in Natural Channels GEOLOGICAL SURVEY WATER-SUPPLY PAPER 1898-B Prepared in cooperation with the California Department of Water Resources
Transcript of Determination of the Manning Coefficient From Measured Bed ...
COEY
Determination of the
Manning Coefficient From
Measured Bed Roughness
in Natural Channels
GEOLOGICAL SURVEY WATER-SUPPLY PAPER 1898-B
Prepared in cooperation with the
California Department of
Water Resources
Determination of the
Manning Coefficient From
Measured Bed Roughness
in Natural Channels
By J. T. LIMERINOS
STUDIES OF FLOW IN ALLUVIAL CHANNELS
GEOLOGICAL SURVEY WATER-SUPPLY PAPER 1898-B
Prepared in cooperation with the
California Department of
Water Resources
UNITED STATES GOVERNMENT PRINTING OFFICE, WASHINGTON : 1970

UNITED STATES DEPARTMENT OF THE INTERIOR
WALTER J. HICKEL, Secretary
GEOLOGICAL SURVEY
William T. Pecora, Director
Library of Congress Catalog Card No. GS 77-608592
For sale by the Superintendent of Documents, U.S. Government Printing Office
Washington, D.C. 20402 Price 35 cents (paper cover)
CONTENTS
Page Symbols - . ____ ____._________._..._______.....__...IVAbstract.... _... __..._._....._..._.__..._____.__...__.________ BlIntroduction.. _.___._ _.......__.___.__.._..____......._________ 3
Purpose and scope. .. _..___...._..______.._. ___-__.._ 4Acknowledgments ..._._......_.,_._.____.___.._._______ 7
Previous investigations of channel resistance coefficients .__.._..._..__ 7 Investigations involving relative smoothness_.._...._......_._.____ 8Investigations involving velocity ratios-_ . ..._____.____ 11 Conclusions.._.._ _. .___.._._____........_.__ ._......_______ 12
Collection and assemblage of data.......__.__.___..._........__._.__.._ 13Determination of the Manning roughness coefficient- -___..._..._ 13 Determination of characteristic streambed-particle dimensions.___. 19 Determination of velocity ratios _.._._...__.____.__.._._..._._. 22
Relation of roughness parameter to relative smoothness- . ___- 22 Relative smoothness based on 84-percentile size of particles ._...__ 28 Relative smoothness based on 50-percentile size of particles ___.... 29Relative smoothness based on 16-percentile size of particles.__ _ 32 Relative smoothness based on weighted particle size ._.._._ 32 Discussion of results _.._._..___.._.._..__...._.._._..._..._..... 37
Relation of roughness parameter to velocity ratio _....._.__.__ 41Summary.._.._._._.___.____...__._.__..______....______ 42References cited. - _.....___........._.____.._.____... 46
ILLUSTRATIONS
PageFIGURE 1. Index map of California showing location of study reaches ..B14
2-3. Graphs showing size distribution of bed material 2. Site 1, Austin Creek near Cazadero ....._..._._____ 203. Site 4, Kaweah River at Three Rivers. _____ 21
4-7. Graphs showing relation of roughness parameter to relative smoothness based on
4. 84-percentile size of minimum diameter of streambedparticles._._..._.._ ___. _.__.._.______ 30
m

IV CONTENTS
Page
FIGURES 4-7. Graphs showing relation of roughness parameter to relative smoothness based on Continued
5. 84-percentile size of intermediate diameter ofstreambed particles .. _ -___......._._...B31
6. Weighted size of minimum diameter ofstreambed particles . _ _._._ ___..._ 38
7. Weighted size of intermediate diameter ofstreambed particles _.._ _ ._._..______ _.... 39
8-9. Graphs showing relation of roughness parameter to 8. Velocity ratio... _._ _ ._ ____.. 429. Logarithmic values of velocity ratio ____. 43
TABLES
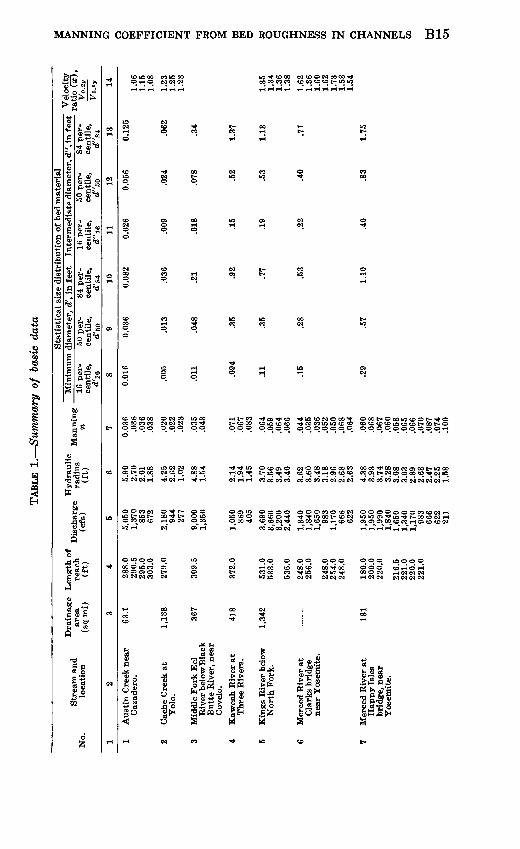
PageTABLE 1. Summary of basic data. ___ _ ___ _..._...B15
2-4. Results of relating roughness parameter to relative smoothness based on
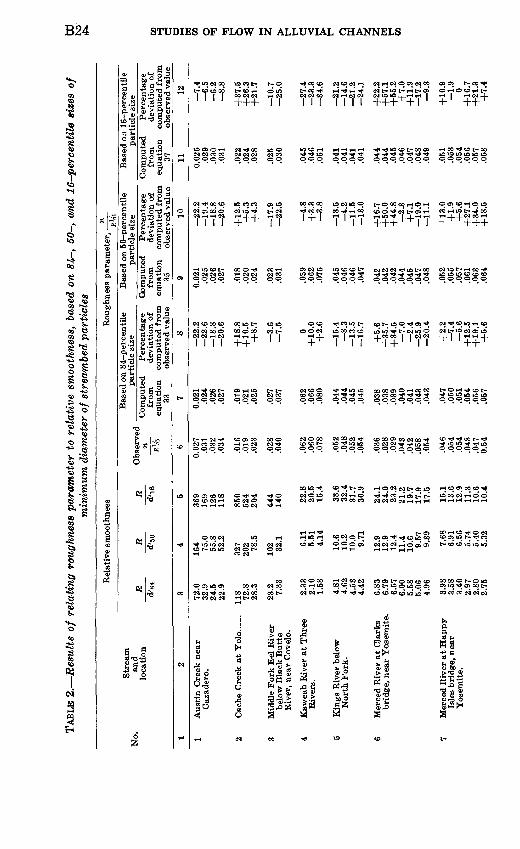
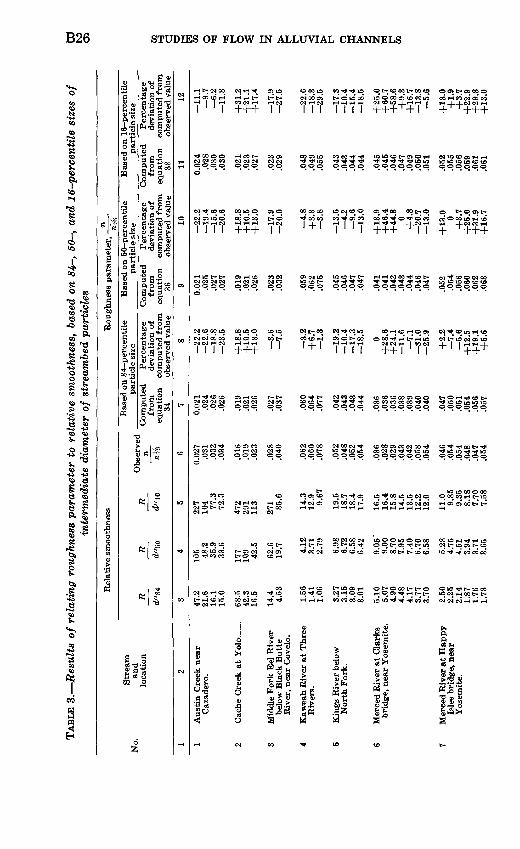
2. 84-, 50-, and 16-percentile sizes of minimum diameterof streambed particles _..._ _ 24
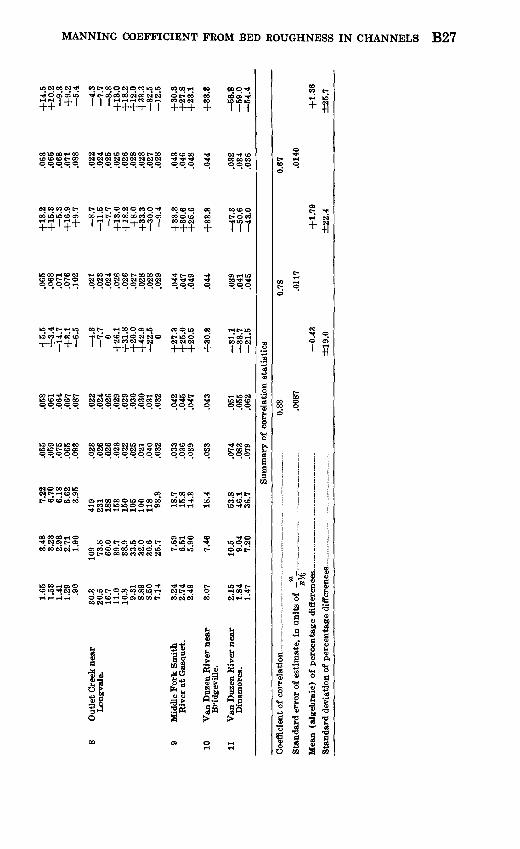
3. 84-, 50-, and 16-percentile sizes of intermediatediameter of streambed particles _ _.._._ 26
4. Weighted size of streambed particles ___... 345. Comparison of results of correlations using d84 and dw...._____._ 41
SYMBOLS
a and 6 Constants dependent on boundary roughness A Cross-sectional area of the channel Ai Area of the ith subsection of the measured cross section C Chezy coefficientd Characteristic size of a streambed particle d'16 Size of the minimum particle diameter that equals or exceeds
that of 16 percent of the streambed particles d'5Q Size of the minimum particle diameter that equals or exceeds
that of 50 percent of the streambed particles d'84 Size of the minimum particle diameter that equals or exceeds
that of 84 percent of the streambed particles d'w Weighted size of a minimum particle diameter computed as
O.ld'ie +0.8d'50+0.6d'84 d"16 Size of the intermediate particle diameter that equals or exceeds
that of 16 percent of the streambed particles
CONTENTS v
d"50 Size of the intermediate particle diameter that equals or exceedsthat of 50 percent of the streambed particles
d"84 Size of the intermediate particle diameter that equals or exceedsthat of 84 percent of the streambed particles
d"w Weighted size of an intermediate particle diameter computed asO.ld"16 +0.3d"50+0.6d"84
E A coefficient (1.0 or 0.5) representing the proportion of velocityhead recovered
/ Darcy-Weisbach resistance factor F Fall, in feet, in water surface between the most upstream and
downstream cross sections of a reachg Acceleration due to gravity, 32.16 feet per second per second k Effective roughness height (diameter of uniform sand grains
used in the Nikuradse experiments) k' Height of discrete roughness elements L Length of reach between cross sections
log Common logarithm to base 10 In Natural logarithm to base 2.718 .... m Number of particles within an arbitrary range of size m' A roughness factor such that 0.109 < m' < 3.17 n Manning roughness coefficient P Wetted perimeter of a cross sectionP6 Percent of bed material within an arbitrary range of size Q Total discharge at a cross section
AR Hydraulic radius,
S Energy slope
V Mean velocity, f- A
Vf Friction velocity, VVi Velocity in ith subsection of the measured cross sectionv Velocity at a point in the verticalw Top width of channelx Ratio of velocity at 0.2y to O.Sy, where distances, y, are measured
from water surface x Area-weighted ratio of velocities,
__
y Depth of flow
ym Mean depth, w
y0 Constant of integration, similar to y'y' Thickness of the boundary layer within which the velocity is con
sidered to be zero y" Vertical distance measured from the channel bottom to a point in
the vertical
STUDIES OF FLOW IN ALLUVIAL CHANNELS
DETERMINATION OF THEMANNING COEFFICIENT FROM
MEASURED BED ROUGHNESSIN NATURAL CHANNELS
By J. T. LIMERINOS
ABSTRACT
This report presents the results of a study to test the hypothesis that basic values of the Manning roughness coefficient of stream channels may be related to (1) some characteristic size of the streambed particles and to (2) the distri bution of particle size. These two elements involving particle size 'can be combined into a single element by weighting characteristic particle sizes. The investigation was confined to channels with coarse bed material to avoid the complication of bed-form roughness that is associated with alluvial channels composed of fine bed material.
Fifty current-meter measurements of discharge and appropriate field sur veys were made at 11 sites on California streams for the purpose of comput ing the roughness coefficient, n, by the Manning formula. The test sites were selected to give a wide range in average size of bed material, and the dis charge measurements and surveys were made at such times as to provide data covering a suitable range in stream depth. The sites selected were relatively free of the extraneous flow-retarding effects associated with irregular channel conformation and streambank vegetation.
The characteristic bed-particle sizes used in the analyses were the 16,- 50- and 84-percentile sizes as obtained from a cumulative frequency distribution of the diameters of randomly sampled surficial bed material. Separate dis tributions were computed for the minimum and intermediate values of the three diameters of a particle. The minimum diameters of the streambed particles were used in the study because a particle at rest on the bed invariably has its minimum diameter in the vertical position; this diameter is, therefore, the most representative measure of roughness height. The intermediate diame ter was also studied because this is the diameter most easily measurable either by sieve analysis or by photographic techniques and because it is the diameter that had been used in previous studies by other investigators. No significant difference in reliability was found between the results obtained using minimum diameters and those obtained using intermediate diameters.
Bl
B2 STUDIES OF FLOW IN ALLUVIAL CHANNELS
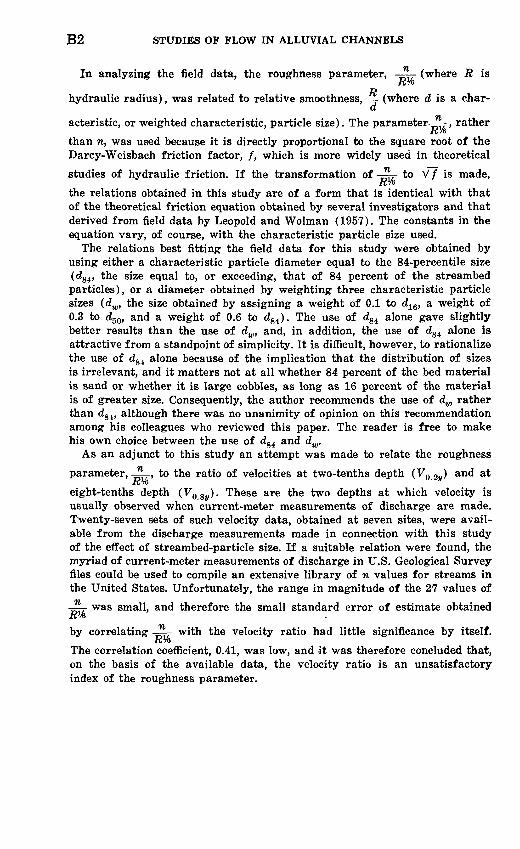
In analyzing the field data, the roughness parameter, -£ (where R is/C/o
Rhydraulic radius), was related to relative smoothness, (where d is a char-a
acteristic, or weighted characteristic, particle size). The parameter-^-, rather/CTO
than n, was used because it is directly proportional to the square root of the Darcy-Weisbach friction factor, /, which is more widely used in theoretical
studies of hydraulic friction. If the transformation of -^7- to V / is made,/f the relations obtained in this study are of a form that is identical with that of the theoretical friction equation obtained by several investigators and that derived from field data by Leopold and Wolman (1957). The constants in the equation vary, of course, with the characteristic particle size used.
The relations best fitting the field data for this study were obtained by using either a characteristic particle diameter equal to the 84-percentile size (dg4, the size equal to, or exceeding, that of 84 percent of the streambed particles), or a diameter obtained by weighting three characteristic particle sizes (dw, the size obtained by assigning a weight of 0.1 to d16, a weight of 0.3 to dgo, and a weight of 0.6 to d84 ). The use of d84 alone gave slightly better results than the use of dw, and, in addition, the use of d84 alone is attractive from a standpoint of simplicity. It is difficult, however, to rationalize the use of d84 alone because of the implication that the distribution of sizes is irrelevant, and it matters not at all whether 84 percent of the bed material is sand or whether it is large cobbles, as long as 16 percent of the material is of greater size. Consequently, the author recommends the use of dw rather than <J84 , although there was no unanimity of opinion on this recommendation among his colleagues who reviewed this paper. The reader is free to make his own choice between the use of d84 and dw.
As an adjunct to this study an attempt was made to relate the roughness
parameter,-^-, to the ratio of velocities at two-tenths depth (V02y) and at/C7o
eight-tenths depth (VOSv ). These are the two depths at which velocity is usually observed when current-meter measurements of discharge are made. Twenty-seven sets of such velocity data, obtained at seven sites, were avail able from the discharge measurements made in connection with this study of the effect of streambed-particle size. If a suitable relation were found, the myriad of current-meter measurements of discharge in U.S. Geological Survey files could be used to compile an extensive library of n values for streams in the United States. Unfortunately, the range in magnitude of the 27 values of
-^7- was small, and therefore the small standard error of estimate obtained/£%
by correlating -^7- with the velocity ratio had little significance by itself.#%
The correlation coefficient, 0.41, was low, and it was therefore concluded that, on the basis of the available data, the velocity ratio is an unsatisfactory index of the roughness parameter.
MANNING COEFFICIENT FROM BED ROUGHNESS IN CHANNELS B3
INTRODUCTION
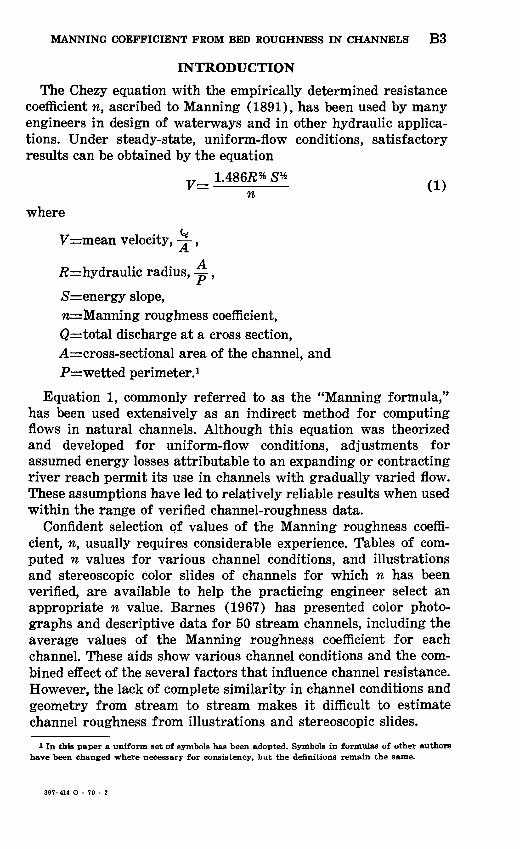
The Chezy equation with the empirically determined resistance coefficient n, ascribed to Manning (1891), has been used by many engineers in design of waterways and in other hydraulic applica tions. Under steady-state, uniform-flow conditions, satisfactory results can be obtained by the equation
S*n
wheret* V=mean velocity, -- ,
radius, -^ ,
S=energy slope,w=Manning roughness coefficient,Q= total discharge at a cross section,A cross-sectional area of the channel, andP=wetted perimeter.1
Equation 1, commonly referred to as the "Manning formula," has been used extensively as an indirect method for computing flows in natural channels. Although this equation was theorized and developed for uniform-flow conditions, adjustments for assumed energy losses attributable to an expanding or contracting river reach permit its use in channels with gradually varied flow. These assumptions have led to relatively reliable results when used within the range of verified channel-roughness data.
Confident selection of values of the Manning roughness coeffi cient, n, usually requires considerable experience. Tables of com puted n values for various channel conditions, and illustrations and stereoscopic color slides of channels for which n has been verified, are available to help the practicing engineer select an appropriate n value. Barnes (1967) has presented color photo graphs and descriptive data for 50 stream channels, including the average values of the Manning roughness coefficient for each channel. These aids show various channel conditions and the com bined effect of the several factors that influence channel resistance. However, the lack of complete similarity in channel conditions and geometry from stream to stream makes it difficult to estimate channel roughness from illustrations and stereoscopic slides.
1 In this paper a uniform set of symbols has been adopted. Symbols in formulas of other authors have been changed where necessary for consistency, but the definitions remain the same.
397-414 O - 70 - 2
B4 STUDIES OF FLOW IN ALLUVIAL CHANNELS
In streams with relatively stable boundaries, the total resistance to flow or retardation of velocity results from the interaction of many elements. Among them are particle size of streambed ma terial, bank irregularity, vegetation, channel alinement, bed con- fiiguration, channel obstructions, converging or diverging stream lines, sediment load, and surface waves. With our present knowl edge the quantitative effect of most of these factors is not determi- nable and must be estimated subjectively.
In many channels streambed particle size exerts a major in fluence on the flow. Fortunately, the quantitative effect of this factor can be determined more accurately than most of the other parameters involved in resistance to flow. Engineering knowledge and confidence would be increased if an objective relation between Manning's n and streambed-particle size could be shown. An ob jectively obtained basic value of n that is, the value of n for a straight uniform channel in the materials involved could then be adjusted for any of the other flow-retarding effects mentioned in the preceding paragraph, in the manner described by Chow (1959, p. 101-123). Some of the numerous theoretical studies and labora tory and field experiments made in attempts to solve the problem of determining basic values of flow resistance are noted in the next section of this report.
The investigation here described was conducted to provide an improved method for estimating the Manning roughness coefficient used in indirect measurement of high-water discharges at gaging stations operated by the U.S. Geological Survey. Rating curves showing the stage-discharge relation at those stations are norm ally defined by velocity-meter measurements of low- and medium- stage flows. Similar measurement of the maximum or peak dis charge is often not possible because of impassable roads, destroyed measuring structures, or excessive flood drift. Extension of the rating curves to include flood flows are therefore commonly made on the basis of some type of indirect measurement of maximum discharge such as the slope-area method, and in those methods evaluation of the Manning roughness coefficient is a critical factor.
PURPOSE AND SCOPE
The primary purpose of this study was to define the relation between basic values of the Manning roughness coefficient, n, and an index of streambed-particle size and size distribution. The index used for particle size was a characteristic particle size obtained from a cumulative frequency distribution of the diameters of ran domly sampled surficial bed material that is, the size correspond ing to a selected percentile of the frequency distribution. By

MANNING COEFFICIENT FROM BED ROUGHNESS IN CHANNELS B5
weighting selected characteristic particle sizes, a single index was obtained that combined both size and size distribution. The re tarding effect of a particle of given size is relative; it will have greater retarding effect on shallow flow than on deep flow. There fore, instead of directly using the particle-size index, d, it was
R combined with the hydraulic radius, R, in the term,-,-, to provideM
an index of relative smoothness. The parameter -=^-, rather thann, was used in this study because it is directly proportional to the square root of the Darcy-Weisbach friction factor, /, which is more widely used in theoretical studies of hydraulic friction. Thus,
n R the relation sought was one between -==7- and -3-. This course ofK aaction was consistent with that taken by the more recent investi gators of friction in open channels.
A lack of agreement exists in the results previously obtained in laboratory and field studies of open-channel friction. The theo retical and laboratory studies have been helpful to the investigator in the field because they define the types of equations to be ex pected in the relation of the roughness coefficient to hydraulic radius and bed-particle size. The constants in the laboratory- derived relations cannot be corroborated in the field because they are predicated on the condition of a channel uniformly covered by roughness particles of uniform height, a condition that is never found in natural channels. The field studies themselves do not give results that are entirely consistent, and it is probable that the inconsistencies are due primarily to the inadequacy or incom pleteness of the data used. Where data in sufficient volume were available for analysis, they usually consisted of information not specifically collected for the purpose of the study and were incom plete ; where complete data were available, they were often too few for the purpose. This study should be free of those shortcomings.
Fifty current-meter measurements of discharge and appropri ate field surveys were made at 11 sites on California streams for the purpose of computing the roughness coefficient, n, by the Manning formula. The investigation was confined to channels with coarse bed material to avoid the complication of bed-form roughness that is associated with alluvial channels composed of fine bed material. The test sites were selected to give a wide range in average size of bed material, and the discharges and surveys were made at such times as to provide data covering a suitable range in stream depth.
All discharges tested were in the tranquil range, their Froude
B6 STUDIES OF FLOW IN ALLUVIAL CHANNELS
numbers being less than unity. The sites were selected to be as free as possible of flow-retarding effects that are not associated with particle size.
Separate analyses involving characteristic particle size were made for the minimum and intermediate values of the three diam eters of a particle. The minimum diameter of the streambed par ticles was used in the study because a particle at rest on the bed invariably has its minimum diameter in the vertical position; that diameter is, therefore the most representative measure of rough ness height. The intermediate diameter of the streambed particles was studied because that is the diameter most easily measurable either by sieve analysis or by photographic techniques and is the diameter that had been used in previous studies by other investi gators.
The spacing and spacing pattern of streambed particles are also important elements in the retardation of flow by bed particles. However, it is extremely difficult, if not impossible, to obtain a quantitative index for those elements in a natural channel, and they, consequently, were not considered in this study. Because they were eliminated from consideration, despite their importance, there was little point in considering other factors of probably lesser importance, such as Froude number; width-depth ratio; sediment transport; and statistics, other than characteristic sizes, of the distribution of particle size. It was, therefore impossible to isolate completely the effect of particle size and size distribution on flow retardation, and, consequently, deviations from the relation of
=r- to -= are to be expected. It is not likely that the determina-K dwtion of n values for natural channels will ever be an exact science.
Bed roughness is known to affect the vertical-velocity distribu tion (distribution of horizontal velocities in a vertical plane). When current-meter measurements of discharge are made, veloci ties are usually observed at two-tenths depth (Vo. 2v ) and at eight- tenths depth (Fo.sy), and those velocities may be considered to be characteristic, or index, values of the vertical-velocity distribution. Twenty-seven sets of such velocity data obtained at seven sites were available from discharge measurements made in connection with the study of the effect of streambed particle size. As an ad junct to this study, those data were used in an attempt to relate
the roughness parameter, -~r to the ratio, T7°' 2y-. The values ofw* yo.sv VQ.ZV and FO.SJ/ for each discharge measurement were weighted withrespect to subsection area in the measured cross section to provide

MANNING COEFFICIENT FROM BED ROUGHNESS IN CHANNELS B7
a single velocity ratio for each discharge measurement. If a suit able relation were found, the myriad of current-meter measure ments of discharge in U.S. Geological Survey files could be used to compile an extensive library of n values for streams in the United States.
ACKNOWLEDGMENTSThis study was authorized by a cooperative agreement between
the U.S. Geological Survey and the State of California, Depart ment of Water Resources. This report was prepared by the Geologi cal Survey under the general supervision of Walter Hofmann and R. S. Lord, successive district chiefs of the Water Resources Division, California District, and under the immediate supervision of L. E. Young, chief of the Menlo Park subdistrict office.
Technical guidance was given by S. E. Rantz, research hydrolo- gist, who offered valuable suggestions and criticism during the study. Lucile Coleman assisted in the computation and prepara tion of the data.
PREVIOUS INVESTIGATIONS OF CHANNEL RESISTANCECOEFFICIENTS
A review of the literature on flow-resistance investigations in open channels has made it apparent that little agreement exists on a practical method of objectively evaluating the roughness coeffi cient. However, Carter and others (1963) have prepared a report on friction factors in open channels. Their comprehensive report summarizes the numerous investigations made of this subject.
The findings or results from several well-known studies of the relation of the roughness coefficient to the size of streambed particles or to the velocity distribution are included in this report because they provide valuable background for the study.
Investigation of fixed-bed, open-channel resistance reportedly begins with the unpublished work of Antoine Chezy. According to Herschel (1897), Chezy inferred that channel resistance varied directly with the wetted perimeter and the square of the velocity, and inversely with the cross-sectional area and the hydraulic slope. Thus,
V2Presistance cc r-, (2)
or, as expressed in the Chezy equation,
V=C V&S (3)
whereC=a resistance coefficient (Chezy coefficient).
B8 STUDIES OF FLOW IN ALLUVIAL CHANNELS
Experiments by Darcy (1854) and Bazin (1865) on arti ficially roughened surfaces showed that
C'= . (metric units) (4)
whereC"=a resistance coefficient, anda and ^constants dependent on boundary roughness.
Additional experiments by Bazin (1897) resulted in a similar relation for English units of measure,
C'= 157' 6 , (English units) (5)1+-?=
V# where m'=a roughness factor, such that 0.109 <ra'<3.17.
Manning experimentally determined that the Chezy coefficient varied as the sixth root of the hydraulic radius, and in metric units,
7?% C= . (6)
nAccording to Rouse and Ince (1957), Hagen in 1821 and
Gauckler in 1868 had made similar determinations of the Chezy coefficient.
Substitution of the value for C from equation 6 into the Chezy equation 3 results in the widely used equation, ascribed to Manning, which in English units is
,, 1.486/2*5* ,-vV "=. . MIn v
Consequently, the equation for discharge is
nStrickler (1923) derived the following equation for n for stream-
beds composed of cobbles and small boulders,nr=0.039<25o% (8)
where d50=median size of streambed particles, referred to the intermediate diameter.
INVESTIGATIONS INVOLVING RELATIVE SMOOTHNESSAn equation describing the vertical distribution of velocities in
turbulent flow was derived by Prandtl (1926), and verified by Von Karman (1930). This equation, known as the Prandtl-Von Karman universal velocity-distribution law, is
v=2.5Vf ln, (9)
MANNING COEFFICIENT FROM BED ROUGHNESS IN CHANNELS B9
wherevr^velocity at a point in the vertical,Vf= friction velocity, V ffRS, (10) ln=natural logarithm to base 2.718 . . .,y"= vertical distance measured from channel bottom to a point
in the vertical,k 2/0=constant of integration, -^r ,
ol)
^acceleration due to gravity, 32.16 feet per second per sec ond, and
fc=roughness height.Equation 9 indicates that turbulent-flow velocity varies logarithm ically in the vertical with the ratio of distance from the channel bottom to roughness height. The roughness height, k, is the effec tive height of the roughness elements. Linear dimensions of rough ness elements may vary and yet produce the same effective rough ness because of difference in shape and position or orientation. Vanoni (1941) observed a close relation between observed and theoretical velocity distributions.
The Keulegan (1938) equation,
F=V> (6.25+5.75 log |), (11)
was derived from equation 9 and the Nikuradse (1933) experi ments which used pipes on whose inner surface sand grains had been cemented. Note that common logarithms to base 10 are used in equation 11, whereas natural logarithms to base 2.718 are used in equation 9.
By combining equations 3, 10 and 11, the Chezy C can be ex pressed as a function of the hydraulic radius and effective rough ness height, k. The resulting equation is
^-. (12)
The term "relative smoothness" has been applied to the ratioR k-j- ; the inverse ratio, -~- , is known as relative roughness.
Expressed in English units, the relation between the Chezy C and the Manning n is given by the equation
n Chow (1959) combined equations 12 and 13 to obtain the following
TO comparable relation between a roughness parameter, -^7 , and
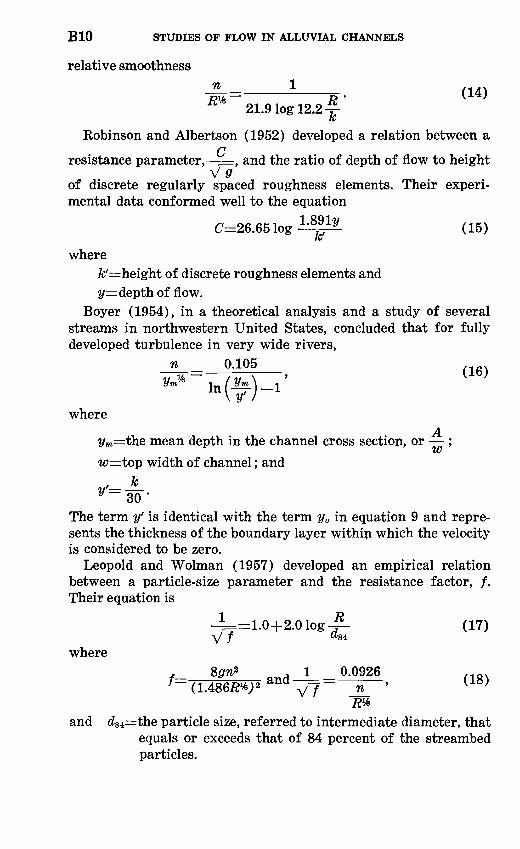
BIO STUDIES OF FLOW IN ALLUVIAL CHANNELS
relative smoothnessn * flA\
-DiT = D- ( 14 >
21.9 log 12.2^
Robinson and Albertson (1952) developed a relation between a
resistance parameter, -7=, and the ratio of depth of flow to height
of discrete regularly spaced roughness elements. Their experi mental data conformed well to the equation
C=26.651og (15)
where&'=height of discrete roughness elements and 2/=depth of flow.
Boyer (1954), in a theoretical analysis and a study of several streams in northwestern United States, concluded that for fully developed turbulence in very wide rivers,
n 0.105
where
ym=the mean depth in the channel cross section, or ;
w=top width of channel; and
,_A
The term y' is identical with the term y0 in equation 9 and repre sents the thickness of the boundary layer within which the velocity is considered to be zero.
Leopold and Wolman (1957) developed an empirical relation between a particle-size parameter and the resistance factor, /. Their equation is
4==1.0+2.0 log -A. (17)V/ a^
where,__ Sgn* _,, 1 _ 0.0926
and d84=ihe particle size, referred to intermediate diameter, that equals or exceeds that of 84 percent of the streambed particles.
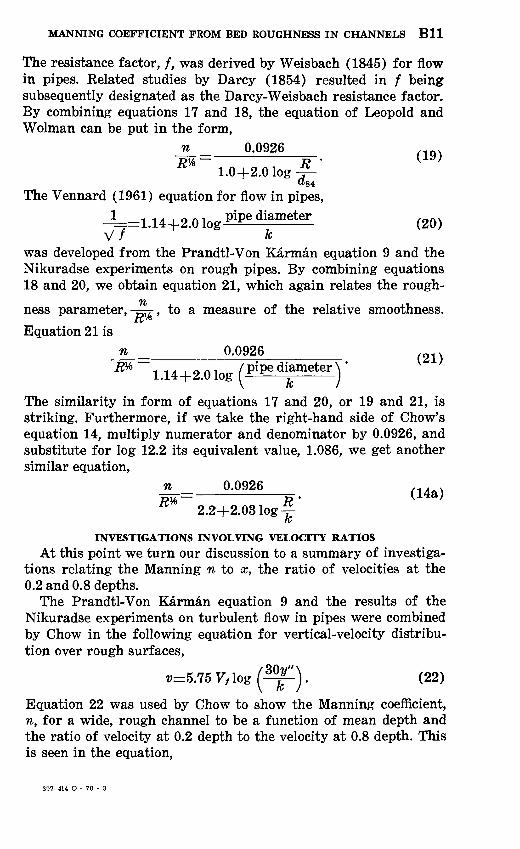
MANNING COEFFICIENT FROM BED ROUGHNESS IN CHANNELS Bll
The resistance factor, /, was derived by Weisbach (1845) for flow in pipes. Related studies by Darcy (1854) resulted in / being subsequently designated as the Darcy-Weisbach resistance factor. By combining equations 17 and 18, the equation of Leopold and Wolman can be put in the form,
n ____0.0926 , 1Q . pu. S~- \*-9)
R* 1.0+2.0 log A<*84
The Vennard (1961) equation for flow in pipes,4=1.14+2.0 log pipediameter (20) V/ k
was developed from the Prandtl-Von Karman equation 9 and the Nikuradse experiments on rough pipes. By combining equations 18 and 20, we obtain equation 21, which again relates the rough-
/yi
ness parameter,- ^, to a measure of the relative smoothness.
Equation 21 isn 0.0926
1.14+2.0log diameter (21)
The similarity in form of equations 17 and 20, or 19 and 21, is striking. Furthermore, if we take the right-hand side of Chow's equation 14, multiply numerator and denominator by 0.0926, and substitute for log 12.2 its equivalent value, 1.086, we get another similar equation,
n 0.0926
2.2+2.03 log ̂ -(14a)
INVESTIGATIONS INVOLVING VELOCITY RATIOS
At this point we turn our discussion to a summary of investiga tions relating the Manning n to x, the ratio of velocities at the 0.2 and 0.8 depths.
The Prandtl-Von Karman equation 9 and the results of the Nikuradse experiments on turbulent flow in pipes were combined by Chow in the following equation for vertical-velocity distribu tion over rough surfaces,
0=5.757, log . (22)
Equation 22 was used by Chow to show the Manning coefficient, n, for a wide, rough channel to be a function of mean depth and the ratio of velocity at 0.2 depth to the velocity at 0.8 depth. This is seen in the equation,
397-414 O - 70 - 3
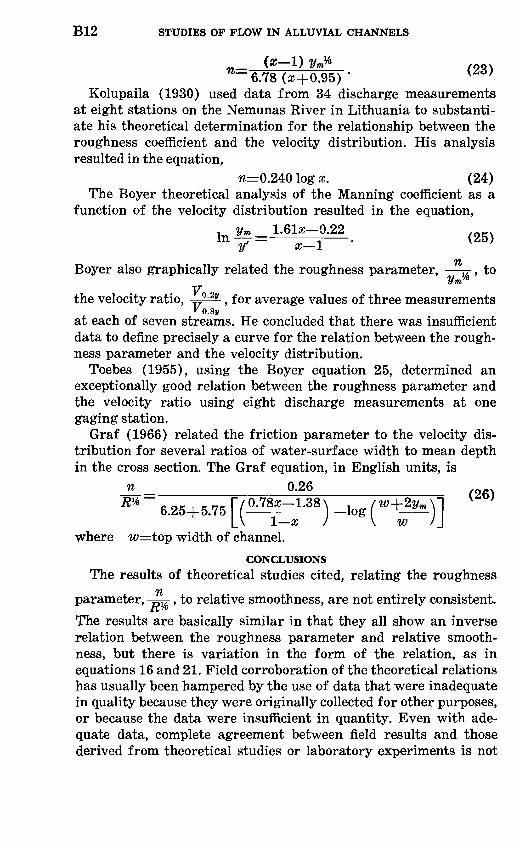
B12 STUDIES OF FLOW IN ALLUVIAL CHANNELS
~ 6.78 (z+0.95) * Kolupaila (1930) used data from 34 discharge measurements
at eight stations on the Nemunas River in Lithuania to substanti ate his theoretical determination for the relationship between the roughness coefficient and the velocity distribution. His analysis resulted in the equation,
%=0.240 log x. (24)The Boyer theoretical analysis of the Manning coefficient as a
function of the velocity distribution resulted in the equation,
« Boyer also graphically related the roughness parameter, 77- , to
2/ffi the velocity ratio, T °- 2y , for average values of three measurements
"o.8j/at each of seven streams. He concluded that there was insufficient data to define precisely a curve for the relation between the rough ness parameter and the velocity distribution.
Toebes (1955), using the Boyer equation 25, determined an exceptionally good relation between the roughness parameter and the velocity ratio using eight discharge measurements at one gaging station.
Graf (1966) related the friction parameter to the velocity dis tribution for several ratios of water-surface width to mean depth in the cross section. The Graf equation, in English units, is
n 0-26 ( .<6.25+5.75 |VO-rc*-l-88) _log /
[_\ l x ) \ w where w=top width of channel.
CONCLUSIONS
The results of theoretical studies cited, relating the roughnessti/ parameter, - r , to relative smoothness, are not entirely consistent.it
The results are basically similar in that they all show an inverse relation between the roughness parameter and relative smooth ness, but there is variation in the form of the relation, as in equations 16 and 21. Field corroboration of the theoretical relations has usually been hampered by the use of data that were inadequate in quality because they were originally collected for other purposes, or because the data were insufficient in quantity. Even with ade quate data, complete agreement between field results and those derived from theoretical studies or laboratory experiments is not

MANNING COEFFICIENT FROM BED ROUGHNESS IN CHANNELS B13
to be expected. Two reasons for this are: (1) The theoretical and laboratory-derived relations are predicated on the condition of uniform size and distribution of channel roughness elements a condition that never exists in natural channels, and (2) complete freedom from the many velocity-retarding influences other than the size distribution of streambed particles cannot be achieved in natural streams. The agreement in the form of relation derived from field data by Leopold and Wolman (eq 19) and the theoretical equations presented by Vennard for flow in pipes (eq 21) and by Chow (eq 14a) is, therefore, noteworthy. It might be mentioned at. this point that relations of similar form evolved from the study being reported here.
Little agreement is found among the results of previous investi gations relating the Manning n, or some function of n, to the ratios of velocities at the 0.2 and 0.8 depths.
COLLECTION AND ASSEMBLAGE OF DATA
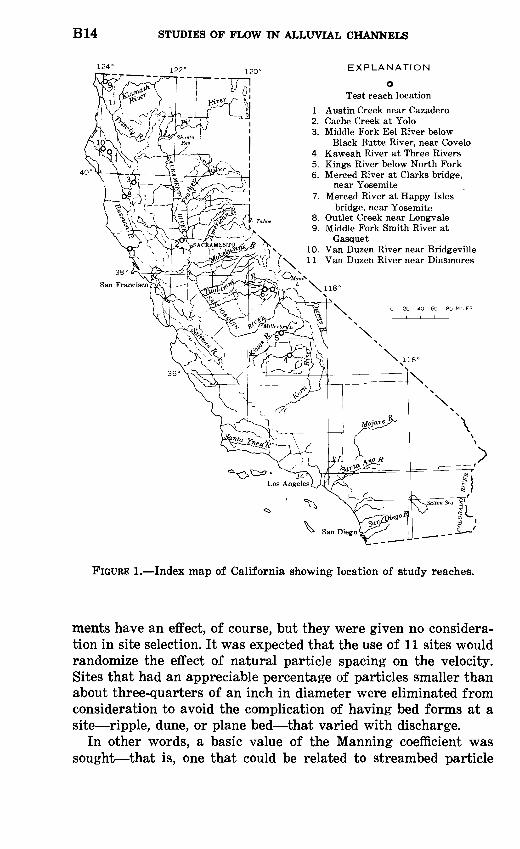
The 11 study reaches used in this investigation were located near U.S. Geological Survey stream-gaging stations because facili ties for measuring discharge by current meter were available at the stations. The test sites, shown in figure 1, are given with identifying number and drainage area in table 1. Seven sites are on streams in north coastal California, and the other four sites are on streams draining the west slopes of the Sierra Nevada.
Fifty current-meter measurements of discharge and appropriate field surveys were made for the purpose of computing the rough ness coefficient, n, by the Manning formula. The test sites were selected to give a wide range in average size of bed material, and the discharge measurements and surveys were made at such times as to provide data covering a suitable range in stream depth. The maximum discharge used at the various sites was that equivalent to a flood of about 1-year recurrence interval, but the ratios of depth to vertical height of streambed particles of median size reached values as high as 300. Because values of Manning's n not
iyt
to be confused with the roughness parameter, -^r show littleXV
change with ratios greater than 30, the stream depths used in this study cover an adequate range.
DETERMINATION OF THE MANNING ROUGHNESS COEFFICIENT
The most important criteria in selecting a site for study was that it be relatively free from velocity-retarding influences other than those associated with the size and size distribution of stream- bed particles. The spacing and spacing pattern of roughness ele-
B14 STUDIES OF FLOW IN ALLUVIAL CHANNELS
EXPLANATION
Test reach location
1 . Austin Creek near Cazadero2. Cache Creek at Yolo3. Middle Fork Eel River below
Black Butte River, near Covelo4. Kaweah River at Three Rivers5. Kings River below North Fork6. Merced River at Clarks bridge,
near Yosemite7. Merced River at Happy Isles
bridge, near Yosemite8. Outlet Creek near Longvale9. Middle Fork Smith River at
Gasquet10. Van Duzen River near Bridgeville11. Van Duzen River near Dinsmores
FIGURE 1. Index map of California showing location of study reaches.
ments have an effect, of course, but they were given no considera tion in site selection. It was expected that the use of 11 sites would randomize the effect of natural particle spacing on the velocity. Sites that had an appreciable percentage of particles smaller than about three-quarters of an inch in diameter were eliminated from consideration to avoid the complication of having bed forms at a site ripple, dune, or plane bed that varied with discharge.
In other words, a basic value of the Manning coefficient was sought that is, one that could be related to streambed particle
TABL
E 1.
Sum
mar
y of
bas
ic d
ata
No. 1 1 2 3 4 5 6 7
Str
eam
an
d
loca
tion
2
Au
stin
Cre
ek n
ear
Caz
ader
o.
Cac
he C
reek
at
Yol
o.
Mid
dle
Fo
rk E
elR
iver
bel
ow B
lack
Butt
e R
iver
, nea
rC
ovel
o.
Kaw
eah
Riv
er a
tT
hre
e R
iver
s.
Kin
gs R
iver
bel
owN
ort
h F
ork
.
Mer
ced
Riv
er a
tC
lark
s br
idge
nea
r Y
osem
ite.
Mer
ced
Riv
er a
tH
app
y I
sles
brid
ge, n
ear
Yos
emit
e.
Dra
inag
e ar
ea
(sq
mi)
3
63.1
1,13
8
367
418
1,34
2
181
Len
gth
of
reac
h
(ft) 4
288.
029
0.5
295.
030
3.0
279.
0
309.
5
372.
0
531.
053
3.0
536.
0
248.
025
6.0
248.
025
4.0
248.
0
180.
020
0.0
220.
0
216.
522
1.0
220.
022
1.0
Dis
char
ge
(cfs
) 5
5,05
01,
370
853
672
2,18
094
427
7
9,00
01,
350
1,05
086
940
5
3,69
03,
660
3,20
02,
440
1,34
01,
840
1,65
098
31,
170
666
622
1,95
01,
950
1,99
01,
840
1,65
01,
340
1,17
098
366
662
221
1
Hydra
uli
c ra
diu
s (f
t) 6
5.90
2.70
2.01
1.88
4.25
2.62
1.02
4.88
1.54
2.14
1.94
1.45
3.70
3.56
3.49
3.40
3.62
3.60
3.48
3.18
2.96
2.68
2.63
4.38
3.93
3.74
3.28
3.08
3.03
2.89
2.68
2.47
2.25
1.58
Man
nin
g
- n 7
0.03
6.0
36.0
36.0
38
.020
.022
.023
.035
.043
.071
.067
.083
.064
.059
.064
.066
.044
.035
.036
.052
.050
.068
.064
.060
.068
.067
.060
.058
.065
.066
.070
.087
.074
.100
Sta
tist
ical
siz
e dis
trib
uti
on o
f be
d m
ater
ial
Min
imum
dia
met
er,
d',
in f
eet
Inte
rmed
iate
dia
met
er, d
", in f
eet
Vel
oci
ty16
per
- 50
per
- 84
per
- 16
per
- 50
per
- 84
per
- y
0
* ce
ntil
e,
cent
ile,
ce
ntil
e,
cent
ile,
ce
ntil
e,
centi
le,
v
89
10
11
12
13
14
0.01
6 0.
036
0.08
2 0.
026
0.05
6 0.
125
1.06
1.15
1.08
.005
.0
13
.036
.0
09
.024
.0
62
1.23
1.25
1.23
.011
.0
48
.21
.018
.0
78
.34
.094
.3
5 .9
2 .1
5 .5
2 1.
37
.11
.35
.77
.19
.53
1.13
1.
351.
341.
361.
38
.15
.28
.53
.22
.40
.71
1.62
1.36
1.60
1.62
1.73
1.58
1.54
.29
.57
1.10
.4
0 .8
3 1.
75
w l-i
Ol

TABL
E 1.
Sum
mar
y of
bas
ic d
ata
Con
tinue
d
Sta
tist
ical
siz
e d
istr
ibu
tio
n o
f be
d m
ater
ial
No. 1 8 9 10 11
0.
, D
rain
age
Str
eam
an
d
area
lo
cati
on
(sqm
i)
2 3
Outl
et C
reek
nea
r 16
1L
ongv
ale.
Mid
dle
Fork
Sm
ith
130
Riv
er a
tG
asqu
et.
Van
Duz
en R
iver
21
6n
ear
Bri
dgev
ille
.
Van
Duz
en R
iver
85
.1nea
r D
insm
ores
.
Len
gth
of
reac
h
(ft) 4
243.
524
2.0
137.
524
2.0
250.
024
1.0
243.
023
9.5
241.
0
253.
025
4.0
256.
0
304.
0
313.
0
313.
5
Dis
char
ge
(cfs
) 5
15,2
004,
420
5,64
01,
200
1,21
01,
610
1,13
054
234
8
3,00
01,
950
1,57
0
1,84
0
5,31
03,
570
2,51
0
Hy
dra
uli
c ra
diu
s (f
t) 6
10.9 7.38
6.00
3.97
3.89
3.35
3.20
3.06
2.57
3.92
3.32
3.01
2.76
5.27
4.52
3.60
Man
nin
gTC 7 .0
33.0
36.0
35.0
29.0
28.0
28.0
25.0
36.0
38
.042
.044
.047
.039
.088
.107
.098
Min
imum
dia
met
er,
d',
in f
eet
16 p
er-
cent
ile,
8
1 0.0
152.
019
.13
.088
.066
50 p
er-
84 p
er-
cent
ile,
ce
ntil
e,d'
oo
d's
i9
10
10.0
54
10.1
92.
063
2.21
.32
.76
.22
.51
.31
1.50
Inte
rmed
iate
dia
met
er, d
", in
fee
t16
per
- ce
ntil
e,
11
10.0
262.
032
.21
.15
.098
50 p
er-
84 p
er-
cent
ile,
ce
ntil
e,
12
13
iQ.1
0 iQ
.36
2.10
2.
36
.51
1.21
.37
.90
.50
2.45
Vel
ocit
y ra
tio
(*),
Vo.Z
y
Vo.
»v 14 1.27
1.34
1.38
1.27
1.28
1.34
1.60
1.66
1.50
1.23
w l-l
o>
1 Par
ticl
e-si
ze d
istr
ibu
tio
n a
ppli
es t
o d
isch
arge
mea
sure
men
ts m
ade
befo
re D
ec.
22,1
964.
2 P
arti
cle-
size
dis
trib
uti
on
appli
es t
o d
isch
arge
mea
sure
men
ts m
ade
afte
r D
ec. 2
2,19
64.
MANNING COEFFICIENT FROM BED ROUGHNESS IN CHANNELS B17
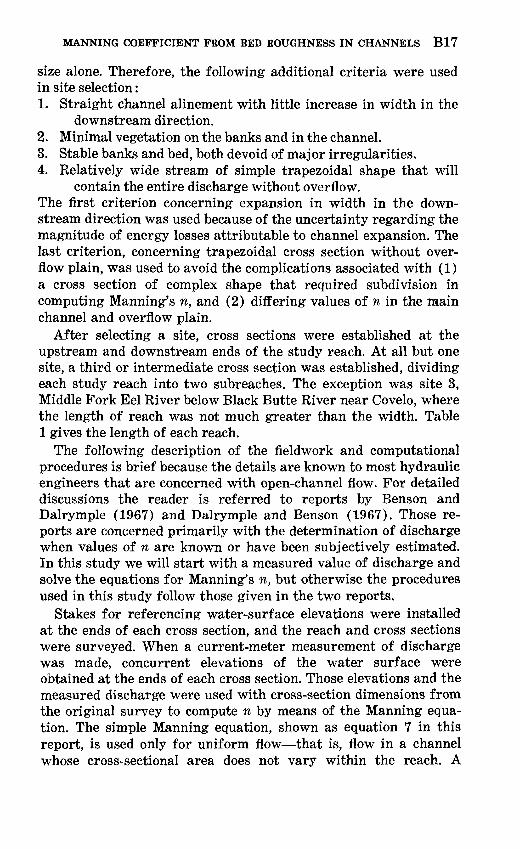
size alone. Therefore, the following additional criteria were used in site selection:1. Straight channel alinement with little increase in width in the
downstream direction.2. Minimal vegetation on the banks and in the channel.3. Stable banks and bed, both devoid of major irregularities.4. Relatively wide stream of simple trapezoidal shape that will
contain the entire discharge without overflow. The first criterion concerning expansion in width in the down stream direction was used because of the uncertainty regarding the magnitude of energy losses attributable to channel expansion. The last criterion, concerning trapezoidal cross section without over flow plain, was used to avoid the complications associated with (1) a cross section of complex shape that required subdivision in computing Manning's n, and (2) differing values of n in the main channel and overflow plain.
After selecting a site, cross sections were established at the upstream and downstream ends of the study reach. At all but one site, a third or intermediate cross section was established, dividing each study reach into two subreaches. The exception was site 3, Middle Fork Eel River below Black Butte River near Covelo, where the length of reach was not much greater than the width. Table 1 gives the length of each reach.
The following description of the fieldwork and computational procedures is brief because the details are known to most hydraulic engineers that are concerned with open-channel flow. For detailed discussions the reader is referred to reports by Benson and Dalrymple (1967) and Dalrymple and Benson (1967). Those re ports are concerned primarily with the determination of discharge when values of n are known or have been subjectively estimated. In this study we will start with a measured value of discharge and solve the equations for Manning's n, but otherwise the procedures used in this study follow those given in the two reports.
Stakes for referencing water-surface elevations were installed at the ends of each cross section, and the reach and cross sections were surveyed. When a current-meter measurement of discharge was made, concurrent elevations of the water surface were obtained at the ends of each cross section. Those elevations and the measured discharge were used with cross-section dimensions from the original survey to compute n by means of the Manning equa tion. The simple Manning equation, shown as equation 7 in this report, is used only for uniform flow that is, flow in a channel whose cross-sectional area does not vary within the reach. A
B18 STUDIES OF FLOW IN ALLUVIAL CHANNELS
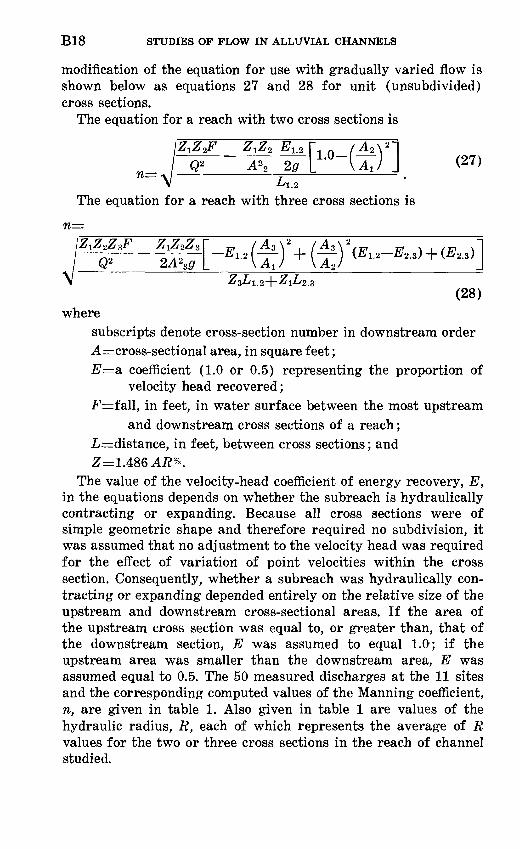
modification of the equation for use with gradually varied flow is shown below as equations 27 and 28 for unit (unsubdivided) cross sections.
The equation for a reach with two cross sections is
(27)
l. 2
The equation for a reach with three cross sections is
(28) where
subscripts denote cross-section number in downstream orderA=cross-sectional area, in square feet;E=a coefficient (1.0 or 0.5) representing the proportion of
velocity head recovered ; Fmfall, in feet, in water surface between the most upstream
and downstream cross sections of a reach ; L= distance, in feet, between cross sections ; and
The value of the velocity-head coefficient of energy recovery, E, in the equations depends on whether the subreach is hydraulically contracting or expanding. Because all cross sections were of simple geometric shape and therefore required no subdivision, it was assumed that no adjustment to the velocity head was required for the effect of variation of point velocities within the cross section. Consequently, whether a subreach was hydraulically con tracting or expanding depended entirely on the relative size of the upstream and downstream cross-sectional areas. If the area of the upstream cross section was equal to, or greater than, that of the downstream section, E was assumed to equal 1.0; if the upstream area was smaller than the downstream area, E was assumed equal to 0.5. The 50 measured discharges at the 11 sites and the corresponding computed values of the Manning coefficient, n, are given in table 1. Also given in table 1 are values of the hydraulic radius, R, each of which represents the average of R values for the two or three cross sections in the reach of channel studied.

MANNING COEFFICIENT FROM BED ROUGHNESS IN CHANNELS B19
DETERMINATION OF CHARACTERISTIC STREAMBED-PARTICLEDIMENSIONS
/yt
Because the roughness parameter -=^7- was to be related to
characteristic bed-particle size, it was necessary at each site to (1) sample the bed material objectively, (2) obtain a cumulative frequency distribution of the dimensions of the particles, and (3) select sizes for study that corresponded to some predetermined percentiles of the distribution.
The sampling procedures used was patterned after the Wolman (1954) method. In each reach a grid system was established in the transverse and longitudinal direction of the channel to obtain 100 intersections. The streambed particle at each intersection was measured along the implied maximum, intermediate, and minimum diameters. The ease with which the Wolman method is performed suggests measuring more than 100 particles for more reliable size distributions of the bed material. However, Wolman made a sta tistical test of the median diameter using nine samples of 100 pebbles and found that one sample of 100 pebbles would result in a value within 12 percent of the median of the 900 pebbles, about two-thirds of the time. The samples of 100 particles were, there fore, considered adequate for this study.
The sampling of bed material was done during periods of low flow. Because of a change in channel conditions that occurred during the flood of December 22, 1964, two sets of bed samples were obtained at site 8, Outlet Creek near Longvale. The samples obtained before December 1964 supplied data for use with dis charge measurements, cross-section measurements, and water- surface profiles obtained before the flood; the samples obtained after December 1964 were used similarly with measurements and surveys made after the flood.
Individual cumulative frequency-distribution curves were fitted graphically for the maximum, intermediate, and minimum diam eters of each sample of 100 particles. The data were plotted on logarithmic normal probability paper. Plotting positions for points on each curve were cumulative values of P6 , computed by use of the formula,
wherePb=: percent of bed material within an arbitrary range of size,
and m=rnumber of particles within that arbitrary range of size.
397-414 O - 70 - 4

B20 STUDIES OF FLOW IN ALLUVIAL CHANNELS
10 20 30 40 50 60 70 80 90 95 98
PERCENTAGE OF BED MATERIAL FINER THAN INDICATED SIZE
99 99.5
FIGURE 2. Size distribution of bed material, site 1, Austin Creek near Cazadero.
The distributions of bed-material sizes in seven of the eleven reaches sampled were approximately logarithmic normal that is, the data plotted on straight lines as illustrated in figure 2, which shows the distribution for site 1, Austin Creek near Cazadero. The distribution for the remaining four reaches were skewed; that is, lines fitting the plotted data were curvilinear as illustrated

MANNING COEFFICIENT FROM BED ROUGHNESS IN CHANNELS B21
u. 1z 0.9
. 0.8< 0.7Q±w 0.6<S 0.5
§' 0.4
oiv 0.3
o 0.2
0.1 0.09 0.08 0.07
0.06
0.05 -
0.04
EXPLANATION
Maximum diameter
A
Intermediate diameter
0 A
10 20 30 40 50 60 70 80 90 95 98 99
PERCENTAGE OF BED MATERIAL FINER THAN INDICATED SIZE
FIGURE 3. Size distribution of bed material, site 4, Kaweah River at Three Rivers.
in figure 3, which shows the distribution for site 4, Kaweah River at Three Rivers.
The curves in general were not well defined for sizes that did not lie between the 16 and 84 percentiles, and, consequently, data outside those percentiles were not used for analysis. The 16 per- centile represents a size whose logarithm is one standard deviation

B22 STUDIES OF FLOW IN ALLUVIAL CHANNELS
smaller than the mean of the logarithms of the sizes in the array; the 84 percentile represents a size whose logarithm is one standard deviation greater than the mean. The three characteristic dimen sions of streambed particles selected for study were those corre sponding to the 16 percentile, 50 percentile (median of the loga rithms), and 84 percentile. Those sizes are given in columns 8-13 of table 1 for the minimum and intermediate diameters. Values for the maximum diameter of bed material are not tabulated because they were not used in the correlations with the roughness param eter that are discussed in this report (p. B23). The maximum diam eter is the least effective of the three diameters as a measure of roughness because bed particles usually orient themselves so that the maximum diameter or axis of each particle is parallel to the streamlines.
DETERMINATION OF VELOCITY RATIOS
It was mentioned above that as an adjunct to this study, the roughness parameter would be related to the ratio of velocity at two-tenths of the depth below the water surface (V0 _ 2y ) and to velocity at eight-tenths of the depth below the water surface (Vo.8y)> To obtain a single composite ratio, ~x, for each discharge measurement, the following formula was used,
__ Vo.2y _ ~T7
VQ.ZV where
Ai=area of ith subsection of the cross section measured, andVi=velocity in the itln. subsection.
Velocity ratios could not be computed for all the current-meter measurements of discharge because, for some of the low-flow measurements, the depths in some subsections were too shallow to permit observation of velocities at the 0.2 and 0.8 depths. In those subsections, velocities were observed only at the 0.6 depth to give the mean velocities in the subsections. At three of the sites the high-flow discharge-measurement section lay outside the reach used for determining n, and the measured velocities therefore could not be used in a correlation with the roughness parameter. Con sequently, usable velocity ratios could be obtained for only 27 of the 50 current-meter measurements of discharge; the 27 ratios are given in the last column of table 1.
RELATION OF ROUGHNESS PARAMETER TO RELATIVE SMOOTHNESS
The basic data assembled in table 1 are pertinent to the studyn?
of the relation of the roughness parameter, -^7, to the relative/t/6

MANNING COEFFICIENT FROM BED ROUGHNESS IN CHANNELS B23
7? smoothness, -=-, where d is a characteristic size of the streambed
particles. It has already been established that the largest of the three diameters of the bed material will not be used in the study, but that separate analyses will be made using the intermediate and minimum diameter. Reasons for using those two diameters were given on page B6. It has also been established (p. B 00) that such factors as Froude number and width-depth ratio will not be considered in the analyses, and they therefore have not been given in table 1.
In the correlations of roughness parameter to relative smooth ness that follow, individual characteristic particle sizes are first used, without regard for any other characteristics of the distribu tions from which those individual sizes were selected. Thus, in the first three sets of correlations, d will have values corresponding to the 84-, 50-, and 16-percentile sizes of bed particles. In the correla tions that are next made, consideration is given to the parent distributions of size of bed material, and the three individual characteristic sizes will be weighted and combined into a value of d representing a single composite size.
In making the correlations discussed in the preceding paragraph it was found that equations expressing the relations were of a form similar to those presented by Chow (eq 14a), Leopold and Wolman (eq 19), and by Vennard (eq 21) in which
n 0.0926R (31)
where a and b are constants.Because the procedure used was common to all the correlations,it will be described at this time. For each discharge measurement,
-tt was computed and tabulated in tables 2 and 3. Values of the
roughness parameter, -~7, were then converted to correspondingvalues of 1/V / by means of equation 18, which states that
_ O 0926 _ 1/V /= . (The computation of values of 1/V / is merely an
IV
intermediate step in the correlation procedure, and therefore values of 1/vTare not given in the tables.) Values of 1/V / versusr>
-=- were then plotted on semilogarithmic graph paper, the values
of I/ V7 being plotted as the dependent variable on the vertical natural-scale ordinate. The best fit to the plotted points of each
TABL
E 2.
Res
ults
of
rela
ting
rou
ghne
ss p
ara/
met
er t
o re
lati
ve s
moo
thne
ss,
base
d on
84-
, 50
-, a
nd 1
6-pe
rcen
tile
siz
es o
fm
inim
um d
iam
eter
of
stre
ambe
d pa
rtic
les
W
to
Rel
ativ
e sm
ooth
ness
Str
eam
N
o.
and
loca
tion
Rd'8
4R
d'5
0R
#16
n~
R%
Rou
ghne
ss p
aram
eter
,
Bas
ed o
n 8
4-p
erce
nti
le
par
ticl
e si
zeC
ompu
ted
Per
centa
ge
from
d
evia
tio
n o
f eq
uati
on
com
pute
d fr
om
33
obse
rved
val
ue
1 2
1 A
ust
in C
reek
nea
rC
azad
ero.
2 C
ache
Cre
ek a
t Y
olo
3 M
iddl
e F
ork
Eel
Riv
erbe
low
Bla
ck B
utt
eR
iver
, n
ear
Cov
elo.
4 K
awea
h R
iver
at
Thre
eR
iver
s.
5 K
ings
Riv
er b
elow
Nort
h F
ork
.
6 M
erce
d R
iver
at
Cla
rks
brid
ge,
nea
r Y
osem
ite.
7 M
erce
d R
iver
at
Hap
py
Isle
s br
idge
, n
ear
Yos
emit
e.
3 72.0
32.9
24.5
22.9
118 72.8
28.3
23.2 7.33
2.33
2.10
1.58
4.81
4.62
4.53
4.42
6.83
6.79
6.57
6.00
5.58
5.06
4.96
3.98
3.58
3.40
2.97
2.80
2.75
4
164 75.0
55.8
52.2
327
202 78
.5
102 32
.1 6.11
5.51
4.14
10.6
10.2
10.0 9.71
12.9
12.9
12.4
11.4
10.6 9.57
9.39
7.68
6.91
6.56
5.74
5.40
5.32
5
369
169
126
118
850
524
204
444
140 22
.820
.515
.4
33.6
32.4
31.7
30.9
24.1
24.0
23.2
21.2
19.7
17.9
17.5
15.1
13.6
12.9
11.3
10.6
10.4
6
0.02
7.0
31.0
32.0
34
.016
.019
.023
.028
.040
.062
.060
.078
.052
.048
.052
.054
.036
.028
.029
.043
.042
.058
.054
.046
.054
.054
.048
.047
0.54
7
0.02
1.0
24.0
26.0
27
.019
.021
.025
.027
.037
.062
.066
.080
.044
.044
.045
.045
.038
.038
.039
.040
.041
.043
.043
.047
.050
.051
.054
.056
.057
8
22
.2 2
2.6
18.8
20.6
+18.8
+1
0.5
+8.7
3.6
7.5 0
+10.0
+2.6
15.4
8.3
13.5
16
.7
+5.6
+35.7
+34.5
7.0
2.4
25.9
20
.4
+2
.2 7
.4 5
.6+
12
.5+
19.1
+5.6
Bas
ed o
n 5
0-p
erce
nti
le
par
ticl
e si
zeC
ompu
ted
_ _
.._ _
Perr
.pn
tair
pfr
om
de
viat
ion
of
equa
tion
co
mpu
ted
fro
m35
ob
serv
ed v
alue
9
0.02
1.0
25.0
26.0
27
.018
.020
.024
.023
.031
.059
.062
.075
.045
.046
.046
.047
.042
.042
.042
.044
.045
.047
.048
.052
.055
.057
.061
.063
.064
10
22
.2 1
9.4
18
.8 2
0.6
+1
2.5
+5
.3+
4.3
17.9
22
.5
4.8
+3.3
3.8
13
.5 4
.2 1
1.5
13.0
+16
.7+
50
.0+
44.8
+2.3
+7.1
19
.0 1
1.1
+13
.0+
1.9
+5
.6+
27.1
+34.0
+18
.5
Bas
ed o
a 16
-per
cent
Ue
par
ticl
e si
zeC
ompu
ted
_
__ _
,P
prr
.pnta
c'p
from
de
viat
ion
of
equa
tion
co
mpu
ted
fro
m37
ob
serv
ed v
alue
11
0.02
5.0
29.0
30.0
31
.022
.024
.028
.025
.030
.045
.046
.051
.041
.041
.041
.041
.044
.044
.045
.046
.047
.048
.049
.051
.053
.054
.056
.057
.058
12
7.4
6.5
-6.2
8.8
+37
.5+
26
.3+
21.7
10.7
25.0
27.4
23.3
-34.6
21
.2 1
4.6
21.2
24.1
+22
.2+
57
.1+
55.2
+7
.0+
11.9
17.2
9.3
+10
.9 1
.9 0+
16
.7+
21
.3+
7.4
o
Ou
tlet
Cre
ek n
ear
Lo
ng
val
e.
Mid
dle
Fo
rk S
mit
h
Riv
er a
t G
asquet
.
10
Van
Duze
n R
iver
near
Bri
dgev
ille
.
2.63
2.44
2.25
2.05
1.44
57.4
35.1
28.6
20.9
20.5
16.0
15.2
16.1
13.5 5.16
4.37
3.96
5.41
5.07
4.70
4.33
3.95
2.77
202
117 95.2
73.5
72.0
53.2
50.8
56.7
47.6
12.2
10.4
9.41
12.5
9.97
9.24
8.52
7.76
5.45
727
388
316
265
259
176
168
204
171 30
.225
.523
.2
31.4
.055
.059
.075
.065
.093
.023
.026
.026
.023
.022
.025
.021
.040
.032
.033
.036
.039
.033
.058
.060
.063
.067
.086
.022
.024
.025
.027
.027
.029
.030
.029
.031
.042
.045
.047
.042
+ 5
.5
+1
.7 1
6.0
+
3.1
7.5
4.3
7.7
3.8
+
17
.4
+2
2.7
+
16
.0
+4
2.9
27.5
3.1
+2
7.3
+
25
.0
+2
0.5
+2
7.3
.066
.069
.073
.078
.105
.020
.022
.023
.025
.025
.027
.027
.026
.028
.043
.046
.048
.042
+2
0.0
+
16
.9
2.7
+
20
.0
+1
2.9
13.0
15.4
11
.5
+8.7
+1
3.6
+
8.0
+2
8.6
35.0
12.5
+3
0.3
+
27
.8
+2
3.1
+2
7.3
.059
.060
.062
.065
.075
.023
.025
.026
.027
.027
.029
.029
.028
.029
.042
.044
.045
.041
+7
.3
+1
.7 1
7.3
0
19.4 0
3.8
0
+1
7.4
+
22
.7
+1
6.0
+
38
.1 3
0.0
9.4
+2
7.3
+
22
.2
+1
5.4
+2
4.2
11V
an D
uze
n R
iver
near
Din
smore
s.3.
51
3.01
2.
40
17.0
14
.6
11.6
79.8
68
.5
54.5
.074
.0
83
.079
.050
.0
54
.061
Sum
mar
y o
f co
rrel
atio
n s
tati
t
Coe
ffi
Sta
m
cien
t of
corr
elat
ion
n
Jard
err
or
of
esti
mat
e, i
n u
nit
s o
f _-
r___
._ _ __
... ...
. _
....
____
____
____
0.89
.008
7
32.4
3
4.9
2
2.8
stie
s
.038
.0
40
.044
0.76
.012
0
48.6
5
1.8
4
4.3
.033
.0
34
.036
0.65
.014
0
-55.4
5
9.0
5
4.4
Mea
n (
algeb
raic
) of
per
centa
ge
dif
fere
nce
s
Sta
ndar
d d
evia
tion
of
per
centa
ge
dif
fere
nce
s..
0.0
5
±1
8.6
+0
.93
±2
2.7
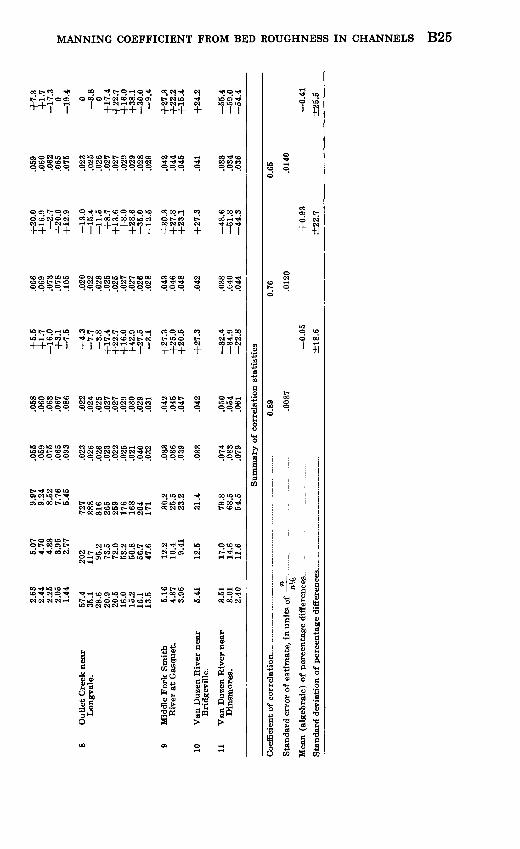
-0.4
1
±2
5.5
W
TABL
E 3
. R
esul
ts o
f re
lati
ng r
ough
ness
par
amet
er t
o re
lati
ve s
moo
thne
ss,
base
d on
84-
, 50
-, a
nd 1
6-pe
rcen
tile
siz
es o
fin
term
edia
te d
iam
eter
of
stre
ambe
d pa
rtic
les
w bO
Rel
ativ
e sm
ooth
ness
Str
eam
No.
an
dlo
cati
on
1 2
1 A
ust
in C
reek
nea
rC
azad
ero.
2 C
ache
Cre
ek a
t Y
olo
. ...
3 M
iddl
e F
ork
Eel
Riv
erbe
low
Bla
ck B
utt
eR
iver
, nea
r C
ovel
o.
4 K
awea
h R
iver
at
Th
ree
Riv
ers.
5 K
ings
Riv
er b
elow
Nort
h F
ork
.
6 M
erce
d R
iver
at
Cla
rks
brid
ge, n
ear
Yos
emit
e.
7 M
erce
d R
iver
at
Hap
py
Isle
s br
idge
, n
ear
Yos
emit
e.
Rou
ghne
ss p
aram
eter
,
sVe,
Bas
ed o
n 84-p
erce
nti
le ._
.-
.,
par
ticl
e si
zeR
d"8
4
3 47.2
21.6
16.1
15.0
68.5
42.3
16.5
14.4 4.53
1.56
1.41
1.06
3.27
3.15
3.09
3.01
5.10
5.07
4.90
4.48
4.17
3.77
3.70
2.50
2.25
2.14
1.87
1.76
1.73
Bd
"50
4
105 48
.235
.933
.6
177
109 42.5
62.6
19.7 4.12
3.71
2.79
6.98
6.72
6.58
6.42
9.05
'9.
008.
707.
957.
406.
706.
58
5.28
4.75
4.51
3.94
3.71
3.65
B o"ie 5
227
104 77
.372
.3
472
291
113
271 85
.6
14.3
12.9 9.67
19.5
18.7
18.4
17.9
16.5
16.4
15.8
14.5
13.5
12.2
12.0
11.0 9.85
9.35
8.18
7.70
7.58
n
Com
pute
d~
^ 6
0.02
7.0
31.0
32.0
34
.016
.019
.023
.028
.040
.062
.060
.078
.052
.048
.052
.054
.036
.028
.029
.043
.042
.058
.054
.046
.054
.054
.048
.047
.054
from
equa
tion
34 7
0.02
1.0
24.0
26.0
26
.019
.021
.026
.027
.037
.060
.064
.077
.042
.043
.043
.044
.036
.036
.036
.038
.039
.040
.040
.047
.050
.051
.054
.056
.057
Per
centa
ge
devi
atio
n of
com
pute
d fr
om
obse
rved
val
ue
8
22
.2 2
2.6
18
.8 2
3.5
+18.8
+1
0.5
+1
3.0
3.6
7.5
3.2
+6
.7 1
.3
19
.2 1
0.4
17.3
18.5 0
+2
8.6
+2
4.1
11.6
7.1
31
.0 2
5.9
+2
.2 7
.4 5
.6+
12
.5+
19
.1+
5.6
Bas
ed o
n 5
0-p
erce
nti
lep
arti
cle
size
Com
pute
dfr
om
equa
tion
36 9
0.02
1.0
25.0
27.0
27
.019
.021
.026
.023
.032
.059
.062
.075
.045
.046
.047
.047
.041
.041
.042
.043
.044
.046
.047
.052 .054
.056
.060
.062
.063
Per
centa
ge
devi
atio
n of
com
pute
d fr
om
obse
rved
val
ue
10
22.2
19.4
15.6
20.6
+1
8.8
+10
.5+
13
.0
17
.9 2
0.0
4.8
+3.3
3.8
13
.5 4
.2-9
.6 1
3.0
+1
3.9
+46.4
+44
.8 0+
4.8
20
.7 1
3.0
+1
3.0 0
+3
.7+
25.0
+31
.9+
16
.7
Bas
ed o
n 1
6-p
erce
nti
lepar
ticl
e si
zeC
ompu
ted
from
equat
ion
38 11
0.02
4.0
28.0
30.0
30
.021
.023
.027
.023
.029
.048
.049
.055
.043
.043
.044
.044
.045
.045
.046
.047
.049
.050
.051
.052
.055
.056
.059
.061
.061
Per
centa
ge
devi
atio
n of
com
pute
d fr
om
obse
rved
val
ue
12
11.1
9.7
6.2
11.8
+31
.2+
21.1
+1
7.4
17.9
27.5
22.6
18.3
29.5
17.3
10.4
15.4
18.5
+2
5.0
+ 6
0.7
+58
.6+
9.3
+1
6.7
13.8
5.6
+13
.0+
1.9
+3
.7+
22.9
+29
.8+
13.0
Ou
tlet
Cre
ek n
ear
Lon
gval
e.
Mid
dle
Fo
rk S
mit
h
Riv
er a
t G
asqu
et.
10
Van
Duz
en R
iver
nea
r B
ridg
evil
le.
1.65
1.53
1.41
I.29
.9
0
30.3
20.6
16.7
II.0
10
.8
9.31
8.
89
8.50
7.
14
3.24
2.74
2.49
3.07
3.48
3.23
2.98
2.71
1.90
109 73
.860
.039
.738
.933
.532
.030
.625
.7 7.69
6.51
5.90
7.46
7.22
6.70
6.18
5.62
3.95
419
231
188
153
150
105
100
118 98
.8
18.7
15.8
14.3
18.4
.055
.059
.075
.065
.093
.023
.026
.026
.023
.022
.025
.021
.040
.032
.033
.036
.039
.033
.058
.061
.064
.067
.087
.022
.024
.026
.029
.029
.030
.030
.031
.032
.042
.045
.047
.043
+5.5
+
3.4
14.7
+
3.1
6.5
4.3
7.7 0
+26
.1
+3
1.8
+
20
.0
+42.9
22
.5
0
+2
7.3
+
25
.0
+20.5
+30.3
.065
.068
.071
.076
.102
.021
.023
.024
.026
.026
.027
.028
.028
.029
.044
.047
.049
.044
+18.2
+
15
.3 5
.3+
16.9
+9
.7
8.7
11
.5 7
.7
+1
3.0
+
18
.2+
8.0
+
33.3
30
.0 9
.4
+33.3
+
30.6
+
25.6
+33.3
.063
.065
.068
.071
.088
.022
.024
.025
.026
.026
.028
.028
.027
.028
.043
.046
.048
.044
+1
4.5
+
10.2
9.3
+
9.2
5.4
4.3
7.7
3.8
+
13
.0
+1
8.2
+
12
.0
+3
3.3
32.5
12
.5
+3
0.3
+
27.8
+
23.1
+3
3.S
11
Van
Duz
en R
iver
nea
r 2.
15
10.5
53
.8
Din
smor
es.
1.84
9.
04
46.1
1.
47
7.20
36
.7
.074
.0
83
.079
.051
.0
55
.062
31
.1
33.7
2
1.5
.039
.0
41
.045
47
.3
50
.6
43.0
.032
.0
34
.036
56.8
5
9.0
5
4.4
Sum
mar
y o
f co
rrel
atio
n s
tati
stic
s
Coe
ffic
ient
of
corr
elat
ion
_ . _
__
__
._ _
_ _
__
_ . _
__ __
. __ _
Sta
ndar
d d
evia
tion
of
per
cen
tag
e dif
fere
nce
s. . _
_ _
______ . -
......
_....
_.
0.88
.008
7
0.4
3
±1
9.0
0.78
.011
7
+1
.79
±2
2.4
0.67
.014
0
+1.3
6
±25
.7
i w M
O » § O
8
2 a
en
en w to
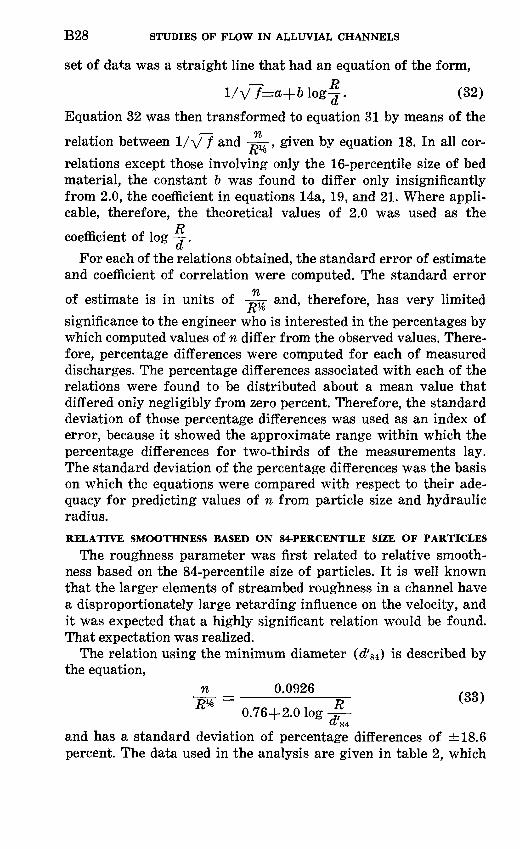
B28 STUDIES OF FLOW IN ALLUVIAL CHANNELS
set of data was a straight line that had an equation of the form,
l/V7=a+61og^. (32)
Equation 32 was then transformed to equation 31 by means of the ti/relation between 1/V / and -grr, given by equation 18. In all cor-K
relations except those involving only the 16-percentile size of bed material, the constant b was found to differ only insignificantly from 2.0, the coefficient in equations 14a, 19, and 21. Where appli cable, therefore, the theoretical values of 2.0 was used as the
R coefficient of log -=-.
For each of the relations obtained, the standard error of estimate and coefficient of correlation were computed. The standard error
% of estimate is in units of -^7- and, therefore, has very limitedK /6significance to the engineer who is interested in the percentages by which computed values of n differ from the observed values. There fore, percentage differences were computed for each of measured discharges. The percentage differences associated with each of the relations were found to be distributed about a mean value that differed only negligibly from zero percent. Therefore, the standard deviation of those percentage differences was used as an index of error, because it showed the approximate range within which the percentage differences for two-thirds of the measurements lay. The standard deviation of the percentage differences was the basis on which the equations were compared with respect to their ade quacy for predicting values of n from particle size and hydraulic radius.RELATIVE SMOOTHNESS BASED ON 84-PERCENTILE SIZE OF PARTICLES
The roughness parameter was first related to relative smooth ness based on the 84-percentile size of particles. It is well known that the larger elements of streambed roughness in a channel have a disproportionately large retarding influence on the velocity, and it was expected that a highly significant relation would be found. That expectation was realized.
The relation using the minimum diameter (d'8±) is described by the equation,
n 0.0926 "pu p~ \oo)K 0.76+2.0 log -£-
«84
and has a standard deviation of percentage differences of ±18.6 percent. The data used in the analysis are given in table 2, which

MANNING COEFFICIENT FROM BED ROUGHNESS IN CHANNELS B29
tl/also shows a comparison between observed values of -J^T- and thosefC/G
computed by equation 33. The relation is shown graphically in figure 4.
The relation using the intermediate diameter (d"84 ) is described by the equation,
n 0.0926
1.16+2.0 log" 84
and has a standard deviation of percentage differences of ±19.0 percent. The data used and a comparison between observed and
M
computed values of -=r- are given in table 3. The relation is shownJK
graphically in figure 5. The similarity between equation 34 and equation 19 of Leopold and Wolman, also based on the intermediate diameter, is remarkable.
RELATIVE SMOOTHNESS BASED ON 50-PERCENTILE SIZE OF PARTICLES
The roughness parameter was next related to relative smooth ness based on the 50-percentile size of particles. It was expected that the 50-percentile size would not correlate so well as did the 84-percentile size, and that proved to be the case.
The relation using the minimum diameter (d'50 ) is described by the equation,
n _ 0.0926 , 3g .
2.0 log -57 and has a standard deviation of percentage differences of ±22.7 percent.
The relation using the intermediate diameter (d"50 ) is described by the equation,
n 0.0926 0.35+2.0 log
, Q^ (36)
50
and has a standard deviation of percentage differences of ±22.4 percent.
The data used in the correlations and a comparison between7?
observed and computed values of -=r- are given in table 2 for theK
analysis using minimum diameter, and in table 3 for the analysis using intermediate diameter. The curves of relation for the mini mum and intermediate diameters are not given, but they closely resembled those in figures 4 and 5, and the pattern of deviations of the plotted points was similar to that for the 84- percentile size.
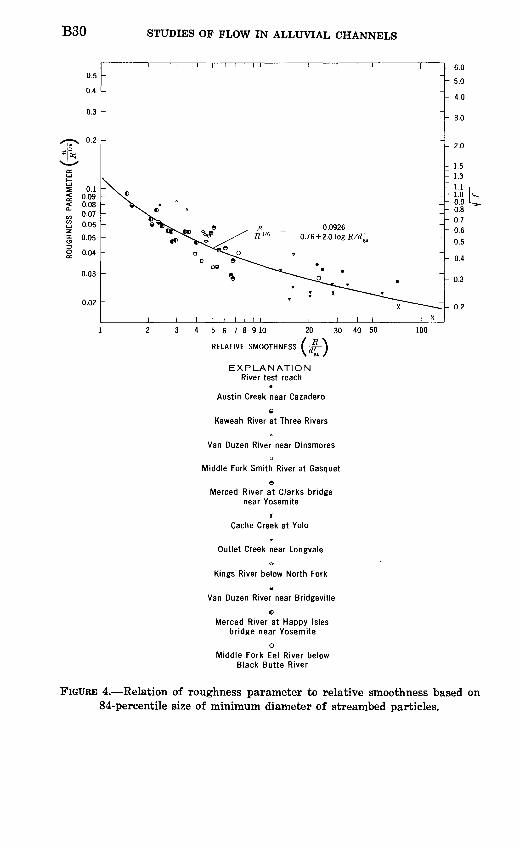
B30 STUDIES OF FLOW IN ALLUVIAL CHANNELS
0.2
S 0.1< 0.09< 0.08<o °-07" 0.06
I 0-05
§ 0.04
0.03
3 456789 10 20
RELATIVE SMOOTHNESS
30 40 50
EXPLANATION River test reach
Austin Creek near Cazadero
e Kaweah River at Three Rivers
Van Duzen River near Dinsmoreso
Middle Fork Smith River at Gasquet
eMerced River at Clarks bridge
near Yosemite
x Cache Creek at Yolo
Outlet Creek near Longvale
o
Kings River below North Fork
aVan Duzen River near Bridgeville
oMerced River at Happy Isles
bridge near Yosemite
oMiddle Fork Eel River below
Black Butte River
- 6.0
- 5.0
- 4.0
- 3.0
1.5 1.3 1.1 1.0 0.9 0.80.7 0.6 0.5
i- 0.3
100
FIGURE 4. Relation of roughness parameter to relative smoothness based on 84-percentile size of minimum diameter of streambed particles.
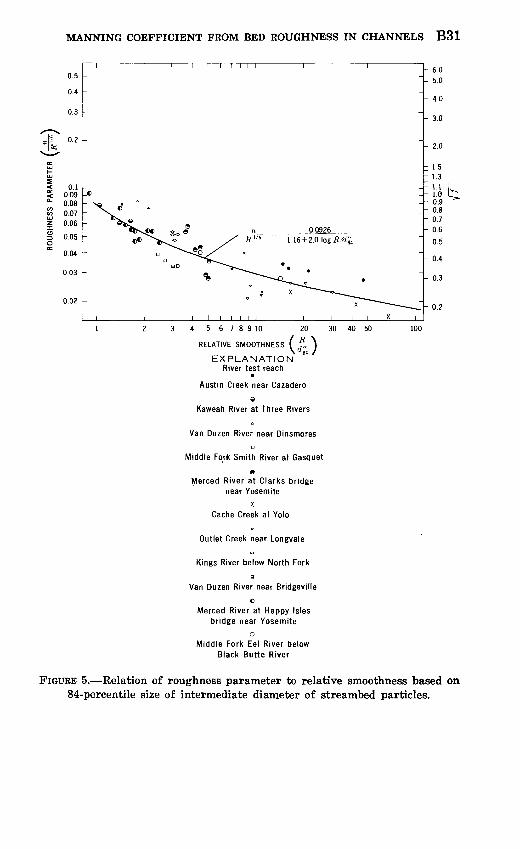
MANNING COEFFICIENT FROM BED ROUGHNESS IN CHANNELS B31
< o.i< 0.09°- 0.08
2 °-07| 0.06
§ 0.05
3 4 5 6 7 8 9 10 20 30 40 50
RELATIVE SMOOTHNESS (^-\ dM
EXPLANATION River test reach
Austin Creek near Cazadero
e Kaweah River at Three Rivers
Van Duzen River near Dinsmores
D
Middle Fork Smith River at Gasquet
eMerced River at Clarks bridge
near Yosemite
x Cache Creek at Yolo
Outlet Creek near Longvale
o
Kings River below North Fork
a
Van Duzen River near Bridgeville
cMerced River at Happy Isles
bridge near Yosemite
oMiddle Fork Eel River below
Black Butte River
6.0 5.0
4.0
3.0
- 2.0
1.5 1.3 1.1 l.O 0.9 0.8 0.7 0.6
- 0.5
- 0.4
- 0.3
- 0.2
FIGURE 5. Relation of roughness parameter to relative smoothness based on 84-percentile size of intermediate diameter of streambed particles.

B32 STUDIES OF FLOW IN ALLUVIAL CHANNELS
RELATIVE SMOOTHNESS BASED ON 16-PERCENTILE SIZE OF PARTICLES
The roughness parameter was also related to relative smooth ness based on the 16-percentile size of particles. From comparison of the correlations previously made using 84- and 50-percentile sizes, it was virtually a certainty that inferior correlations would result from using the 16-percentile size of particles. Nevertheless, correlations using the 16-percentile size were made in the belief that the results obtained might be helpful in determining methods for weighting particle sizes for the correlations to be described in the next section of this report.
The relation using the minimum diameter (d'i6 ) is described by the equation,
n - 0-0926" r P~ R 0.25+1.33 log -£-
and has a standard deviation of percentage differences of ±25.5 percent.
The relation using the intermediate diameter (d"i6 ) is described by the equation
n _ 0.0926 (3g
0.10+1.60 log -IJ-a le
and has a standard deviation of percentage differences of ±25.7 percent.
Again, the data used in the correlations and a comparison be-7?tween observed and computed values of -=^- are given in table 2
for the analysis using minimum diameter, and in table 3 for the analysis using intermediate diameter. The curves of relation for the minimum and intermediate diameters are not given, but they closely resembled those in figures 4 and 5, and the pattern of deviations of the plotted points was similar to that for the 84- percentile size.
RELATIVE SMOOTHNESS BASED ON WEIGHTED PARTICLE SIZEThe three preceding relations using individual characteristic
particle sizes ignore all other characteristics of the distributions from which those individual sizes were selected. To give considera tion to the entire cumulative frequency curve of particle sizes between the 84- and 16-percentiles, the 84-, 50-, and 16-percentile sizes were weighted and combined into a single composite size, dw. Other methods of considering the cumulative frequency curve might have been used for example, the three percentile sizes might have been used in a multiple correlation, or the slope of the

MANNING COEFFICIENT FROM BED ROUGHNESS IN CHANNELS B33
cumulative distribution curve might have been used by including
an additional term in the equation for either of the ratios, -^ or
~-. It was thought, however, that the most desirable course of
action would be to maintain the theoretical form of the equation, and, consequently, a single weighted composite size was used. Two methods of weighting suggested themselves.
The most obvious method was to weight each of the three per centile sizes in inverse proportion to the square of the individual standard errors of estimate given in tables 2 and 3. When this was done, almost identical results were obtained for both the minimum and intermediate diameters. After rounding each weighting factor to a single significant figure, the resulting weights were as follows:
Characteristic size Weighting factor
84 percentile - -_ _ 0.650 percentile- -- .316 percentile .1
Actually, the weighting factors obtained were in the order of 6, 3, 2, but the weighting factor of the 16-percentile size was re duced from 2 to 1, because the smaller weighting factor would have
7?resulted had the theoretical coefficient of 2.0 for log = been used
in equations 37 and 38. Particle sizes weighted as shown above are given in table 4 for both minimum (d'w ) and intermediate (d"w ) diameters. Each value represents a composite size for the sampling site, and each was obtained by multiplying d84 by 0.6, d50 by 0.3, and die by 0.1, and then adding the three products.
The second weighting method tried was based on rank correla
tion. All values of the roughness parameter, -^r , were ranked inXV'6
order of magnitude. A set of composite values of dw , was then computed. (The values of d'w or d"w are such a set, using the pre viously mentioned weightings of 0.6, 0.3, and 0.1 for the three par ticle sizes.) The next step was to compute the relative smoothness,R , for each of the weighted particle sizes; the results of thatd
R computation are given in table 4. Because -=- varies inversely withU"U>
n R, the values of -= were ranked in inverse order of magnitude.RVeR
Differences between the rank of each value of -= and the rankaw
/yt
of corresponding values of -=rr were squared, and the squared
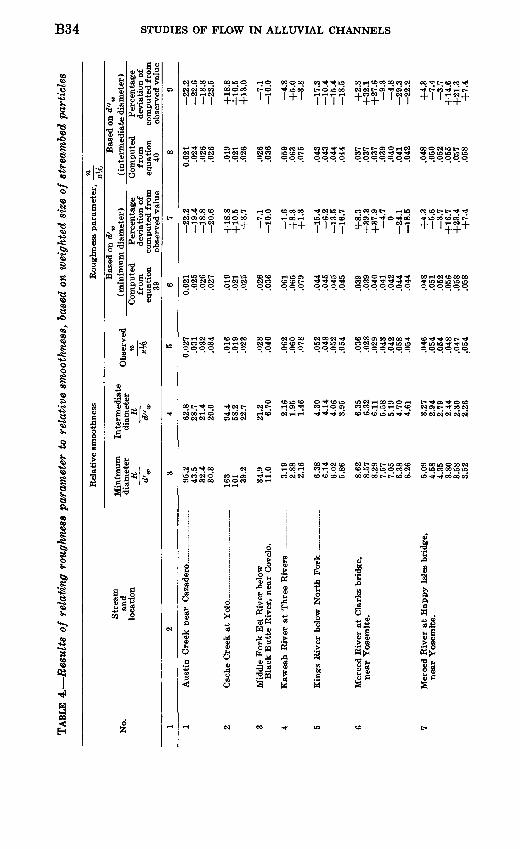
TABL
E 4
. R
esul
ts o
f re
lati
ng r
ough
ness
par
amet
er t
o re
lati
ve s
moo
thne
ss,
base
d on
wei
ghte
d si
ze o
f st
ream
bed
part
icle
sW C
O
Rel
ativ
e sm
oo
thn
ess
Str
eam
N
o.
and
loca
tion
1 2
1 A
ust
in C
reek
near
Caz
ader
o _
_. _
__ __
___
2 C
ach
e C
reek
at
Yol
o...
......
___ ...
. ...
....
.
3 M
idd
le F
ork
Eel
Riv
er b
elow
Bla
ck B
utt
e R
iver
, nea
r C
ovel
o.
4 K
awea
b R
iver
at
Thre
e R
iver
s.-.
~
__ __
.
5 K
ing
s R
iver
bel
ow N
ort
h F
ork
.. _
. _____
6 M
erce
d R
iver
at
Cla
rks
bri
dge,
near
Yo
sem
ite.
7 M
erce
d R
iver
at
Hap
py I
sles
bri
dg
e,near
Yose
mit
e.
Roughnes
s para
mete
r,
Bas
ed o
n d'..
Min
imu
m
dia
met
er
R *« 3
95.2
43.5
32.4
30.3
163
101 39
.2
34.9
11.0
3.19
2.88
2.16
6.38
6.14
6.02
5.86
8.62
8.57
8.29
7.57
7.05
6.38
6.26
5.09
4.58
4.35
3.80
3.58
3.52
Inte
rmed
iate
dia
met
er
R<*
"_ 4 62.8
28.7
21.4
20.0
94.4
58.2
22.7
21.2 6.70
2.16
1.95
1.46
4.30
4.14
4.06
3.95
6.35
6.32
6.11
5.58
5.19
4.70
4.61
3.27
2.94
2.79
2.44
2.30
2.26
Obse
rved
n
K\/Q 5
0.02
7.0
31.0
32.0
34
.016
.019
.023
.028
.040
.062
.060
.078
.052
.048
.052
.054
.036
.028
.029
.043
.042
.058
.054
.046
.054
.054
.048
.047
.054
(min
imum
dia
met
er)
Co
mp
ute
dfr
om
equat
ion
39 6
0.02
1.0
25.0
26.0
27
.019
.021
.025
.026
.036
.061
.065
.079
.044
.045
.045
.045
.039
.039
.040
.041
.042
.044
.044
.048
.051
.052
.056
.058
.058
Per
centa
ge
dev
iati
on o
fco
mp
ute
d f
rom
obse
rved
val
ue
7
22.2
19.4
18
.8 2
0.6
_|_
1 Q
Q
[-
J.O
.O
+1
0.5
+8
.7
7.1
10.0
1.6
+8
.3+
1.3
15.4
6.2
13.5
16.7
+8.3
+3
9.3
+3
7.9
4.7 0
24
.1 1
8.5
+4.3
5.6
3.7
+1
6.7
+2
3.4
+7
.4
w 1-%B
ased
on d
"w
(in
term
ed
iate
dia
met
er)
Com
pute
dfr
om
eauat
ion
40
8
0.02
1.0
24.0
26.0
26
.019
.021
.026
.026
.036
.059
.063
.075
.043
.043
.044
.044
.037
.037
.037
.039
.040
.041
.042
.048
.050
.052
.055
.057
.058
Per
centa
ge
dev
iati
on o
fco
mpute
d f
rom
obse
rved
val
ue
9
22.2
22.6
18
.8 2
3.5
J-1
S S
^^lo
.o+
10
,5+
13
.0
7.1
10.0
4.8
+5.0
3.8
17.3
10.4
15.4
18
.5
+2.8
+3
2.1
+2
7.6
9.3
4.8
29.3
22
.2
+4
.3 7
.4 3
.7+
14
.6+
21
.3+
7.4

8 O
utle
t C
reek
nea
r L
ongv
ale-
._. _
. ___ .._
9 M
iddl
e F
ork
Sm
ith
Riv
er a
t G
asqu
et_.
..--
10
Van
D
uzen
Riv
er n
ear
Bri
dg
evil
le _
. ___
11
Van
Duz
en R
iver
nea
r D
insm
ores
_____
3.36
3.12
2.87
2.62
1.84
83.8
49.2
40.0
30.5
29.9
22.3
21.3
23.5
19.8 7.00
5.93
5.38
7.26
5.27
4.52
3.60
2.16
2.00
1.84
1.68
1.18
43.6
29.5
24.0
15.9
15.6
13.4
12.8
12.2
10.3 4.36
3.69
3.34
4.12
3.23
2.77
2.21
.055
.059
.075
.065
.093
.023
.026
.026
.023
.022
.025
.021
.040
.032
.033
.036
.039
.033
.074
.083
.079
.060
.062
.065
.069
.090
.021
.024
.025
.027
.027
.029
.029
.029
.030
.042
.045
.047
.042
.048
.051
.057
+9.1
+5
.1 1
3.3
+6
.2 3
.2
8.7
7.7
3.8
+17.4
+2
2.7
+1
6.0
+38
.1 2
7.5
-6.2
+2
7.3
+25.0
+2
0.5
+27.3
-35
.1-3
8.6
27
.8
.059
.062
.065
.069
.089
.022
.024
.025
.028
.028
.029
.030
.030
.032
.043
.046
.048
.043
.048
.052
.058
+7
.3+
5.1
13.3
+6.2
4.3
4.3
7.7
3.8
+2
1.7
+27.3
+1
6.0
+42.9
25.0 0
+3
0.3
+2
7.8
+2
3.1
+3
0.3
35
.1 3
7.3
26.6
Sum
mar
y o
f co
rrel
atio
n st
atis
tics
Coe
ffic
ient
of
corr
elat
ion
n
Sta
nd
ard
err
or
of
esti
mat
e, i
n u
nit
s of
rr
- ___
_ - -
«%
Mea
n (a
lgeb
raic
) of
per
cen
tag
e di
ffer
ence
s....
_.
.-
Sta
ndar
d d
evia
tion
of
per
centa
ge
diff
eren
ces.
.....
...
....
0.87 .0
092
+0.
39
±19
.1
0.87 .0
092
0.2
6
±1
9.5
w CO en
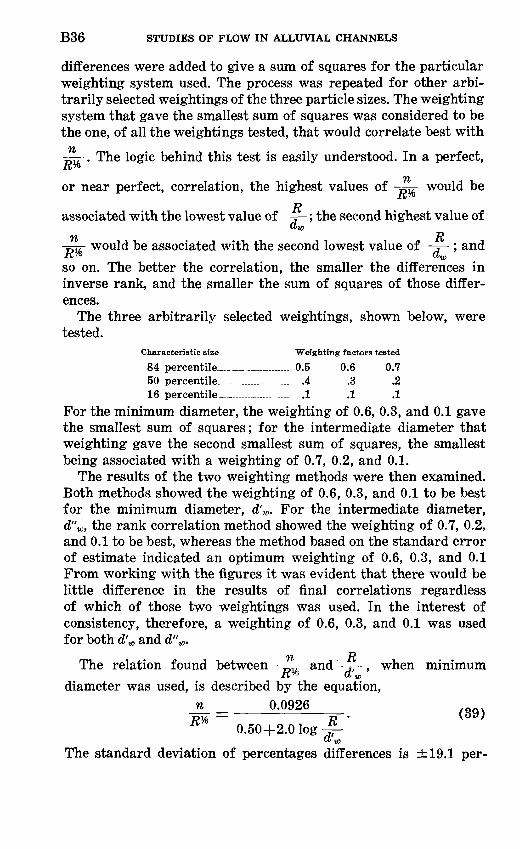
B36 STUDIES OF FLOW IN ALLUVIAL CHANNELS
differences were added to give a sum of squares for the particular weighting system used. The process was repeated for other arbi trarily selected weightings of the three particle sizes. The weighting system that gave the smallest sum of squares was considered to be the one, of all the weightings tested, that would correlate best with
vt
=7-. The logic behind this test is easily understood. In a perfect,xv
vt
or near perfect, correlation, the highest values of -~r would betv K
associated with the lowest value of -= ; the second highest value ofawn Rwould be associated with the second lowest value of -r ; and
so on. The better the correlation, the smaller the differences in inverse rank, and the smaller the sum of squares of those differ ences.
The three arbitrarily selected weightings, shown below, were tested.
Characteristic size Weighting factors tested
84 percentile - -- 0.5 0.6 0.750 percentile . . .4 .3 .216 percentile ___ .1 .1 .1
For the minimum diameter, the weighting of 0.6, 0.3, and 0.1 gave the smallest sum of squares; for the intermediate diameter that weighting gave the second smallest sum of squares, the smallest being associated with a weighting of 0.7, 0.2, and 0.1.
The results of the two weighting methods were then examined. Both methods showed the weighting of 0.6, 0.3, and 0.1 to be best for the minimum diameter, d'w . For the intermediate diameter, d"w, the rank correlation method showed the weighting of 0.7, 0.2, and 0.1 to be best, whereas the method based on the standard error of estimate indicated an optimum weighting of 0.6, 0.3, and 0.1 From working with the figures it was evident that there would be little difference in the results of final correlations regardless of which of those two weightings was used. In the interest of consistency, therefore, a weighting of 0.6, 0.3, and 0.1 was used for both d',0 and d"w.
n R The relation found between -^7 and -^- , when minimumK"6 a wdiameter was used, is described by the equation,
n _ 0.0926 BIT rr- i«yjR 0.50+2.0 log -£- rt w
The standard deviation of percentages differences is ±19.1 per-
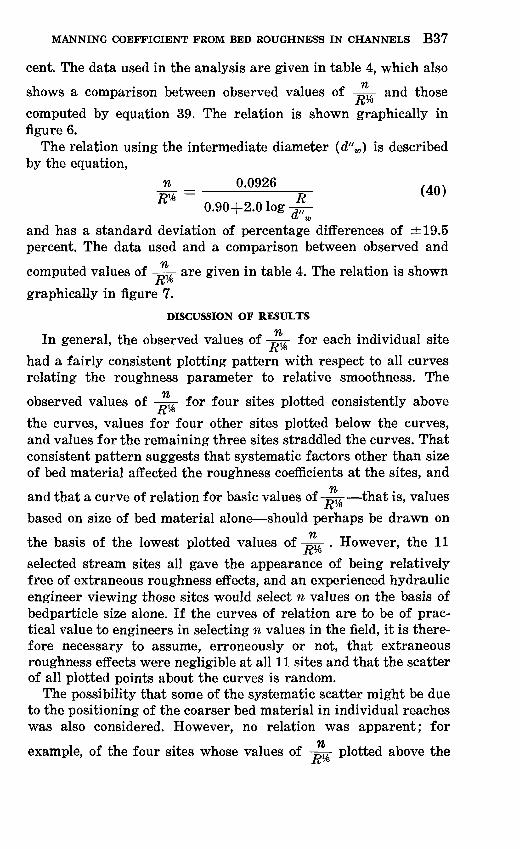
MANNING COEFFICIENT FROM BED ROUGHNESS IN CHANNELS B37
cent. The data used in the analysis are given in table 4, which alsofYL
shows a comparison between observed values of -=^7- and those
computed by equation 39. The relation is shown graphically in figure 6.
The relation using the intermediate diameter (d"w ) is described by the equation,
n 0.0926p% = W RV° 0.90+2.0 log -
and has a standard deviation of percentage differences of ±19.5 percent. The data used and a comparison between observed and
fit computed values of -=^7- are given in table 4. The relation is shown/£76
graphically in figure 7.
DISCUSSION OF RESULTS
fLIn general, the observed values of -=j- for each individual site/T,7°
had a fairly consistent plotting pattern with respect to all curves relating the roughness parameter to relative smoothness. The
77observed values of -=r- for four sites plotted consistently aboveK the curves, values for four other sites plotted below the curves, and values for the remaining three sites straddled the curves. That consistent pattern suggests that systematic factors other than size of bed material affected the roughness coefficients at the sites, and
77and that a curve of relation for basic values of -^r that is, values based on size of bed material alone should perhaps be drawn on
fn
the basis of the lowest plotted values of - T- . However, the 11/[TO
selected stream sites all gave the appearance of being relatively free of extraneous roughness effects, and an experienced hydraulic engineer viewing those sites would select n values on the basis of bedparticle size alone. If the curves of relation are to be of prac tical value to engineers in selecting n values in the field, it is there fore necessary to assume, erroneously or not, that extraneous roughness effects were negligible at all 11 sites and that the scatter of all plotted points about the curves is random.
The possibility that some of the systematic scatter might be due to the positioning of the coarser bed material in individual reaches was also considered. However, no relation was apparent; for
m
example, of the four sites whose values of -=j- plotted above the

B38 STUDIES OF FLOW IN ALLUVIAL CHANNELS
0.02 -
3 4 5 6 7 8 9 10 20 30 40 50
RELATIVE SMOOTHNESS (^~)
EXPLANATION
River test reach
Austin Creek near Cazadero
» Kaweah River at Three Rivers
A
Van Duzen River near Dinsmores
D
Middle Fork Smith River at Gasquet
eMerced River at Clarks bridge
near Yosemitex
Cache Creek at Yolo
Outlet Creek near Longvale
o
Kings River below North Fork
B
Van Duzen River near Bridgeville
oMerced River at Happy Isles
bridge near Yosemiteo
Middle Fork Eel River below Black Butte River
- 0.4
- 0.3
- 0.2
FIGURE 6. Relation of roughness parameter to relative smoothness based on weighted size of minimum diameter of streambed particles.
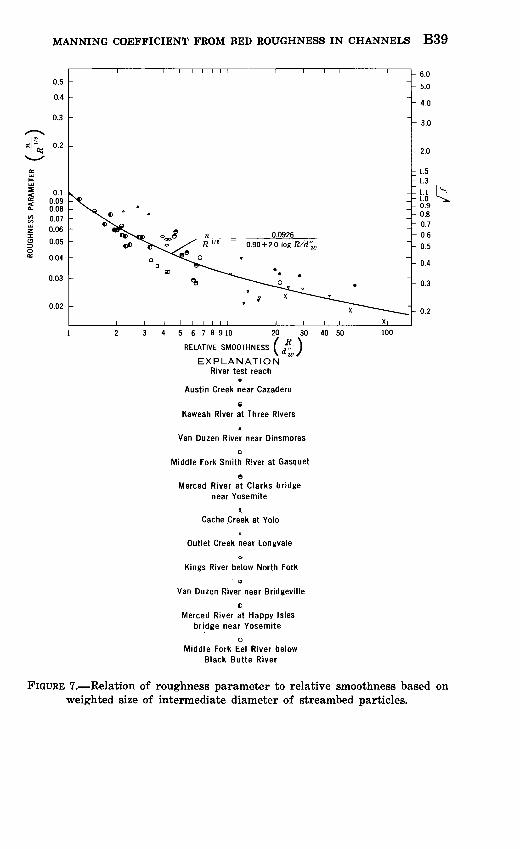
MANNING COEFFICIENT FROM BED ROUGHNESS IN CHANNELS B39
0.5
0.4
0.2
0.10.090.080.070.06
0.05
0.04
0.03
4 5 6 7 8 910 20
RELATIVE SMOOTHNESS f -
EXPLANATION River test reach
Austin Creek near Cazadero
e Kaweah River at Three Rivers
Van Duzen River near Dinsmoresa
Middle Fork Smith River at Gasquet
eMerced River at Clarks bridge
near Yosemitex
Cache Creek at Yolo
Outlet Creek near Longvaleo
Kings River below North Fork
Van Duzen River near Bridgeville
eMerced River at Happy Isles
bridge near Yosemite
oMiddle Fork Eel River below
Black Butte River
30 40 50
6.0 5.0
4.0
3.0
1.5 1.3l.l 1.0 0.9 0.8 0.7 0.6 0.5
- 0.4
- 0.3
- 0.2
FIGURE 7. Relation of roughness parameter to relative smoothness based on weighted size of intermediate diameter of streambed particles.

B40 STUDIES OF FLOW IN ALLUVIAL CHANNELS
curves of relation, one site had its coarser material evenly distrib uted through the reach, two sites had their coarser material con centrated along the centerline or thalweg of the channel, and one site had its coarser material concentrated in the shallower water near the right bank.
The relations of -=7- to -j- that best fit the field data were ob-R* dtained using either of the two characteristic particle sizes, d84 or dw . From the standpoint of best fit, there was negligible differ ence between using intermediate or minimum diameter, but because of the relative ease of obtaining measurements of inter mediate diameter either by sieving or by photographic methods it is expected that the relations using intermediate diameter will have more popular appeal.
It is not surprising that the larger particle sizes (d84 ) were shown to have greater effect on flow retardation then the smaller particle sizes, because the influence of the larger particles ex tends over a relatively greater volume of channel. Furthermore, the smaller particles are often in the wake of the turbulence created by the larger particles. Leopold and others (1964) have stated that a single flow-resistance parameter involving bed-particle size should use a size larger than d50 . Finer particles in the channel also have a lesser retarding effect during high flow because at that time they may move as suspended or bedload material, although this fine material is commonly replaced by the deposition of ma terial of similar size when the stage of the stream falls. Large quantities of fine material in suspension may also reduce the re tardation effect by dampening turbulence, but in this study the sites were so selected that they were relatively free of bed material that was as fine as sand.
The results obtained by the use of d84 and dw are summarized in table 5 which shows that the equations using d8 ± gave slightly better results than those using dw . The failure of the use of dw to improve the results obtained using d84 is attributed to the fact that the pattern of scatter of points about the curves was consistent, regardless of the characteristic particle size used. Usually, it is found that, if the pattern of scatter varies in individual correla tions involving each of several elements of similar type, an im proved correlation results if a weighted composite value of the individual elements is used.
The slightly better results obtained by using rf84 , combined with the fact that the computations using d84 are somewhat simpler than those using dw, makes the use of d84 attractive. It is difficult, how-

MANNING COEFFICIENT FROM BED ROUGHNESS IN CHANNELS B41
TABLE 5. Comparison of results of correlations using dg4 and dw
Minimum diameter, d' Intermediate diameter, d"
-, , ,. ,. 0.0926 0.0926 0.0926 0.0926 Correlation equation^. - =-
0.76+2.0 log 0.50+2.0 log -p 1.16+2.0 log -j 0.90+2.0 log -y "'84 d' »"84 " IK
Coefficient of correlation . _ 0.89 0.87 0.88 0.87
Standard error of estimate, in units of
.0087 .0092 .0087 .0092
Mean percentage difference without
Standard deviation of percentage differences . ±18.6
15.6 15.5 16.1
±19.1 ±19.0 ±19.5
ever, to rationalize the use of <284 because of implication that the distribution of sizes is irrelevant, and it matters not at all whether 84 percent of the bed material is sand or whether it is large cobbles, as long as 16 percent of the material is of greater size. Conse quently, the author recommends the use of dw rather than <284, although there was no unanimity of opinion on this recommenda tion among his colleagues who reviewed this paper. The reader is free to make his own choice between the use of d%± and dw .
RELATION OF ROUGHNESS PARAMETER TO VELOCITY RATIO
The twenty-seven velocity ratios (x) given in the last column of table 1 were correlated with corresponding values of the roughness
/ % \ _ parameter (-=7- . It will be recalled that x is the area-weighted
V R Iratio of velocities at the 0.2 and 0.8 depths. Figure 8 shows the roughness parameter plotted against natural values of of; figure 9 shows the roughness parameter plotted against logarithmic values of ~x. Equations of the straight lines best fitting the plotted points are shown in figures 8 and 9. The two correlations had identical
vt
standard errors of estimate, 0.011 in units of-^, and identical
correlation coefficients, 0.41. Although the magnitude of the standard error of estimate is on the order of those found in the previously described relations using relative smoothness, the cor relation using velocity ratios is poor. This seeming anomaly re-
*i fleets the fact that the 27 values of -=7-, for which velocity ratios
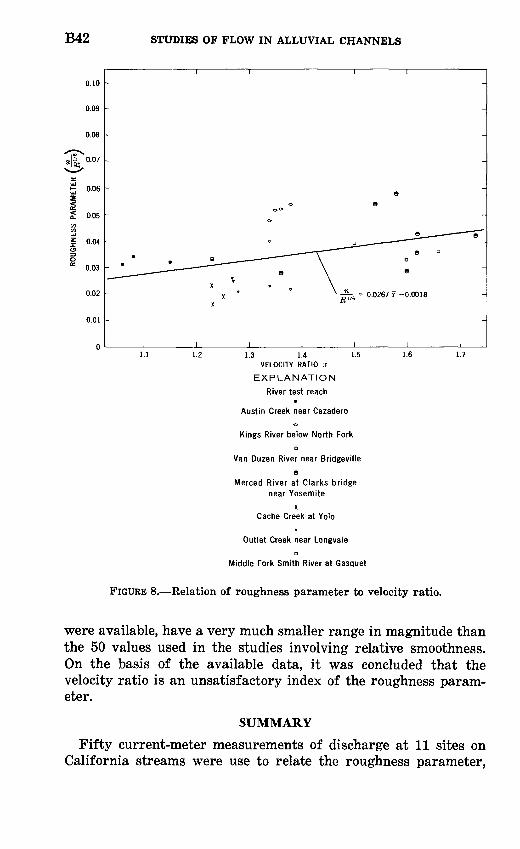
B42 STUDIES OF FLOW IN ALLUVIAL CHANNELS
0.10
0.09
0.08
t
0.06
0.05
0.04
0.03
0.02
0.01
K = 0.0267 x- 0.0018
1.1 1.2 1.3 1.4 _ 1.5 1.6 1.7 VELOCITY RATIO x
EXPLANATION
River test reach
Austin Creek near Cazaderoo
Kings River below North Fork
a
Van Duzen River near Bridgeville
eMerced River at Clarks bridge
near Yosemitex
Cache Creek at Yolo
Outlet Creek near LongvaleD
Middle Fork Smith River at Gasquet
FIGURE 8. Relation of roughness parameter to velocity ratio.
were available, have a very much smaller range in magnitude than the 50 values used in the studies involving relative smoothness. On the basis of the available data, it was concluded that the velocity ratio is an unsatisfactory index of the roughness param eter.
SUMMARY
Fifty current-meter measurements of discharge at 11 sites on California streams were use to relate the roughness parameter,
MANNING COEFFICIENT FROM BED ROUGHNESS IN CHANNELS B43
o.io 0.20 0.250.15 LOG ~x
EXPLANATION
River test reach
Austin Creek near Cazaderoo
Kings River below North Forko
Van Duzen River near Bridgevillee
Merced River at Clarks bridge near Yosemite
x Cache Creek at Yolo
Outlet Creek near Longvalea
Middle Fork Smith River at Gasquet
FIGURE 9. Relation of roughness parameter to logarithmic values ofvelocity ratio.
Mt T>
DJT , to relative smoothness, -j-, where d is a characteristic bed-K aparticle size obtained from a cumulative frequency distribution of the diameters of randomly sampled surficial bed material. Separate distributions were computed for the minimum and intermediate values of the three diameters of the particles measured. The in vestigation was confined to channels with coarse bed material to avoid the complication of bed-form roughness that is associated

B44 STUDIES OF FLOW IN ALLUVIAL CHANNELS
with alluvial channels composed of fine bed material. Because basic values of n were sought those attributable solely to the size and size distribution of bed material the sites selected for study were relatively free of the extraneous flow-retarding effects asso ciated with irregular channel conformation and streambank vegeta tion.
Three characteristic bed-particle sizes were investigated the 84 percentile (d84 ), the 50 percentile (d50 ), and the 16 percentile (e^e). In addition, a weighted composite size (du,) was tested, using a weight of 0.6 for the 84-percentile size, a weight of 0.3 for the 50- percentile size, and a weight of 0.1 for the 16-percentile size. Best results were obtained using either dS4 or dw, but it made little difference in the reliability of the results whether the study was confined to the minimum or to the intermediate diameter. Results obtained using d8 ± and d l(. for both minimum, and intermediate diameters are summarized in table 5. Because of the relative ease of obtaining measurements of the intermediate diameter either by sieving or by photographic methods use of the intermediate diameter will probably have more appeal. The relations obtained
between ^7- and ^ were of the form R* dn 0.0926
, O A 1a+2.0 log -r
the only difference in the equations being in the values of the con stant a, which varied with size (d84 or dw ) and diameter (minimum or intermediate) used. The above equation is virtually identical with the theoretical equations presented by Chow (1959) and Vennard (1961) and that derived from field data by Leopold and Wolman (1957).
The standard deviation of the percentage differences between*YL
observed and computed values of - r- was about 19 percent when
c?84 was used, and only slightly more than 19 percent when dw was used. The slightly better results obtained by using rf84 , combined with the fact that the computations using d8 ± are somewhat simpler than those using du., makes the use of d8 ± attractive. It is difficult, however, to rationalize the use of d8 ± because of the implication that the distribution of sizes is irrelevant, and it matters not at all whether 84 percent of the bed material is sand or whether it is large cobbles, as long as 16 percent of the material is of greater size. Consequently, the author recommends the use of dw rather than d84 , although there was no unanimity of opinion on this

MANNING COEFFICIENT FROM BED ROUGHNESS IN CHANNELS B45
recommendation among his colleagues who reviewed this paper. The reader is free to make his own choice between the use of d^ and dw.
As an adjunct to this study an attempt was made to relate theti roughness parameter, -=7-, to the ratio of velocities at two-tenthsK /Q
depth (V0 .2j/) and at eight-tenths depth (Vo. 8v ~). These are the two depths at which velocity is usually observed when current-meter measurements of discharge are made. Twenty-seven sets of such velocity data, obtained at eight sites, were available from the discharge measurements made in connection with this study of the effect of streambed particle size. Unfortunately, the range in
/M
magnitude of the 27 values of -^77 was small, and therefore theRMti
small standard error of estimate obtained by correlating -=7-, withK /&
the velocity ratio had little significance by itself. The correlation coefficient, 0.41, was low, and it was therefore concluded that on the basis of the available data the velocity ratio is an unsatis factory index of the roughness parameter.

B46 STUDIES OF FLOW IN ALLUVIAL CHANNELS
REFERENCES CITED
Barnes, H. H., Jr., 1967, Eoughness characteristics of natural channels: U. S.Geol. Survey Water-Supply Paper, 1849, 213 p.
Bazin, H. E., 1865, Eecherches hydrauliques, Memoires presentes par deverssavants, science mathematiques et physiques: Paris, ser. 2, v. 19.
1897, A new formula for the calculation of discharge in open channels:Annales ponts et chaussees, Mem. 14, v. 14, ser. 7, 4th quarter, p. 20-70.
Benson, M. A., and Dalrymple, Tate, 1967, General field and office proceduresfor indirect discharge measurements: U. S. Geol. Survey TechniquesWater-Resources Inv., book 3, chap. Al.
Boyer, M. C., 1954, Estimating the Manning coefficient from an average bedroughness in open channels: Am. Geophys. Union Trans., v. 35, no. 6,pt. 1, p. 957-961.
Carter, E. W., and others, 1963, Friction factors in open channels, progressreport of the task force on friction factors in open channels of the com mittee on hydromechanics of the hydraulic division: Am. Soc. Civil Engi neers Proc., v. 89, no. HY2, pt. 1, p. 97-143.
Chow, V. T., 1959, Open-channel hydraulics: New York, McGraw-Hill BookCo., 680 p.
Dalrymple, Tate, and Benson, M. A., 1967, Measurement of peak dischargeby the slope-area method: U. S. Geol. Survey Techniques Water-ResourcesInv., book 3, chap. A2.
Darcy, H. P., 1854, Sur des recherches experimentales relatives au mouvementdes eaux dans les tuyaux. (Experimental researches on the flow of waterin pipes.) : Acad. Sci. Comptes rendus, v. 38, p. 1109-1121.
Graf, W. H., 1966, On the determination of the roughness coefficient in naturaland artificial waterway: Internat. Assoc. Sci. Hydrology Bull., llth year,no. 1, p. 59-68.
Herschel, Clemens, 1897, On the origin of the Chezy formula [and discus sions] : Assoc. Eng. Soc. Jour., Jan.-June 1897, v. 18, p. 363-369.
Kolupaila, Steponas, 1930, Ueber die Verteilung der Geschwindigkeiten aufder Lotrechten des Stromes. (Upon the distribution of velocities along avertical of a stream.) : Hydrologische Konferenz der Baltischen Staaten,3d, Warszawa, 39 p.
Keulegan, G. H., 1938, Laws of turbulent flow in open channels: ResearchPaper 1151 (U.S.) Natl. Bur. Standards Jour. Research, v. 21, p. 707-741.
Leopold, L. B., and others, 1964, Fluvial processes in geomorphology: SanFrancisco and London, W. H. Freeman & Co., 522 p.
Leopold, L. B., and Wolman, M. G., 1957, River channel patterns; braided,meandering, and straight: U. S. Geol. Survey Prof. Paper 282-B, 85 p.
Manning, Robert, 1891, On the flow of water in open channels and pipes:Ireland, Inst. Civil Engineers Trans., v. 20, p. 161-207.
Nikuradse, Johann, 1933, Stromungsgesetze in rauhen Rohrne (Laws of flowin rough pipes) : Berlin, Ver. deutscher Ingenieure, Forschungsheft,no. 361.
Prandtl, Ludwig, 1926, Uber die ausgebildeter turbulenz (On fully developedturbulence) : Internat. Cong. Appl. Mechanics, 2d, Zurich 1962, Proc.,p. 62-74.
Robinson, A. R., and Albertson, M. L., 1952, Artificial roughness standard foropen channels: Am. Geophys. Union Trans., v. 33, no. 6, p. 881-888.
MANNING COEFFICIENT FROM BED ROUGHNESS IN CHANNELS B47
Rouse, Hunter, and Ince, Simon, 1957, History of hydraulics: Iowa City, Iowa,Inst. Hydraulic Research, 269 p.
Strickler, Alfred, 1923, Beitrage zur Frage der Geschwindigheits-formel undder Rauhegkeitszahlen fur Strome, Kanale und geschlossene Leitungen.(Some contributions to the problem of the velocity formula and roughnessfactors for rivers, canals, and closed conduits.): Bern, Switzerland, Mitt.Eidgeno assischen Amtes Wasserwirtschaft, no. 16.
Toebes, C., 1955, Discussion of estimating the Manning coefficient from anaverage bed roughness in open channels, by M. C. Boyer: Am. Geophys.Union Trans., v. 36, no. 5, p. 914-916.
Vanoni, V. A., 1941, Velocity distribution in open channels: Civil Eng., v. 11,no. 6, p. 356-357.
Vennard, J. K., 1961, Elementary fluid mechanics: New York, John Wiley &Sons, p. 297-298.
von Karman, Theodor, 1930, Mechanische Aehnlichkeit und turbulenz (Me chanical similarity and turbulence) : Internat. Cong. Appl. Mechanics, 3d,Stockholm 1930, Proc., v. 1, p. 85-92.
Weisbach, Julius, 1845, Lehrbuch der Ingenieur and Maxhinenmechanik:Brunswick, Germany, Textbook Eng. Mechanics.
Wolman, M. G., 1954, A method of sampling coarse river bed-material: Am.Geophys. Union Trans., v. 35, no. 6, p. 951-956.
U.S. GOVERNMENT PRINTING OFFICE: I97O i