Determination of Tanggamus Geothermal Prospect … · Determination of Tanggamus Geothermal...
13
Determination of Tanggamus Geothermal Prospect Area, Lampung Province, South Sumatra Based on Remote Sensing and 3D Micromine Software Dewi Gentana 1 , Emi Sukiyah 1 , Nana Sulaksana 1 , Euis Tintin Yuningsih 1 , Lobo Balia 2 1 Geology Engineering Faculty, Padjadjaran University, 2 Micromine Indonesia Keywords: Geothermal Prospect Area, Geological Structure, Geothermal Surface Manifestation, Micromine Software ABSTRACT Geothermal has big potential in Indonesia because it is in the Ring of Fire. Indonesia has around 40% of global geothermal potential, however, only ±7% of identified potential being utilized. The research was conducted in one of the geothermal prospect areas in Indonesia which entered Tanggamus District of Lampung Province in South Sumatera. This research carried out using studio and field observation methods. In studio, remote sensing interpretation by using topography and landsat imaginary maps and application of 3D micromine software and also doing field observation to provide valid data information. The purpose of this study is to evaluate the relation between structure geology and the distribution of geothermal surface manifestation based on landsat image and topographic maps with application of 3D micromine software. Interpretation of landsat and topography maps indicated that the Tanggamus geothermal prospect area controlled by a regional structure showing the trend direction of the surface temperature calculated from the landsat image 8 has range of > 50°C. Based on landsat image analysis in the study area found a phenomenon that supports the remnants of volcanic eruption which shows that in this research area located in the depression area and shows the crater phenomenon with the appearance of circular structures. The geothermal potential indication can be observed in field from geothermal manifestation on the surface, such as altered rock, hot spring, sulfates, and fumarole express the evidence of geothermal activity, indicating that the hydrothermal fluid originating from the reservoir has come out through the opening of structures or units of permeability rocks. In this geothermal prospect area the surficial thermal manifestations are indicated by the presence of fumaroles, mud pools and steam- heated water which are controlled by a NW-SE graben inside the semi-circular depression. The Micromine software is used to process all data both of landsat and topographical map to delineate the geothermal prospective areas. The trend of of high temperature inline with the lineament trend whereas based on the surface temperature maps produced, the average temperature for both samples around 25 o -29 o C, with 99.86 % in some locations have temperatures reaching 74 o C.This can be assumed that the source of the heat related to the geological structure. From field
-
Upload
truongtuyen -
Category
Documents
-
view
225 -
download
0
Transcript of Determination of Tanggamus Geothermal Prospect … · Determination of Tanggamus Geothermal...

Determination of Tanggamus Geothermal Prospect Area, Lampung Province,
South Sumatra Based on Remote Sensing and 3D Micromine Software
Dewi Gentana1, Emi Sukiyah
1, Nana Sulaksana
1, Euis Tintin Yuningsih
1, Lobo Balia
2
1 Geology Engineering Faculty, Padjadjaran University,
2Micromine Indonesia
Keywords: Geothermal Prospect Area, Geological Structure, Geothermal Surface Manifestation,
Micromine Software
ABSTRACT
Geothermal has big potential in Indonesia because it is in the Ring of Fire. Indonesia has around
40% of global geothermal potential, however, only ±7% of identified potential being utilized. The
research was conducted in one of the geothermal prospect areas in Indonesia which entered
Tanggamus District of Lampung Province in South Sumatera. This research carried out using studio
and field observation methods. In studio, remote sensing interpretation by using topography and
landsat imaginary maps and application of 3D micromine software and also doing field observation
to provide valid data information.
The purpose of this study is to evaluate the relation between structure geology and the distribution
of geothermal surface manifestation based on landsat image and topographic maps with application
of 3D micromine software. Interpretation of landsat and topography maps indicated that the
Tanggamus geothermal prospect area controlled by a regional structure showing the trend direction
of the surface temperature calculated from the landsat image 8 has range of > 50°C.
Based on landsat image analysis in the study area found a phenomenon that supports the remnants
of volcanic eruption which shows that in this research area located in the depression area and shows
the crater phenomenon with the appearance of circular structures.
The geothermal potential indication can be observed in field from geothermal manifestation on the
surface, such as altered rock, hot spring, sulfates, and fumarole express the evidence of geothermal
activity, indicating that the hydrothermal fluid originating from the reservoir has come out through
the opening of structures or units of permeability rocks. In this geothermal prospect area the
surficial thermal manifestations are indicated by the presence of fumaroles, mud pools and steam-
heated water which are controlled by a NW-SE graben inside the semi-circular depression.
The Micromine software is used to process all data both of landsat and topographical map to
delineate the geothermal prospective areas. The trend of of high temperature inline with the
lineament trend whereas based on the surface temperature maps produced, the average temperature
for both samples around 25o-29
oC, with 99.86 % in some locations have temperatures reaching
74oC.This can be assumed that the source of the heat related to the geological structure. From field
Determination of Tanggamus Geothermal Prospect Area, Lampung Province, South Sumatra Based on Remote Sensing
and 3D Micromine Software (8871)
Dewi Gentana, Emi Sukiyah, M. Lobo Balia, Nana Sulaksana and Euis Tintin Yuningsih (Indonesia)
FIG Working Week 2017
Surveying the world of tomorrow - From digitalisation to augmented reality
Helsinki, Finland, May 29–June 2, 2017
observations encounter hot springs have temperatures in ranges 40o-97.2
oC and temperature of
steaming ground in ranged between 74o-91
oC which are encountered along the fault line
Determination of Tanggamus Geothermal Prospect Area, Lampung Province, South Sumatra Based on Remote Sensing
and 3D Micromine Software (8871)
Dewi Gentana, Emi Sukiyah, M. Lobo Balia, Nana Sulaksana and Euis Tintin Yuningsih (Indonesia)
FIG Working Week 2017
Surveying the world of tomorrow - From digitalisation to augmented reality
Helsinki, Finland, May 29–June 2, 2017
Determination of Tanggamus Geothermal Prospect Area, Lampung Province,
South Sumatra Based on Remote Sensing and 3D Micromine Software
Dewi Gentana
1, Emi Sukiyah
1, Nana Sulaksana
1, Euis Tintin Yuningsih
1, Lobo Balia
2
1 Geology Engineering Faculty, Padjadjaran University,
2Micromine Indonesia
1. BACKGROUND
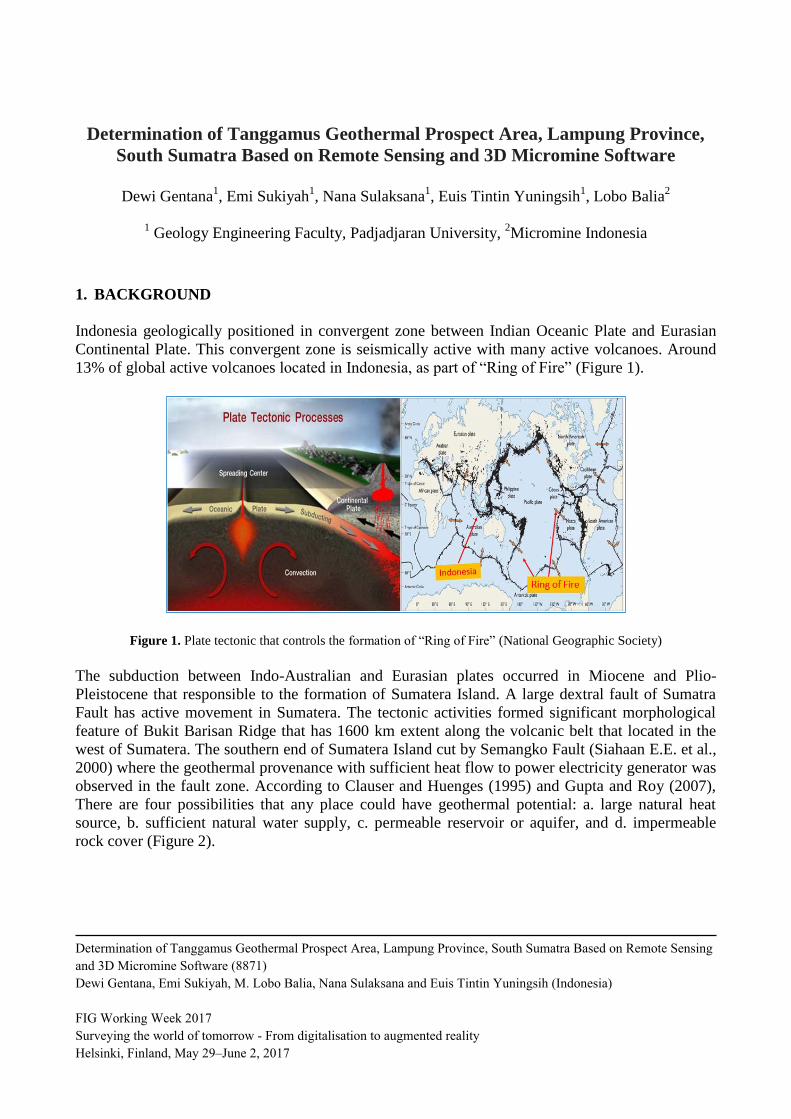
Indonesia geologically positioned in convergent zone between Indian Oceanic Plate and Eurasian
Continental Plate. This convergent zone is seismically active with many active volcanoes. Around
13% of global active volcanoes located in Indonesia, as part of “Ring of Fire” (Figure 1).
Figure 1. Plate tectonic that controls the formation of “Ring of Fire” (National Geographic Society)
The subduction between Indo-Australian and Eurasian plates occurred in Miocene and Plio-
Pleistocene that responsible to the formation of Sumatera Island. A large dextral fault of Sumatra
Fault has active movement in Sumatera. The tectonic activities formed significant morphological
feature of Bukit Barisan Ridge that has 1600 km extent along the volcanic belt that located in the
west of Sumatera. The southern end of Sumatera Island cut by Semangko Fault (Siahaan E.E. et al.,
2000) where the geothermal provenance with sufficient heat flow to power electricity generator was
observed in the fault zone. According to Clauser and Huenges (1995) and Gupta and Roy (2007),
There are four possibilities that any place could have geothermal potential: a. large natural heat
source, b. sufficient natural water supply, c. permeable reservoir or aquifer, and d. impermeable
rock cover (Figure 2).
Determination of Tanggamus Geothermal Prospect Area, Lampung Province, South Sumatra Based on Remote Sensing
and 3D Micromine Software (8871)
Dewi Gentana, Emi Sukiyah, M. Lobo Balia, Nana Sulaksana and Euis Tintin Yuningsih (Indonesia)
FIG Working Week 2017
Surveying the world of tomorrow - From digitalisation to augmented reality
Helsinki, Finland, May 29–June 2, 2017

Figure 2. Basic Concept of Geothermal Energy (modified by PT. Pertamina Geothermal Energy, unpublished)
Installed geothermal capacity has reached 12,635MWe globally (Bertani. R, 2015) which equals to
73,549 GWh electricity. In Indonesia has a geothermal potential of 27GWe and now in Indonesia
has installed capacity ± 1513.5 MW which equal to 7% of total identified geothermal potential
(Figure 3).
Figure 3. 2015 Geothermal Installed Capacity (MW) worldwide (Bertani R., 2015)
2. RESEARCH PURPOSE
The research area has geothermal potential that strongly related by the development of geological
structures and the distribution of geothermal surface manifestations. Therefore, the purpose of this
study is to evaluate the relation between structural geology and the distribution of geothermal
manifestation based on landsat image and topographic maps using micromine software to identify
the boundary of geothermal prospect areas. This information is beneficial for further exploration.
Determination of Tanggamus Geothermal Prospect Area, Lampung Province, South Sumatra Based on Remote Sensing
and 3D Micromine Software (8871)
Dewi Gentana, Emi Sukiyah, M. Lobo Balia, Nana Sulaksana and Euis Tintin Yuningsih (Indonesia)
FIG Working Week 2017
Surveying the world of tomorrow - From digitalisation to augmented reality
Helsinki, Finland, May 29–June 2, 2017
3. OBJECT AND METHODOLOGY
The research objects for this study area, the morphology, structural geology based on landsat and
topographic map. The research method for this study can be divided into two methods: studio and
field observations. Studio method carried out by interpretation of the topographic, landsat maps and
application of micromine software. Field method carried out by observation of geological structure,
geothermal surface manifestations in the field.
4. DISCUSSION
4.1. Tectonic Setting of Sumatera
Sumatera Island formed by the subduction between Indo-Australian plate and Eurasian Plate in
Plio-Pleistocene. According to Hamilton (1974), the plate interaction of western Indonesia formed
the subduction zone, increased tectonic, magmatic, and volcanic activities along the Sumatra Island.
The plate movement released the pressure gradually, forming the first order of Semangko Fault with
dextral slip movement. These activities possibly occurred in Early Miocene, where at this period the
tertiary volcanic activities formed as Lahat Formation in the southern part of South Sumatra Basin.
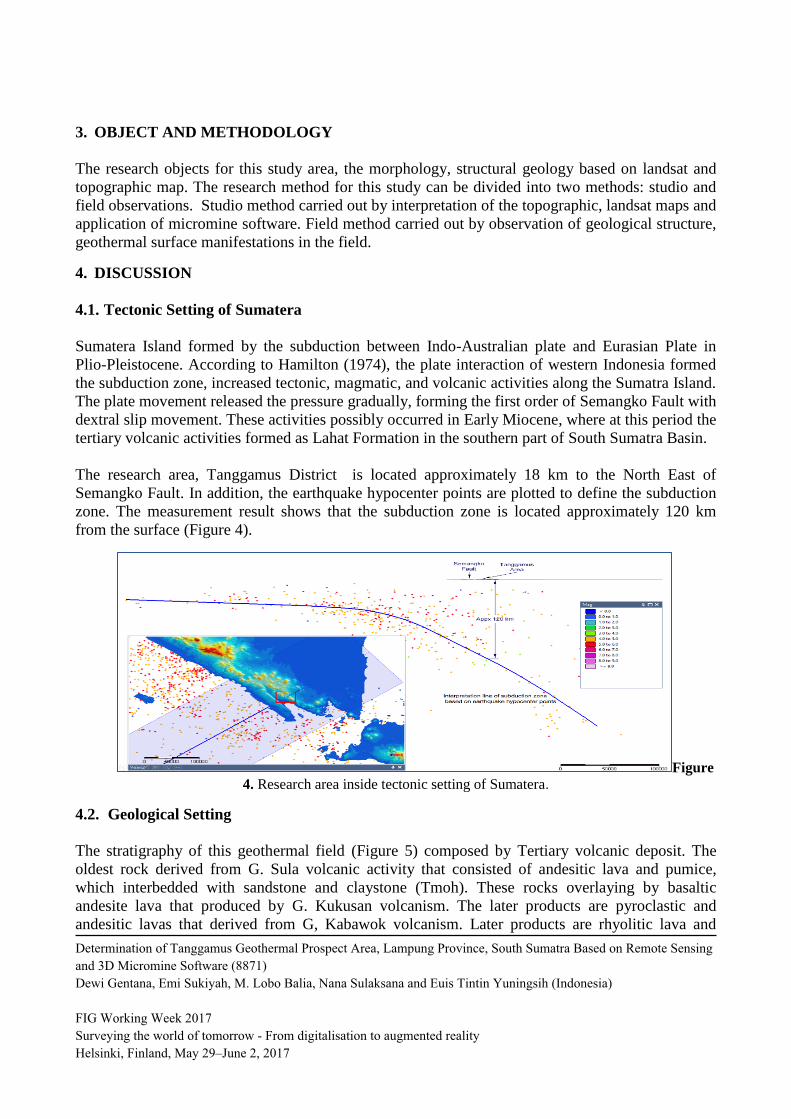
The research area, Tanggamus District is located approximately 18 km to the North East of
Semangko Fault. In addition, the earthquake hypocenter points are plotted to define the subduction
zone. The measurement result shows that the subduction zone is located approximately 120 km
from the surface (Figure 4).
Figure
4. Research area inside tectonic setting of Sumatera.
4.2. Geological Setting
The stratigraphy of this geothermal field (Figure 5) composed by Tertiary volcanic deposit. The
oldest rock derived from G. Sula volcanic activity that consisted of andesitic lava and pumice,
which interbedded with sandstone and claystone (Tmoh). These rocks overlaying by basaltic
andesite lava that produced by G. Kukusan volcanism. The later products are pyroclastic and
andesitic lavas that derived from G, Kabawok volcanism. Later products are rhyolitic lava and
Determination of Tanggamus Geothermal Prospect Area, Lampung Province, South Sumatra Based on Remote Sensing
and 3D Micromine Software (8871)
Dewi Gentana, Emi Sukiyah, M. Lobo Balia, Nana Sulaksana and Euis Tintin Yuningsih (Indonesia)
FIG Working Week 2017
Surveying the world of tomorrow - From digitalisation to augmented reality
Helsinki, Finland, May 29–June 2, 2017
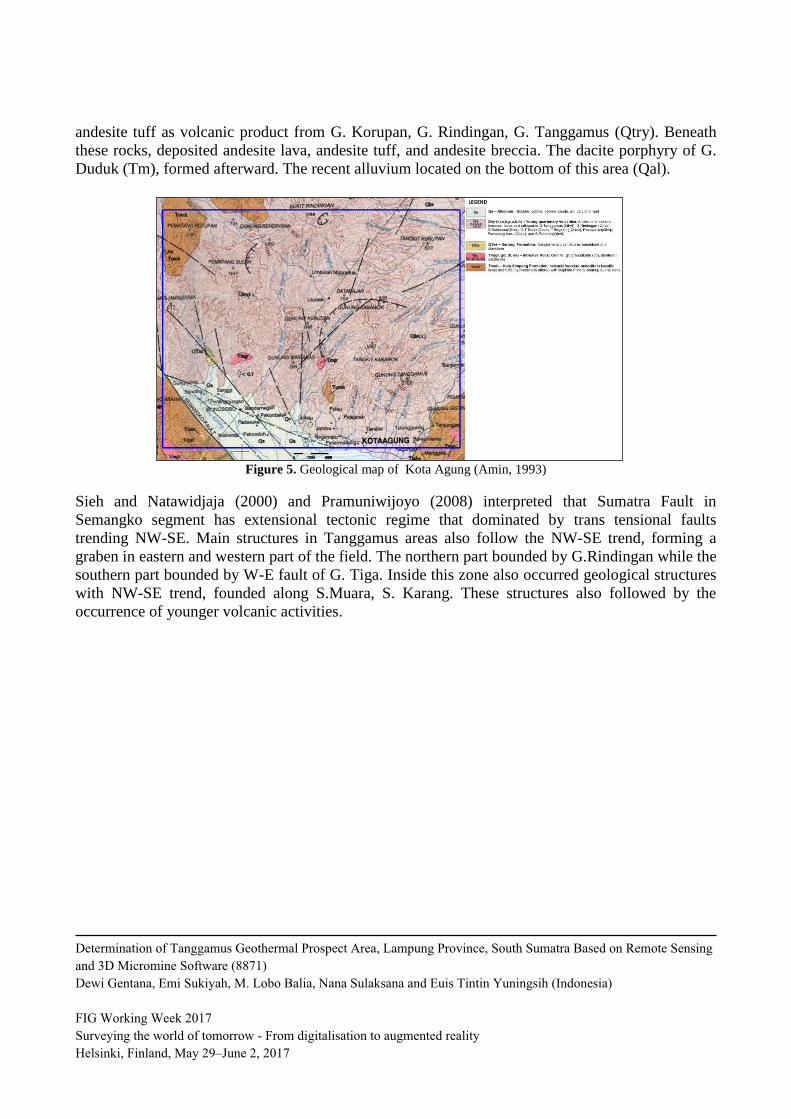
andesite tuff as volcanic product from G. Korupan, G. Rindingan, G. Tanggamus (Qtry). Beneath
these rocks, deposited andesite lava, andesite tuff, and andesite breccia. The dacite porphyry of G.
Duduk (Tm), formed afterward. The recent alluvium located on the bottom of this area (Qal).
Figure 5. Geological map of Kota Agung (Amin, 1993)
Sieh and Natawidjaja (2000) and Pramuniwijoyo (2008) interpreted that Sumatra Fault in
Semangko segment has extensional tectonic regime that dominated by trans tensional faults
trending NW-SE. Main structures in Tanggamus areas also follow the NW-SE trend, forming a
graben in eastern and western part of the field. The northern part bounded by G.Rindingan while the
southern part bounded by W-E fault of G. Tiga. Inside this zone also occurred geological structures
with NW-SE trend, founded along S.Muara, S. Karang. These structures also followed by the
occurrence of younger volcanic activities.
Determination of Tanggamus Geothermal Prospect Area, Lampung Province, South Sumatra Based on Remote Sensing
and 3D Micromine Software (8871)
Dewi Gentana, Emi Sukiyah, M. Lobo Balia, Nana Sulaksana and Euis Tintin Yuningsih (Indonesia)
FIG Working Week 2017
Surveying the world of tomorrow - From digitalisation to augmented reality
Helsinki, Finland, May 29–June 2, 2017

Figure 6. Lineaments interpretation based on 3D digital terrain model generated from RBI contour map.
Lineament interpretation have been made from morphology from RBI topographic contour map.
Emphasizing the lineament features, the 3D topographic triangulation model is generated from the
contour (Figure 6). In addition, azimuth and dip of every single triangle is calculated to provide
numeric values that can be colourized. The orange colour represent triangle that having azimuth N
270o E – N 310
oE. It mean that orange colour area mostly have NE-SW lineaments.
The crater of G. Rindingan opens to the south whereas this crater structure is important as northern
boundary of the geothermal system. The circular subsidence structure can be observed on western
and southern part as result of Plio-Pleistocene tectonism. This structure controls the geothermal
manifestation in Tanggamus area which also controls the distribution of geothermal surfaces
manifestation, such as steam heated sulfate water and mud pool (Figure 7).
From field observation, the NW-SE fault inside the semi-circular depression graben also controls
the occurrence of fumarole, mud pool, and steam-heated water. The NE-SW fault which in the
middle of Tanggamus area controls the occurrence of geothermal manifestation in Pagar Alam and
Karang Rejo areas as steam heated sulfate water and mud pools (Figure 8 and 9). The hot springs,
mud pool have temperature in ranges 40o-97.2
oC and the steaming grounds have temperature in
ranges 74o-91
oC. The evident of fault activities showed by fault scraps and scrap breccia was found
at Pagar Alam location.
Determination of Tanggamus Geothermal Prospect Area, Lampung Province, South Sumatra Based on Remote Sensing
and 3D Micromine Software (8871)
Dewi Gentana, Emi Sukiyah, M. Lobo Balia, Nana Sulaksana and Euis Tintin Yuningsih (Indonesia)
FIG Working Week 2017
Surveying the world of tomorrow - From digitalisation to augmented reality
Helsinki, Finland, May 29–June 2, 2017
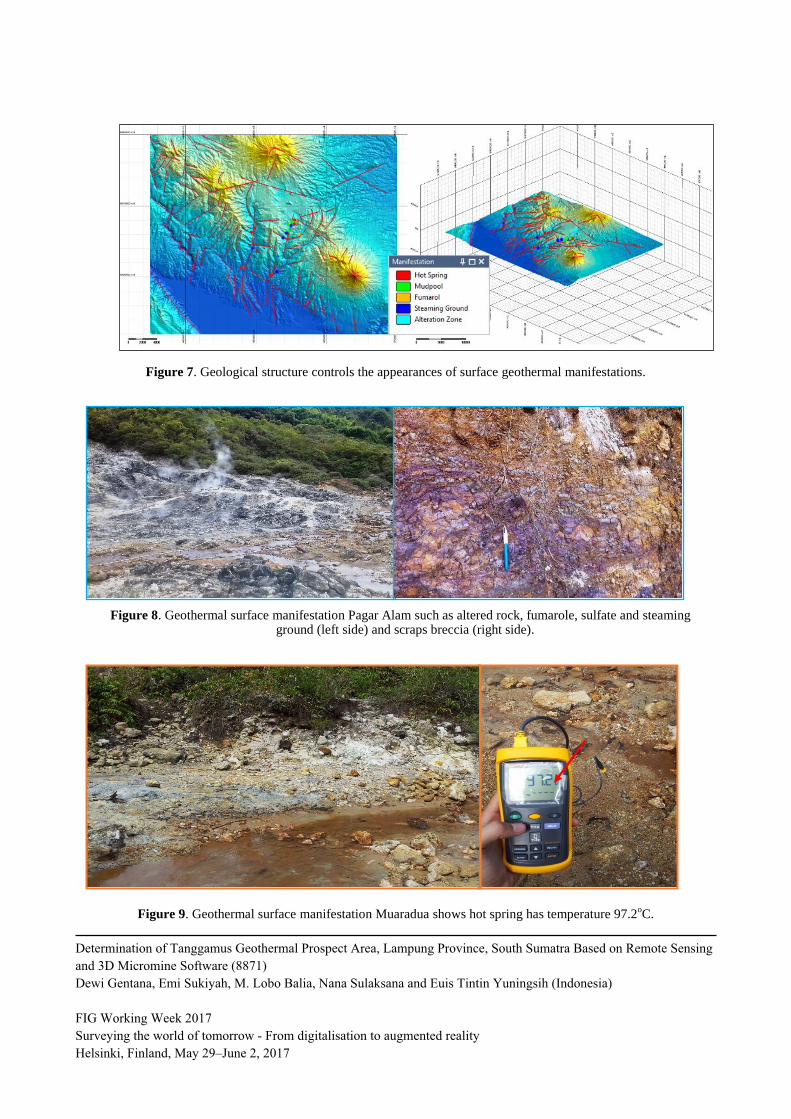
Figure 7. Geological structure controls the appearances of surface geothermal manifestations.
Figure 8. Geothermal surface manifestation Pagar Alam such as altered rock, fumarole, sulfate and steaming ground (left side) and scraps breccia (right side).
Figure 9. Geothermal surface manifestation Muaradua shows hot spring has temperature 97.2oC.
Determination of Tanggamus Geothermal Prospect Area, Lampung Province, South Sumatra Based on Remote Sensing
and 3D Micromine Software (8871)
Dewi Gentana, Emi Sukiyah, M. Lobo Balia, Nana Sulaksana and Euis Tintin Yuningsih (Indonesia)
FIG Working Week 2017
Surveying the world of tomorrow - From digitalisation to augmented reality
Helsinki, Finland, May 29–June 2, 2017
4.3 Landsat 8 processing
Landsat image is used to create land surface temperature. Land Surfaces Temperatures (LST) can
be defined as how hot the surface of the Earth would feel to the touch in a location (earth
observatory.nasa.gov).The data used for generating LST are Landsat 8 OLI/TIRS corridor 124064
dated 12/June/2016 and 19 November/2016.
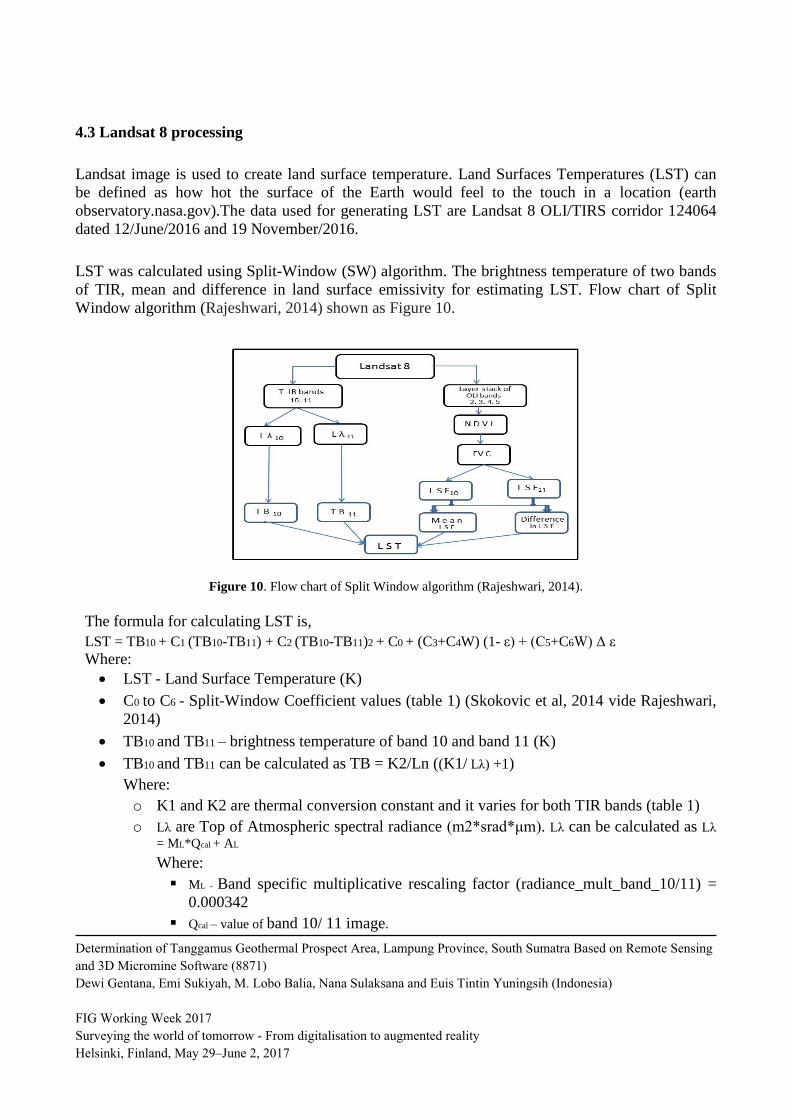
LST was calculated using Split-Window (SW) algorithm. The brightness temperature of two bands
of TIR, mean and difference in land surface emissivity for estimating LST. Flow chart of Split
Window algorithm (Rajeshwari, 2014) shown as Figure 10.
Figure 10. Flow chart of Split Window algorithm (Rajeshwari, 2014).
The formula for calculating LST is,
LST = TB10 + C1 (TB10-TB11) + C2 (TB10-TB11)2 + C0 + (C3+C4W) (1- ε) + (C5+C6W) Δ ε
Where:
LST - Land Surface Temperature (K)
C0 to C6 - Split-Window Coefficient values (table 1) (Skokovic et al, 2014 vide Rajeshwari,
2014)
TB10 and TB11 – brightness temperature of band 10 and band 11 (K)
TB10 and TB11 can be calculated as TB = K2/Ln ((K1/ Lλ) +1)
Where:
o K1 and K2 are thermal conversion constant and it varies for both TIR bands (table 1)
o Lλ are Top of Atmospheric spectral radiance (m2*srad*μm). Lλ can be calculated as Lλ
= ML*Qcal + AL
Where:
ML - Band specific multiplicative rescaling factor (radiance_mult_band_10/11) =
0.000342
Qcal – value of band 10/ 11 image.
Determination of Tanggamus Geothermal Prospect Area, Lampung Province, South Sumatra Based on Remote Sensing
and 3D Micromine Software (8871)
Dewi Gentana, Emi Sukiyah, M. Lobo Balia, Nana Sulaksana and Euis Tintin Yuningsih (Indonesia)
FIG Working Week 2017
Surveying the world of tomorrow - From digitalisation to augmented reality
Helsinki, Finland, May 29–June 2, 2017
AL - Band specific additive rescaling factor (radiance_add_band_10/11) = 0.1
ε – mean LSE of TIR bands. ε can be calculated as ε = (ε10- ε11)/2
Δ ε – Difference in LSE. Δ ε can be calculated as Δε = ε10- ε11
Where ε is LSE from band 10 and band 11 with formul ε = εs (1-FVC) + εv * FVC
Where:
o FVC is Fractional Vegetation Cover. For every band
FVC= (NDVI – NDVIs) /(NDVIv – NDVIs)
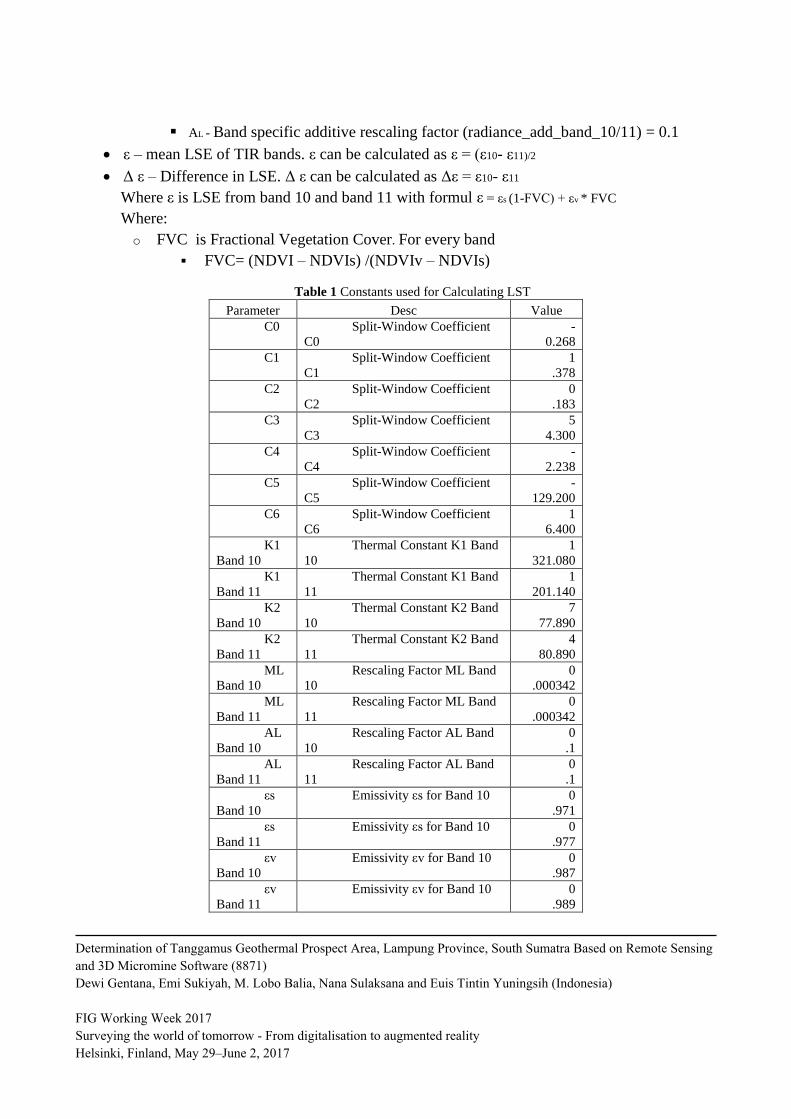
Table 1 Constants used for Calculating LST
Parameter Desc Value
C0 Split-Window Coefficient
C0
-
0.268
C1 Split-Window Coefficient
C1
1
.378
C2 Split-Window Coefficient
C2
0
.183
C3 Split-Window Coefficient
C3
5
4.300
C4 Split-Window Coefficient
C4
-
2.238
C5 Split-Window Coefficient
C5
-
129.200
C6 Split-Window Coefficient
C6
1
6.400
K1
Band 10
Thermal Constant K1 Band
10
1
321.080
K1
Band 11
Thermal Constant K1 Band
11
1
201.140
K2
Band 10
Thermal Constant K2 Band
10
7
77.890
K2
Band 11
Thermal Constant K2 Band
11
4
80.890
ML
Band 10
Rescaling Factor ML Band
10
0
.000342
ML
Band 11
Rescaling Factor ML Band
11
0
.000342
AL
Band 10
Rescaling Factor AL Band
10
0
.1
AL
Band 11
Rescaling Factor AL Band
11
0
.1
εs
Band 10
Emissivity εs for Band 10 0
.971
εs
Band 11
Emissivity εs for Band 10 0
.977
εv
Band 10
Emissivity εv for Band 10 0
.987
εv
Band 11
Emissivity εv for Band 10 0
.989
Determination of Tanggamus Geothermal Prospect Area, Lampung Province, South Sumatra Based on Remote Sensing
and 3D Micromine Software (8871)
Dewi Gentana, Emi Sukiyah, M. Lobo Balia, Nana Sulaksana and Euis Tintin Yuningsih (Indonesia)
FIG Working Week 2017
Surveying the world of tomorrow - From digitalisation to augmented reality
Helsinki, Finland, May 29–June 2, 2017
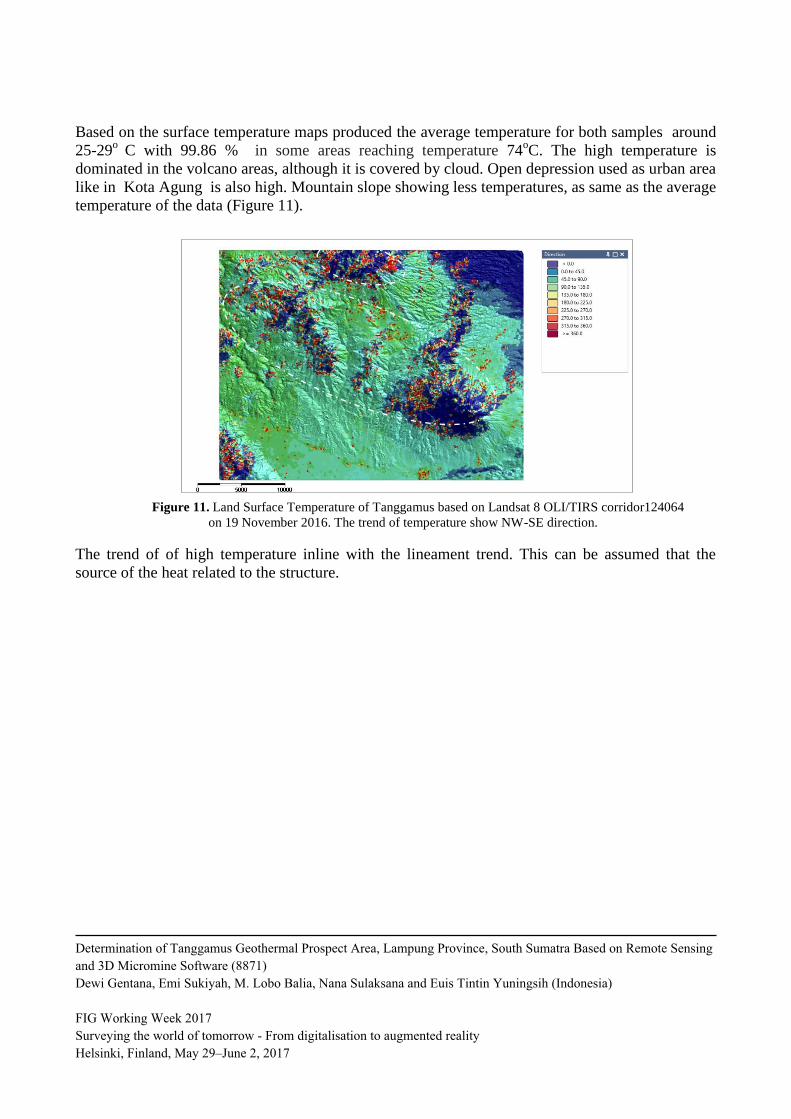
Based on the surface temperature maps produced the average temperature for both samples around
25-29o
C with 99.86 % in some areas reaching temperature 74oC. The high temperature is
dominated in the volcano areas, although it is covered by cloud. Open depression used as urban area
like in Kota Agung is also high. Mountain slope showing less temperatures, as same as the average
temperature of the data (Figure 11).
Figure 11. Land Surface Temperature of Tanggamus based on Landsat 8 OLI/TIRS corridor124064
on 19 November 2016. The trend of temperature show NW-SE direction.
The trend of of high temperature inline with the lineament trend. This can be assumed that the
source of the heat related to the structure.
Determination of Tanggamus Geothermal Prospect Area, Lampung Province, South Sumatra Based on Remote Sensing
and 3D Micromine Software (8871)
Dewi Gentana, Emi Sukiyah, M. Lobo Balia, Nana Sulaksana and Euis Tintin Yuningsih (Indonesia)
FIG Working Week 2017
Surveying the world of tomorrow - From digitalisation to augmented reality
Helsinki, Finland, May 29–June 2, 2017

Figure 12. Geothermal prospect of Tanggamus Area.
5. CONCLUSION
From the landsat imaginary, topographic map, field observation and application of micromine
software analyses it can be concluded that:
1. Geological structure that developed in the study area especially encountered through G.
Rindingan, G. Kabawok and G. Tanggamus formed the geothermal potential belt by having the
same trend direction with NW-SE faults and the phenomenon that supports the remnants of
volcanic eruption shows the appearances of circular structure.
2. The result of Landsat Surface Temperature (LST) calculation shows the area having surface
temperature more than 50oC related to the trending of geological structure. This is also supported
by observations in the field.
3. Tanggamus area is estimated have geothermal prospect with an area of about 66 km2, where in this
geothermal prospect area the surficial thermal manifestations are indicated by the presence of
fumaroles, mud pools and steam-heated water which are controlled by a NW-SE graben inside the
semi-circular depression. The hot springs have temperatures in range of 40o - 97
oC, steaming
ground with temperatures ranging from 74o -91
oC. Therefore the SW-NE and NW-SE faults
control the occurrence of the Tanggamus geothermal prospects area.
4. Understanding the trends of regional structures, structural developments, dispersal and occurrence
of geothermal surface manifestations in the study area may assist in setting up an advanced
exploration survey strategy.
Determination of Tanggamus Geothermal Prospect Area, Lampung Province, South Sumatra Based on Remote Sensing
and 3D Micromine Software (8871)
Dewi Gentana, Emi Sukiyah, M. Lobo Balia, Nana Sulaksana and Euis Tintin Yuningsih (Indonesia)
FIG Working Week 2017
Surveying the world of tomorrow - From digitalisation to augmented reality
Helsinki, Finland, May 29–June 2, 2017
Acknowledgments addressed to: Siahaan E.E. (PT Pertamina Geothermal Energy), Fajar Setiawan
(Micromine Indonesia) and Felix Sihombing (Geologist) for a discussion related to this paper.
REFERENCES
Amin, T.C., Sidarto, Santosa, S., and Gunawan, W. 1993 Geological Map of Kota Agung
Quadrangle, Sumatera, Center of Geological Survey, Bandung
Bertani, R., 2015, Geothermal Power Generation in the World 2010-2014 Update Report.
Proceedings World Geothermal Congress 2015 Melbourne, Australia 19-25 April 2015
Gupta, H. and Roy, S., 2007, Geothermal Energy an Alternative Resource for the 21st Century,
Elsevier, Netherland.
Hamilton W., 1974. Earthquake map of the Indonesian region. USGS Misc. Invest. Ser. Ma.I-875C.
Rajeshwari, A., Mani, N.D., Estimation of land surface temperature of DingDigul District Landsat 8
Data., International Journal of Research in Engineering And Technology Volume: 03 Issue:
05 (2014).
Siahaan E.E. at al., 2000. Changing on Development Drilling Strategy Based on Geological Structure
Evidence to Generate 4X55 MW in Ulubelu Geothermal Field, Sumatra, Indonesia. Proceedings
World Geothermal Congress 2015 Melbourne, Australia 19-25 April 2015
Sieh, K., And D. Natawidjaja, 2000, Nontectonic of the Sumatran Fault, Indonesia: Journal of
Geophysical Research 105, 28,295-28,326.
Determination of Tanggamus Geothermal Prospect Area, Lampung Province, South Sumatra Based on Remote Sensing
and 3D Micromine Software (8871)
Dewi Gentana, Emi Sukiyah, M. Lobo Balia, Nana Sulaksana and Euis Tintin Yuningsih (Indonesia)
FIG Working Week 2017
Surveying the world of tomorrow - From digitalisation to augmented reality
Helsinki, Finland, May 29–June 2, 2017