
Determination of tag density required for digital transcriptome analysis: Application...
6
Determination of tag density required for digital transcriptome analysis: Application to an androgen-sensitive prostate cancer model Hairi Li a,1 , Michael T. Lovci b,1,2 , Young-Soo Kwon a , Michael G. Rosenfeld c , Xiang-Dong Fu a,3 , and Gene W. Yeo b,2,3 a Department of Cellular and Molecular Medicine, c Howard Hughes Medical Institute, and Department of Medicine, Division of Endocrinology and Metabolism, University of California, San Diego, 9500 Gilman Drive, La Jolla, CA 92093-0651; and b Crick–Jacobs Center for Computational and Theoretical Biology, Salk Institute, 10010 North Torrey Pines Road, La Jolla, CA 92037 Edited by Fred Gage, The Salk Institute for Biological Studies, San Diego, CA, and approved October 20, 2008 (received for review July 23, 2008) High-throughput sequencing has rapidly gained popularity for transcriptome analysis in mammalian cells because of its ability to generate digital and quantitative information on annotated genes and to detect transcripts and mRNA isoforms. Here, we described a double-random priming method for deep sequencing to profile double poly(A)-selected RNA from LNCaP cells before and after androgen stimulation. From 20 million sequence tags, we uncov- ered 71% of annotated genes and identified hormone-regulated gene expression events that are highly correlated with quantita- tive real time PCR measurement. A fraction of the sequence tags were mapped to constitutive and alternative splicing events to detect known and new mRNA isoforms expressed in the cell. Finally, curve fitting was used to estimate the number of tags necessary to reach a ‘‘saturating’’ discovery rate among individual applications. This study provides a general guide for analysis of gene expression and alternative splicing by deep sequencing. alternative splicing androgen-regulated gene expression in prostate cancer cells curve regression high-throughput sequencing M icroarray-based approaches, especially unbiased tiling arrays, suggest that up to 80% of the genome may be transcribed to produce a huge number of uncharacterized transcripts relative to current gene annotation (1–4). In contrast, recent transcriptome analysis by deep sequencing indicates that the vast majority of expressed transcripts in mammalian tissues and cell lines are confined to annotated genes and exons (5, 6). Although microarray- based approaches suffer from a great degree of uncertainty in relating detected hybridization signals to defined transcripts, se- quencing-based approaches tend to be overwhelmed by abundant transcripts in the cell. Construction of ‘‘normalized’’ libraries for deep sequencing might facilitate the discovery of low abundance transcripts, many of which may act as noncoding, regulatory RNA in mammalian cells. An advantage of transcriptome analysis by deep sequencing is the ability to detect structural variation of individual transcripts. It is well known that different transcripts from the same genes may be generated by differential promoter usage, heterogeneous transcrip- tional start sites and alternative 3 end formation (2). A recent Pol II ChIP-chip study indicates that protein-coding genes may have an average of 3 to 5 promoters in both the mouse and human genomes (7). Further adding to the diversity in the transcriptome is alter- native RNA processing of most protein-coding genes as a conse- quence of alternative 5 and 3 splice site choices, exon inclusion/ skipping, intron retention, and combinatorial use of alternative exons (8). It is estimated that up to 74% of human genes undergo alternative splicing, which is believed to contribute to the complex- ity of the proteome in mammalian cells (9). It is striking to note that individual laboratories now have the capacity to generate sequenced tags that are on the same order of sequenced mRNA/ESTs in publicly available databases (160K mouse mRNAs from RIKEN (10) and 30M ESTs in dbEST) accumulated over decades. However, despite recent reports on transcriptome analysis by deep sequencing (5, 6, 11), a range of practical issues remain to be addressed: How many annotated genes are detectable in a single cell type, what is the number of tags that is necessary for quantitative analysis of differentially regulated genes under different experimental conditions, to what extent can existing mRNA isoforms be detected, and how can one quantify alternative splicing by using a single or combination of existing technologies? In this report, we attempted to address these issues on an androgen-sensitive prostate cancer cell model. Using a double- random priming approach capable of generating strand-specific information, we sequenced poly(A) RNA from mock-treated or androgen-stimulated LNCaP cells on the Illumina 1G Genome Analyzer. Analysis of 10 million sequence tags generated from both control and hormone-treated cells suggests that this tag density is sufficient for quantitative analysis of gene expression. We were also able to detect a large fraction of tags corresponding to annotated alternative exons, with a subset of the tags matching known and detecting new splice junctions; however, the current tag density is insufficient to deduce quantitative differences among most detected mRNA isoforms. Based on this information, a computational model based on curve fitting was used to estimate the tag density needed for optimal detection of regulated gene expression and alternative splicing. Results and Discussion Transcriptome Analysis by Double-Random Priming. Typical RNAseq procedures used by several published studies involve random priming to convert poly(A) mRNA to double-stranded cDNA followed by linker ligation (5, 6, 12, 13). To simplify library construction for deep sequenc- ing, we devised a procedure based on double-random priming and solid phase selection (Fig. 1). In this procedure, the first random primer (octamer linked to the sequencing primer P1) was used to prime double poly(A)-selected RNA from LNCaP cells. A variation of this is to use oligo(dT) linked to the sequencing primer for analysis of total RNA without poly(A) selection. The first primer also carries a biotin moiety at the 5 end, which allows transfer of extended cDNA to streptavidin beads. The second random primer linked to the other sequencing primer (P2) was next used to prime the cDNA on the streptavidin Author contributions: G.W.Y. and X.-D.F. designed research; H.L., M.T.L., and Y.-S.K. performed research; G.W.Y., Y.-S.K., and M.G.R. contributed new reagents/analytic tools; H.L., M.T.L., X.-D.F., and G.W.Y. analyzed data; and M.T.L., H.L., X.-D.F., and G.W.Y. wrote the paper. The authors declare no conflict of interest. This article is a PNAS Direct Submission. Freely available online through the PNAS open access option. 1 H.L. and M.T.L. contributed equally to this work. 2 Present address: Department of Cellular and Molecular Medicine, University of California, San Diego, 9500 Gilman Drive, La Jolla, CA 92093-0651. 3 To whom correspondence may be addressed. E-mail: [email protected] or geneyeo@ ucsd.edu. This article contains supporting information online at www.pnas.org/cgi/content/full/ 0807121105/DCSupplemental. © 2008 by The National Academy of Sciences of the USA www.pnas.orgcgidoi10.1073pnas.0807121105 PNAS December 23, 2008 vol. 105 no. 51 20179 –20184 BIOCHEMISTRY
Transcript of Determination of tag density required for digital transcriptome analysis: Application...

Determination of tag density required for digitaltranscriptome analysis: Application to anandrogen-sensitive prostate cancer modelHairi Lia,1, Michael T. Lovcib,1,2, Young-Soo Kwona, Michael G. Rosenfeldc, Xiang-Dong Fua,3, and Gene W. Yeob,2,3
aDepartment of Cellular and Molecular Medicine, cHoward Hughes Medical Institute, and Department of Medicine, Division of Endocrinology andMetabolism, University of California, San Diego, 9500 Gilman Drive, La Jolla, CA 92093-0651; and bCrick–Jacobs Center for Computational and TheoreticalBiology, Salk Institute, 10010 North Torrey Pines Road, La Jolla, CA 92037
Edited by Fred Gage, The Salk Institute for Biological Studies, San Diego, CA, and approved October 20, 2008 (received for review July 23, 2008)
High-throughput sequencing has rapidly gained popularity fortranscriptome analysis in mammalian cells because of its ability togenerate digital and quantitative information on annotated genesand to detect transcripts and mRNA isoforms. Here, we describeda double-random priming method for deep sequencing to profiledouble poly(A)-selected RNA from LNCaP cells before and afterandrogen stimulation. From �20 million sequence tags, we uncov-ered 71% of annotated genes and identified hormone-regulatedgene expression events that are highly correlated with quantita-tive real time PCR measurement. A fraction of the sequence tagswere mapped to constitutive and alternative splicing events todetect known and new mRNA isoforms expressed in the cell.Finally, curve fitting was used to estimate the number of tagsnecessary to reach a ‘‘saturating’’ discovery rate among individualapplications. This study provides a general guide for analysis ofgene expression and alternative splicing by deep sequencing.
alternative splicing � androgen-regulated gene expression in prostatecancer cells � curve regression � high-throughput sequencing
Microarray-based approaches, especially unbiased tiling arrays,suggest that up to 80% of the genome may be transcribed to
produce a huge number of uncharacterized transcripts relative tocurrent gene annotation (1–4). In contrast, recent transcriptomeanalysis by deep sequencing indicates that the vast majority ofexpressed transcripts in mammalian tissues and cell lines areconfined to annotated genes and exons (5, 6). Although microarray-based approaches suffer from a great degree of uncertainty inrelating detected hybridization signals to defined transcripts, se-quencing-based approaches tend to be overwhelmed by abundanttranscripts in the cell. Construction of ‘‘normalized’’ libraries fordeep sequencing might facilitate the discovery of low abundancetranscripts, many of which may act as noncoding, regulatory RNAin mammalian cells.
An advantage of transcriptome analysis by deep sequencing is theability to detect structural variation of individual transcripts. It iswell known that different transcripts from the same genes may begenerated by differential promoter usage, heterogeneous transcrip-tional start sites and alternative 3� end formation (2). A recent PolII ChIP-chip study indicates that protein-coding genes may have anaverage of 3 to 5 promoters in both the mouse and human genomes(7). Further adding to the diversity in the transcriptome is alter-native RNA processing of most protein-coding genes as a conse-quence of alternative 5� and 3� splice site choices, exon inclusion/skipping, intron retention, and combinatorial use of alternativeexons (8). It is estimated that up to 74% of human genes undergoalternative splicing, which is believed to contribute to the complex-ity of the proteome in mammalian cells (9).
It is striking to note that individual laboratories now have the capacityto generate sequenced tags that are on the same order of sequencedmRNA/ESTs in publicly available databases (�160K mouse mRNAsfrom RIKEN (10) and �30M ESTs in dbEST) accumulated overdecades. However, despite recent reports on transcriptome analysis by
deep sequencing (5, 6, 11), a range of practical issues remain to beaddressed: How many annotated genes are detectable in a single celltype, what is the number of tags that is necessary for quantitativeanalysis of differentially regulated genes under different experimentalconditions, to what extent can existing mRNA isoforms be detected,and how can one quantify alternative splicing by using a single orcombination of existing technologies?
In this report, we attempted to address these issues on anandrogen-sensitive prostate cancer cell model. Using a double-random priming approach capable of generating strand-specificinformation, we sequenced poly(A)� RNA from mock-treated orandrogen-stimulated LNCaP cells on the Illumina 1G GenomeAnalyzer. Analysis of �10 million sequence tags generated fromboth control and hormone-treated cells suggests that this tagdensity is sufficient for quantitative analysis of gene expression. Wewere also able to detect a large fraction of tags corresponding toannotated alternative exons, with a subset of the tags matchingknown and detecting new splice junctions; however, the current tagdensity is insufficient to deduce quantitative differences amongmost detected mRNA isoforms. Based on this information, acomputational model based on curve fitting was used to estimatethe tag density needed for optimal detection of regulated geneexpression and alternative splicing.
Results and DiscussionTranscriptome Analysis by Double-Random Priming. Typical RNAseqprocedures used by several published studies involve random priming toconvert poly(A)� mRNA to double-stranded cDNA followed by linkerligation (5, 6, 12, 13). To simplify library construction for deep sequenc-ing, we devised a procedure based on double-random priming and solidphase selection (Fig. 1). In this procedure, the first random primer(octamer linked to the sequencing primer P1) was used to prime doublepoly(A)-selected RNA from LNCaP cells. A variation of this is to useoligo(dT) linked to the sequencing primer for analysis of total RNAwithout poly(A) selection. The first primer also carries a biotin moietyat the 5� end, which allows transfer of extended cDNA to streptavidinbeads. The second random primer linked to the other sequencingprimer (P2) was next used to prime the cDNA on the streptavidin
Authorcontributions:G.W.Y.andX.-D.F.designedresearch;H.L.,M.T.L.,andY.-S.K.performedresearch; G.W.Y., Y.-S.K., and M.G.R. contributed new reagents/analytic tools; H.L., M.T.L.,X.-D.F., and G.W.Y. analyzed data; and M.T.L., H.L., X.-D.F., and G.W.Y. wrote the paper.
The authors declare no conflict of interest.
This article is a PNAS Direct Submission.
Freely available online through the PNAS open access option.
1H.L. and M.T.L. contributed equally to this work.
2Present address: Department of Cellular and Molecular Medicine, University of California,San Diego, 9500 Gilman Drive, La Jolla, CA 92093-0651.
3To whom correspondence may be addressed. E-mail: [email protected] or [email protected].
This article contains supporting information online at www.pnas.org/cgi/content/full/0807121105/DCSupplemental.
© 2008 by The National Academy of Sciences of the USA
www.pnas.org�cgi�doi�10.1073�pnas.0807121105 PNAS � December 23, 2008 � vol. 105 � no. 51 � 20179–20184
BIO
CHEM
ISTR
Y

beads. After extensive washes, potential P2 dimers were eliminated andthe second random primed products were released from the beads byheat, leaving behind unused P1 primer, P1-extended cDNA, and
potential P1 dimers. The released products are PCR-amplified, gelpurified to enrich for amplicons in the size range of 100–300 nt,quantified, and subjected to sequencing from the P1 primer on theIllumina/Solexa flowcell.
This procedure has a number of useful features. First, it providesstrand-specific information. Second, sequencing a short region rightafter the first random priming reaction avoids cDNA artifactsresulting from extension by the hairpins formed after the first strandsynthesis (14), which may account for artifactual ‘‘antisense tran-scripts’’ seen in previous large-scale mRNA sequencing and tilinganalysis (1, 15). Third, the built-in random primer region retains themolecular memory for originally primed products allowing com-putational elimination of sequenced tags amplified by PCR, be-cause all PCR products from the same initial amplicon will haveidentical sequences in the randomized region. This strategy permitsthe use of PCR amplification without distorting the representationof the transcriptome, a feature critical for quantitative analysis ona small population of cells.
Global Statistics of Gene Expression. We obtained �10 million 36-ntsequence tags from mock- and androgen-treated LNCaP cells,respectively. To use the longest possible read for mapping the tagsto specific transcripts and to splice junctions, we only removed thefirst nucleotide from the random primer region because it contrib-utes the least to the random priming reaction (Fig. S1). By allowing2 base mismatches, we were able to uniquely align �21% of the tagsto the human genome (Fig. 2A). This is lower than previouslypublished results (5, 6, 11), but is not due to contamination in ourpurified poly(A) RNA by transcripts from repeat regions, includingrRNA, in the human genome, which together constitute �1% oftotal sequenced tags (Fig. 2A). An analysis of nucleotide frequen-cies of mapped tags suggests a degree of bias during randompriming for relatively high GC-content, especially at positions �5 to�7 (Fig. S1A). The uniquely mapped tag set also allowed us todetermine the sequencing error at each position, indicating a high
(A)nCap
1st priming Bio
P1
BioP2
Bio
BioSelection
Second Priming
Product releasing
PCR & gelpurification
cP1cP2
Fig. 1. The double random priming method for deep sequencing. The firstbiotinylated random primer consists of the sequencing primer P1 at the 5� endand a random octamer at the 3� end. Products of the first random primingreaction were selected on streptavidin beads (blue eclipse) followed by thesecond random priming reaction on the solid phase with a random octamercarrying the sequencing primer P2. After extensive washes to remove freeprimers and primer dimmers, the second random priming products werereleased from beads by heat, which were then PCR-amplified, gel-purified,and subjected to sequencing from the P1 primer.
Mock-Treated DHT-TreatedTreatment
Aligned uniquely to genome
Aligned to genome, not unique
Aligned to Exon Junctions
2,361,060 2,036,194
875,540 633,712
153,522 132,401
11,704,917 8,486,683
Not Aligned
Total
Categories
Bottom (-)-strand, DHT-Treated
Top (+)-strand, DHT-Treated
Botom (-)-strand, Control
Top (+)-strand, Control
Gene Density
Chromosome X
53,663 43,984Aligned to repetitive regions
8,261,132 5,640,392
Promoter56118 (1%)
Intergenic2179258 (38%)
Exonic2268422 (39%)
Intronic 1227585 (21%)
A
B
C
0 25 50 75 100
Tag Position (Percent of Gene Region)
Tag
s/M
egab
ase
D
Mock Treated, Anti-sense
Mock-Treated, Sense
DHT-Treated, Anti-sense
DHT-Treated, Sense
0
20
40
60
80
100
120
140
Fig. 2. Global mapping of se-quence tags. (A) Summary ofgenomic mapping results, allowing2 mismatches in 35 nt. For compar-ison, additional mapping resultsthat include tags that hit up to 5positions in the genome or withtags after removal of the first 4 ntand last 3 nt are shown in Table S1.Sequence tags mapped to splicejunctions include known junctionsand junctions determined in thisstudy. (B) Transcription from top(�) and bottom (�) strands of hu-man chromosome X. The datashowed high reproducibility withhigh (�0.7) Pearson correlation co-efficients within the same strandsand low (�0.04) correlation be-tween different strands (see TableS2). (C) Genomic distribution of se-quence tags in exons, introns, pro-moters (3 kb from transcriptionstart sites), and intergenic regions.(D) Sense and antisense transcripts.Sequence tags corresponding toboth sense and antisense tran-scripts were color-coded and dis-played on a composite mRNA mapwith the x axis showing the tag po-sition (% of spliced mRNA region)and the y axis showing the tag den-sity (tags per megabase).
20180 � www.pnas.org�cgi�doi�10.1073�pnas.0807121105 Li et al.
error rate at both the random priming region and toward the endof the sequenced tags (Fig. S1B). By including tags that were mappedup to 5 positions in the human genome and/or removing the first 4 ntand last 3 nt, we were able to progressively increase the number of‘‘mappable’’ tags (Table S1). We nevertheless elected to use the longesttags with most stringent alignment for downstream analyses.
Because of the strand specificity of our method, we were able tounambiguously assign tags to either the top (�) or the bottom (�)strand of the human genome according to the genome orientation(Fig. 2B). The tag distribution is highly reproducible as evidencedby plotting the tags along human chromosomes under two biolog-ical conditions (Fig. 2B). Furthermore, high Pearson correlationcoefficients within the same strand under different treatmentconditions and low Pearson correlation coefficients between dif-ferent strands under the same conditions indicate a high degree ofdata reproducibility and a minimal impact of global gene expressionby the hormone treatment (Table S2).
The genomic distribution of the mapped tags according tocurrent gene annotation shows that most tags are confined toprotein coding genes, although we detected a large number of tagsin intronic regions (Fig. 2C). This profile is distinct from otherpublished studies based on the Solexa platform, but comparable tothose observed by 454 sequencing (5, 6, 16). The exact reason(s) forthis discrepancy is presently unclear. We also detect a sizablefraction of tags in intergenic regions, which correspond to poten-tially new coding and noncoding transcripts but little in genepromoters, as expected (Fig. 2C).
Consistent with the observations made by large-scale full-lengthcDNA sequencing (10) and tiling array studies (1), we also detecteda sizable number of antisense transcripts and aligned both sense andantisense transcripts on the normalized gene model (Fig. 2D). Forsense transcripts, the tag density is low at the 5� end, likely due toheterogeneous transcription start and to size selection of ampliconsfor sequencing, which removes small amplicons (�100 nt) from the5� end. Interestingly, the tag density for sense transcripts declinestoward the 3� end. Although the exact reason for this is presentlyunclear, such steady decline is distinct from that at the 5� end,indicating that the pattern cannot simply be explained by size-selection or alternative 3� end formation. In contrast, most tagsaligned to antisense transcripts were detected at the 3� end ofprotein-coding genes (Fig. 2D). This profile is consistent with thebinding of many common transcription factors, including Pol II, atthe 3� end of many genes (17). Because antisense transcripts arethought to provide some regulatory function to sense transcription,their termination toward the 5� end may result from competitionwith sense transcription as suggested by the polymerase collisionmodel (18). It is yet to be determined whether any detectedsense/antisense pairs are subjected to androgen regulation.
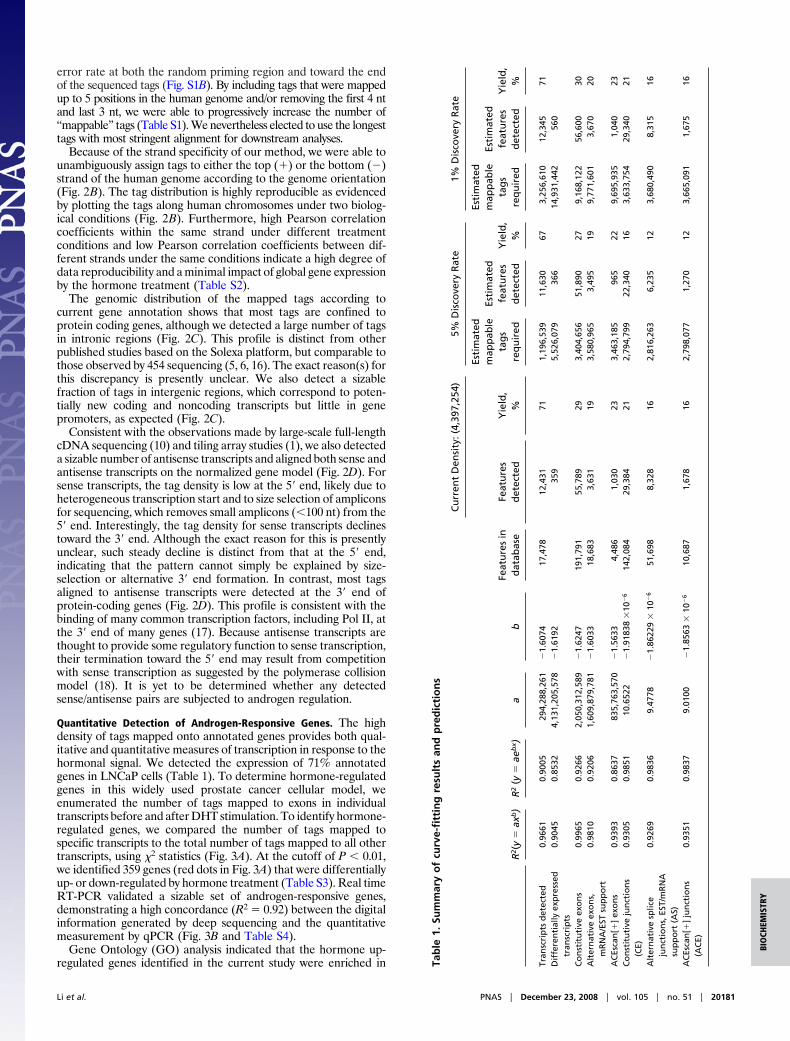
Quantitative Detection of Androgen-Responsive Genes. The highdensity of tags mapped onto annotated genes provides both qual-itative and quantitative measures of transcription in response to thehormonal signal. We detected the expression of 71% annotatedgenes in LNCaP cells (Table 1). To determine hormone-regulatedgenes in this widely used prostate cancer cellular model, weenumerated the number of tags mapped to exons in individualtranscripts before and after DHT stimulation. To identify hormone-regulated genes, we compared the number of tags mapped tospecific transcripts to the total number of tags mapped to all othertranscripts, using �2 statistics (Fig. 3A). At the cutoff of P � 0.01,we identified 359 genes (red dots in Fig. 3A) that were differentiallyup- or down-regulated by hormone treatment (Table S3). Real timeRT-PCR validated a sizable set of androgen-responsive genes,demonstrating a high concordance (R2 � 0.92) between the digitalinformation generated by deep sequencing and the quantitativemeasurement by qPCR (Fig. 3B and Table S4).
Gene Ontology (GO) analysis indicated that the hormone up-regulated genes identified in the current study were enriched in Ta
ble
1.Su
mm
ary
of
curv
e-fi
ttin
gre
sult
san
dp
red
icti
on
s
R2(y
�ax
b)
R2
(y�
aeb
x )a
bFe
atu
res
ind
atab
ase
Cu
rren
tD
ensi
ty:(
4,39
7,25
4)5%
Dis
cove
ryR
ate
1%D
isco
very
Rat
e
Feat
ure
sd
etec
ted
Yie
ld,
%
Esti
mat
edm
app
able
tag
sre
qu
ired
Esti
mat
edfe
atu
res
det
ecte
dY
ield
,%
Esti
mat
edm
app
able
tag
sre
qu
ired
Esti
mat
edfe
atu
res
det
ecte
dY
ield
,%
Tran
scri
pts
det
ecte
d0.
9661
0.90
0529
4,28
8,26
1�
1.60
7417
,478
12,4
3171
1,19
6,53
911
,630
673,
256,
610
12,3
4571
Dif
fere
nti
ally
exp
ress
edtr
ansc
rip
ts0.
9045
0.85
324,
131,
205,
578
�1.
6192
359
5,52
6,07
936
614
,931
,442
560
Co
nst
itu
tive
exo
ns
0.99
650.
9266
2,05
0,31
2,58
9�
1.62
4719
1,79
155
,789
293,
404,
656
51,8
9027
9,16
8,12
256
,600
30A
lter
nat
ive
exo
ns,
mR
NA
/EST
sup
po
rt0.
9810
0.92
061,
609,
879,
781
�1.
6033
18,6
833,
631
193,
580,
965
3,49
519
9,77
1,60
13,
670
20
AC
Esca
n[�
]ex
on
s0.
9393
0.86
3783
5,76
3,57
0�
1.56
334,
486
1,03
023
3,46
3,18
596
522
9,69
5,93
51,
040
23C
on
stit
uti
veju
nct
ion
s(C
E)0.
9305
0.98
5110
.652
2�
1.91
838
�10
�6
142,
084
29,3
8421
2,79
4,79
922
,340
163,
633,
754
29,3
4021
Alt
ern
ativ
esp
lice
jun
ctio
ns,
EST/
mR
NA
sup
po
rt(A
S)
0.92
690.
9836
9.47
78�
1.86
229
�10
�6
51,6
988,
328
162,
816,
263
6,23
512
3,68
0,49
08,
315
16
AC
Esca
n[�
]ju
nct
ion
s(A
CE)
0.93
510.
9837
9.01
00�
1.85
63�
10�
610
,687
1,67
816
2,79
8,07
71,
270
123,
665,
091
1,67
516
Li et al. PNAS � December 23, 2008 � vol. 105 � no. 51 � 20181
BIO
CHEM
ISTR
Y
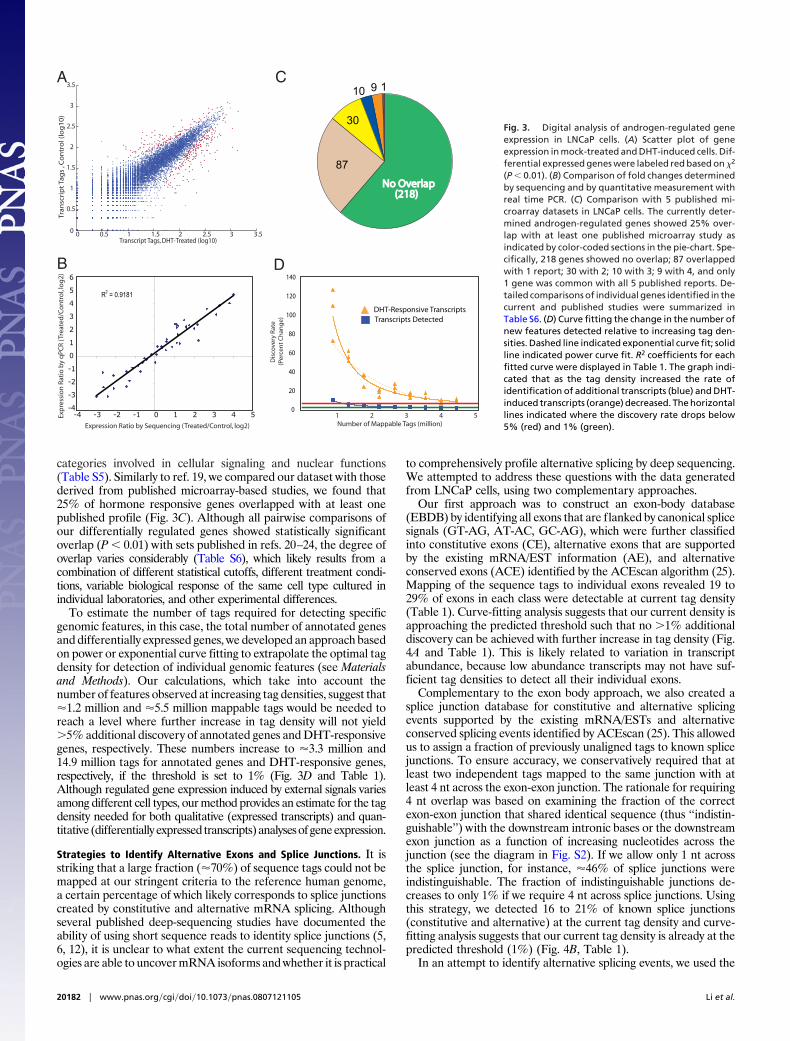
categories involved in cellular signaling and nuclear functions(Table S5). Similarly to ref. 19, we compared our dataset with thosederived from published microarray-based studies, we found that25% of hormone responsive genes overlapped with at least onepublished profile (Fig. 3C). Although all pairwise comparisons ofour differentially regulated genes showed statistically significantoverlap (P � 0.01) with sets published in refs. 20–24, the degree ofoverlap varies considerably (Table S6), which likely results from acombination of different statistical cutoffs, different treatment condi-tions, variable biological response of the same cell type cultured inindividual laboratories, and other experimental differences.
To estimate the number of tags required for detecting specificgenomic features, in this case, the total number of annotated genesand differentially expressed genes, we developed an approach basedon power or exponential curve fitting to extrapolate the optimal tagdensity for detection of individual genomic features (see Materialsand Methods). Our calculations, which take into account thenumber of features observed at increasing tag densities, suggest that�1.2 million and �5.5 million mappable tags would be needed toreach a level where further increase in tag density will not yield�5% additional discovery of annotated genes and DHT-responsivegenes, respectively. These numbers increase to �3.3 million and14.9 million tags for annotated genes and DHT-responsive genes,respectively, if the threshold is set to 1% (Fig. 3D and Table 1).Although regulated gene expression induced by external signals variesamong different cell types, our method provides an estimate for the tagdensity needed for both qualitative (expressed transcripts) and quan-titative (differentiallyexpressed transcripts)analysesofgeneexpression.
Strategies to Identify Alternative Exons and Splice Junctions. It isstriking that a large fraction (�70%) of sequence tags could not bemapped at our stringent criteria to the reference human genome,a certain percentage of which likely corresponds to splice junctionscreated by constitutive and alternative mRNA splicing. Althoughseveral published deep-sequencing studies have documented theability of using short sequence reads to identity splice junctions (5,6, 12), it is unclear to what extent the current sequencing technol-ogies are able to uncover mRNA isoforms and whether it is practical
to comprehensively profile alternative splicing by deep sequencing.We attempted to address these questions with the data generatedfrom LNCaP cells, using two complementary approaches.
Our first approach was to construct an exon-body database(EBDB) by identifying all exons that are flanked by canonical splicesignals (GT-AG, AT-AC, GC-AG), which were further classifiedinto constitutive exons (CE), alternative exons that are supportedby the existing mRNA/EST information (AE), and alternativeconserved exons (ACE) identified by the ACEscan algorithm (25).Mapping of the sequence tags to individual exons revealed 19 to29% of exons in each class were detectable at current tag density(Table 1). Curve-fitting analysis suggests that our current density isapproaching the predicted threshold such that no �1% additionaldiscovery can be achieved with further increase in tag density (Fig.4A and Table 1). This is likely related to variation in transcriptabundance, because low abundance transcripts may not have suf-ficient tag densities to detect all their individual exons.
Complementary to the exon body approach, we also created asplice junction database for constitutive and alternative splicingevents supported by the existing mRNA/ESTs and alternativeconserved splicing events identified by ACEscan (25). This allowedus to assign a fraction of previously unaligned tags to known splicejunctions. To ensure accuracy, we conservatively required that atleast two independent tags mapped to the same junction with atleast 4 nt across the exon-exon junction. The rationale for requiring4 nt overlap was based on examining the fraction of the correctexon-exon junction that shared identical sequence (thus ‘‘indistin-guishable’’) with the downstream intronic bases or the downstreamexon junction as a function of increasing nucleotides across thejunction (see the diagram in Fig. S2). If we allow only 1 nt acrossthe splice junction, for instance, �46% of splice junctions wereindistinguishable. The fraction of indistinguishable junctions de-creases to only 1% if we require 4 nt across splice junctions. Usingthis strategy, we detected 16 to 21% of known splice junctions(constitutive and alternative) at the current tag density and curve-fitting analysis suggests that our current tag density is already at thepredicted threshold (1%) (Fig. 4B, Table 1).
In an attempt to identify alternative splicing events, we used the
Tran
scri
pt
Tag
s , C
on
tro
l (lo
g1
0)
Transcript Tags, DHT-Treated (log10)
Number of Mappable Tags (million)
Dis
cove
ry R
ate
(Per
cen
t C
han
ge)
A C
B D
-4
-3
-2
-1
0
1
2
3
4
5
6
-4 -3 -2 -1 0 1 2 3 4 5
Expression Ratio by Sequencing (Treated/Control, log2)
0 0.5 1 1.5 2 2.5 3 3.50
0.5
1
1.5
2
2.5
3
3.5
R2 = 0.9181
0
20
40
60
80
100
120
140
21 3 4 5Exp
ress
ion
Rat
io b
y q
PCR
(Tre
ated
/Co
ntr
ol,
log
2)
Transcripts DetectedDHT-Responsive Transcripts
No OverlapNo Overlap(218)(218)
87
30
10 9 1
Fig. 3. Digital analysis of androgen-regulated geneexpression in LNCaP cells. (A) Scatter plot of geneexpression in mock-treated and DHT-induced cells. Dif-ferential expressed genes were labeled red based on �2
(P � 0.01). (B) Comparison of fold changes determinedby sequencing and by quantitative measurement withreal time PCR. (C) Comparison with 5 published mi-croarray datasets in LNCaP cells. The currently deter-mined androgen-regulated genes showed 25% over-lap with at least one published microarray study asindicated by color-coded sections in the pie-chart. Spe-cifically, 218 genes showed no overlap; 87 overlappedwith 1 report; 30 with 2; 10 with 3; 9 with 4, and only1 gene was common with all 5 published reports. De-tailed comparisons of individual genes identified in thecurrent and published studies were summarized inTable S6. (D) Curve fitting the change in the number ofnew features detected relative to increasing tag den-sities. Dashed line indicated exponential curve fit; solidline indicated power curve fit. R2 coefficients for eachfitted curve were displayed in Table 1. The graph indi-cated that as the tag density increased the rate ofidentification of additional transcripts (blue) and DHT-induced transcripts (orange) decreased. The horizontallines indicated where the discovery rate drops below5% (red) and 1% (green).
20182 � www.pnas.org�cgi�doi�10.1073�pnas.0807121105 Li et al.

simplest mode of alternative splicing (exon skipping) to construct ahypothetical exon-junction database (EJDB) by piecing togetherthe 35 bases at the 3� end of each internal exon to the 35 bases atthe 5� end of individual downstream exons. We next aligned thesequence tags to the EJDB, identifying 724 � 651 � 1,375 junctions,approximately half (724) of which span only constitutive exons(Table 2). Although this is by no means a comprehensive survey ofnew alternative splicing events because exon skipping is only one ofmultiple alternative splicing modes, the result indicates that the vastmajority of alternative splicing events (8) from measurable abun-dant gene transcripts has already been covered by the existingmRNA/EST databases (Table 2).
Finally, we addressed the false discovery rate in these analyses by
generating a list of ‘‘impossible’’ junctions consisting of exon junctionsequences joined in reverse order. For example, instead of splicing exon1 to exon 3, we spliced exon 3 to exon 1. Using this approach, we foundthat 472 junctions were mapped to this set of 1,929,065 scrambledjunctions, resulting in a false positive rate of 472/1,929,065 � 0.025%.This compares to 40,125 (or 2.08%) junctions that were mapped to thesame number of ‘‘possible’’ junctions, indicating a false discovery rateof 472/40125 � 1.2% among mapped junctions.
ConclusionsHigh-throughput sequencing is able to generate sequence data equiv-alent to the entire EST collection, permitting both quantitative andstructural analysis of the transcriptome in the cell. We have developeda molecular protocol, a computational pipeline for analysis of expres-sion and alternative splicing, and a curve-fitting method for estimatingthe number of tags required for detecting specific genomic features,using the deep sequencing approach. On a prostate cancer cell model,our current analysis revealed a set of androgen-responsive genes. Ourdata also suggest prevalent poly(A)� transcripts from both annotatedprotein-coding genes and intergenic regions and antisense transcripts,paving the way for further molecular analysis of regulated gene expres-sion in mammalian cells. Curve-fitting analyses also reveal limitations inusing deep sequencing to comprehensively detect alternative exons andsplice junction sequences: Even with the tag density at which �1%additional discovery is achievable, we could only detect �20% ofmRNA/EST-verified splice junctions compared with �70% of genetranscripts. Overcoming these limitations and performing comprehen-sive and quantitative measurements may require a combination ofcomplementary tools like splice junction arrays that focus on annotatedsplice junctions (9, 26, 27).
Materials and MethodsCell Culture, qPCR and Construction of cDNA Libraries. Culturing LNCaP cells andDHT treatment were as described in ref. 28. Primers used for qPCR are listed inTable S4. Poly(A)� RNA from LNCaP cells mock-treated and treated with DHT for48 h was selected twice on oligo(dT) Dynabeads (Invitrogen). Purified poly(A)�
RNA (�0.2 �g) was converted to cDNA with SuperScript III (Invitrogen) and 100pmols of the first random primer (P1: 5�- AAT GAT ACG GCG ACC ACC GAN NNNNNN N-3�). cDNA was purified with the PCR purification kit (Qiagen), blocked atthe 3� end by terminal transferase reaction with ddNTPs, and immobilized on thestreptavidin-coatedmagneticbeads (Invitrogen). cDNAonthebeadswerebrieflywashed 1� with 0.1 N NaOH and 2� with H2O before annealing of 100 pmols ofthe second random primer (P2: 5�-CAA GCA GAA GAC GGC ATA CGN NNN NNNN-3�) to the cDNA followed by extension with Taq polymerase at 25 °C for 30 minand 72 °C for 1 min. The beads were washed 2� with prewarmed wash buffer [10mM Tris (pH 7.6), 1 mM EDTA, 0.1 M NaCl, 0.1% Tween 80] and the second strandDNAelutedwithH2Oat95 °Cfor10min.TheelutedDNAwasPCR-amplifiedwithAmpliTaq Gold (Perkin–Elmer), resolved on 2% agarose gel, eluted with theQiagen PCR purification kit, and quantified on Nanodrop UV spectrometer.
Number of Tags (millions)
Dis
cove
ry R
ate
(Per
cen
t C
han
ge)
B
Dis
cove
ry R
ate
(Per
cent
Cha
nge) Constitutive Exons
ACEscan[+] ExonsSpliced Exons, mRNA/EST evidence
A
0
10
20
30
40
50
60
70
80
90
100
21 3 4 5
0
10
20
30
40
50
60
21 3 4 5Number of Tags (millions)
CE Splice Junctions
ACE Splice Junctions
AS Splice Junctions
Fig. 4. Curve fitting the change in the number of exons and splice junctionsdetected against increasing tag densities. Dashed line indicated exponentialcurve; solid line indicated power curve. R2 coefficients for each fitted curves weredisplayed in Table 1. (A) Decline in the rate of identifying additional exons as afunction of increasing tag density. (B) Decline in the rate of identifying additionalsplice junctionsasafunctionof increasingtagdensity.Thehorizontal lines inbothpanels indicate where discovery rate drops below 5% (red) and 1% (green).
Table 2. Detection of known and novel splice junctions
Exonsskipped
EST-verified Novel
CE AS ACE CE AS ACE
Databasesize
Junctionsdetected
Databasesize
Junctionsdetected
Databasesize
Junctionsdetected
Databasesize Detected
Databasesize Detected
Databasesize Detected
0 139,326 29,104 35,938 6,727 8,023 1,297 4,153 25 2,252 19 397 41 1,686 222 11,932 1,390 1,831 319 115,959 361 34,823 124 9,194 512 698 45 2,365 157 474 41 97,324 99 47,846 116 12,379 303 202 9 794 36 174 14 82,452 67 49,820 59 13,929 174 75 1 311 7 77 4 70,290 34 48,917 57 14,813 185 34 1 138 5 35 2 60,272 17 46,815 46 15,211 136 17 1 68 2 16 0 51,977 22 44,125 26 15,284 77 8 0 47 1 13 0 44,982 16 41,161 30 15,074 98 8 0 34 1 10 0 39,108 13 38,085 20 14,685 49 6 0 14 0 7 0 34,069 14 35,128 24 14,152 12
10 2 0 10 1 2 0 29,801 8 32,252 15 13,526 4¥ 142,084 29,384 51,698 8,328 10,687 1,678 929,545 724 805,738 651 376,047 222
Li et al. PNAS � December 23, 2008 � vol. 105 � no. 51 � 20183
BIO
CHEM
ISTR
Y

Approximately 0.4 fmol of PCR products was applied per lane on the Solexaflowcell for sequencing according to the manufacturer’s instruction.
Genomic Mapping of the Sequence Tags. Position-specific base compositionswere made by compiling all uniquely aligned reads. The first base of everysequence tag was discarded because of nearly random utilization at the begin-ning of all sequences. To eliminate redundancies created by PCR amplification, alltags with identical sequences were considered single reads. After removal ofadaptor sequences from the reads, the reads were compressed to a nonredun-dant list of unique sequence tags, which were then mapped to the humangenome (hg17) with MosaikAligner (29), using a maximum of 2 mismatches over95% alignment of the tag (34 nt) and a hash size of 15.
Transcriptome Analysis. Genome sequences of human (hg17) and annotation forprotein-coding genes were obtained from the University of California Santa Cruz(UCSC) (30). The lists of known human genes (knownGene containing 43,401entries) and known isoforms (knownIsoforms containing 43,286 entries in 21,397unique isoform clusters) with annotated exon alignments to human hg17genomic sequence were processed as follows. Known genes that were mappedtodifferent isoformclusterswerediscarded.AllmRNAsalignedtohg17thatwere�300 bases long were clustered together with the known isoforms. For thepurposes of measuring differential gene expression, all genes were considered.For the purposes of inferring alternative splicing, genes containing �3 exonswere removed from further consideration. A total of 2.7 million spliced ESTs weremapped onto the 17,478 high-quality gene clusters to identify alternative splic-ing.Toeliminateredundancies inthisanalysis,finalannotatedgeneregionswereclustered together so that any overlapping portion of these databases wasdefined by a single genomic position.
An exon-body database (EBDB) was constructed as follows. Exons with canon-ical splice signals (GT-AG, AT-AC, GC-AG) were retained, resulting in a total of213,736 exons. Of these, 92% of all exons were constitutive exons, 7% hadevidence of exon-skipping, 1% exons were mutually exclusive alternative events,3% exons had alternative 3� splice sites, and 2% exons had alternative 5� splicesites. An exon-junction database (EJDB) was constructed as follows. For eachprotein-coding gene, the 35 bases at the 3� end of each exon were concatenatedwith the 35 bases at the 5� end of the downstream exon. This was repeated,joining every exon of a gene to every exon downstream. This approach produced1,929,065 theoretical splicing junctions. An equal number of ‘‘impossible’’ junc-tions was generated by joining the 35-base exon junction sequences in reverseorder. MosaikAligner was used to align sequence tags to the junction databaserequiring no �2 mismatches over 95% of the sequence tag (34 nt). In addition,tags were required to have at least 4 nt across a specific splice junction. Junctionswere annotated as constitutive (CE) if all of the exons within the span of thejunction were annotated as constitutive (for a junction splicing exon 2 to 5, exonswithin the span are 2,3,4,5). Conversely, if any of the exons within the span of thejunction were annotated as potentially spliced from EST or ACEscan annotations,the junction was labeled SE or ACE, respectively (Fig. S3).
To determine the number of tags contained within protein-coding genes,promoter,andintergenic regions,wearbitrarilydefinedpromoterregionsas3kb
upstream of the transcriptional start site of the gene and intergenic regions asunannotated regions in the genome. Differentially expressed transcripts wereidentified by enumerating the number of tags that mapped within the splicedmRNA transcript in untreated and DHT-treated cells, using the total number oftags mapped to exons in each condition as a basis for determining significance bythe �2 statistic. Comparison of differentially expressed genes (P � 0.01) to pub-lished datasets of hormone-regulated genes was performed as follows. For eachof 1,000 iterations, an equal number of genes to our list of differentially ex-pressed genes were randomly selected and compared with a published list ofhormone-regulated genes. The number overlapped was recorded, and the meanand standard deviation of 1000 iterations was used to compute a Z score,resulting in a P value computed assuming a standard normal distribution. GOanalysis was performed as described in ref. 25.
Curve-Fitting Method to Estimate Saturating Tag Density and ObservableFeatures. Tags were randomly sampled into subsets representing 10%, 20% etc. ofthe total number of sequence tags available. These were aligned as described aboveand the number of features detected was assessed. To determine the number ofsequence tags required to reach a user-defined threshold for saturation, the per-centage change in discovering additional features was determined as follows:
Tn � sn
Cn � �Fn � Fn � 1
Fn � 1�
where T(n) is the number of tags, s is the sampling size (in our case, 2 million tags),n is a constant multiplier, C(n) is the empirical change in number of featuresdetected,andF(n) is thenumberofempirical featuresdetectedatn.Ascatterplotof C(n) to T(n) was fitted with a power curve of the form c(n) � a � T(n)b and anexponential curve of the form c(n) � aebT(n), where c(n) is the change estimatedby the curve fitting.The equation that had the best fit, indicated by R2, was used to extrapolate thetag density required to achieve a defined change in the number of featuresdetected. The number of estimated features was calculated by
fn � �i�m
n
fi � 1 � fi � 1 � ci
where m is user-defined (in our case, m � 6).
ACKNOWLEDGMENTS. We thank F.H.G. for his generous support and encour-agement during the course of this investigation when G.W.Y. was a Crick–JacobsJuniorFellowattheSalk Institute.M.G.R. isan Investigatorof theHowardHughesMedical Institute. This work was supported by a Prostate Cancer Foundationaward (to M.G.R. and X.D.F.) and National Institutes of Health Grants GM052872(to X.D.F.) and HG004659 (to G.W.Y. and X.-D.F.).
1. Cheng J, et al. (2005) Transcriptional maps of 10 human chromosomes at 5-nucleotideresolution. Science 308:1149–1154.
2. Birney E, et al. (2007) Identification and analysis of functional elements in 1% of thehuman genome by the ENCODE pilot project. Nature 447:799–816.
3. Kapranov P, et al. (2002) Large-scale transcriptional activity in chromosomes 21 and 22.Science 296:916–919.
4. Kapranov P, Willingham AT, Gingeras TR (2007) Genome-wide transcription and theimplications for genomic organization. Nat Rev Genet 8:413–423.
5. Mortazavi A., Williams BA, McCue K, Schaeffer L, Wold B (2008) Mapping and quan-tifying mammalian transcriptomes by RNA-Seq. Nat Methods 5:621–628.
6. Sultan M, et al. (2008) A global view of gene activity and alternative splicing by deepsequencing of the human transcriptome. Science 321:956–960.
7. Kim TH, et al. (2005) A high-resolution map of active promoters in the human genome.Nature 436:876–880.
8. Black DL (2003) Mechanisms of alternative pre-messenger RNA splicing. Annu RevBiochem 72:291–336.
9. Johnson JM, et al. (2003) Genome-wide survey of human alternative pre-mRNA splicingwith exon junction microarrays. Science 302:2141–2144.
10. Imanishi T, et al. (2004) Integrative annotation of 21,037 human genes validated byfull-length cDNA clones. PLoS Biol 2:e162.
11. Cloonan N, et al. (2008) Stem cell transcriptome profiling via massive-scale mRNAsequencing. Nat Methods 5:613–619.
12. Wilhelm BT, et al. (2008) Dynamic repertoire of a eukaryotic transcriptome surveyed atsingle-nucleotide resolution. Nature 453:1239–1243.
13. Nagalakshmi U, et al. (2008) The transcriptional landscape of the yeast genomedefined by RNA sequencing. Science 320:1344–1349.
14. Perocchi F, Xu Z, Clauder-Munster S, Steinmetz LM (2007) Antisense artifacts in transcrip-tome microarray experiments are resolved by actinomycin D. Nucleic Acids Res 35:e128.
15. Carninci P, et al. (2005) The transcriptional landscape of the mammalian genome.Science 309:1559–1563.
16. Chaisson MJ, Pevzner PA (2008) Short read fragment assembly of bacterial genomes.Genome Res 18:324–330.
17. Cawley S, et al. (2004) Unbiased mapping of transcription factor binding sites alonghuman chromosomes 21 and 22 points to widespread regulation of noncoding RNAs.Cell 116:499–509.
18. Mazo A, Hodgson JW, Petruk S, Sedkov Y, Brock HW (2007) Transcriptional interfer-ence: An unexpected layer of complexity in gene regulation. J Cell Sci 120:2755–2761.
19. Bainbridge MN, et al. (2006) Analysis of the prostate cancer cell line LNCaP transcrip-tome using a sequencing-by-synthesis approach. BMC Genomics 7:246.
20. Velasco AM, et al. (2004) Identification and validation of novel androgen-regulatedgenes in prostate cancer. Endocrinology 145:3913–3924.
21. Segawa T, et al. (2002) Androgen-induced expression of endoplasmic reticulum (ER)stress response genes in prostate cancer cells. Oncogene 21:8749–8758.
22. Nelson PS, et al. (2002) The program of androgen-responsive genes in neoplasticprostate epithelium. Proc Natl Acad Sci USA 99:11890–11895.
23. DePrimo SE, et al. (2002) Transcriptional programs activated by exposure of humanprostate cancer cells to androgen. Genome Biol 3:RESEARCH0032.
24. Xu L, et al. (2001) Quantitative expression profile of androgen-regulated genes in prostatecancer cells and identification of prostate-specific genes. Int J Cancer 92:322–328.
25. Yeo GW, Van Nostrand E, Holste D, Poggio T, Burge CB (2005) Identification andanalysis of alternative splicing events conserved in human and mouse. Proc Natl AcadSci USA 102:2850–2855.
26. Clark TA, Sugnet CW, Ares M, Jr (2002) Genomewide analysis of mRNA processing inyeast using splicing-specific microarrays. Science 296:907–910.
27. Pan Q, et al. (2004) Revealing global regulatory features of mammalian alternativesplicing using a quantitative microarray platform. Mol Cell 16:929–941.
28. Li HR, et al. (2006) Two-dimensional transcriptome profiling: Identification of messen-ger RNA isoform signatures in prostate cancer from archived paraffin-embeddedcancer specimens. Cancer Res 66:4079–4088.
29. Hillier LW, et al. (2008) Whole-genome sequencing and variant discovery in C. elegans.Nat Methods 5:183–188.
30. Karolchik D, et al. (2003) The UCSC Genome Browser Database. Nucleic Acids Res31:51–54.
20184 � www.pnas.org�cgi�doi�10.1073�pnas.0807121105 Li et al.