Determination of Steady State Stability Margin Using ... · PDF fileDetermination of Steady...
13
Determination of Steady State Stability Margin Using Extreme Learning Machine INDAR CHAERAH GUNADIN, MUHAMMAD ABDILLAH, ADI SOEPRIJANTO, ONTOSENO PENANGSANG Department of Electrical Engineering Hasanuddin University - Institut Teknologi Sepuluh Nopember Makassar - Surabaya INDONESIA [email protected],[email protected], [email protected], [email protected] Abstract: - Power systems have increased in size and complexity due to rapid growth of widespread interconnection. This situation will make power system operated closer to steady-state stability limit (SSSL) resulting in higher probability voltage instability or voltage collapse. This paper presents SSSL assessment in power system using Extreme Learning Machine (ELM) model based on REI-Dimo method. The equivalent REI-Dimo is used to determine SSSL index of the power systems. Then, the result of REI-Dimo will be taught on ELM method via online. The results of ELM will compared with Artificial Neural Network (ANN) method. Studies were carried out on a Java-Bali 500kV system. The simulation showed that the proposed method could accurately predict the proximity to SSSL in power system. The proposed method was computationally efficient and suitable for online monitoring of steady-state stability condition in the power systems. Key-Words: - Extreme Learning Machine, ANN, REI-Dimo Equivalent, SSSL, Voltage Collapse 1 Introduction Load growth without a corresponding increase in transmission capacity has brought power systems operate near to steady state stability limit (SSSL). When a power system approaches the SSSL, the voltage of some buses reduces rapidly for small increments in load and the controls or operators may not able to prevent the voltage decay or collapse. Voltage collapse has become an increasing threat to power system security and reliability. To operate the system with an adequate security margin, it is essential to estimate the voltage stability margin corresponding to the given operating point. The main problem here is that the maximum permissible loading of the transmission system is not a fixed quantity. It depends on various factors such as network topology, availability of reactive power support, generation and load patterns etc. All these factors continuously vary with time. Voltage magnitude alone cannot be used as an indicator of instability [1-3]. The steady-state stability limit (SSSL) of a power system is ―a steady-state operating condition for which the power system is steady-state stable but an arbitrarily small change in any of the operating quantities in an unfavorable direction causes the power system to loose the stability". An earlier definition refers to this concept as ―the stability of the system under the conditions of gradually or relatively slow changes in the load". Voltage collapse, units getting out of synchronism, and instability caused by self amplifying small-signal oscillations are all forms of steady-state instability [3]. Empirically, the risk of steady-state instability is associated with low real or reactive power reserves, low voltage levels, and large bus voltage variations for small load or generated power changes. Recurring "temporary faults‖, i.e. where breakers trip without apparent reason and which is disconnected by a protection without being able to identify the fault, might also be an indication of steady-state instability. Breaker trips can happen when loads increase due to "balancing rotors" of generators that are operated near instability trip and then get back in synchronism[1-5]. Equivalent REI (Radial, Equivalent and independent ) has also been used to speed up and simplify the complex computational algorithms. For example, the rigorous solution of the steady-state stability problem is predicated on detailed machine model and entails an alternate sequence of load flow and eigenvalues calculating until the point of instability is found. However, determining eigenvalues for successively deteriorated load-flow cases is computationally intensive and has the WSEAS TRANSACTIONS on POWER SYSTEMS Indar Chaerah Gunadin, Muhammad Abdillah, Adi Soeprijanto, Ontoseno Penangsang E-ISSN: 2224-350X 91 Issue 3, Volume 7, July 2012
Transcript of Determination of Steady State Stability Margin Using ... · PDF fileDetermination of Steady...
Determination of Steady State Stability Margin Using Extreme
Learning Machine
INDAR CHAERAH GUNADIN, MUHAMMAD ABDILLAH,
ADI SOEPRIJANTO, ONTOSENO PENANGSANG
Department of Electrical Engineering
Hasanuddin University - Institut Teknologi Sepuluh Nopember
Makassar - Surabaya
INDONESIA
[email protected],[email protected], [email protected], [email protected]
Abstract: - Power systems have increased in size and complexity due to rapid growth of widespread
interconnection. This situation will make power system operated closer to steady-state stability limit (SSSL)
resulting in higher probability voltage instability or voltage collapse. This paper presents SSSL assessment in
power system using Extreme Learning Machine (ELM) model based on REI-Dimo method. The equivalent
REI-Dimo is used to determine SSSL index of the power systems. Then, the result of REI-Dimo will be taught
on ELM method via online. The results of ELM will compared with Artificial Neural Network (ANN) method.
Studies were carried out on a Java-Bali 500kV system. The simulation showed that the proposed method could
accurately predict the proximity to SSSL in power system. The proposed method was computationally efficient
and suitable for online monitoring of steady-state stability condition in the power systems.
Key-Words: - Extreme Learning Machine, ANN, REI-Dimo Equivalent, SSSL, Voltage Collapse
1 Introduction Load growth without a corresponding increase in
transmission capacity has brought power systems
operate near to steady state stability limit (SSSL).
When a power system approaches the SSSL, the
voltage of some buses reduces rapidly for small
increments in load and the controls or operators may
not able to prevent the voltage decay or collapse.
Voltage collapse has become an increasing threat to
power system security and reliability. To operate
the system with an adequate security margin, it is
essential to estimate the voltage stability margin
corresponding to the given operating point. The
main problem here is that the maximum permissible
loading of the transmission system is not a fixed
quantity. It depends on various factors such as
network topology, availability of reactive power
support, generation and load patterns etc. All these
factors continuously vary with time. Voltage
magnitude alone cannot be used as an indicator of
instability [1-3].
The steady-state stability limit (SSSL) of a power
system is ―a steady-state operating condition for
which the power system is steady-state stable but an
arbitrarily small change in any of the operating
quantities in an unfavorable direction causes the
power system to loose the stability". An earlier
definition refers to this concept as ―the stability of
the system under the conditions of gradually or
relatively slow changes in the load". Voltage
collapse, units getting out of synchronism, and
instability caused by self amplifying small-signal
oscillations are all forms of steady-state instability
[3].
Empirically, the risk of steady-state instability is
associated with low real or reactive power reserves,
low voltage levels, and large bus voltage variations
for small load or generated power changes.
Recurring "temporary faults‖, i.e. where breakers
trip without apparent reason and which is
disconnected by a protection without being able to
identify the fault, might also be an indication of
steady-state instability. Breaker trips can happen
when loads increase due to "balancing rotors" of
generators that are operated near instability trip and
then get back in synchronism[1-5].
Equivalent REI (Radial, Equivalent and
independent ) has also been used to speed up and
simplify the complex computational algorithms. For
example, the rigorous solution of the steady-state
stability problem is predicated on detailed machine
model and entails an alternate sequence of load flow
and eigenvalues calculating until the point of
instability is found. However, determining
eigenvalues for successively deteriorated load-flow
cases is computationally intensive and has the
WSEAS TRANSACTIONS on POWER SYSTEMSIndar Chaerah Gunadin, Muhammad Abdillah, Adi Soeprijanto, Ontoseno Penangsang
E-ISSN: 2224-350X 91 Issue 3, Volume 7, July 2012

inconvenience that load-flow may not converge near
the instability. The use of equivalent in conjunction
with appropriate simplifying assumptions is the only
way to overcome such difficulties and Dimo's
method has been successfully implemented and is
currently used in several SCADA/EMS installations
to compute the system load ability limits in real-
time and to continuously monitor the distance to
instability [6]-[7].
A number of special algorithms have been
proposed in the literature for steady state stability.
However, these methods require large computations
and are not efficient enough for on-line or real-time
stability assessment. For real-time applications there
is a need tools which can quickly detect the point
collapse of system and to provide guidance to steer
the system away from a developing voltage
collapse.
Recently, there has been considerable interest in
the application of Extreme Learning Machine
(ELM) to power system. ELM has the ability to
classify complex relationships properly. The
relationships classified by ELM are highly non
linear and often result from large mathematical
models. Once trained, the ELM can classify new
data much faster than it would be possible by
solving the model analytically: An integrated based
systems, ELM, and conventional power system
solution methodologies have potential to provide
real-time optimization and control of power system.
[8]-[9].
This paper presents the application of ELM to
provide fast indication of steady stability limit with
the use of REI-Dimo result as training data. For
online steady-state stability monitoring, it is
essential to identify the maximum power of loading
faster calculation so that the ELM method can be a
alternative solution.
2 Research Method 2.1 REI-Dimo Equivalent Many references that are available describe the
approach to steady-state stability assessment
developed by Paul Dimo, starting, of course, with
the books and papers written by Dimo himself. ln
order to avoid overlap with already-published
material, in this section we just briefly discuss just
the key aspects of the technique and emphasize the
assumptions that provide computational speed while
preserving precision and accuracy. The theoretically
oriented reader is directed to review reference [1,6],
in which the more subtle aspects of Dimo's
methodology are addressed in detail, including the
generalization of Dimo's formulation of the reactive-
power steady-state stability criterion.
A power system consists of a linear sub-system,
i.e., transmission lines, transformers, reactor, capa-
citors, and the bus-to-ground admittances to
represent line charging and transformer taps; and a
non-linear subsystem, i.e., generators, loads and
synchronous condensers. Bus can divided into non-
essential buses, which are to be eliminated, and
essential buses, which are to be retained
unchanged[1].
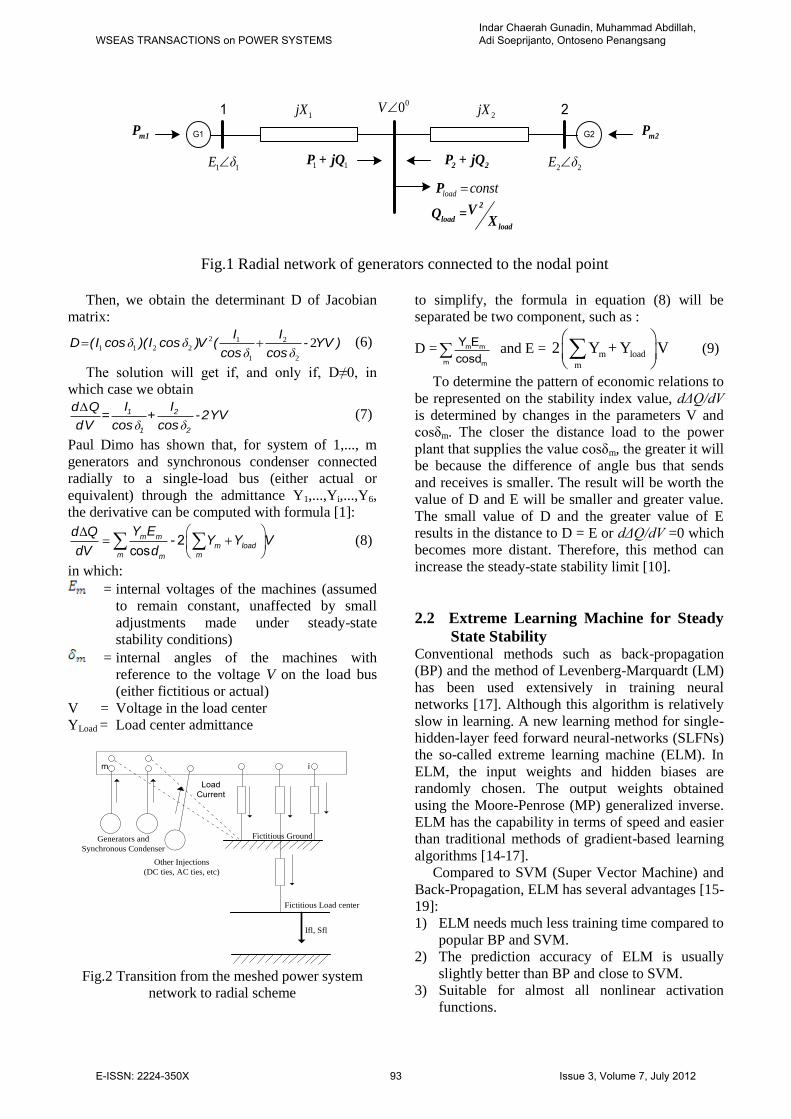
Figure 1, which meets the requirement that the
generators be radially connected to a ―nodal point‖
where the load is located. The topology of this
network, in spite of its simplicity, reflects a typical
radial network of short-circuit impedances
(admittances) obtained after applying the short
circuit current transformation [1].
The generators G1 and G2 the mechanical powers
Pm1 and Pm2 equal the electrical MW generated
powers, which are given by equations (1) and (2):
1
1 1 1
1
m
EVP P sin
Xδ (1)
2
2 2 2
2
m
E VP P sin
Xδ (2)
The generated real powers are entirely absorbed by
the load Pload, as shown in equation (3):
1 2load 1 2
1 2
E V E VP = sind + sind =const
X X (3)
And the reactive power of the load Qload is supplied
by : 2 2 2
1 2
1 2
1 1 2 2
load
load
EV E VV V VQ cos cos
X X X X Xδ δ (4)
Let us now consider a perturbation Q of
reactive power injected into the load bus.
From(1),(2),(3), and (4) and with 1 0mP ,
2 0mP ,
0loadP , as well as load
1
Q=0
d
and
2
0loadQδ
because Qload is a function of V only,
we obtain Jacobian matrix of the system [1]:
1 1
1
1 2 1 2 1 2
1 2
1 2 1 2 1 2
1 2
0
load
P P
V
(P P ) (P P ) (P P )J
V
(Q Q Q ) (Q Q ) (Q Q )
V
δ
δ δ
δ δ
(5)
WSEAS TRANSACTIONS on POWER SYSTEMSIndar Chaerah Gunadin, Muhammad Abdillah, Adi Soeprijanto, Ontoseno Penangsang
E-ISSN: 2224-350X 92 Issue 3, Volume 7, July 2012
G1 G2 m2P
m1P
1 1E δ 2 2E δ
1 21jX 2jX
2 2P + jQ1 1P + jQ
Pload const2
loadload
VQ =X
00V
Fig.1 Radial network of generators connected to the nodal point
Then, we obtain the determinant D of Jacobian
matrix:
2 1 2
1 1 2 2
1 2
2I I
D (I cos )(I cos )V ( - YV )cos cos
δ δδ δ
(6)
The solution will get if, and only if, D≠0, in
which case we obtain
1 2
1 2
I Id Q= + -2YV
dV cos cosδ δ
(7)
Paul Dimo has shown that, for system of 1,..., m
generators and synchronous condenser connected
radially to a single-load bus (either actual or
equivalent) through the admittance Y1,...,Yi,...,Y6,
the derivative can be computed with formula [1]:
m mm load
m mm
Y Ed QY Y V
dV d- 2
cos
(8)
in which:
= internal voltages of the machines (assumed
to remain constant, unaffected by small
adjustments made under steady-state
stability conditions)
= internal angles of the machines with
reference to the voltage V on the load bus
(either fictitious or actual)
V = Voltage in the load center
YLoad = Load center admittance
Fictitious Load center
Generators and
Synchronous Condenser
im
Load Current
Other Injections
(DC ties, AC ties, etc)
Fictitious Ground
Ifl, Sfl
Fig.2 Transition from the meshed power system
network to radial scheme
to simplify, the formula in equation (8) will be
separated be two component, such as :
D = m m
m m
Y Ecosd and E = m load
m
2 Y + Y V (9)
To determine the pattern of economic relations to
be represented on the stability index value, dΔQ/dV
is determined by changes in the parameters V and
cosδm. The closer the distance load to the power
plant that supplies the value cosδm, the greater it will
be because the difference of angle bus that sends
and receives is smaller. The result will be worth the
value of D and E will be smaller and greater value.
The small value of D and the greater value of E
results in the distance to D = E or dΔQ/dV =0 which
becomes more distant. Therefore, this method can
increase the steady-state stability limit [10].
2.2 Extreme Learning Machine for Steady
State Stability Conventional methods such as back-propagation
(BP) and the method of Levenberg-Marquardt (LM)
has been used extensively in training neural
networks [17]. Although this algorithm is relatively
slow in learning. A new learning method for single-
hidden-layer feed forward neural-networks (SLFNs)
the so-called extreme learning machine (ELM). In
ELM, the input weights and hidden biases are
randomly chosen. The output weights obtained
using the Moore-Penrose (MP) generalized inverse.
ELM has the capability in terms of speed and easier
than traditional methods of gradient-based learning
algorithms [14-17].
Compared to SVM (Super Vector Machine) and
Back-Propagation, ELM has several advantages [15-
19]:
1) ELM needs much less training time compared to
popular BP and SVM.
2) The prediction accuracy of ELM is usually
slightly better than BP and close to SVM.
3) Suitable for almost all nonlinear activation
functions.
WSEAS TRANSACTIONS on POWER SYSTEMSIndar Chaerah Gunadin, Muhammad Abdillah, Adi Soeprijanto, Ontoseno Penangsang
E-ISSN: 2224-350X 93 Issue 3, Volume 7, July 2012

In ELM, the input weights and hidden biases
generated randomly. Furthermore, the nonlinear
system has been transformed into a linear system:
where as named in Huang et al. [15-19], H={hij}
(i=1,…,N and j=1,…,K) is hidden-layer output
matrix, is matrix of output
weights and is matrix of
targets.
X
β
HiddenLayer
OutputLayer
InputLayer
ν(w,b,x)
Fig.3 Structure of an SLF-NN
REI DIMOREAL POWER
SYSTEM MODEL
GenP
GenQ
BusV
Busδ
Pload
Extreme Learning Machine (ELM)
Steady State Stability Limit
Qload
Fig.4 Scheme of research
In this paper, ELM is utilized to map the highly
non-linear relationship between network voltage
profile of load center from REI-Dimo Equivalent
and the corresponding steady-state stability limit of
power system. First, the simulation starts with
running the power flow program for Java-Bali
system. Then, by using REI- Dimo equivalent, the
system will be reduced into simple network by
reducing all load buses into a representative load
center buses. Network voltage profile of reduced
model is provided by REI-Dimo.
2.3 Structure of The Proposed Approach Figure 4 shows the structure of the proposed
approach. This approach consists of four main. Parts
as follows:
1. Reducing the Java-Bali system be a simplify
power system using REI- Dimo.
2. Determining the index steady-state stability
limit using REI-Dimo
3. Changing the power in the load center to
obtain the parameter of system such as: real
power and reactive power generation,
magnitude and phase of bus voltage, D and E
constant, and SSSL index. All data obtained
WSEAS TRANSACTIONS on POWER SYSTEMSIndar Chaerah Gunadin, Muhammad Abdillah, Adi Soeprijanto, Ontoseno Penangsang
E-ISSN: 2224-350X 94 Issue 3, Volume 7, July 2012
Paiton
Grati
Surabaya Barat
Gresik
Tanjung Jati
Ungaran
Kediri
PedanMandiracan
Saguling
Cirata
Cibatu
Muaratawar
Bekasi
Bandung
Depok
Gandul
Cilegon Suralaya
Kembangan
Cawang
Cibinong
12
3
45
67
8
9
10
11
12
13
14
15
16
17
18
19
20
21
22
23
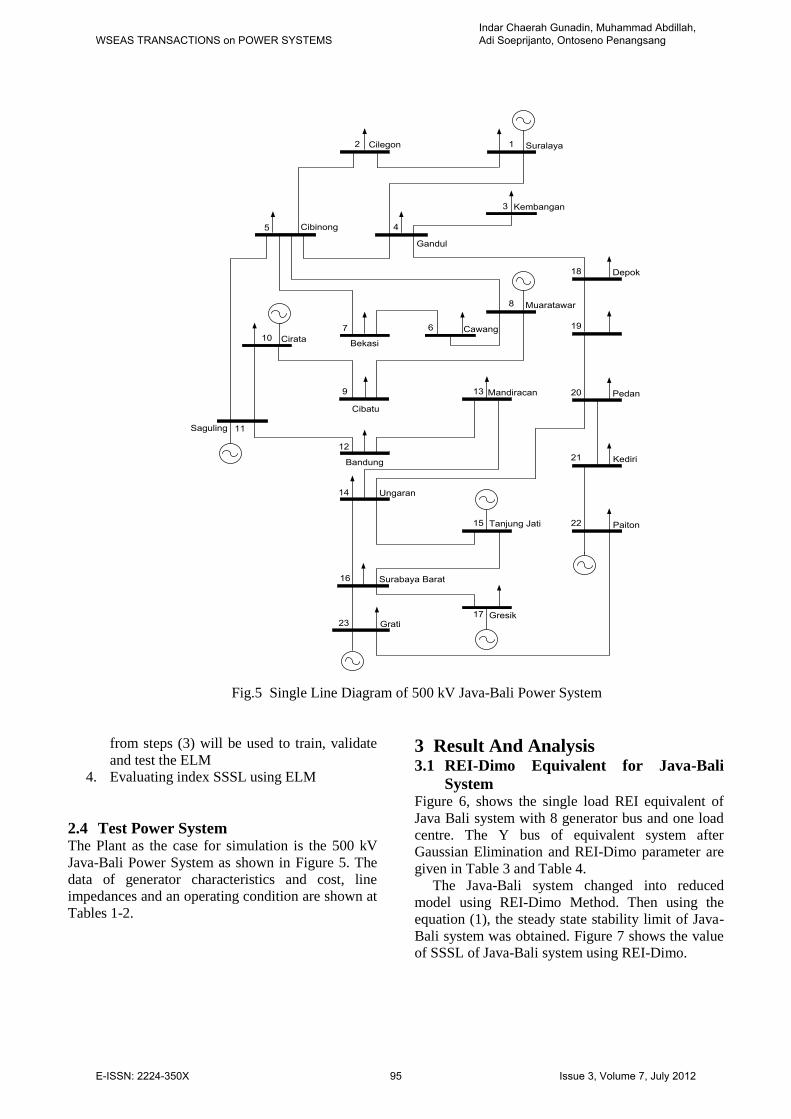
Fig.5 Single Line Diagram of 500 kV Java-Bali Power System
from steps (3) will be used to train, validate
and test the ELM
4. Evaluating index SSSL using ELM
2.4 Test Power System The Plant as the case for simulation is the 500 kV
Java-Bali Power System as shown in Figure 5. The
data of generator characteristics and cost, line
impedances and an operating condition are shown at
Tables 1-2.
3 Result And Analysis 3.1 REI-Dimo Equivalent for Java-Bali
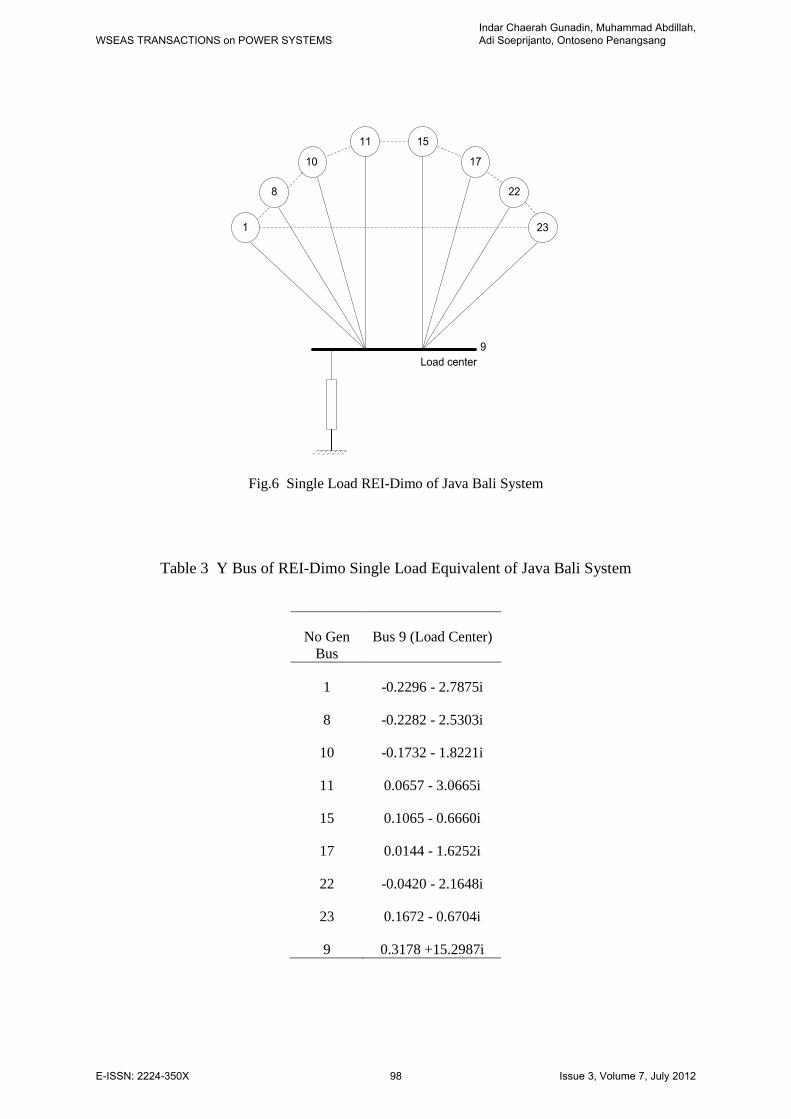
System Figure 6, shows the single load REI equivalent of
Java Bali system with 8 generator bus and one load
centre. The Y bus of equivalent system after
Gaussian Elimination and REI-Dimo parameter are
given in Table 3 and Table 4.
The Java-Bali system changed into reduced
model using REI-Dimo Method. Then using the
equation (1), the steady state stability limit of Java-
Bali system was obtained. Figure 7 shows the value
of SSSL of Java-Bali system using REI-Dimo.
WSEAS TRANSACTIONS on POWER SYSTEMSIndar Chaerah Gunadin, Muhammad Abdillah, Adi Soeprijanto, Ontoseno Penangsang
E-ISSN: 2224-350X 95 Issue 3, Volume 7, July 2012
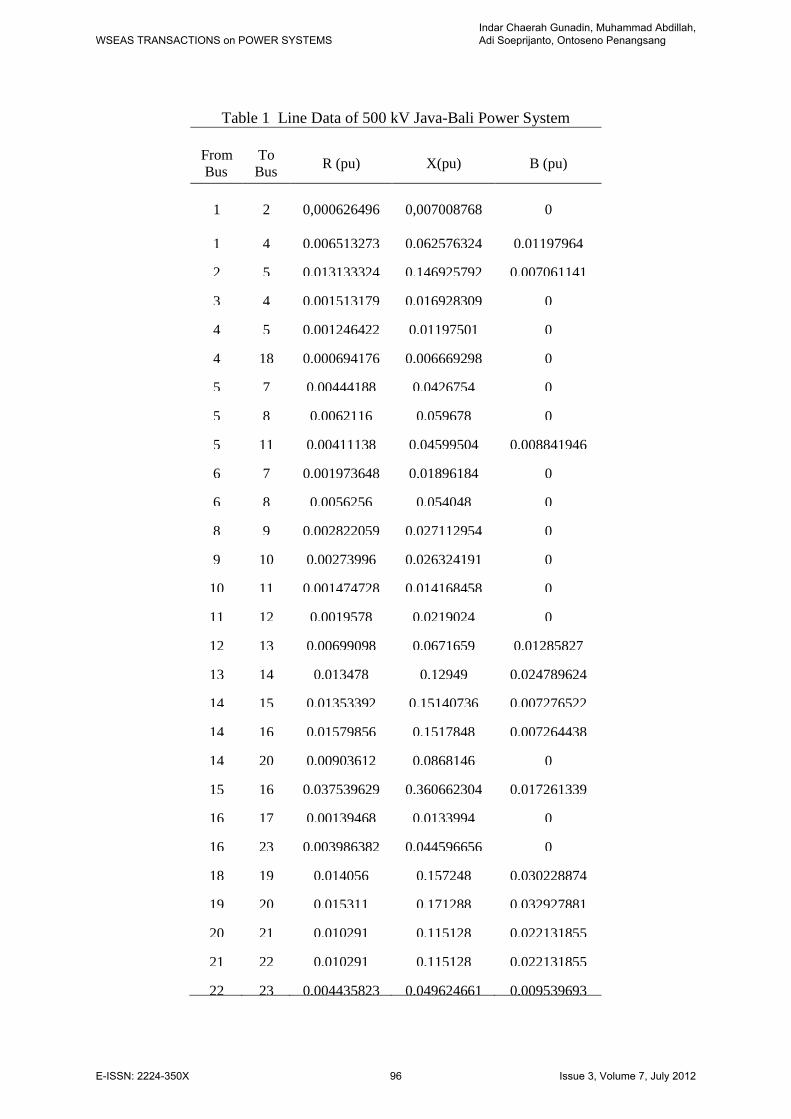
Table 1 Line Data of 500 kV Java-Bali Power System
From
Bus To
Bus R (pu) X(pu) B (pu)
1 2 0,000626496 0,007008768 0
1 4 0,006513273 0,062576324 0,01197964
2 5 0,013133324 0,146925792 0,007061141
3 4 0,001513179 0,016928309 0
4 5 0,001246422 0,01197501 0
4 18 0,000694176 0,006669298 0
5 7 0,00444188 0,0426754 0
5 8 0,0062116 0,059678 0
5 11 0,00411138 0,04599504 0,008841946
6 7 0,001973648 0,01896184 0
6 8 0,0056256 0,054048 0
8 9 0,002822059 0,027112954 0
9 10 0,00273996 0,026324191 0
10 11 0,001474728 0,014168458 0
11 12 0,0019578 0,0219024 0
12 13 0,00699098 0,0671659 0,01285827
13 14 0,013478 0,12949 0,024789624
14 15 0,01353392 0,15140736 0,007276522
14 16 0,01579856 0,1517848 0,007264438
14 20 0,00903612 0,0868146 0
15 16 0,037539629 0,360662304 0,017261339
16 17 0,00139468 0,0133994 0
16 23 0,003986382 0,044596656 0
18 19 0,014056 0,157248 0,030228874
19 20 0,015311 0,171288 0,032927881
20 21 0,010291 0,115128 0,022131855
21 22 0,010291 0,115128 0,022131855
22 23 0,004435823 0,049624661 0,009539693
WSEAS TRANSACTIONS on POWER SYSTEMSIndar Chaerah Gunadin, Muhammad Abdillah, Adi Soeprijanto, Ontoseno Penangsang
E-ISSN: 2224-350X 96 Issue 3, Volume 7, July 2012
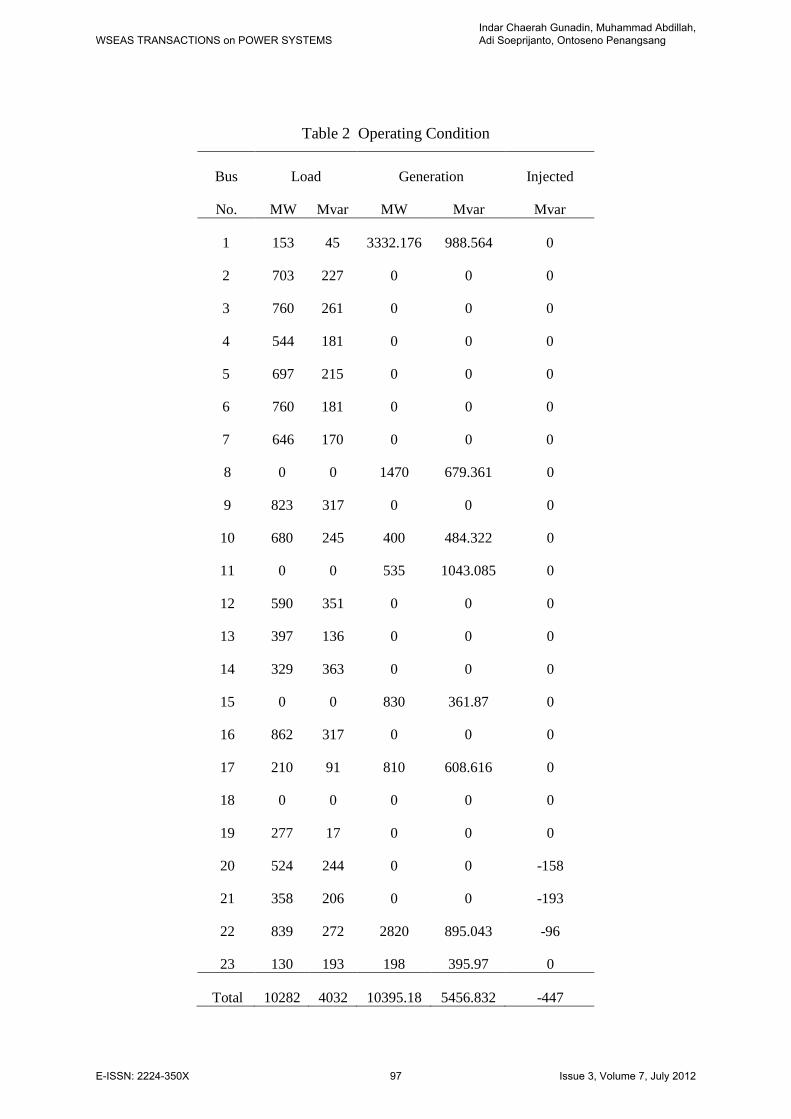
Table 2 Operating Condition
Bus
No.
Load Generation Injected
MW Mvar MW Mvar Mvar
1 153 45 3332.176 988.564 0
2 703 227 0 0 0
3 760 261 0 0 0
4 544 181 0 0 0
5 697 215 0 0 0
6 760 181 0 0 0
7 646 170 0 0 0
8 0 0 1470 679.361 0
9 823 317 0 0 0
10 680 245 400 484.322 0
11 0 0 535 1043.085 0
12 590 351 0 0 0
13 397 136 0 0 0
14 329 363 0 0 0
15 0 0 830 361.87 0
16 862 317 0 0 0
17 210 91 810 608.616 0
18 0 0 0 0 0
19 277 17 0 0 0
20 524 244 0 0 -158
21 358 206 0 0 -193
22 839 272 2820 895.043 -96
23 130 193 198 395.97 0
Total 10282 4032 10395.18 5456.832 -447
WSEAS TRANSACTIONS on POWER SYSTEMSIndar Chaerah Gunadin, Muhammad Abdillah, Adi Soeprijanto, Ontoseno Penangsang
E-ISSN: 2224-350X 97 Issue 3, Volume 7, July 2012
1
8
23
22
10
11 15
17
Load center9
Fig.6 Single Load REI-Dimo of Java Bali System
Table 3 Y Bus of REI-Dimo Single Load Equivalent of Java Bali System
No Gen
Bus Bus 9 (Load Center)
1 -0.2296 - 2.7875i
8 -0.2282 - 2.5303i
10 -0.1732 - 1.8221i
11 0.0657 - 3.0665i
15 0.1065 - 0.6660i
17 0.0144 - 1.6252i
22 -0.0420 - 2.1648i
23 0.1672 - 0.6704i
9 0.3178 +15.2987i
WSEAS TRANSACTIONS on POWER SYSTEMSIndar Chaerah Gunadin, Muhammad Abdillah, Adi Soeprijanto, Ontoseno Penangsang
E-ISSN: 2224-350X 98 Issue 3, Volume 7, July 2012
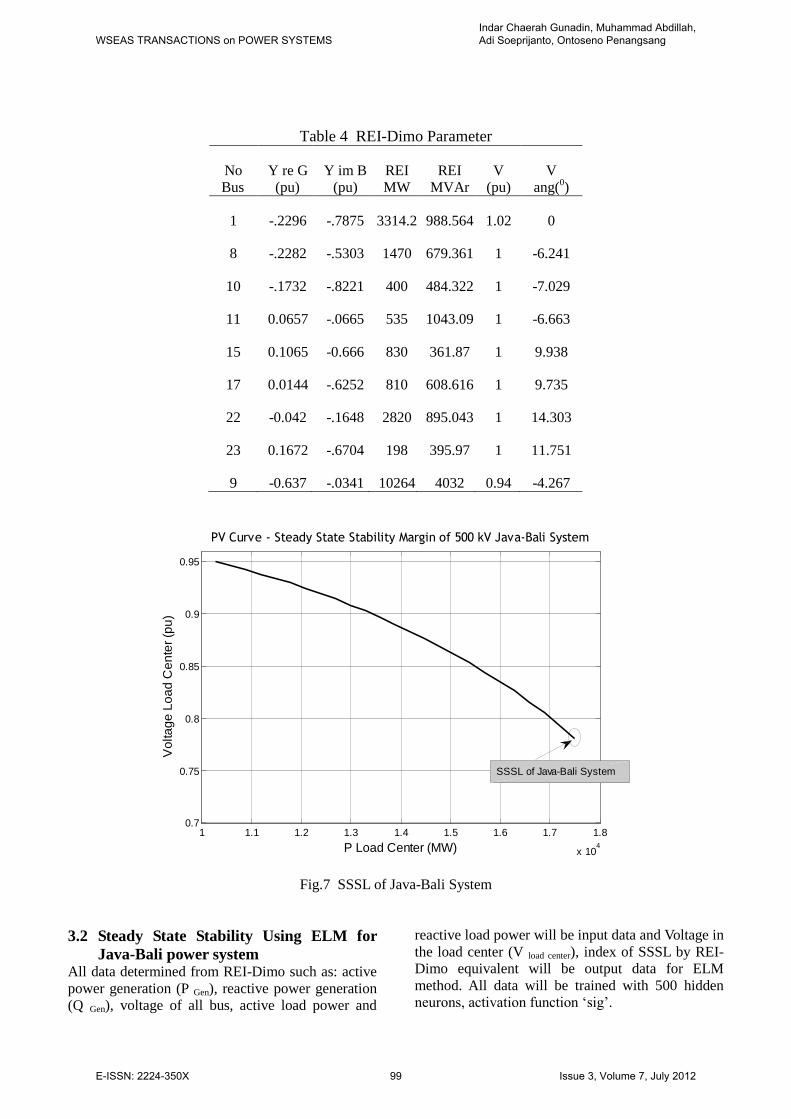
Table 4 REI-Dimo Parameter
No
Bus Y re G
(pu) Y im B
(pu) REI
MW REI
MVAr V
(pu) V
ang(0)
1 -.2296 -.7875 3314.2 988.564 1.02 0
8 -.2282 -.5303 1470 679.361 1 -6.241
10 -.1732 -.8221 400 484.322 1 -7.029
11 0.0657 -.0665 535 1043.09 1 -6.663
15 0.1065 -0.666 830 361.87 1 9.938
17 0.0144 -.6252 810 608.616 1 9.735
22 -0.042 -.1648 2820 895.043 1 14.303
23 0.1672 -.6704 198 395.97 1 11.751
9 -0.637 -.0341 10264 4032 0.94 -4.267
1 1.1 1.2 1.3 1.4 1.5 1.6 1.7 1.8
x 104
0.7
0.75
0.8
0.85
0.9
0.95
PV Curve - Steady State Stability Margin of 500 kV Java-Bali System
P Load Center (MW)
Vo
lta
ge
Lo
ad
Ce
nte
r (p
u)
SSSL of Java-Bali System
Fig.7 SSSL of Java-Bali System
3.2 Steady State Stability Using ELM for
Java-Bali power system All data determined from REI-Dimo such as: active
power generation (P Gen), reactive power generation
(Q Gen), voltage of all bus, active load power and
reactive load power will be input data and Voltage in
the load center (V load center), index of SSSL by REI-
Dimo equivalent will be output data for ELM
method. All data will be trained with 500 hidden
neurons, activation function ‗sig‘.
WSEAS TRANSACTIONS on POWER SYSTEMSIndar Chaerah Gunadin, Muhammad Abdillah, Adi Soeprijanto, Ontoseno Penangsang
E-ISSN: 2224-350X 99 Issue 3, Volume 7, July 2012
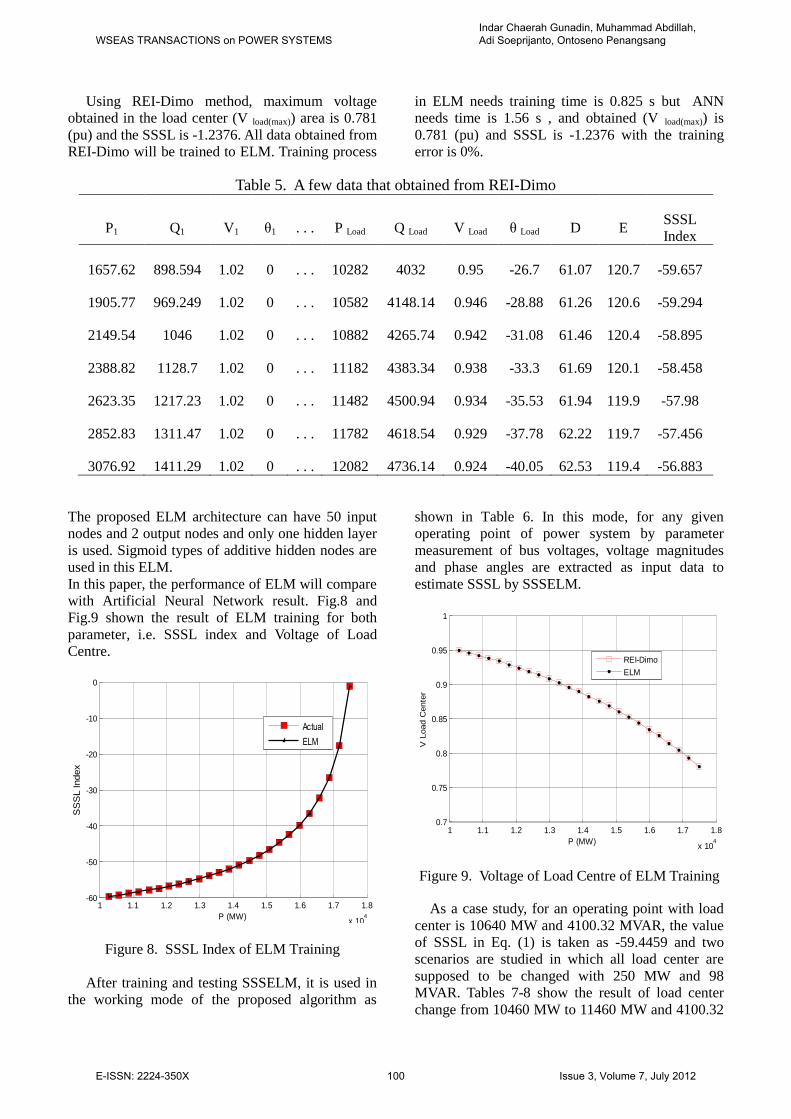
Using REI-Dimo method, maximum voltage
obtained in the load center (V load(max)) area is 0.781
(pu) and the SSSL is -1.2376. All data obtained from
REI-Dimo will be trained to ELM. Training process
in ELM needs training time is 0.825 s but ANN
needs time is 1.56 s , and obtained (V load(max)) is
0.781 (pu) and SSSL is -1.2376 with the training
error is 0%.
Table 5. A few data that obtained from REI-Dimo
P1 Q1 V1 θ1 . . . P Load Q Load V Load θ Load D E SSSL
Index
1657.62 898.594 1.02 0 . . . 10282 4032 0.95 -26.7 61.07 120.7 -59.657
1905.77 969.249 1.02 0 . . . 10582 4148.14 0.946 -28.88 61.26 120.6 -59.294
2149.54 1046 1.02 0 . . . 10882 4265.74 0.942 -31.08 61.46 120.4 -58.895
2388.82 1128.7 1.02 0 . . . 11182 4383.34 0.938 -33.3 61.69 120.1 -58.458
2623.35 1217.23 1.02 0 . . . 11482 4500.94 0.934 -35.53 61.94 119.9 -57.98
2852.83 1311.47 1.02 0 . . . 11782 4618.54 0.929 -37.78 62.22 119.7 -57.456
3076.92 1411.29 1.02 0 . . . 12082 4736.14 0.924 -40.05 62.53 119.4 -56.883
The proposed ELM architecture can have 50 input
nodes and 2 output nodes and only one hidden layer
is used. Sigmoid types of additive hidden nodes are
used in this ELM.
In this paper, the performance of ELM will compare
with Artificial Neural Network result. Fig.8 and
Fig.9 shown the result of ELM training for both
parameter, i.e. SSSL index and Voltage of Load
Centre.
1 1.1 1.2 1.3 1.4 1.5 1.6 1.7 1.8
x 104
-60
-50
-40
-30
-20
-10
0
P (MW)
SS
SL Index
Actual
ELM
Figure 8. SSSL Index of ELM Training
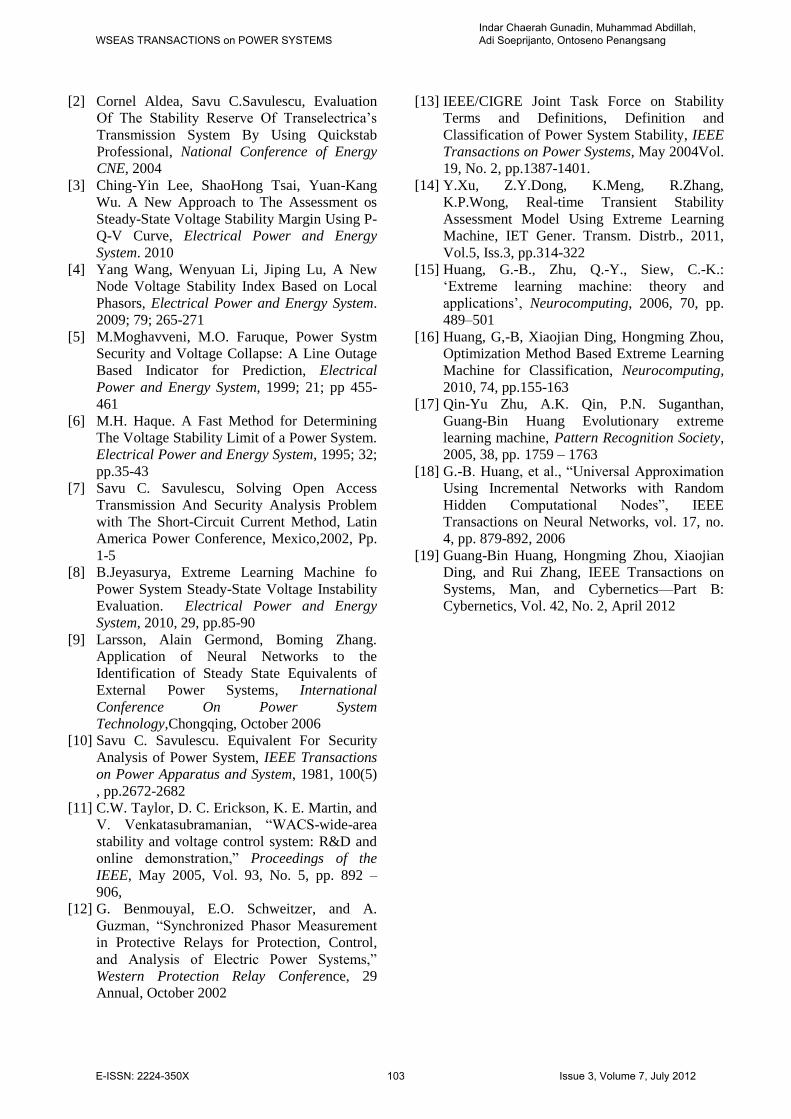
After training and testing SSSELM, it is used in
the working mode of the proposed algorithm as
shown in Table 6. In this mode, for any given
operating point of power system by parameter
measurement of bus voltages, voltage magnitudes
and phase angles are extracted as input data to
estimate SSSL by SSSELM.
1 1.1 1.2 1.3 1.4 1.5 1.6 1.7 1.8
x 104
0.7
0.75
0.8
0.85
0.9
0.95
1
P (MW)
V L
oad C
ente
r
REI-Dimo
ELM
Figure 9. Voltage of Load Centre of ELM Training
As a case study, for an operating point with load
center is 10640 MW and 4100.32 MVAR, the value
of SSSL in Eq. (1) is taken as -59.4459 and two
scenarios are studied in which all load center are
supposed to be changed with 250 MW and 98
MVAR. Tables 7-8 show the result of load center
change from 10460 MW to 11460 MW and 4100.32
WSEAS TRANSACTIONS on POWER SYSTEMSIndar Chaerah Gunadin, Muhammad Abdillah, Adi Soeprijanto, Ontoseno Penangsang
E-ISSN: 2224-350X 100 Issue 3, Volume 7, July 2012
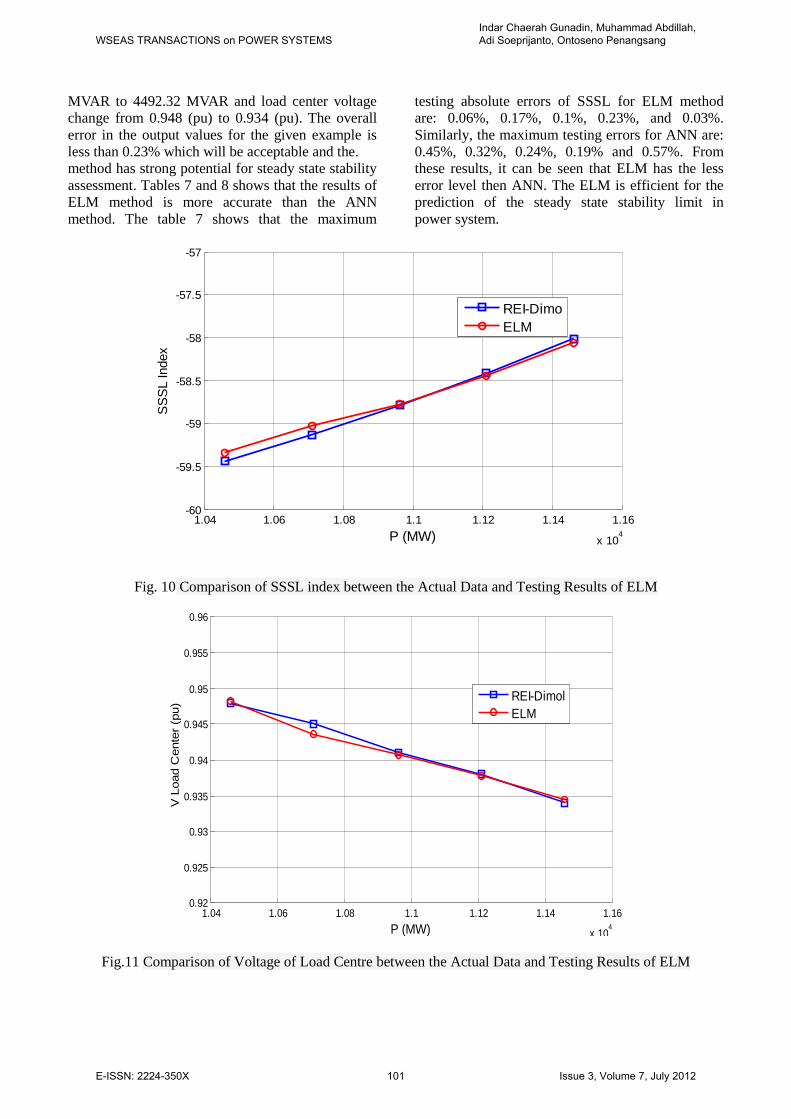
MVAR to 4492.32 MVAR and load center voltage
change from 0.948 (pu) to 0.934 (pu). The overall
error in the output values for the given example is
less than 0.23% which will be acceptable and the.
method has strong potential for steady state stability
assessment. Tables 7 and 8 shows that the results of
ELM method is more accurate than the ANN
method. The table 7 shows that the maximum
testing absolute errors of SSSL for ELM method
are: 0.06%, 0.17%, 0.1%, 0.23%, and 0.03%.
Similarly, the maximum testing errors for ANN are:
0.45%, 0.32%, 0.24%, 0.19% and 0.57%. From
these results, it can be seen that ELM has the less
error level then ANN. The ELM is efficient for the
prediction of the steady state stability limit in
power system.
1.04 1.06 1.08 1.1 1.12 1.14 1.16
x 104
-60
-59.5
-59
-58.5
-58
-57.5
-57
P (MW)
SS
SL Index
REI-Dimo
ELM
Fig. 10 Comparison of SSSL index between the Actual Data and Testing Results of ELM
1.04 1.06 1.08 1.1 1.12 1.14 1.16
x 104
0.92
0.925
0.93
0.935
0.94
0.945
0.95
0.955
0.96
P (MW)
V L
oad C
ente
r (p
u)
REI-Dimol
ELM
Fig.11 Comparison of Voltage of Load Centre between the Actual Data and Testing Results of ELM
WSEAS TRANSACTIONS on POWER SYSTEMSIndar Chaerah Gunadin, Muhammad Abdillah, Adi Soeprijanto, Ontoseno Penangsang
E-ISSN: 2224-350X 101 Issue 3, Volume 7, July 2012
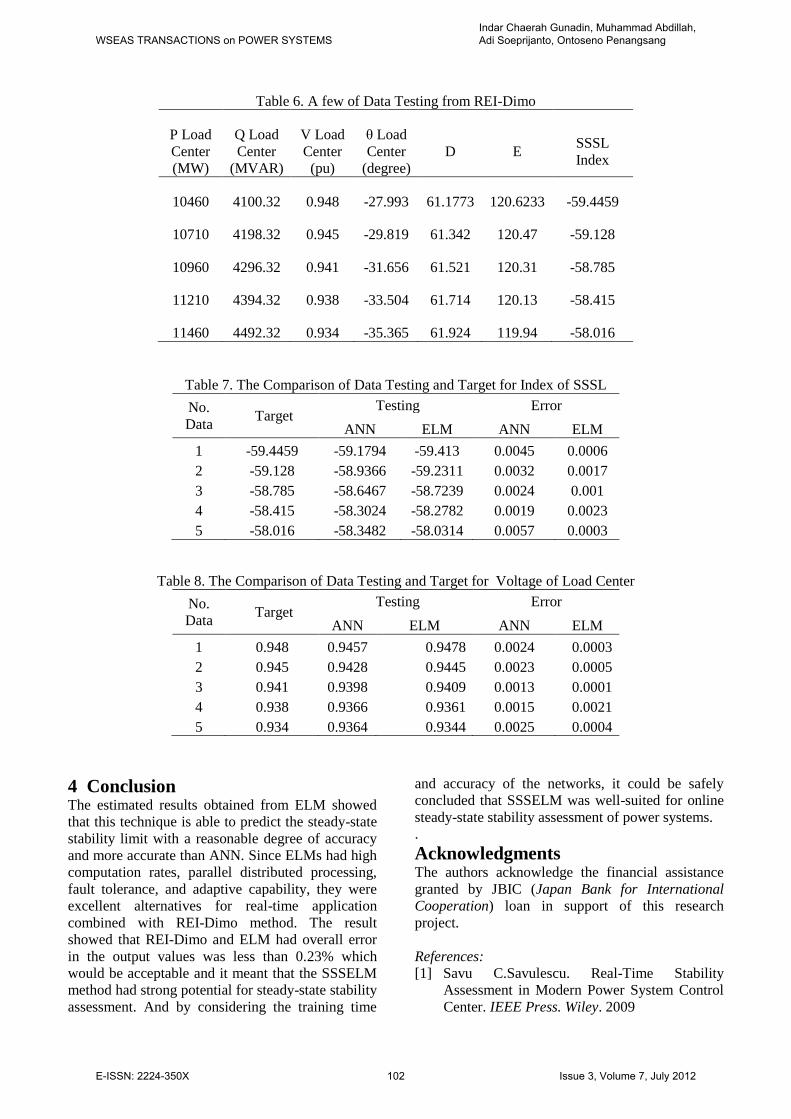
Table 6. A few of Data Testing from REI-Dimo
P Load
Center
(MW)
Q Load
Center
(MVAR)
V Load
Center
(pu)
θ Load
Center
(degree) D E
SSSL
Index
10460 4100.32 0.948 -27.993 61.1773 120.6233 -59.4459
10710 4198.32 0.945 -29.819 61.342 120.47 -59.128
10960 4296.32 0.941 -31.656 61.521 120.31 -58.785
11210 4394.32 0.938 -33.504 61.714 120.13 -58.415
11460 4492.32 0.934 -35.365 61.924 119.94 -58.016
Table 7. The Comparison of Data Testing and Target for Index of SSSL
No.
Data Target
Testing Error
ANN ELM ANN ELM
1 -59.4459 -59.1794 -59.413 0.0045 0.0006
2 -59.128 -58.9366 -59.2311 0.0032 0.0017
3 -58.785 -58.6467 -58.7239 0.0024 0.001
4 -58.415 -58.3024 -58.2782 0.0019 0.0023
5 -58.016 -58.3482 -58.0314 0.0057 0.0003
Table 8. The Comparison of Data Testing and Target for Voltage of Load Center
No.
Data Target
Testing Error
ANN ELM ANN ELM
1 0.948 0.9457 0.9478 0.0024 0.0003
2 0.945 0.9428 0.9445 0.0023 0.0005
3 0.941 0.9398 0.9409 0.0013 0.0001
4 0.938 0.9366 0.9361 0.0015 0.0021
5 0.934 0.9364 0.9344 0.0025 0.0004
4 Conclusion The estimated results obtained from ELM showed
that this technique is able to predict the steady-state
stability limit with a reasonable degree of accuracy
and more accurate than ANN. Since ELMs had high
computation rates, parallel distributed processing,
fault tolerance, and adaptive capability, they were
excellent alternatives for real-time application
combined with REI-Dimo method. The result
showed that REI-Dimo and ELM had overall error
in the output values was less than 0.23% which
would be acceptable and it meant that the SSSELM
method had strong potential for steady-state stability
assessment. And by considering the training time
and accuracy of the networks, it could be safely
concluded that SSSELM was well-suited for online
steady-state stability assessment of power systems.
.
Acknowledgments The authors acknowledge the financial assistance
granted by JBIC (Japan Bank for International
Cooperation) loan in support of this research
project.
References:
[1] Savu C.Savulescu. Real-Time Stability
Assessment in Modern Power System Control
Center. IEEE Press. Wiley. 2009
WSEAS TRANSACTIONS on POWER SYSTEMSIndar Chaerah Gunadin, Muhammad Abdillah, Adi Soeprijanto, Ontoseno Penangsang
E-ISSN: 2224-350X 102 Issue 3, Volume 7, July 2012
[2] Cornel Aldea, Savu C.Savulescu, Evaluation
Of The Stability Reserve Of Transelectrica‘s
Transmission System By Using Quickstab
Professional, National Conference of Energy
CNE, 2004
[3] Ching-Yin Lee, ShaoHong Tsai, Yuan-Kang
Wu. A New Approach to The Assessment os
Steady-State Voltage Stability Margin Using P-
Q-V Curve, Electrical Power and Energy
System. 2010
[4] Yang Wang, Wenyuan Li, Jiping Lu, A New
Node Voltage Stability Index Based on Local
Phasors, Electrical Power and Energy System.
2009; 79; 265-271
[5] M.Moghavveni, M.O. Faruque, Power Systm
Security and Voltage Collapse: A Line Outage
Based Indicator for Prediction, Electrical
Power and Energy System, 1999; 21; pp 455-
461
[6] M.H. Haque. A Fast Method for Determining
The Voltage Stability Limit of a Power System.
Electrical Power and Energy System, 1995; 32;
pp.35-43
[7] Savu C. Savulescu, Solving Open Access
Transmission And Security Analysis Problem
with The Short-Circuit Current Method, Latin
America Power Conference, Mexico,2002, Pp.
1-5
[8] B.Jeyasurya, Extreme Learning Machine fo
Power System Steady-State Voltage Instability
Evaluation. Electrical Power and Energy
System, 2010, 29, pp.85-90
[9] Larsson, Alain Germond, Boming Zhang.
Application of Neural Networks to the
Identification of Steady State Equivalents of
External Power Systems, International
Conference On Power System
Technology,Chongqing, October 2006
[10] Savu C. Savulescu. Equivalent For Security
Analysis of Power System, IEEE Transactions
on Power Apparatus and System, 1981, 100(5)
, pp.2672-2682
[11] C.W. Taylor, D. C. Erickson, K. E. Martin, and
V. Venkatasubramanian, ―WACS-wide-area
stability and voltage control system: R&D and
online demonstration,‖ Proceedings of the
IEEE, May 2005, Vol. 93, No. 5, pp. 892 –
906,
[12] G. Benmouyal, E.O. Schweitzer, and A.
Guzman, ―Synchronized Phasor Measurement
in Protective Relays for Protection, Control,
and Analysis of Electric Power Systems,‖
Western Protection Relay Conference, 29
Annual, October 2002
[13] IEEE/CIGRE Joint Task Force on Stability
Terms and Definitions, Definition and
Classification of Power System Stability, IEEE
Transactions on Power Systems, May 2004Vol.
19, No. 2, pp.1387-1401.
[14] Y.Xu, Z.Y.Dong, K.Meng, R.Zhang,
K.P.Wong, Real-time Transient Stability
Assessment Model Using Extreme Learning
Machine, IET Gener. Transm. Distrb., 2011,
Vol.5, Iss.3, pp.314-322
[15] Huang, G.-B., Zhu, Q.-Y., Siew, C.-K.:
‗Extreme learning machine: theory and
applications‘, Neurocomputing, 2006, 70, pp.
489–501
[16] Huang, G,-B, Xiaojian Ding, Hongming Zhou,
Optimization Method Based Extreme Learning
Machine for Classification, Neurocomputing,
2010, 74, pp.155-163
[17] Qin-Yu Zhu, A.K. Qin, P.N. Suganthan,
Guang-Bin Huang Evolutionary extreme
learning machine, Pattern Recognition Society,
2005, 38, pp. 1759 – 1763
[18] G.-B. Huang, et al., ―Universal Approximation
Using Incremental Networks with Random
Hidden Computational Nodes‖, IEEE
Transactions on Neural Networks, vol. 17, no.
4, pp. 879-892, 2006
[19] Guang-Bin Huang, Hongming Zhou, Xiaojian
Ding, and Rui Zhang, IEEE Transactions on
Systems, Man, and Cybernetics—Part B:
Cybernetics, Vol. 42, No. 2, April 2012
WSEAS TRANSACTIONS on POWER SYSTEMSIndar Chaerah Gunadin, Muhammad Abdillah, Adi Soeprijanto, Ontoseno Penangsang
E-ISSN: 2224-350X 103 Issue 3, Volume 7, July 2012