
Determination of rock acoustic properties at low...
26
© 2013 American Geophysical Union. All Rights Reserved. Determination of rock acoustic properties at low frequency: A differential acoustical resonance spectroscopy device and its estimation technique Jianguo Zhao † , Genyang Tang † , Jixin Deng ‡ , Xiaolong Tong † , and Shangxu Wang † † China University of Petroleum (Beijing), State Key Laboratory of Petroleum Resources and Prospecting; Key Laboratory of Geophysical Prospecting, CNPC, ChangPing, Beijing, 102249, China. Tel (Fax): +86(10)89731776 Jianguo Zhao: [email protected] Genyang Tang: [email protected] Xiaolong Tong: [email protected] Corresponding author: Shangxu Wang: [email protected] ‡ Chengdu University of Technology, Chengdu, China, Institute of Geophysics Jixin Deng: [email protected] This article has been accepted for publication and undergone full peer review but has not been through the copyediting, typesetting, pagination and proofreading process, which may lead to differences between this version and the Version of Record. Please cite this article as doi: 10.1002/grl.50346 Accepted Article
Transcript of Determination of rock acoustic properties at low...

© 2013 American Geophysical Union. All Rights Reserved.
Determination of rock acoustic properties at low frequency: A differential
acoustical resonance spectroscopy device and its estimation technique
Jianguo Zhao†, Genyang Tang†, Jixin Deng‡,
Xiaolong Tong†, and Shangxu Wang†
†China University of Petroleum (Beijing), State Key Laboratory of Petroleum
Resources and Prospecting; Key Laboratory of Geophysical Prospecting, CNPC,
ChangPing, Beijing, 102249, China.
Tel (Fax): +86(10)89731776
Jianguo Zhao: [email protected]
Genyang Tang: [email protected]
Xiaolong Tong: [email protected]
Corresponding author: Shangxu Wang: [email protected]
‡Chengdu University of Technology, Chengdu, China, Institute of Geophysics
Jixin Deng: [email protected]
This article has been accepted for publication and undergone full peer review but has not been through the copyediting, typesetting, pagination and proofreading process, which may lead to differences between this version and the Version of Record. Please cite this article as doi: 10.1002/grl.50346 A
ccep
ted
Arti
cle

© 2013 American Geophysical Union. All Rights Reserved.
Abstract
A laboratory device, Differential Acoustic Resonance Spectroscopy (DARS),
has been developed to investigate the acoustic properties of rock materials below 1
KHz. The device is based on analyzing shifts of resonance frequency of a cavity
perturbed by the presence of a small sample. Numerical and experimental studies
have previously shown that this technique can be used to estimate the
compressibility of samples. In this study, we adopt a nonlinear least-squares
whole-curve-fitting inversion approach, which for the first time allows estimation of
both the compressibility and density of rock samples. In comparison to previous
estimation techniques, this inversion method provides more reliable estimation of
rock acoustic properties. This research proves that the DARS laboratory device, in
conjunction with the calibration technique proposed herein, is a useful tool to
estimate the properties of small rock samples. In addition, the simultaneous
estimation of compressibility and density can potentially provide information on
porosity and, by extension, a link between porosity and acoustic modulus at low
frequency.
1. Introduction
Seismic wave propagation in fluid-saturated rocks is usually frequency
dependent. Many theories have been developed to predict or interpret this
Acc
epte
d A
rticl
e

© 2013 American Geophysical Union. All Rights Reserved.
frequency-dependency [Biot, 1956; Dvorkin and Nur, 1993; King and Marsden,
2002]. However, these theoretical models remain unconstrained by experimental
data because of the scarcity of laboratory measurements at frequencies below MHz
range. In fact, the acoustic properties measured by the ultrasonic techniques are
usually directly applied to seismic data interpretation and inversion regardless of
their dependency on frequency. As low-frequency measurements are not readily
available, considerable effort is expended reconciling acoustic properties measured
at different frequency bands. To measure acoustic properties at lower frequencies,
typical approaches include the resonance bar and the forced oscillation methods. The
resonance bar technique can operate in the kilohertz frequency range, which is close
to that used in acoustic logging and seismic exploration [Cadoret et al., 1995; Yin et
al., 1992]. The forced oscillation method, or stress-strain measurement, records
deformation as cyclic loading is exerted on rock samples, and can measure acoustic
properties at a frequency range as low as several hertz [Spencer 1981; Gribb and
Cooper, 1998; Jackson et al., 2011; Batzle et al., 2006]. These methods have their
own merits and limitations in terms of operation and sample preparation.
We have developed a new measurement system to investigate the acoustic
properties of rock samples at frequencies below 700 Hz. The system is based on
differential acoustic resonance spectroscopy (DARS), which has been explored in
several recent papers [Harris et al., 2005; Xu et al., 2007; Wang et al., 2012]. The
DARS concept is based on perturbation theory. The resonance frequency of a
Acc
epte
d A
rticl
e

© 2013 American Geophysical Union. All Rights Reserved.
fluid-filled cavity is dependent on the sonic velocity of the fluid and the length of
the cavity. The introduction of a sample into the cavity perturbs the resonance
properties of the system. Therefore, the acoustic properties of samples can be
inferred from the resonant frequency shift between measurements with and without
the sample present. Wang et al. [2012] used an amended DARS perturbation
formula to determine system calibration coefficients. However, this calibration
technique was based on a one-data-point fitting approach. Because it only used
partial information from among abundant measurements of resonance frequencies
for the estimation of the acoustic properties, this approach suffers from random error
and loss of information. In this paper, we present an improved calibration technique,
a whole-curve-fitting inversion method, to estimate the acoustic properties of rock
samples. Using the measured resonance frequencies with the sample at various
locations inside the resonance cavity, this inversion technique can provide more
reliable estimation of acoustic properties than the one-data-point fitting method.
Noticeably, only compressibility can be obtained with the one-data-point approach,
whereas the proposed technique can be used to estimate not only compressibility but
density of the samples. We apply the technique to the estimation of acoustic
properties of six rock samples, two artificial and four drilled rock samples. Note that
the simultaneous measurements of both compressibility and density of
fluid-saturated rock provides a possibility to calculate porosity, which can be used to
establish a relationship between rock acoustic properties and porosity in the same
Acc
epte
d A
rticl
e

© 2013 American Geophysical Union. All Rights Reserved.
experiment, which will be a great gain in understanding the properties of
fluid-saturated rocks.
2. DARS Perturbation Equation
Based on the derivation of Wang et al. [2012], the DARS perturbation equation
is
2 2 2 20 00 0
0
S S S SS S
C S C
V VA BV V
κ κ ρ ρω ω ω ωκ ρ− −
− = − − . (1)
where
1 2 1 2
1 2 1 22
0
1 ,
/ .
S C
S C
C
S V V
C
S V V
VA p p dV p p dVV
VB p p dV p p dVV k
k cω
=
= ∇ ⋅∇
=
∫ ∫
∫ ∫
,
In equation (1), CV and SV are the volumes of the cavity and test sample,
respectively. We use 0ω and sω to denote the resonant frequencies of the cavity
with and without sample, 0κ and sκ to denote the compressibility parameters of
the cavity fluid and test sample, and 0ρ and sρ to denote the densities of the
cavity fluid and test sample, respectively. The parameter c is the sonic velocity in
the cavity fluid, and 0 /k cω= is the wave number. The acoustic pressure fields 1p
and 2p are those for cavity conditions with and without a sample. The coefficients
A and B give the ratio of the energy density of the acoustic pressure and particle
velocity field inside the sample to that of the acoustic pressure field inside the cavity
when resonance occurs, reflecting the acoustic properties of the measurement
system. As shown in Figure 1, the acoustic pressure field inside the cavity has a
Acc
epte
d A
rticl
e
© 2013 American Geophysical Union. All Rights Reserved.
spatially varying but harmonic distribution when the fundamental mode resonance
occurs. Theoretically, the acoustic pressure has a cosine function distribution along
the longitudinal direction. There are two particular locations at which acoustic
pressure or velocity reach their maxima. For the fundamental mode, an acoustic
pressure node occurs where sonic velocity is at its maximum, and a velocity node
with acoustic pressure at its maximum. At these locations, either A or B is zero.
Equation (1) shows that the compressibility contrast, 00 /)( κκκ −s , and the
density contrast, ss ρρρ /)( 0− , between a test sample and the fluid inside the cavity,
both contribute to the resonance frequency shift. Thus, the perturbation equation (1),
in conjunction with DARS measurements, can be used to estimate the acoustic
properties of a sample.
3. Algorithms to Determine Acoustic Properties
3.1. One-data-point-fitting Method
To measure compressibility, a sample is positioned at a velocity node, where
21 pp ∇⋅∇ vanishes, and equation (1) can be reduced to
'0 0
0 0
ωωκκωκ
s sSC V− −
= , (2)
using approximation 0ωω ≈s . The calibration coefficient 'C , which is related to
the cavity geometry and experimental conditions (i.e. temperature and ambient
pressure), can be obtained from the measured resonance frequency shift and known
compressibility and volume of a reference sample.
Acc
epte
d A
rticl
e

© 2013 American Geophysical Union. All Rights Reserved.
The calculation of compressibility based on equation (2) is called the
one-data-point method, in which only the resonance frequency measured at the
velocity node is used. This inevitably causes some limitations because
measurements at other positions have been made redundant, and errors may arise
due to individual measurement uncertainties or inaccurate positioning of the sample.
So far, the one-data-point approach has performed better with samples of high
compressibility than with those of low and medium compressibility, in terms of the
estimation accuracy of acoustic properties [Wang et al., 2012]. We expect that the
DARS measurements with a sample at multiple locations inside the cavity will
effectively suppress the errors caused by fluctuations in experiment conditions or
measurement uncertainty, thus contributing to more accurate estimates for samples
of low compressibility. Moreover, an important feature of multiple location-based
DARS measurements is that both compressibility and density parameters can be
obtained through a whole-curve-fitting inversion.
3.2. Whole-curve-fitting Inversion
The whole-curve-fitting inversion involves a nonlinear least-squares fitting
technique, and it provides a solution to both compressibility and density of a sample.
In this technique, the second term of the right side of equation (1) is no longer
negligible, as the measurements at other positions along the cavity axis (See Figures
1, 2a) will be used for the estimation of the acoustic properties. Accordingly, the
Acc
epte
d A
rticl
e

© 2013 American Geophysical Union. All Rights Reserved.
coefficients A and B should be determined for each measurement location. At any
location ( , 1, 2iz i n= ), an expression relating the measured resonance frequency
to the contrast in acoustic properties between the sample and the fluid can be
obtained
2 22 0 0 0
0
(1 ) , 1, 211 ( 1)i
si
s i
B i nA
ω ω ρ ρωκ
κ
− −= =
+ − , (4)
where izz
C
Si A
VVA == ,
izzC
Si B
VV
B == , 1
s
ρρ
= . Using a least-squares based
nonlinear fitting technique, the measured data sets { }2,, , 1, 2 ,i s iz i nω = can be
fitted by minimizing the objective function
2
2 220 0 0,
1
0
(1 )11 ( 1)
ni
s ii
s i
BYA
ω ω ρ ρ ωκ
κ=
− − = − + −
∑ .
(5)
The solution set { },sκ ρ is thus determined through a nonlinear fitting procedure.
Accurate estimation of the calibration coefficients, iA and iB , is crucial for the
non-linear inversion. We use two different approaches to determine the calibration
coefficients, and compare their effects on the inversion by numerical and
experimental studies.
For the frequency perturbation equation, the volume of a sample must be
negligible compared to that of the cavity, namely, SVV >>C . Numerical modeling
suggests that the sample volume should be less than 5% of the cavity volume [Wang
Acc
epte
d A
rticl
e

© 2013 American Geophysical Union. All Rights Reserved.
et al., 2012]. Under these conditions, we have the approximation for the acoustic
pressure field, )cos( 021 zkpp ≈≈ , where c
k 00
ω= and
Lcπω =0 for the
fundamental mode resonance (with L as the cavity length) .
When a sample is measured at a given location, zz = , as shown in Figure 1,
the coefficients A and B can be obtained by calculating the volume integrals in
equation (1). The results are
0 2 0 1
0 2 1
0 2 0 1
0 2 1
sin(2 ) sin(2 )1 ,2 ( )
sin(2 ) sin(2 )1 .2 ( )
z z
z z
k z k zAk z z
k z k zBk z z
=
=
−= +
−−
= −−
(6)
where 1z and 2z denote the bottom and top ends of the sample, respectively. The
determination of A and B with this approach is referred to as Method 1.
The approximation, )cos( 021 zkpp ≈≈ , is reasonable to a great extent, especially
if DARS measurements are under stable conditions (e.g., consistent room
temperature) and with samples of high compressibility. The whole-curve-fitting
inversion can then be implemented with these known coefficients A and B. However,
for samples of low compressibility (e.g. fluid-saturated rocks), and/or under variable
temperature and pressure conditions, this approximation is more open to question.
Therefore, we propose an alternative method to obtain the coefficients, A and B,
at zz = by using two reference samples instead of calculating the integrals in
equation (1). In this method (hereafter referred to as Method 2), the resonance
frequencies corresponding to two reference samples of known acoustic properties
and volumes, can be measured at any location, thus, the calibration coefficients, A
Acc
epte
d A
rticl
e

© 2013 American Geophysical Union. All Rights Reserved.
and B, can be obtained by simply solving a binary linear equation system. Using the
whole-curve-fitting inversion with the calibration coefficients obtained by Method 2,
we conjecture that the estimation of both compressibility and density of samples can
be more accurately achieved. Particularly, we anticipate that the estimation of the
acoustic properties of samples with low compressibility may be significantly
improved.
4. Implementation of whole-curve-fitting Inversion
4.1. Numerical study
A numerical study was conducted to investigate how the whole-curve-fitting
inversion, with the determination of the calibration coefficients A and B using the
two proposed methods, exhibits different performance in terms of the estimation
accuracy of the compressibility and density of samples with a large range of
compressibility. Commercial finite element simulation software, COMSOL, was
used in the numerical modeling. Mathematically, the simulation of DARS
measurements with COMSOL consists of solving an eigen-frequency problem with
the following boundary conditions, 0p = (free boundary) for the top and bottom
(open) sides of the cavity, and 0ip∇ ⋅ =n (rigid boundary) for the side surface of
the cavity [Wang et al., 2012]. A three-dimensional DARS model, shown in Figure
2a, is used in the simulation. The acoustic properties of 18 hypothetical samples
used in the study, including the sonic velocity v , the density ρ , and the
compressibility defined by 2 1( )i i icκ ρ −= , are listed in Table 1. All cylindrical
Acc
epte
d A
rticl
e

© 2013 American Geophysical Union. All Rights Reserved.
samples had the same diameter (0.028m) and length (0.05m). Resonance frequencies
were simulated with the sample positioned at the same locations as in the real
experiments. These resonance frequencies were then used to invert for both
compressibility and density of a test sample using the whole-curve-fitting technique.
Figures 2c and 2d show the estimated compressibility and density of the synthetic
samples, using the two different methods outlined above. For comparison, Figure 2b
shows the sample compressibility based on the one-data-point fitting method. The
compressibility estimations obtained with the whole-curve-fitting method are
comparable to those inverted using the one-data-point method. Figure 2d, which
shows the results of the whole-curve-fitting method using the calibration parameters
obtained from Method 2, demonstrates that the latter method can provide good
density estimation for all samples. However, for samples of low compressibility, the
densities estimated with this method using the calibration parameters determined by
Method 1 deviate slightly from the true values as seen in Figure 2c. This is
anticipated, since these coefficients are calculated based on the assumption that the
pressure field obeys the cosine function distribution, which may be inaccurate when
the sample has relatively low compressibility and high density, and when the
boundary conditions do not apply [Wang et al., 2012]. Nevertheless, this assumption
is useful when we do not have reference samples.
4.2. Laboratory measurements and discussion
Acc
epte
d A
rticl
e

© 2013 American Geophysical Union. All Rights Reserved.
Eight samples from different sources have been measured for their acoustic
properties. A detailed description of these samples is given in the supplementary
material. Of these samples, Al-1 and Lu-1 are two standard (reference) samples,
consisting of aluminum and Lucite, with compressibilities of 0.01314 GPa-1 and
0.17410 GPa-1, and densities of 2.684 g/cm3 and 1.181 g/cm3, respectively; S10-1
and S10-2 are two artificial sandstone samples; and D7-1, D11-1, D13-2, and D36-1
are four sandstone samples from drilled cores. Their dimensions, density, and
compressibility (ultrasonic measurements) in the saturated condition are listed in
Table 2 (also see the supplement material for measurements under the dry condition).
The compressibility of these samples was calculated from the P- and S-wave
velocities obtained by ultrasonic measurements under room temperature and
atmospheric pressure, and the density obtained directly from mass and volume
measurements.
Each sample was measured at 75 positions along the cavity axis at intervals of
12 mm. The frequency range for searching the resonance frequency at each sample
position was from 565 Hz to 665 Hz. Such measurements were conducted 10 times
for each sample to further assess the measurement repeatability. Figure 3a shows the
recorded resonance curves for the empty cavity and the two standard samples (Al-1
and Lu-1), for measurements at a fixed location. As shown in Figure 3a, the
resonance frequency shift from the resonance frequency of the empty cavity caused
by A1-1 was larger than that caused by Lu-1. Because the compressibility and
Acc
epte
d A
rticl
e

© 2013 American Geophysical Union. All Rights Reserved.
density of the other six rock samples are between those of aluminum and Lucite, it
can be anticipated that their resonance curves (omitted in Figure 3a) should also lie
between those of Al-1 and Lu-1. Using the Lorentzian curve-fitting technique [Xu,
2007], the resonance frequencies for each sample at different locations can be
obtained. Figure 3b shows the resonance frequencies for the two standard samples at
different positions.
We carried out the whole-curve-fitting inversions for the acoustic properties of
the samples in two steps. First, we obtained the calibration coefficients A and B with
Method 1 for the reference samples (Al-1 and Lu-1), which were then used for the
whole-curve-fitting inversion. The resulting inverted compressibility and density
values are listed in the supplementary material. For Lu-1, we obtained a resonance
frequency curve perfectly fitted with the DARS measurements, as shown in Figure
3d. The inversion results,κ = 0.17523 (GPa-1), and ρ =1.179 (g/cm3), agree well
with the true values: realκ = 0.17410 (GPa-1), and realρ =1.181 (g/cm3). For Al-1,
Figure 3c shows that the inversion curve matches the DARS measurements well,
with some deviation at the extremes. The inverted density obtained with this
approach, ρ =3.043 (g/cm3), is higher than its true value of 2.698 (g/cm3), whereas
the inverted compressibility, 0.01355 (GPa-1), is comparable to the true value,
0.01307 (GPa-1). Generally, the inversion results conform to the observation in the
numerical study. For samples with extremely low compressibility, the
whole-curve-fitting inversion approach with the calibration coefficients A and B
Acc
epte
d A
rticl
e

© 2013 American Geophysical Union. All Rights Reserved.
obtained with Method 1 appeared to cause a larger error for density than for
compressibility.
Next, Al-1 and Lu-1 were used as two reference samples to obtain the
calibration coefficients A and B through Method 2, and the whole-curve-fitting
inversions were carried out for the 6 rock samples. The rock samples were saturated
with silicon oil, put in a vacuum for two days to extract air inside them, and in a
container with 5 MPa pore pressure for two more days, before they were sealed on
the outer wall (with both ends open). The resonance frequency measurements for the
samples were made under normal room conditions. For each rock sample, we
obtained the estimated compressibility and density when the objective function Y in
equation (5) was minimized. The estimated compressibility and density values of the
6 sandstone samples, and the relative errors between different techniques-estimated
compressibilities and densities, are given in the supplementary material. Figure 4
shows a comparison between the compressibility and density inverted with the
whole-curve-fitting technique and measured by the ultrasonic technique. Low
standard deviations for both the estimated density and compressibility indicate that
the DARS-based measurements, in conjunction with the whole-curve-fitting
inversion approach, can give consistent and reliable estimates of the acoustic
properties. In Figures 4a and 4b (also see the supplementary material), the relative
error between the estimated and true densities is seen to be the largest for D7-1. The
DARS-estimated compressibility for the 6 samples have large relative errors in
Acc
epte
d A
rticl
e

© 2013 American Geophysical Union. All Rights Reserved.
contrast to the ultrasonic measurements, but relatively low standard deviations,
which also give us confidence that the DARS-estimated compressibility is
reasonable considering the large frequency contrast between the ultrasonic and
DARS measurements. Figure 4a shows the compressibility values obtained using the
DARS inversion, the Gassmann fluid substitution (see supplementary material for
input parameters), and the ultrasonic measurements. The frequency dependence of
the compressibility is plotted in Figure 4(c). For the artificial sandstones (S10-1 and
S10-2) with simple pore shapes, their compressibilities only show weak frequency
dependency. This reflects that the wave-induced pore pressure can reach equilibrium
at the measured frequency of DARS and even ultrasonic frequency, which satisfies
the basic assumptions of the Gassmann equation [Gassmann et al., 1951]. Thus, for
this kind of rock samples, even ultrasonic frequency can be considered in the
low-frequency regime, which implies that the Gassmann equation is applicable in a
wide frequency range. For the reservoir rocks, obvious discrepancy between the
ultrasonic and DARS measurements can be observed, which is mainly attributed to
complex pore shapes and the presence of clay. This complexity gives rise to a
variety of dispersion mechanisms [King and Marsden, 2002; Batzle et al., 2006],
such as squirt flow, which contributes to the apparent compressibility variation.
Similar to the artificial sandstones, the DARS-estimated compressiblities for the
four reservoir rock samples are closer to the values obtained using the Gassmann
equation. However, for the specimens D11-1 and D13-2, the Gassmann equation
Acc
epte
d A
rticl
e

© 2013 American Geophysical Union. All Rights Reserved.
gives errors of about 10%, which are not negligible or simply attributed to
measurement errors. Therefore, for some sedimentary rocks, the DARS frequency
(about 600Hz) and even seismic frequency would not be in the low-frequency
regime. Under the circumstances, the Gassmann equation would lose some validity,
and the direct low-frequency measurement is essential.
5. Conclusion
A DARS laboratory device, operating in a low frequency range, has been
developed to estimate the acoustic properties of rock samples. In comparison with
other important low-frequency measurement techniques, the DARS-based
measurement is easy and less time-consuming to operate.
The proposed whole-curve-fitting technique, which makes full use of all
resonance frequencies measured for samples at different positions in the cavity, can
be used to estimate both compressibility and density of the sample, in contrast to the
one-data-point approach which only estimates compressibility. A critical aspect of
this technique is the improved accuracy of the calibration coefficients, which yields
more reliable estimation of the acoustic properties of samples, particularly those
with relatively low compressibility. The numerical and experimental studies in this
work show that the whole-curve-fitting technique, in conjunction with the
calibration coefficients A and B obtained by measuring two reference samples, can
achieve fairly good accuracy for both compressibility and density in the frequency
range below 700 Hz. The DARS measurements have been applied to compressibility
Acc
epte
d A
rticl
e

© 2013 American Geophysical Union. All Rights Reserved.
and density estimates of fluid-saturated rock samples at the first time, and the
differences in measured compressibility between the DARS method, ultra-sonic
measurements, and the Gassmann estimation reflect substantial frequency
dependence of the compressibility. Therefore, we conclude that the laboratory
device, in conjunction with the whole-curve-fitting inversion, is a useful tool to
estimate the properties of acoustically small rock samples in the low frequency
range. Further, the DARS device and the inversion method could potentially be used
to estimate the porosity of rock samples, hence establishing a relationship between
porosity and other petrophysical properties of reservoir rocks. An improved version
of DARS is being developed to apply high pressure and temperature, in order to
simulate the in situ response of reservoir rocks.
Acknowledgement
This work is sponsored by 973 Program “Fundamental Study on the Geophysical
Prospecting of the Deep-layered Oil and Gas Reservoirs” (Grant No. 2013CB228600),
CNPC 125 program “Multiple-frequency-band analysis of seismic rock physics”
(2011A-3606), the Program for Changjiang Scholars and Innovative Research Team
in University (PCSIRT), Science Foundation of China University of Petroleum,
Beijing (KYJJ2012–05-02), and the Nation Natural Science Foundation of China
Research (Grant No. 41274138).
Acc
epte
d A
rticl
e

© 2013 American Geophysical Union. All Rights Reserved.
Reference
Batzle, M. L., D. H. Han, and R. Hofmann (2006), Fluid mobility and
frequency-dependent seismic velocity-Direct measurements, Geophysics, 71, 1–9,
doi:10.1190/1.2159053.
Biot, M. A. (1956), Theory of propagation of elastic waves in a fluid saturated
porous solid: II. Higher frequency range, Journal of the Acoustic Society of America,
28, 179–191.
Cadoret, T., D. Marion, and B. Zinszner (1995), Influence of frequency and fluid
distribution on elastic wave velocities in partially saturated limestones, Journal of
Geophysical Research, 100(B6), 9789–9803, doi:10.1029/95JB00757.
Dvorkin, J., and A. Nur (1993), Dynamic poroelasticity: a unified model with the
squirt and the Biot mechanisms, Geophysics, 58, 524–533, doi: 10.1190/1.1443435.
Gassmann, F.(1951),U¨ ber die elastizita¨ t poro¨ sermedien:Vierteljahrsschrift der
Naturforschenden Gesellschaft in Zurich, 96, 1–23.
Gribb, T., and R. Cooper (1998), A high-temperature torsion apparatus for the
high-resolution characterization of internal friction and creep in refractory metals and
ceramics: Application to the seismic-frequency, dynamic response of Earth’s upper
mantle, Rev. Sci. Instrum., 69(2), 559–564, doi:10.1063/1.1148694. Acc
epte
d A
rticl
e

© 2013 American Geophysical Union. All Rights Reserved.
Harris, J. M., Y. L. Quan, and C. T. Xu (2005), Differential acoustic resonance
spectroscopy: An experimental method for estimating acoustic attenuation in porous
media, paper presented at 75th Annual International Meeting, SEG, Expanded
Abstracts.
Jackson, Ian, Heather Schijns, Douglas R. Schmitt, Junjie Mu, and Alison
Delmenico (2011), A versatile facility for laboratory studies of viscoelastic and
poreelastic behaviour of rocks, Rev. Sci. Instrum., 82, 064501(1–8)
King, M. S., and R. J. Marsden (2002), Velocity dispersion between ultrasonic and
seismic frequencies in brine-saturated reservoir sandstones, Geophysics, 67,
254–258, doi: 10.1190/1.1451700.
Spencer, J. W. (1981), Stress relaxation at low frequencies in fluid saturated rocks:
Attenuation and modulus dispersion, J. Geophys. Res., 86, 1803–1812,
doi:10.1029/JB086iB03p01803.
Wang, S-X, J-G Zhao, Z-H Li, J. M. Harris, and Y. Quan (2012), Differential
Acoustic Resonance Spectroscopy for the acoustic measurement of small and
irregular samples in the low frequency range, J. Geophys. Res., 117, B06203, doi:
10.1029/2011JB008808.
Xu, C. T. (2007), Estimation of effective compressibility and permeability of porous
materials with Differential Acoustic Resonance Spectroscopy, Ph.D. thesis,
Department of Geophysics, Stanford university, Palo alto, CA. Acc
epte
d A
rticl
e

© 2013 American Geophysical Union. All Rights Reserved.
Yin, C. S., M. L. Batzle, and B. J. Smith (1992), Effects of partial liquid/gas
saturation on extensional wave attenuation in Berea Sandstone, Geophysical
Research Letters, 19, 1399–1402, doi:10.1029/92GL01159.
Acc
epte
d A
rticl
e

© 2013 American Geophysical Union. All Rights Reserved.
Figure 1. DARS setup and the pressure field in the cavity. (a) Diagram of the DARS setup. A
cylindrical cavity with open ends is immersed in a tank filled with silicon oil. Source and
receiver are connected to a lock-in amplifier through a power amplifier and a preamplifier,
respectively. A computer-controlled stepper motor is used to control sample positioning. (b)
Acoustic pressure antinode (velocity node) and velocity antinode (pressure node) in the cavity.
Acc
epte
d A
rticl
e
© 2013 American Geophysical Union. All Rights Reserved.
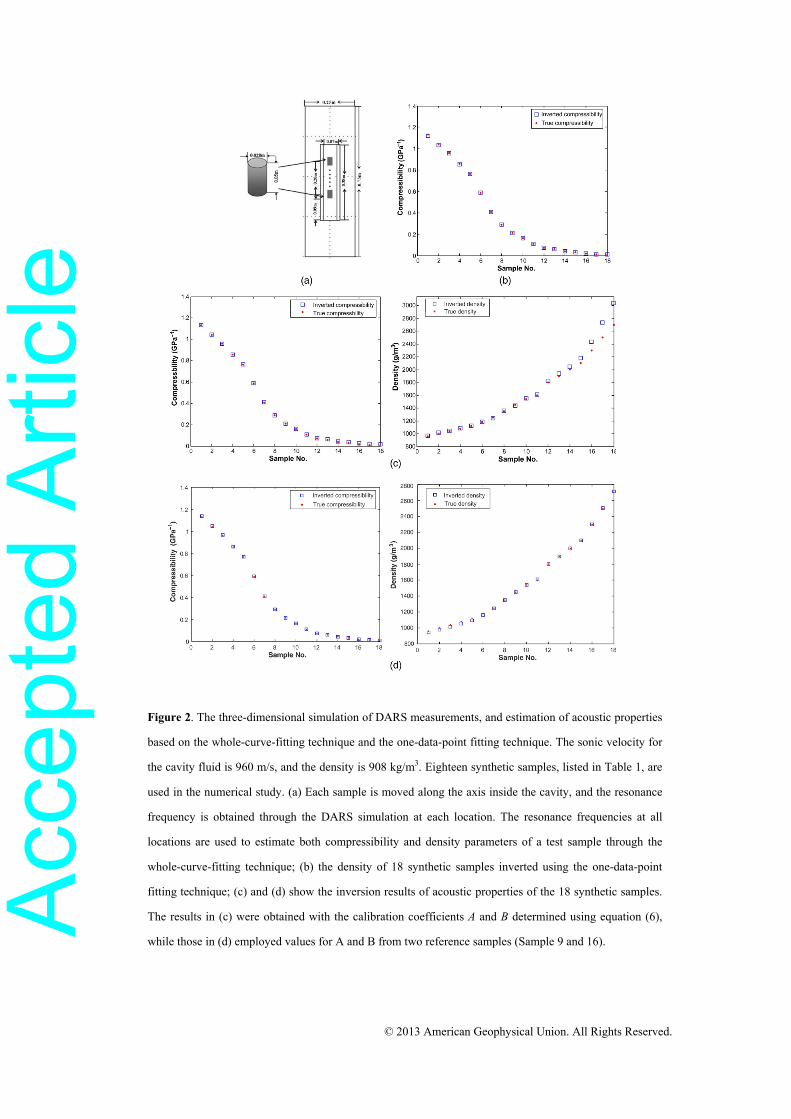
Figure 2. The three-dimensional simulation of DARS measurements, and estimation of acoustic properties
based on the whole-curve-fitting technique and the one-data-point fitting technique. The sonic velocity for
the cavity fluid is 960 m/s, and the density is 908 kg/m3. Eighteen synthetic samples, listed in Table 1, are
used in the numerical study. (a) Each sample is moved along the axis inside the cavity, and the resonance
frequency is obtained through the DARS simulation at each location. The resonance frequencies at all
locations are used to estimate both compressibility and density parameters of a test sample through the
whole-curve-fitting technique; (b) the density of 18 synthetic samples inverted using the one-data-point
fitting technique; (c) and (d) show the inversion results of acoustic properties of the 18 synthetic samples.
The results in (c) were obtained with the calibration coefficients A and B determined using equation (6),
while those in (d) employed values for A and B from two reference samples (Sample 9 and 16).
Acc
epte
d A
rticl
e

© 2013 American Geophysical Union. All Rights Reserved.
Figure 3. Implementation of the whole-curve-fitting inversion for two standard samples, Al-1 and Lu-1. (a)
Normalized pressure amplitude with scanning frequency, (b) resonance frequencies with the sample at the
measurement locations along the cavity axis, and the whole-curve-fitting inversions for (c) Al-1, and (d)
Lu-1.
Acc
epte
d A
rticl
e

© 2013 American Geophysical Union. All Rights Reserved.
Figure 4. Comparison of compressibility and density parameters between the ultrasonic and DARS
measurements for six rock samples. Standard deviations of DARS-based compressibility and density
parameters for the six samples (red bar) are calculated from the whole-curve-fitting inversions of repeated
measurements (see text). Results employ A and B calculated by Method 2 using the two reference samples.
Acc
epte
d A
rticl
e

© 2013 American Geophysical Union. All Rights Reserved.
Table 1. Eighteen synthetic samples with their known compressibility and density values. The estimated
acoustic properties inverted from the simulated resonance frequencies using the whole-curve-fitting
technique (see text) are also listed. Samples No. 9 and 16 are used to obtain the calibration coefficients Ai
and Bi in equation (4).
Sample
No. Velocity
(m/s) Density (kg/m3)
Inversion results k(Gpa-1)
Inversion results Density (kg/m3) Error k
(Gpa-1) Error
1 960 960 943.960 -1.67% 1.13028 1.13700 0.59%
2 980 1000 979.495 -2.05% 1.04123 1.04680 0.53% 3 1000 1040 1015.200 -2.38% 0.96154 0.96610 0.47% 4 1040 1080 1055.000 -2.31% 0.85607 0.85960 0.41% 5 1080 1120 1094.600 -2.27% 0.76548 0.76810 0.34% 6 1200 1180 1163.200 -1.42% 0.58851 0.58990 0.24% 7 1400 1250 1246.400 -0.29% 0.40816 0.40870 0.13% 8 1600 1350 1349.600 -0.03% 0.28935 0.28950 0.05% 9 1800 1450 1450.000 0.00% 0.21286 0.21280 -0.03% 10 2000 1540 1539.900 -0.01% 0.16234 0.16230 -0.02% 11 2400 1600 1608.200 0.51% 0.10851 0.10850 -0.01% 12 2800 1800 1800.400 0.02% 0.07086 0.07080 -0.09% 13 3000 1900 1897.200 0.02% 0.05848 0.05840 -0.14% 14 3500 2000 1998.600 0.02% 0.04082 0.04080 -0.04% 15 4000 2100 2099.000 0.02% 0.02976 0.02970 -0.21% 16 5000 2300 2300.100 0.02% 0.01739 0.01740 0.05% 17 6000 2500 2503.700 0.02% 0.01111 0.01110 -0.10% 18 7000 2700 2711.300 0.02% 0.00756 0.00760 0.55%
Acc
epte
d A
rticl
e

© 2013 American Geophysical Union. All Rights Reserved.
Table 2. The dimensions and densities of two reference samples (aluminum and Lucite), two
artificial sandstone samples, and four drilled rock samples. Ultrasonic transmission measurements
were carried out for these samples.
Sample Material Diameter (mm)
Length (mm)
Mass (g)
Density (g/cm3)
Vp (m/s)
Vs (m/s)
κ (GPa-1)
Al-1 Aluminum 25.020 40.000 53.060 2.698 6399.70 3074.29 0.01307
Lu-1 Lucite 25.180 40.180 23.630 1.181 2773.25 1456.21 0.17410
S10-1 Artificial sandstone 25.181 41.502 45.698 2.211 3705.54 1900.11 0.05072
S10-2 Artificial sandstone 25.192 40.430 43.952 2.181 3485.35 1772.99 0.05763
D7-1 Claystone 25.412 41.126 53.231 2.552 4031.96 2531.48 0.05081
D11-1 Shaly sand 25.319 39.550 51.295 2.576 4189.62 2541.52 0.04342
D13-2 Shaly sand 25.258 40.684 53.388 2.619 4101.41 2395.30 0.04163
D36-1 Claystone 25.380 39.718 52.666 2.621 4279.96 2658.15 0.04288
Acc
epte
d A
rticl
e


![Experimental substantiation of acoustic method for determination of “coal … · acoustic methods of mine geophysics [12, 13]. In the present work, the method for determining contact](https://static.fdocuments.us/doc/165x107/5fa6d3539251bb3574619f60/experimental-substantiation-of-acoustic-method-for-determination-of-aoecoal-acoustic.jpg)