Determination of quality indicators and antioxidant ...
12
Journal of Food and Nutrition Research (ISSN 1336-8672) Vol. 59, 2020, No. 3, pp. 207–218 © 2020 National Agricultural and Food Centre (Slovakia) 207 Fruit juices play an important role in human nutrition. These favourite drinks are composed mainly of water but they contain groups of bio- logically active compounds (saccharides, proteins, minerals, vitamins, phenolic compounds and many others). Juice quality is characterized by physical, chemical, biological and sensorial parameters. When juices are adulterated, the composition of the final juice changes. A declared fruit content decreases, an undeclared proportion of other fruits or vegetables can be present, the dry matter is lower and the content of specific markers cha- racteristic for the juice is lower, too [1, 2]. Among suitable quality parameters belong dry matter con- tent and relative density (evidence of dilution with water), concentration of sugars (higher concentra- tion of glucose or saccharose indicates additional sweetening), titratable acidity (addition of acids to mask the bland taste), formol number (related to the degree of ripeness, variety and region of ori- gin) and concentration of ascorbic acid [1–3]. Adulteration of juices is a worldwide problem. Dilution with water, addition of sugars, acidifica- tion, aroma intensification or addition of various substances are the most known fraudulent prac- tices. Identification of adulteration is possible by a range of methods. Numerous groups of com- pounds related to the verification of juice authen- ticity can be determined using various chromato- graphic methods. Further, the methods based on infrared spectrometry can be used for juice quality control as well. Near infrared spectroscopy gives a good idea of fruit content. Fourier transform infrared spectroscopy can distinguish fruit type, which is a useful parameter of adulteration. Nu- clear magnetic resonance spectroscopy is a very useful tool for evaluation of authenticity-related parameters of fruit juices, too. However, many practises of adulteration remain hardly detectable. In these cases, statistical analysis methods can be Determination of quality indicators and antioxidant activity of various fruit juices Blanka Švecová – kateřina andrlová Summary For eight types of juices (apple, orange, pear, pineapple, pink grapefruit, cranberry, blackcurrant and apricot), a range of analytical parameters was analysed in order to use them as primary indicators of juice adulteration. Dry matter, relative density, pulp percentage, ash, pH and titratable acidity, conductivity, total content of proteins, formol number, proline and ascorbic acid were determined in all samples. Antioxidant activity of samples expressed as Trolox equivalent was determined using 2,2-diphenyl-1-picrylhydrazyl (DPPH) assay, 2,2’-azino-bis(3-ethylbenzthiazoline-6-sulphonic acid) (ABTS) assay and ferric reducing antioxidant power (FRAP) assay. The results were in correlation with total phenolic content expressed as gallic acid equivalent. Phenolic compounds chlorogenic acid, caffeic acid, naringin, hesperidin, rutin, quercetin and 5-hydroxymethylfurfural were determined using high performance liquid chromato- graphy. Concentration of these compounds in samples was very variable, mostly in the order of tens of milligrams per litre. Overall, the values of all parameters and the concentration of compounds were the most influenced by the type of fruit from which the juice was produced. The quality control parameters analysis showed that the samples analysed were not adulterated because the results obtained met almost all the requirements given in Czech technical standards. Keywords fruit juice; quality indicator; juice adulteration; antioxidant activity; phenolic compounds Blanka Švecová, kateřina andrlová, Department of Analytical Chemistry, Faculty of Chemical Technology, University of Pardubice, Studentská 573, 532 10 Pardubice, Czech Republic. Correspondence author: Blanka Švecová, e-mail: [email protected]
Transcript of Determination of quality indicators and antioxidant ...
Journal of Food and Nutrition Research (ISSN 1336-8672) Vol. 59, 2020, No. 3, pp. 207–218
© 2020 National Agricultural and Food Centre (Slovakia) 207
Fruit juices play an important role in human nutrition. These favourite drinks are composed mainly of water but they contain groups of biologically active compounds (saccharides, proteins, minerals, vitamins, phenolic compounds and many others). Juice quality is characterized by physical, chemical, biological and sensorial parameters. When juices are adulterated, the composition of the final juice changes. A declared fruit content decreases, an undeclared proportion of other fruits or vegetables can be present, the dry matter is lower and the content of specific markers characteristic for the juice is lower, too [1, 2]. Among suitable quality parameters belong dry matter content and relative density (evidence of dilution with water), concentration of sugars (higher concentration of glucose or saccharose indicates additional sweetening), titratable acidity (addition of acids to mask the bland taste), formol number (related to the degree of ripeness, variety and region of ori
gin) and concentration of ascorbic acid [1–3]. Adulteration of juices is a worldwide problem.
Dilution with water, addition of sugars, acidification, aroma intensification or addition of various substances are the most known fraudulent practices. Identification of adulteration is possible by a range of methods. Numerous groups of compounds related to the verification of juice authenticity can be determined using various chromatographic methods. Further, the methods based on infrared spectrometry can be used for juice quality control as well. Near infrared spectroscopy gives a good idea of fruit content. Fourier transform infrared spectroscopy can distinguish fruit type, which is a useful parameter of adulteration. Nuclear magnetic resonance spectroscopy is a very useful tool for evaluation of authenticityrelated parameters of fruit juices, too. However, many practises of adulteration remain hardly detectable. In these cases, statistical analysis methods can be
Determination of quality indicators and antioxidant activity of various fruit juices
Blanka Švecová – kateřina andrlová
SummaryFor eight types of juices (apple, orange, pear, pineapple, pink grapefruit, cranberry, blackcurrant and apricot), a range of analytical parameters was analysed in order to use them as primary indicators of juice adulteration. Dry matter, relative density, pulp percentage, ash, pH and titratable acidity, conductivity, total content of proteins, formol number, proline and ascorbic acid were determined in all samples. Antioxidant activity of samples expressed as Trolox equivalent was determined using 2,2diphenyl1picrylhydrazyl (DPPH) assay, 2,2’azinobis(3ethylbenzthiazoline6sulphonic acid) (ABTS) assay and ferric reducing antioxidant power (FRAP) assay. The results were in correlation with total phenolic content expressed as gallic acid equivalent. Phenolic compounds chlorogenic acid, caffeic acid, naringin, hesperidin, rutin, quercetin and 5hydroxymethylfurfural were determined using high performance liquid chromatography. Concentration of these compounds in samples was very variable, mostly in the order of tens of milligrams per litre. Overall, the values of all parameters and the concentration of compounds were the most influenced by the type of fruit from which the juice was produced. The quality control parameters analysis showed that the samples analysed were not adulterated because the results obtained met almost all the requirements given in Czech technical standards.
Keywordsfruit juice; quality indicator; juice adulteration; antioxidant activity; phenolic compounds
Blanka Švecová, kateřina andrlová, Department of Analytical Chemistry, Faculty of Chemical Technology, University of Pardubice, Studentská 573, 532 10 Pardubice, Czech Republic.
Correspondence author:Blanka Švecová, e-mail: [email protected]
Švecová, B. – Andrlová, K. J. Food Nutr. Res., Vol. 59, 2020, pp. 207–218
208
Materials and Methods
instrumentationAnalytical scales HR200 (Helado, Hra
dec Krá lové, Czech Republic), ultrasonic bath Bandelin Sonorex TK52 (Bandelin Electronic, Berlin, Germany), centrifuge NF400 (Nüve, Ankara, Turkey) and apparatus for solid phase extraction (SPE, Supelco, Bellefonte, Pennsylvania, USA) were used for sample preparation. Spectrometer Hélios γ (Thermo Spectronic, Corston, United Kingdom), refractometer Abbé (Optech, München, Germany), pHmeter GC842 (Schott Glas, Meinz, Germany), conductometer HI/98130 (Hanna Instruments, Woonsocket, Rhode Island USA), drying oven AX60 (Carbolite, Hope Valey, United Kingdom) and a laboratory kiln (Václav Svoboda EPS, Říčany, Czech Republic) were used for classical analytical methods. HP 1100 liquid chromatograph (Hewlett Packard, Palo Alto, California, USA) equipped with a diodearray detector was used for analysis of phenolic compounds.
chemicalsHydrochlorid acid, formic acid, sulphuric
acid, oxalic acid dihydrate, sodium hydroxide, formaldehyde, calcium chloride, sodium sulfate anhydrous, sodium thiosulfate dihydrate, potassium dichromate, potassium iodide, iodine, proline, ninhydrin, tashiro indicator, starch indicator, selenium catalyst, silica gel, ethylene glycol monomethyl ether and nbutyl acetate were obtained from Honeywell Fluka (Charlotte, North Carolina, USA), Lachner (Neratovice, Czech Republic) and Penta (Chrudim, Czech Republic). Chemicals required for total polyphenols determination and DPPH, ABTS and FRAP assays, namely, Folin Ciocalteu reagent, DPPH radical (DPPH•), ABTS and 2,4,6tripyridylstriazin (TPTZ) were obtained from SigmaAldrich (St. Louis, Missouri, USA). 6Hydroxy2,5,7,8tetramethylchroman2carboxylic acid (Trolox) and gallic acid (≥ 98 %) were obtained from Honeywell Fluka. Ferric chloride, potassium peroxodisulfate, sodium carbonate, methanol and ethanol, all of analytical grade, were obtained from Lachner and Penta.
Standard compounds for HPLC analysis, namely, caffeic acid (99 %), pcoumaric acid (≥ 98 %), chlorogenic acid (≥ 98 %), 5hydroxymethylfurfural (99 %), rutin hydrate (95 %), quercetin hydrate (99 %) and myricetin (≥ 95 %) were obtained from SigmaAldrich and Honeywell Fluka. Other chemicals for HPLC analysis, namely, acetonitrile, methanol and formic acid, were obtained from SigmaAldrich. Demineralized wa
helpful at detection of fraud [2].Main parameters such as low dry matter con
tent and discrepancies in sugar or organic acids concentration, were established as markers of juice quality. European Fruit Juice Association (AIJN) implemented a Code of Practise with reference guidelines for quality evaluation of various fruit and vegetable juices [4]. Classical analytical methods as well as spectrometric or modern separation methods are widely used in quality testing practise with the purpose to analyse these parameters. In particular, titration methods (alkalimetry, iodometry), gravimetric or spectrometric methods can be used for determination of some of the parameters (markers).
In this work, specific working procedures of selected parameters determination were established and performed according to Czech technical standards [5–12]. Fruit as well as fruit juices are generally known for the presence of natural antioxidants [13–16]. These bioactive compounds are currently being extensively studied, using a wide range of analytical methods, including spectrometric and separation methods. Determination of total polyphenols using FolinCiocalteu reagent and spectrometric methods of antioxidant activity determination such as 2,2’azinobis(3ethylbenzthiazoline6sulphonic acid) (ABTS), 2,2diphenyl1picrylhydrazyl (DPPH) and Ferric reducing antioxidant power (FRAP) assays are the most frequently used. The principles of these methods and many applications in food analysis were published [17–21]. Determination of individual phenolic compounds in juices, such as phenolic acids, flavonoids and their derivatives, is performed by various separation methods, but chromatographic methods are the most commonly used. In particular, high performance liquid chromatography (HPLC) with various types of detection mode was used in many studies of phenolic compounds determination in juices [22–28]. Among the important markers, chlorogenic acid (5caffeoylquinic acid) is the most important cinnamic acid derivative in fruits and, furthermore, it is sometimes the dominant phenolic compound [13]. Another important marker is quercetin, which is a flavonol common in many types of fruits [13, 23].
In this study, essential parameters related to juice quality were analysed in a range of fruit juices. To our knowledge, this work is unique regarding the number of parameters analysed for commonly available juice types. Our goal was to evaluate the quality of the juices that consumers most often choose.
Determination of quality indicators and antioxidant activity of various fruit juices
209
ter was prepared in our laboratory using MilliQ Reference System (Merck Millipore, Burlington, Massachusetts, USA).
SamplesApple, orange, pear, pineapple, pink grape
fruit, cranberry, blackcurrant and apricot juices were purchased in shops in Pardubice, Czech Republic. Specifically, these comprised two samples of apple juice (both declared to be 100% juice from concentrate without sugar added, two different brands), two samples of orange juice (both declared to be 100% juice from concentrate, two different brands), pear juice (declared content of fruit component at minimum 50 %), pineapple juice (declared to be 100% juice with pulp), pink grapefruit juice (declared to be 100% juice from concentrate without sugar added), cranberry juice (cranberryapple beverage from concentrate, content of fruit component 15 %, cranberry 8 %), blackcurrant juice (juice from concentrate, content of fruit component 25 %) and apricot juice (juice from concentrate, content of fruit component at minimum 40 %).
sample preparationPackagings of fruit juices were stored in the
laboratory before opening. After opening, they were stored in the refrigerator until all analyses were performed (1–2 days). In this case, a necessary volume was tempered to laboratory temperature just before each analysis. In case of determination of quality control parameters and antioxidant activity assays, undiluted or diluted (if necessary) juices were directly analysed. Prior to the chromatographic analysis, a specific sample preparation was carried out. Firstly, the samples were centrifuged at 2 550 ×g for 20 min and then 10 ml of the supernatant was used for preconcentration of the target analytes using SPE technique. For this purpose, SPE columns Strata C18E (particle size 55 µm, pore size 7 nm, 500 mg/6 ml; Phenomenex, Torrance, California, USA) were used. Extract was collected into 2 ml of 80% ethanol and filtered through a nylon filter (pore size 0.45 µm) prior to the chromatographic analysis. Samples were analysed in triplicate for each experiment, four analyses were performed in case of chromatographic analysis.
classical analytical assaysThe particular working procedures were
taken over from Czech technical standards. Determination of centrifugable pulp percentage [5] was carried out by measuring of the sedimented volume after centrifugation of sample at 2 550 ×g
for 20 min. Relative density was determined by pycnometry according to Czech technical standard ČSN EN 12134 [6], conductivity was determined with a conductometer. Gravimetric method was used for total dry matter [7] and ash [8] determinations. For dry matter content determination, a sample of juice was mixed with silica gel and incubated in an oven at 110 °C for 5 h. For ash content determination, sample was left in a furnace at 550 °C until it became white. Titratable acidity was determined by potentiometric titration with 0.25 mol·l1 sodium hydroxide to pH ~8.1 [9]. Ascorbic acid concentration was determined using iodimetric titration. Total protein content was determined using Kjeldahl method [10], formol number (sum of all amino acids) was determined by formol titration and expressed as volume of sodium hydroxide (0.1 mol·l1) required for neutralization of the sum of amino acids (after reaction with formaldehyde) in 100 ml of the sample [11]. Spectrometric determination after derivatization with ninhydrin was used for determination of proline concentration [12].
total polyphenols determination To a sample of juice (1 ml), 95 % ethanol
(1 ml), distilled water (5 ml), FolinCiocalteu reagent (0.5 ml) and after 5 min 5% sodium carbonate solution (1 ml). After incubation at laboratory temperature for 60 min, absorbance of the mixture was measured at a wavelength of 765 nm against blank. The results were expressed as milligrams of gallic acid equivalents (GAE) per litre of the sample.
dPPh assayThe reaction mixture consisted of 250 µl of the
diluted sample and 5 ml of methanolic solution of DPPH• (25 mg·l1) containing the free radical. Reduction of the DPPH• was determined by measuring the absorption at a wavelength of 517 nm after 25 min of the reaction in the dark. A volume of 250 µl of distilled water instead of the sample was used as a blank. The decrease in absorption was expressed as percentage and then recalculated to the equivalent amount of Trolox. Antioxidant activity was expressed as millimoles of Trolox equivalents per litre of the sample.
ABTS assayThe experiments were always performed with
fresh solution of the radical ABTS•+. A 10 mg tablet of ABTS was dissolved with 5 ml of distilled water and mixed with 100 µl K2S2O8 (0.06 mol·l1). This solution was left in the dark for 12–16 h. After this time, further dilution (1 : 40) was done.

Švecová, B. – Andrlová, K. J. Food Nutr. Res., Vol. 59, 2020, pp. 207–218
210
The reaction was performed by mixing 500 µl of the sample and 3 ml of ABTS•+ solution. The decrease in absorbance was measured at a wavelength of 734 nm after 30 min of the reaction in the dark. The results were expressed as millimoles of Trolox equivalents per litre of the sample.
Ferric reducing antioxidant power assayIn FRAP assay, a fresh solution for analy
sis contained 25 ml of acetate buffer (0.3 mol·l1, pH 3.6), 2.5 ml of 10 mmol·l1 TPTZ solution in 40 mmol·l1 HCl and 2.5 ml of 20 mmol·l1 ferric chloride. This solution was used as a blank. A volume of 3 ml of this solution was mixed with 500 µl of the juice sample. The ferric reducing ability was determined by measuring the increase in absorbance at a wavelength of 593 nm after 40 min of the reaction. The results were expressed as millimoles of Trolox equivalents per litre of the sample.
hPlc analysisA volume of 20 µl of the sample was analysed
by HPLC using the column Kromasil C18 100A (250 mm × 4.6 mm, particle size 5 µm; Phenomenex) tempered to 40 °C, using the mobile phase consisting of demineralized water acidified with formic acid to pH ~3 (A) and acetonitrile (B). Flow rate of the mobile phase was 1 ml·min1 and the gradient programme started with 0.5 % (B), reaching 15 % (B) at 20 min, 45 % (B) at 30 min and 100 % (B) at 40 min. Separated compounds were detected at wavelengths 280 nm and 370 nm.
statistical analysisThe results obtained were presented as
mean of three (quality control parameters), four (HPLC) or five (total polyphenols, DPPH, ABTS, FRAP methods) replicates ± standard deviations. Statistical analysis was applied to discover correlation among individual parameters. Statistical software MedCalc version 15.8. (MedCalc Software, Ostend, Belgium) was used to calculate the Spearman’s rank correlation coefficients with appro
priate significance levels.
results and discussion
Quality control parameters of juice samplesFirst, eleven selected parameters were deter
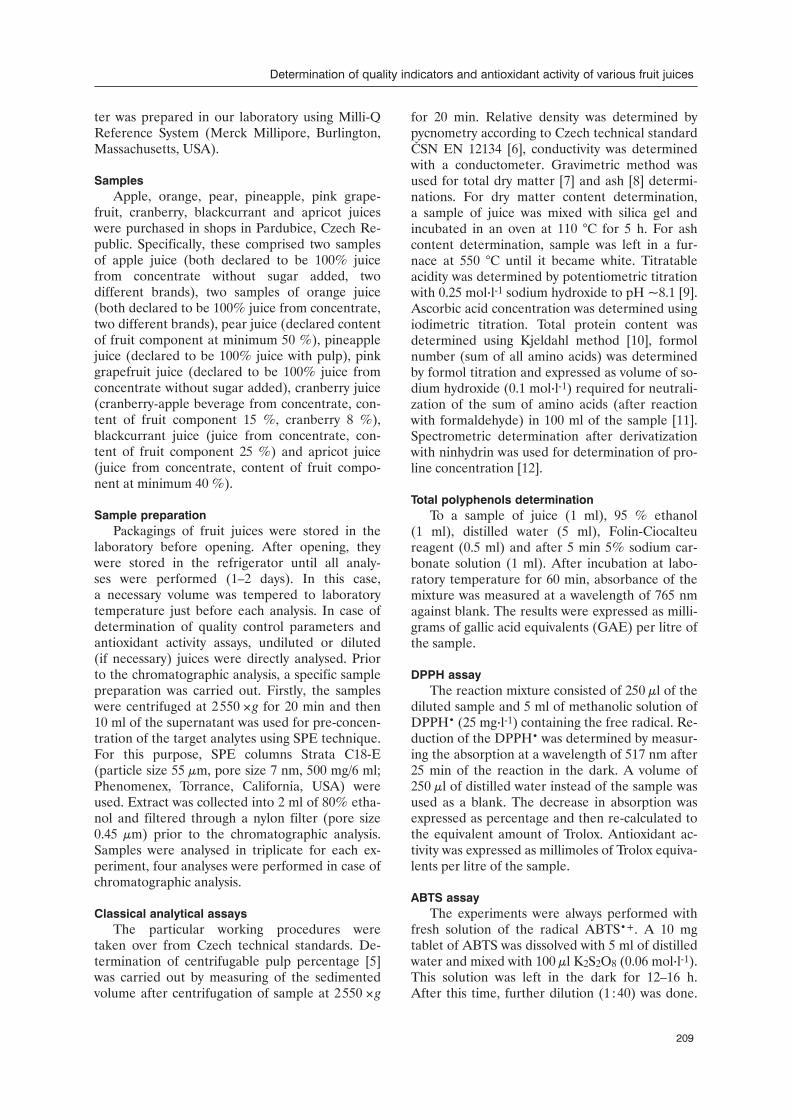
mined, which are important for the quality specification and for detection of adulteration. The results obtained are summarized in Tab. 1, Tab. 2 and Tab. 3. Almost all the results obtained met the requirement given in Czech technical standards
for apple, orange and grapefruit juice [29–31]. One of the most important quality parameters
is the dry matter content. It may be influenced by the sample composition, especially by presence of the pulp and sugars. Dry matter content of the analysed samples ranged from 9.4 % to 12.5 %. Two lowest values were obtained in case of pink grapefruit and cranberry juices whereas higher values were determined in pineapple and blackcurrant juice. Czech technical standards require minimally 11.2 % for orange and apple juices [29, 30], and minimally 10 % for grapefruit juice [31]. Our results were only slightly below these limits, which was probably caused by the type of fruit used and it is unlikely that it is a sign of adulteration.
The ash is the rest of the sample after burning the organic components and water. The requirements for ash in juices are as follows: 1.9–3.5 g·l1 (apple juice), 2.8–5.0 g·l1 (orange juice) and 2.3–4.5 g·l1 (grapefruit juice) [29–31]. The samples analysed in this work met these values. The requirements for relative density were also met, the values obtained were slightly above the given minimum limits (1.045 for apple and orange juice [29, 30]). Cranberry juice had the lowest ash content (0.42 g·l1), the lowest relative density (1.0399) and very low pulp percentage (only 1 %). On the other hand, pineapple juice had the highest relative density (1.0531), high ash (4.18 g·l1 ) and the second highest pulp percentage of 15 %. The highest percentage of pulp was determined in pear juice, which contained 22 % of pulp.
Conductivity and pH values of all samples were measured using conductometer and pH meter. Values of conductivity were in the range of 1.07–3.40 mS·cm1. Conductivity differed in various types of juice, but in samples of juices made from the same type of fruit was very similar (Tab. 2). The highest values were determined for pineapple, pink grapefruit and both orange juices, the lowest conductivity was determined for cranberry juice. The range of pH was from 2.04 (cranberry juice) to 3.46 (apricot juice). The va riability in results could be caused by using different fruit varieties as well as it could be in fluenced by a locality of cultivation of the fruits.
The results of titratable acidity expressed as citric acid equivalents ranged from 3.20 g·l1 to 13.00 g·l1. These values were within the range specified by the Czech technical standards [29–31], which state the upper limit of 7.5 g·l1 for apple juice, 15.4 g·l1 for orange juice and 18.5 g·l1 for grapefruit juice. The two lowest values were determined for apricot and pear juice. On the opposite side was pink grapefruit juice with the highest
Determination of quality indicators and antioxidant activity of various fruit juices
211
Tab. 1. Dry matter, ash, pulp percentage and relative density of fruit juices.
Sample Dry matter [%] Ash [g·l-1] Pulp percentage [%] Relative density
Apple juice I 10.70 ± 0.13 2.64 ± 0.14 0.5 ± 0.1 1.0461 ± 0.0009
Apple juice II 10.76 ± 0.20 2.91 ± 0.08 0.5 ± 0.1 1.0458 ± 0.0006
Orange juice I 10.81 ± 0.23 4.21 ± 0.07 7.0 ± 0.2 1.0459 ± 0.0010
Orange juice II 11.05 ± 0.13 4.20 ± 0.08 7.0 ± 0.1 1.0457 ± 0.0015
Pear juice 10.50 ± 0.14 1.43 ± 0.08 22.0 ± 0.5 1.0434 ± 0.0011
Pineapple juice 12.45 ± 0.17 4.18 ± 0.12 15.0 ± 0.4 1.0531 ± 0.0017
Pink grapefruit juice 9.39 ± 0.13 3.48 ± 0.07 5.0 ± 0.2 1.0417 ± 0.0004
Cranberry juice 9.40 ± 0.09 0.42 ± 0.06 1.0 ± 0.1 1.0399 ± 0.0007
Blackcurrant juice 11.68 ± 0.11 1.09 ± 0.05 0.0 ± 0.0 1.0523 ± 0.0010
Apricot juice 10.21 ± 0.13 1.85 ± 0.06 8.0 ± 0.1 1.0438 ± 0.0008
Values represent mean ± standard deviation from 3 analyses.
Tab. 2. Conductivity, pH, titratable acidity and ascorbic acid concentration in fruit juices.
Sample pH Titratable acidity [g·l-1] Conductivity [mS·cm-1] Ascorbic acid [mg·l-1]
Apple juice I 2.92 ± 0.04 5.20 ± 0.12 2.15 ± 0.04 29.09 ± 0.83
Apple juice II 3.10 ± 0.06 4.88 ± 0.06 2.34 ± 0.05 30.54 ± 0.75
Orange juice I 3.44 ± 0.06 7.09 ± 0.08 3.06 ± 0.04 353.41 ± 4.72
Orange juice II 3.28 ± 0.07 8.42 ± 0.07 3.27 ± 0.09 411.59 ± 6.83
Pear juice 2.98 ± 0.05 3.37 ± 0.11 1.26 ± 0.06 29.09 ± 0.91
Pineapple juice 3.25 ± 0.06 5.42 ± 0.07 3.40 ± 0.04 186.16 ± 3.60
Pink grapefruit juice 2.80 ± 0.07 13.00 ± 0.16 3.25 ± 0.04 503.21 ± 5.62
Cranberry juice 2.04 ± 0.06 5.66 ± 0.10 1.07 ± 0.06 49.45 ± 1.09
Blackcurrant juice 2.47 ± 0.05 7.79 ± 0.09 1.55 ± 0.07 116.35 ± 2.21
Apricot juice 3.46 ± 0.07 3.20 ± 0.08 1.99 ± 0.07 328.69 ± 5.61
Values represent mean ± standard deviation from 3 analyses. Titratable acidity is expressed as citric acid equivalent.
Tab. 3. Proteins, formol number and proline concentration in fruit juices.
Sample Proteins [g·l-1] Formol number Proline [mg·l-1]
Apple juice I 0.43 ± 0.05 6.30 ± 0.16 5.38 ± 0.57
Apple juice II 0.44 ± 0.04 3.60 ± 0.11 3.42 ± 0.28
Orange juice I 6.19 ± 0.18 23.07 ± 0.28 507.95 ± 7.51
Orange juice II 5.31 ± 0.13 22.18 ± 0.31 393.79 ± 5.11
Pear juice 1.76 ± 0.09 3.94 ± 0.16 9.12 ± 0.82
Pineapple juice 4.42 ± 0.19 18.82 ± 0.27 36.31 ± 3.14
Pink grapefruit juice 4.88 ± 0.16 18.49 ± 0.38 65.38 ± 3.85
Cranberry juice 0.88 ± 0.07 0.79 ± 0.07 7.45 ± 0.68
Blackcurrant juice 1.32 ± 0.13 4.02 ± 0.19 3.36 ± 0.41
Apricot juice 1.76 ± 0.11 4.81 ± 0.18 53.85 ± 2.12
Values represent mean ± standard deviation from 3 analyses. Formol number is expressed in millilitres of 0.1 mol·l-1 NaOH per 100 ml of sample.

Švecová, B. – Andrlová, K. J. Food Nutr. Res., Vol. 59, 2020, pp. 207–218
212
value of titratable acidity. Somewhat variable titratable acidity was determined for juices made from the same type of fruit, apple juices (5.20 g·l1 and 4.88 g·l1) and orange juices (7.09 g·l1 and 8.42 g·l1). Many factors may affect these differences, above all different source of fruit or different manufacturing process and recipe of the manufacturer. However, all samples met the requirements, so they were not adulterated by the addition of acids to improve the bland taste.
Ascorbic acid is an important vitamin and antioxidant in a human diet, thus its concentration in foodstuffs and beverages is very often studied. In this work, ascorbic acid was determined using simple iodimetric titration. The highest concentration of ascorbic acid was found in pink grapefruit juice (503 mg·l1) whereas the lowest concentrations were found in apple juices (29.1 mg·l1 and 30.5 mg·l1). Pear juice contained a low concentration of ascorbic acid (29 mg·l1) but this value was in agreement with Saeedud-din et al. [3] who published almost same value. Blackcurrant juice contained 116 mg·l1, which can be considered a usual value, because in commercial blackcurrant juice products from various European countries vitamin C concentration was determined in the range of 26.4–468 mg·l1 [32]. According to Czech technical standard [30], the minimal concentration of 200 mg·l1 is required in orange juice. From this point of view, orange juices analysed in this work contained sufficient ascorbic acid (353 mg·l1 and 412 mg·l1). These results mean that the daily intake of 250 ml of this juice covers the recommended daily intake of vitamin C.
Protein concentration in juices is very variable in dependence on the type of fruit. The highest concentration was determined in orange juices (6.19 g·l1 and 5.31 g·l1). High protein concentration was found also in pineapple and pink grapefruit juice (~ 4.5 g·l1). Cranberry juice contained proteins at the lowest concentration (0.88 g·l1), as well as having the lowest value of formol number (0.79).
An analogy was observed between the two parameters. The formol number is strongly influenced by the type of juice on one hand and the degree of ripeness of the fruit on the other. If a low value is found, it is necessary to look for the origin of the juice, as well as for fruit that may have been damaged by frost or immature [2]. The highest values of formol number were obtained for orange juices (on average 22.63), followed by pineapple (18.82) and pink grapefruit (18.49) juices. Permissible values (expressed as millilitres of 0.1 mol·l1 NaOH per 100 ml of sample)
Tab
. 4. S
pea
rman
’s r
ank
corr
elat
ion
coef
ficie
nts
amon
g a
ll q
ualit
y co
ntro
l par
amet
ers.
Dry
mat
ter
Ash
Pul
p
per
cent
age
Rel
ativ
e d
ensi
tyC
ond
uctiv
ityp
HTi
trat
able
ac
idity
Asc
orb
ic
acid
Pro
tein
s Fo
rmol
nu
mb
erP
rolin
e
Dry
mat
ter
–0.
396
(0.2
57)
–0.0
37 (0
.920
)0.
872
(0.0
01)
0.48
2 (0
.159
)0.
280
(0.4
33)
0.14
0 (0
.699
)0.
018
(0.9
60)
0.16
5 (0
.649
)0.
396
(0.2
57)
–0.1
16 (0
.750
)
Ash
0.39
6 (0
.257
)–
0.28
7 (0
.422
)0.
321
(0.3
66)
0.90
3 (0
.000
)0.
636
(0.0
48)
0.34
5 (0
.328
)0.
590
(0.0
73)
0.69
3 (0
.026
)0.
867
(0.0
01)
0.70
9 (0
.022
)
Pul
p p
erce
ntag
e–0
.037
(0.9
20)
0.28
7 (0
.422
)–
–0.1
77 (0
.625
)0.
220
(0.5
42)
0.57
3 (0
.083
)–0
.317
(0.3
72)
0.18
7 (0
.606
)0.
569
(0.0
86)
0.31
7 (0
.372
)0.
616
(0.0
58)
Rel
ativ
e d
ensi
ty0.
872
(0.0
01)
0.32
1 (0
.366
)–0
.177
(0.6
25)
–0.
406
(0.2
44)
0.22
4 (0
.533
)–0
.006
(0.9
87)
–0.1
22 (0
.738
)–0
,049
(0.8
94)
0.39
4 (0
.260
)–0
.236
(0.5
11)
Con
duc
tivity
0.48
2 (0
.159
)0.
903
(0.0
00)
0.22
0 (0
.542
)0.
406
(0.2
44)
–0.
479
(0.1
62)
0.40
6 (0
.244
)0.
608
(0.0
62)
0.57
8 (0
.080
)0.
794
(0.0
06)
0.53
9 (0
.108
)
pH
0.28
0 (0
.433
)0.
636
(0.0
48)
0.57
3 (0
.083
)0.
224
(0.5
33)
0.47
9 (0
.162
)–
–0.3
21 (0
.366
)0.
353
(0.3
18)
0.51
1 (0
.132
)0.
564
(0.0
90)
0.61
2 (0
.060
)
Titr
atab
le a
cid
ity0.
140
(0.6
99)
0.34
5 (0
.328
)–0
.317
(0.3
72)
–0.0
06 (0
.987
)0.
406
(0.2
44)
–0.3
21 (0
.366
)–
0.65
0 (0
.042
)0.
486
(0.1
54)
0.45
5 (0
.187
)0.
309
(0.3
85)
Asc
orb
ic a
cid
0.01
8 (0
.960
)0.
590
(0.0
73)
0.18
7 (0
.606
)–0
.122
(0.7
38)
0.60
8 (0
.062
)0.
353
(0.3
18)
0.65
0 (0
.042
)–
0.81
4 (0
.004
)0.
669
(0.0
36)
0.76
0 (0
.011
)
Pro
tein
s 0.
165
(0.6
49)
0.69
3 (0
.026
)0.
569
(0.0
86)
–0,0
49 (0
.894
)0.
578
(0.0
80)
0.51
1 (0
.080
)0.
486
(0.1
54)
0.81
4 (0
.004
)–
0.77
2 (0
.009
)0.
894
(0.0
01)
Form
ol n
umb
er0.
396
(0.2
57)
0.86
7 (0
.001
)0.
317
(0.3
72)
0.39
4 (0
.260
)0.
794
(0.0
06)
0.56
4 (0
.090
)0.
455
(0.1
87)
0.66
9 (0
.035
)0.
772
(0.0
09)
–0.
758
(0.0
11)
Pro
line
–0.1
16 (0
.750
)0.
709
(0.0
22)
0.61
6 (0
.058
)–0
.236
(0.5
11)
0.53
9 (0
.108
)0.
612
(0.0
60)
0.30
9 (0
.385
)0.
760
(0.1
08)
0.89
4 (0
.001
)0.
758
(0.0
11)
–
Valu
es in
bra
cket
s re
pre
sent
sig
nific
ance
leve
l p.

Determination of quality indicators and antioxidant activity of various fruit juices
213
were in the range 3–10 ml for apple juice, 15–26 ml for orange juice and 14–30 ml for grapefruit juice [29–31]. The concentration of amino acid proline varied in a wide range, specifically from 3.36 mg·l1 in blackcurrant juice on the one hand and slightly over 500 mg·l1 in orange juice on the other hand. It was evident that proline concentration was strongly influenced by the fruit type. Czech technical standards [29–31] reflect this reality and give variable limits for proline concentration in various juices. In fact, apple juice should contain maximum 20 mg·l1, whereas orange juice may contain 450–2 090 mg·l1 proline. Apple juices analysed in this work met this regulation, however one orange juice with 394 mg·l1 of proline was below this limit. During ripening of the fruit, the proportion of proline increases [2], so this lower content of proline could be caused by using less ripe oranges or a smaller fruit portion for production of the juice. The lower concentration of proline indicated the possibility of adulteration but the formol number met Czech Technical standard [30] and so it could not be clearly decided, if that was adulteration or not.
Spearman’s rank correlation coefficients (rs) among results of all methods were calculated with a purpose to find out which parameters correlated more and which correlated less. In total, eleven parameters were compared and the correlation coefficients varied greatly (Tab. 4), as expected. The highest correlation was found between conductivity and ash (rs = 0.903, p = 0.042), relative density and dry matter (rs = 0.872, p = 0.001), and between protein concentration and proline (rs = 0.894, p = 0.0005). The weak correlation between pH and titratable acidity (rs = –0.321, p = 0.366) was surprising as well as the low correlation between pulp and dry matter (rs = –0.037, p =
0.920) or between pulp and relative density (rs = –0.177, p = 0.625).
total polyphenols and antioxidant activityDetermination of total polyphenols and anti
oxidant activity is currently a very popular topic and, therefore, it was the second part of this study. The total polyphenols determination was performed using the spectrophotometric method with the Folin–Ciocalteu reagent. All tested samples of juices were found to be a significant source of polyphenols, however, the total concentration varied significantly among individual juices (Fig. 1). Results expressed as gallic acid equivalent (GAE) ranged from 150 mg·l1 (pear juice) to 650 mg·l1 (pink grapefruit juice). Apricot juice, pineapple juice and one orange juice were found to be rich in polyphenols (concentration greater than 400 mg·l1). The values of total polyphenols determined in this work were comparable to the results of Gardner et al. [33], who had analysed orange, apple, pineapple and grapefruit juices. However, Tanriöven and Ekşi [26] determined much higher total polyphenol concentration of pear juice, up to 457 mg·l1.
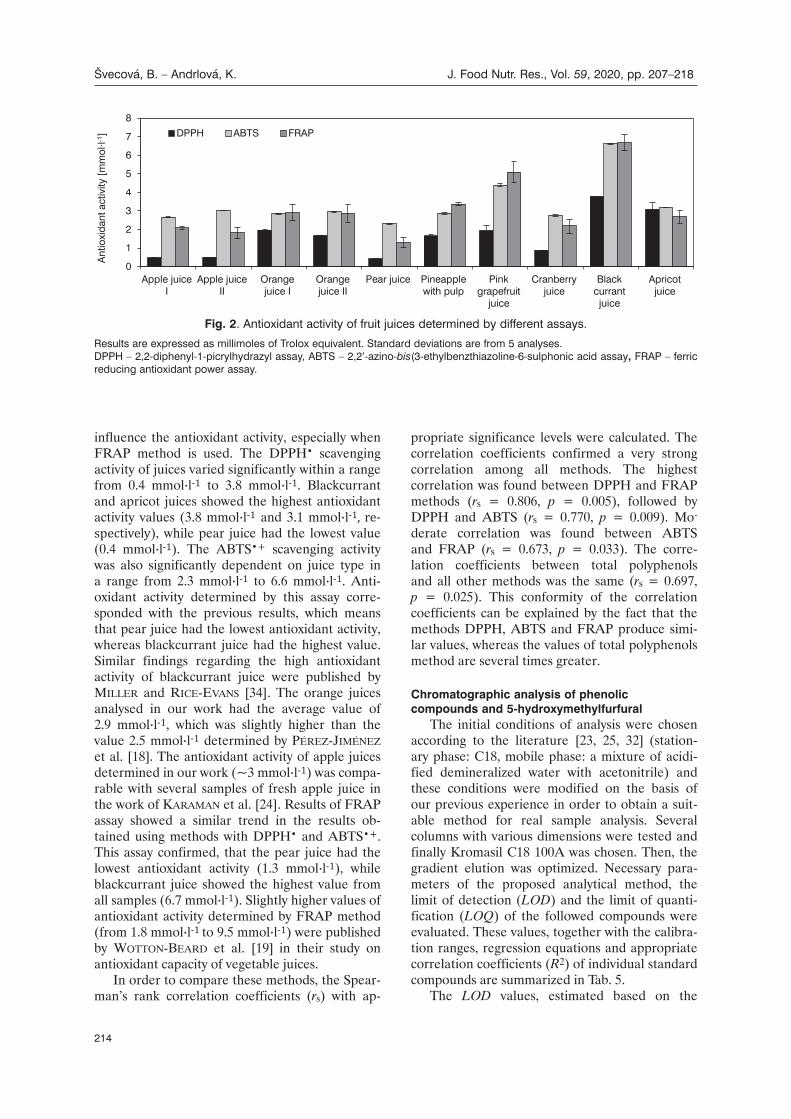
Three assays (DPPH, ABTS and FRAP) were used as complementary methods to evaluate the potential antioxidant activity of the juices. The results expressed as millimoles of Trolox equivalents are depicted in Fig. 2. Significant differences were observed among the different juices in the three assays. Nevertheless, these differences in results are quite common because each of these methods has a different selectivity and reacts with different groups of substances or has a different reaction mechanism [21]. The antioxidant activity can be affected by various components of the samples, for example reducing sugars, which can
0
100
200
300
400
500
600
700
Apple juiceI
Apple juiceII
Orangejuice I
Orangejuice II
Pear juice Pineapplewith pulp
Pinkgrapefruit
juice
Cranberryjuice
Blackcurrantjuice
Apricotjuice
Tota
l pol
yphe
nols
[m
g·l-1
]
Fig. 1. Total polyphenols in fruit juices.
Results are expressed as milligrams of gallic acid equivalents. Standard deviations are from 5 analyses.
Švecová, B. – Andrlová, K. J. Food Nutr. Res., Vol. 59, 2020, pp. 207–218
214
influence the antioxidant activity, especially when FRAP method is used. The DPPH• scavenging activity of juices varied significantly within a range from 0.4 mmol·l-1 to 3.8 mmol·l-1. Blackcurrant and apricot juices showed the highest antioxidant activity values (3.8 mmol·l-1 and 3.1 mmol·l-1, re-spectively), while pear juice had the lowest value (0.4 mmol·l-1). The ABTS•+ scavenging activity was also significantly dependent on juice type in a range from 2.3 mmol·l-1 to 6.6 mmol·l-1. Antioxidant activity determined by this assay corresponded with the previous results, which means that pear juice had the lowest antioxidant activity, whereas blackcurrant juice had the highest value. Similar findings regarding the high antioxidant activity of blackcurrant juice were published by Miller and rice-evanS [34]. The orange juices analysed in our work had the average value of 2.9 mmol·l-1, which was slightly higher than the value 2.5 mmol·l-1 determined by Pérez-JiMénez et al. [18]. The antioxidant activity of apple juices determined in our work (~3 mmol·l-1) was comparable with several samples of fresh apple juice in the work of KaraMan et al. [24]. Results of FRAP assay showed a similar trend in the results obtained using methods with DPPH• and ABTS•+. This assay confirmed, that the pear juice had the lowest antioxidant activity (1.3 mmol·l-1), while blackcurrant juice showed the highest value from all samples (6.7 mmol·l-1). Slightly higher values of antioxidant activity determined by FRAP method (from 1.8 mmol·l-1 to 9.5 mmol·l-1) were published by WoTTon-Beard et al. [19] in their study on antioxidant capacity of vegetable juices.
In order to compare these methods, the Spearman’s rank correlation coefficients (rs) with ap
propriate significance levels were calculated. The correlation coefficients confirmed a very strong correlation among all methods. The highest correlation was found between DPPH and FRAP methods (rs = 0.806, p = 0.005), followed by DPPH and ABTS (rs = 0.770, p = 0.009). Mo
derate correlation was found between ABTS and FRAP (rs = 0.673, p = 0.033). The correlation coefficients between total polyphenols and all other methods was the same (rs = 0.697, p = 0.025). This conformity of the correlation coefficients can be explained by the fact that the methods DPPH, ABTS and FRAP produce similar values, whereas the values of total polyphenols method are several times greater.
chromatographic analysis of phenolic compounds and 5-hydroxymethylfurfural
The initial conditions of analysis were chosen according to the literature [23, 25, 32] (stationary phase: C18, mobile phase: a mixture of acidified demineralized water with acetonitrile) and these conditions were modified on the basis of our previous experience in order to obtain a suitable method for real sample analysis. Several columns with various dimensions were tested and finally Kromasil C18 100A was chosen. Then, the gradient elution was optimized. Necessary parameters of the proposed analytical method, the limit of detection (LOD) and the limit of quantification (LOQ) of the followed compounds were evaluated. These values, together with the calibration ranges, regression equations and appropriate correlation coefficients (R2) of individual standard compounds are summarized in Tab. 5.
The LOD values, estimated based on the
0
1
2
3
4
5
6
7
8
Apple juiceI
Apple juiceII
Orangejuice I
Orangejuice II
Pear juice Pineapplewith pulp
Pinkgrapefruit
juice
Cranberryjuice
Blackcurrantjuice
Apricotjuice
Ant
ioxi
dan
t act
ivity
[mm
ol·l-1
] DPPH ABTS FRAP
Fig. 2. Antioxidant activity of fruit juices determined by different assays.
Results are expressed as millimoles of Trolox equivalent. Standard deviations are from 5 analyses. DPPH – 2,2-diphenyl-1-picrylhydrazyl assay, ABTS – 2,2’-azino-bis(3-ethylbenzthiazoline-6-sulphonic acid assay, FRAP – ferric reducing antioxidant power assay.
Determination of quality indicators and antioxidant activity of various fruit juices
215
“3 : 1 signaltonoise (S/N) ratio” criterion, were found to be within 18–93 µg·l1. Similarly, the respective LOQ values were calculated for S/N = 10. These values ranged in an interval of 59–311 µg·l1. Linearity was tested in various concentration ranges, which were chosen according to expected concentrations of individual compounds in the samples.
Finally, the optimized chromatographic method was applied to the analysis of selected compounds in real samples. The individual compounds in the samples were identified by comparison of the retention times and UVVIS spectra of the standards. Quantification of the followed compounds was performed by the external calibration method, all analyses were performed in quadruplicate and results obtained are summarized in Tab. 6.
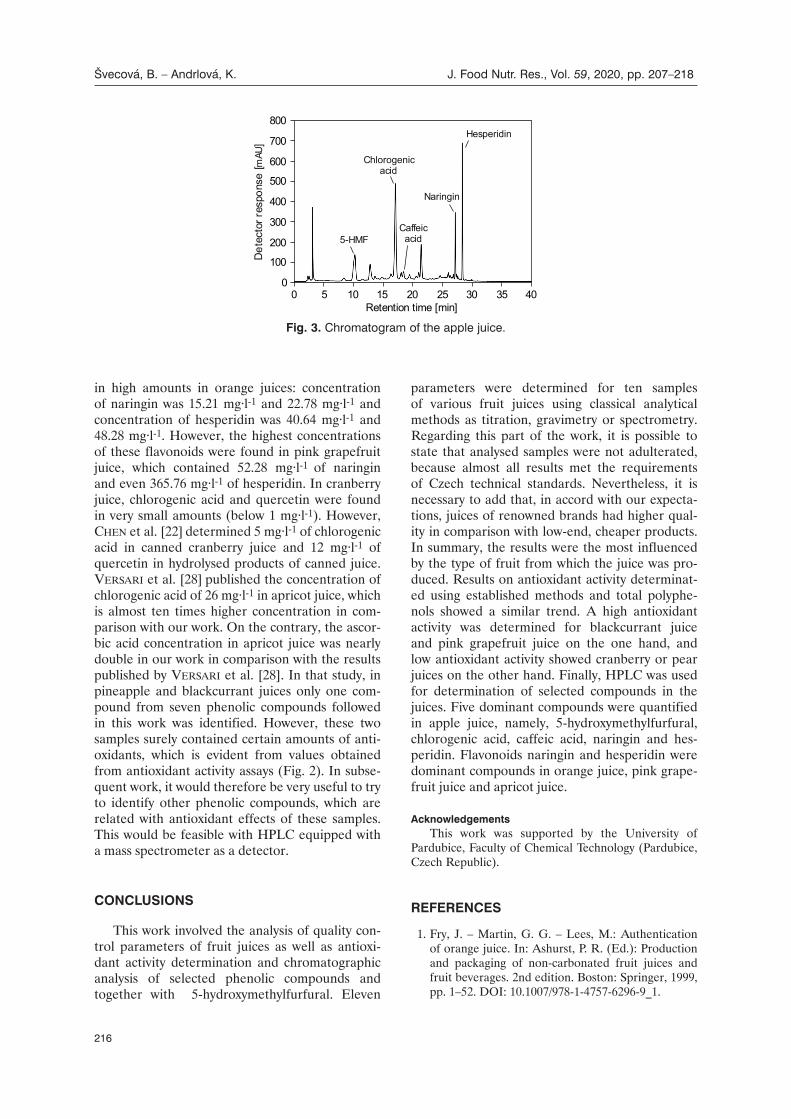
A typical chromatogram of apple juice is presented in Fig. 3. In apple juice, a majority of dominant peaks was identified, i.e. five from seven compounds. The presence of an increased amount of
5hydroxymethylfurfural is considered to be an indicator of quality deterioration [35]. Its maximum concentration is recommended to be 10 mg·l1 and, thus, the concentration in the samples of apple juices analysed in this work (2.26 mg·l1 and 1.64 mg·l1) fulfils this recommendation. The highest concentration of chlorogenic acid was found in both apple juices (~22 mg·l1). Many studies were devoted to determination of phenolic compounds in various fruit juices and, in the most of them, chlorogenic acid was determined. Kahle et al. [23] described the concentration of this acid to be higher than 30 mg·l1 in juices made from dessert apples and cider apples. A concentration higher than 40 mg·l1 in fresh juice obtained from apple varieties grown in Turkey was published by KaraMan et al. [24] and the concentration greater than 73 mg·l1 was found in pear juice [26]. High concentrations of hesperidin (13.68 mg·l1 and 19.01 mg·l1) were found in both samples of apple juice as well. Naringin and hesperidin, predominant flavonoids in citrus fruits [25, 27], were found
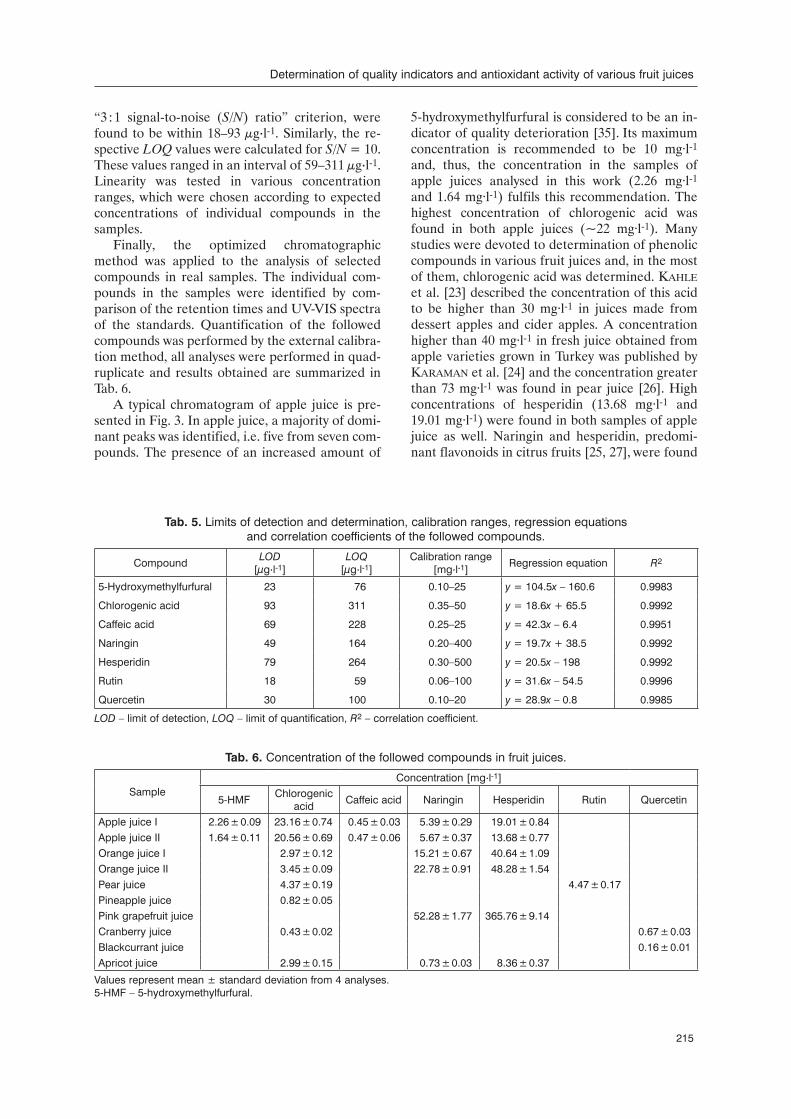
Tab. 5. Limits of detection and determination, calibration ranges, regression equations and correlation coefficients of the followed compounds.
CompoundLOD
[µg·l-1]LOQ
[µg·l-1]Calibration range
[mg·l-1]Regression equation R2
5-Hydroxymethylfurfural 23 76 0.10–25 y = 104.5x – 160.6 0.9983
Chlorogenic acid 93 311 0.35–50 y = 18.6x + 65.5 0.9992
Caffeic acid 69 228 0.25–25 y = 42.3x – 6.4 0.9951
Naringin 49 164 0.20–400 y = 19.7x + 38.5 0.9992
Hesperidin 79 264 0.30–500 y = 20.5x – 198 0.9992
Rutin 18 59 0.06–100 y = 31.6x – 54.5 0.9996
Quercetin 30 100 0.10–20 y = 28.9x – 0.8 0.9985
LOD – limit of detection, LOQ – limit of quantification, R2 – correlation coefficient.
Tab. 6. Concentration of the followed compounds in fruit juices.
SampleConcentration [mg·l-1]
5-HMFChlorogenic
acidCaffeic acid Naringin Hesperidin Rutin Quercetin
Apple juice I 2.26 ± 0.09 23.16 ± 0.74 0.45 ± 0.03 5.39 ± 0.29 19.01 ± 0.84Apple juice II 1.64 ± 0.11 20.56 ± 0.69 0.47 ± 0.06 5.67 ± 0.37 13.68 ± 0.77Orange juice I 2.97 ± 0.12 15.21 ± 0.67 40.64 ± 1.09Orange juice II 3.45 ± 0.09 22.78 ± 0.91 48.28 ± 1.54Pear juice 4.37 ± 0.19 4.47 ± 0.17Pineapple juice 0.82 ± 0.05Pink grapefruit juice 52.28 ± 1.77 365.76 ± 9.14Cranberry juice 0.43 ± 0.02 0.67 ± 0.03Blackcurrant juice 0.16 ± 0.01Apricot juice 2.99 ± 0.15 0.73 ± 0.03 8.36 ± 0.37
Values represent mean ± standard deviation from 4 analyses.5-HMF – 5-hydroxymethylfurfural.
Švecová, B. – Andrlová, K. J. Food Nutr. Res., Vol. 59, 2020, pp. 207–218
216
in high amounts in orange juices: concentration of naringin was 15.21 mg·l1 and 22.78 mg·l1 and concentration of hesperidin was 40.64 mg·l1 and 48.28 mg·l1. However, the highest concentrations of these flavonoids were found in pink grapefruit juice, which contained 52.28 mg·l1 of naringin and even 365.76 mg·l1 of hesperidin. In cranberry juice, chlorogenic acid and quercetin were found in very small amounts (below 1 mg·l1). However, chen et al. [22] determined 5 mg·l1 of chloro genic acid in canned cranberry juice and 12 mg·l1 of quercetin in hydrolysed products of canned juice. verSari et al. [28] published the concentration of chlorogenic acid of 26 mg·l1 in apricot juice, which is almost ten times higher concentration in comparison with our work. On the contrary, the ascorbic acid concentration in apricot juice was nearly double in our work in comparison with the results published by verSari et al. [28]. In that study, in pineapple and blackcurrant juices only one compound from seven phenolic compounds followed in this work was identified. However, these two samples surely contained certain amounts of antioxidants, which is evident from values obtained from antioxidant activity assays (Fig. 2). In subsequent work, it would therefore be very useful to try to identify other phenolic compounds, which are related with antioxidant effects of these samples. This would be feasible with HPLC equipped with a mass spectrometer as a detector.
conclusions
This work involved the analysis of quality control parameters of fruit juices as well as antioxidant activity determination and chromatographic analysis of selected phenolic compounds and together with 5hydroxymethylfurfural. Eleven
parameters were determined for ten samples of various fruit juices using classical analytical methods as titration, gravimetry or spectrometry. Regarding this part of the work, it is possible to state that analysed samples were not adulterated, because almost all results met the requirements of Czech technical standards. Nevertheless, it is necessary to add that, in accord with our expectations, juices of renowned brands had higher quality in comparison with lowend, cheaper products. In summary, the results were the most influenced by the type of fruit from which the juice was produced. Results on antioxidant activity determinated using established methods and total polyphenols showed a similar trend. A high antioxidant activity was determined for blackcurrant juice and pink grapefruit juice on the one hand, and low antioxidant activity showed cranberry or pear juices on the other hand. Finally, HPLC was used for determination of selected compounds in the juices. Five dominant compounds were quantified in apple juice, namely, 5hydroxymethylfurfural, chlorogenic acid, caffeic acid, naringin and hesperidin. Flavonoids naringin and hesperidin were dominant compounds in orange juice, pink grapefruit juice and apricot juice.
acknowledgementsThis work was supported by the University of
Pardubice, Faculty of Chemical Technology (Pardubice, Czech Republic).
reFerences
1. Fry, J. – Martin, G. G. – Lees, M.: Authentication of orange juice. In: Ashurst, P. R. (Ed.): Production and packaging of noncarbonated fruit juices and fruit beverages. 2nd edition. Boston: Springer, 1999, pp. 1–52. DOI: 10.1007/9781475762969_1.
Fig. 3. Chromatogram of the apple juice.
0
100
200
300
400
500
600
700
800
0 5 10 15 20 25 30 35 40Retention time [min]
Det
ecto
r res
pons
e [
]m
AU
5-HMF
Chlorogenic acid
Caffeic acid
Naringin
Hesperidin
Determination of quality indicators and antioxidant activity of various fruit juices
217
2. Singhal, R. S. – Kulkarni, P. R. – Rege, D. V.: Fruit and vegetable products. In: Singhal, R. S. – Kulkarni, P. R. – Rege, D. V.: Handbook of indices of food quality and authenticity. Cambridge : Woodhead Publishing, 1997, pp 77–130. ISBN: 1855732998.
3. Saeeduddin, M. – Abid, M. – Jabbar, S. – Wu, T. – Hashim, M. M. – Awad, F. N. – Hu, B. – Lei, S. – Zeng, X.: Quality assessment of pear juice under ultrasound and commercial pasteurization processing conditions. LWT Food Science and Technology, 64, 2015, pp. 452–458. DOI: 10.1016/j.lwt.2015.05.005.
4. The AIJN Code of Practice. In: AIJN European Fruit Juice Association [online]. Brussels : AIJN Eiropean Fruit Juice Association, revised July 2019 [cit. 31 January 2020]. <https://aijn.eu/en/theaijncodeofpractice>
5. ČSN EN 12134. Ovocné a zeleninové šťávy – Stanovení odstředitelné dužiny. (Fruit and vegetable juices – Determination of centrifugable pulp content.) Prague : Czech Standards Institute, 1998.
6. ČSN EN 1131. Ovocné a zeleninové šťávy – Stanovení relativní hustoty. (Fruit and vegetable juices – Determination of the relative density.) Prague : Czech Standards Institute, 1996.
7. ČSN EN 12145. Ovocné a zeleninové šťávy – Stanovení celkové sušiny – Vážková metoda ztráty hmotnosti sušením. (Fruit and vegetable juices – Determination of total dry matter – Gravimetric method of weight loss by drying.) Prague : Czech Standards Institute, 1998.
8. ČSN EN 1135. Ovocné a zeleninové šťávy – Stanovení popela. (Fruit and vegetable juices – Determination of ash.) Prague : Czech Standards Institute, 1996.
9. ČSN EN 12147. Ovocné a zeleninové šťávy – Stanovení titrační kyselosti. (Fruit and vegetable juices – Determination of titrable acidity.) Prague : Czech Standards Institute, 1998.
10. ČSN EN 12135. Ovocné a zeleninové šťávy – Stanovení obsahu dusíkatých látek – Kjeldahlova metoda. (Fruit and vegetable juices – Determination of nitrogen content – Kjeldahl method.) Prague : Czech Standards Institute, 1998.
11. ČSN EN 1133. Ovocné a zeleninové šťávy – Stanovení formolového čísla. (Fruit and vegetable juices – Determination of the formol number.) Prague : Czech Standards Institute, 1996.
12. ČSN EN 1141. Ovocné a zeleninové šťávy – Spektrofotometrické stanovení obsahu prolinu. (Fruit and vegetable juices – Spectrometric determination of proline content.) Prague : Czech Standards Institute, 1996.
13. Robards, K. – Prenzler, P. D. – Tucker, G. – Swatsitang, P. – Glover, W.: Phenolic compounds and their role in oxidative processes in fruits. Food Chemistry, 66, 1999, pp. 401–432. DOI: 10.1016/S03088146(99)00093X.
14. Kim, D. B. – Shin, G. H. – Lee, Y. J. – Lee, J. S. – Cho, J. H. – Baik, S. O. – Lee, O. H.: Assessment and comparison of the antioxidant activities and nitrite scavening activity of commonly consumed beverages in Korea. Food Chemistry, 151, 2014, pp. 58–64.
DOI: 10.1016/j.foodchem.2013.11.034. 15. Shahidi, F. – Ambigaipalan, P.: Phenolics and
polyphenolics in foods, beverages and spices: Antioxidant activity and health effects – A review. Journal of Functional Foods, 18, 2015, pp. 820–897. DOI: 10.1016/j.jff.2015.06.018.
16. Costa, A. S. G.: – Nunes, M. A. – Almeida, I. M. C. – Carvalho, M. R. – Barroso, M. F. – Alves, R. C. – Oliveira, M. B. P. P.: Teas, dietary supplements and fruit juices: A comparative study regarding antioxidant activity and bioactive compounds. LWT Food Science and Technology, 49, 2012, pp. 324–328. DOI: 10.1016/j.lwt.2012.02.030.
17. Šulc, M. – Lachman, J. – Hamouz, K. – Orsák, M. – Dvořák, P. – Horáčková, V.: Výběr a zhodnocení vhodných metod pro stanovení antioxidační aktivity fialových a červených odrůd brambor. (Selection and evaluation of methods for determination of antioxidant activity of purple and red fleshed potato varieties.) Chemické Listy, 101, 2007, pp. 584–591. ISSN: 12137103. <http://chemickelisty.cz/docs/full/2007_07_584591.pdf> In Czech.
18. PérezJiménez, J. – Arranz, S. – Tabernero, M. – Díaz-Rubio, M. E. – Serrano, J. – Goñi, I. – Saura-Calixto, F.: Updated methodology to determine antioxidant capacity in plant foods, oil and beverages: Extraction, measurement and expression of results. Food Research International, 41, 2008, pp. 274–285. DOI: 10.1016/j.foodres.2007.12.004.
19. WoottonBeard, P. C. – Moran, A. – Ryan, L.: Stability of the total antioxidant capacity and total polyphenol content of 23 commercially available ve getable juices before and after in vitro digestion measured by FRAP, DPPH, ABTS and Folin–Ciocalteu methods. Food Research International, 44, 2011, pp. 217–224. DOI: 10.1016/j.foodres.2010.10.033.
20. Zaouay, F. – Mena, P. – GarciaViguera, C. – Mars, M.: Antioxidant activity and physicochemical properties of Tunisian grown pomegranate (Punica granatum L.) cultivars. Industrial Crops and Products, 40, 2012, pp. 81–89. DOI: 10.1016/j.indcrop.2012.02.045.
21. Prior, R. L. – Wu, X. – Schaich, K.: Standardized methods for the determination of antioxidant capacity and phenolics in foods and dietary supplements. Journal of Agricultural and Food Chemistry, 53, 2005, pp. 4290–4302. DOI: 10.1021/jf0502698.
22. Chen, H. – Zuo, Y. – Deng, Y.: Separation and determination of flavonoids and other phenolic compounds in cranberry juice by highperformance liquid chromatography. Journal of Chromatography A, 913, 2001, pp. 387–395. DOI: 10.1016/S00219673(00)01030X.
23. Kahle, K. – Kraus, M. – Richling, E.: Polyphenol profiles of apple juices. Molecular Nutrition and Food Research, 49, 2005, pp. 797–806. DOI: 10.1002/mnfr.200500064.
24. Karaman, S. – Tütem, E. – Başkan, K. S. – Apak, R.: Comparison of total antioxidant capacity and phenolics composition of some apple juices with combined HPLCCUPRAC assay. Food Chemistry, 120, 2010, pp. 1201–1209. DOI: 10.1016/j.food
Švecová, B. – Andrlová, K. J. Food Nutr. Res., Vol. 59, 2020, pp. 207–218
218
31. ČSN 56 8542. Ovocné a zeleninové šťávy – Grapefruitová šťáva. (Fruit and vegetable juices – Grapefruit juice.) Prague : Czech Standards Institute, 2001.
32. Mattila, P. H. – Hellström, J. – McDougall, G. – Dobson, G. – Pihlava, J. M. – Tiirikka, T. –Stewart, D. – Karjalainen, R.: Polyphenol and vitamin C contents in European commercial black currant juice products. Food Chemistry, 127, 2011, pp. 1216–1223. DOI: 10.1016/j.foodchem.2011.01.129.
33. Gardner, P. T. – White, T. A. C. – McPhail, D. B. – Duthie, G. G.: The relative contributions of vitamin C, carotenoids and phenolics to the antioxidant potencial of fruit juices. Food Chemistry, 68, 2000, pp. 471–474. DOI: 10.1016/S03088146(99)002253.
34. Miller, N. J. – RiceEvans, C. A.: The relative contributions of ascorbic acid and phenolic antioxidants to the total antioxidant activity of orange and apple fruit juices and blackcurrant drink. Food Chemistry, 60, 1997, pp. 331–337. DOI: 10.1016/S03088146(96)003391.
35. Gökmen, V. – Acar, J.: Simultaneous determination of 5hydroxymethylfurfural and patulin in apple juice by reversedphase liquid chromatography. Journal of Chromatography A, 847, 1999, pp. 69–74. DOI: 10.1016/S00219673(99)001338.
Received 14 April 2020; 1st revised 21 May 2020; 2nd revised 12 June 2020; accepted 22 July 2020; published online 29 July 2020.
chem.2009.11.065. 25. Kelebek, H. – Selli, S. – Canbas, A. – Cabaroglu, T.:
HPLC determination of organic acids, sugars, phenolic compositions and antioxidant capacity of orange juice and orange wine made from a Turkish cv. Kozan. Microchemical Journal, 91, 2009, pp. 187–192. DOI: 10.1016/j.microc.2008.10.008.
26. Tanriöven, D. – Ekşi, A.: Phenolic compounds in pear juice from different cultivars. Food Chemistry, 93, 2005, pp. 89–93. DOI: 10.1016/j.foodchem.2004.09.009.
27. Vanamala, J. – Reddivari, L. – Yoo, K. S. – Pike, L. M. – Patil, B. S.: Variation in the content of bioactive flavonoids in different brands of orange and grapefruit juices. Journal of Food Composition and Analysis, 19, 2006, pp. 157–166. DOI: 10.1016/j.jfca.2005.06.002.
28. Versari, A. – Parpinello, G. P. – Mattioli, A. U. – Galassi, S.: Characterisation of Italian commercial apricot juices by highperformance liquid chromatography analysis and multivariate analysis. Food Chemistry, 108, 2008, pp. 334–340. DOI: 10.1016/j.foodchem.2007.10.053.
29. ČSN 56 8543. Ovocné a zeleninové šťávy – Jablečná šťáva. (Fruit and vegetable juices – Apple juice.) Prague : Czech Standards Institute, 2001.
30. ČSN 56 8541. Ovocné a zeleninové šťávy – Pomerančová šťáva. (Fruit and vegetable juices – Orange juice.) Prague : Czech Standards Institute, 2001.


![Voltammetric and spectrometric determination of ... · measuring wine´s antioxidant activity [9,10]. Many different methods can be used to measure the antioxidant activity, with](https://static.fdocuments.us/doc/165x107/5ec148bca52d6f15852a056a/voltammetric-and-spectrometric-determination-of-measuring-wines-antioxidant.jpg)