View the Department of Finance Proposal ( Filesize: 7.8 MB )

1
Determination of Primary Care Panel
Size in a Value Based Compensation
Health Care Delivery Environment
Dale Eric Green, MD MHA
Chief Medical Information Officer
Cornerstone Health Care
High Point, NC
AMGA Institute for Quality Leadership
September 25-27, 2013

2
Disclosure
• I am employed by Cornerstone Health
Enablement Strategic Solutions, a
wholly owned subsidiary of Cornerstone
Health Care, P.A., High Point NC.
• I have no conflicting financial interest in
any product or enterprise related to this
presentation.

3
Learning Objectives
• Understand the concept and different definitions of
physician panel size and potential use for equitable
workload distribution by adjusting for patient risk
• Understand the potential benefits and risks of using
panel size as part of a physician compensation models
and value based delivery systems
• Consider different variables of interest for panel size
computations
• Understand the concept of “balancing metrics” to
assess unintended consequences panel size use in
physician compensation models

4
Cornerstone Health Care
1995 2013
42 physicians > 250
2 APPs 111 APPs
8 specialties 36 specialties
221 employees > 1800 employees
19 locations 115 locations
1 hospital (High Point) 15 hospitals
29 PCP PCMH level 3

5
NC County Coverage
6
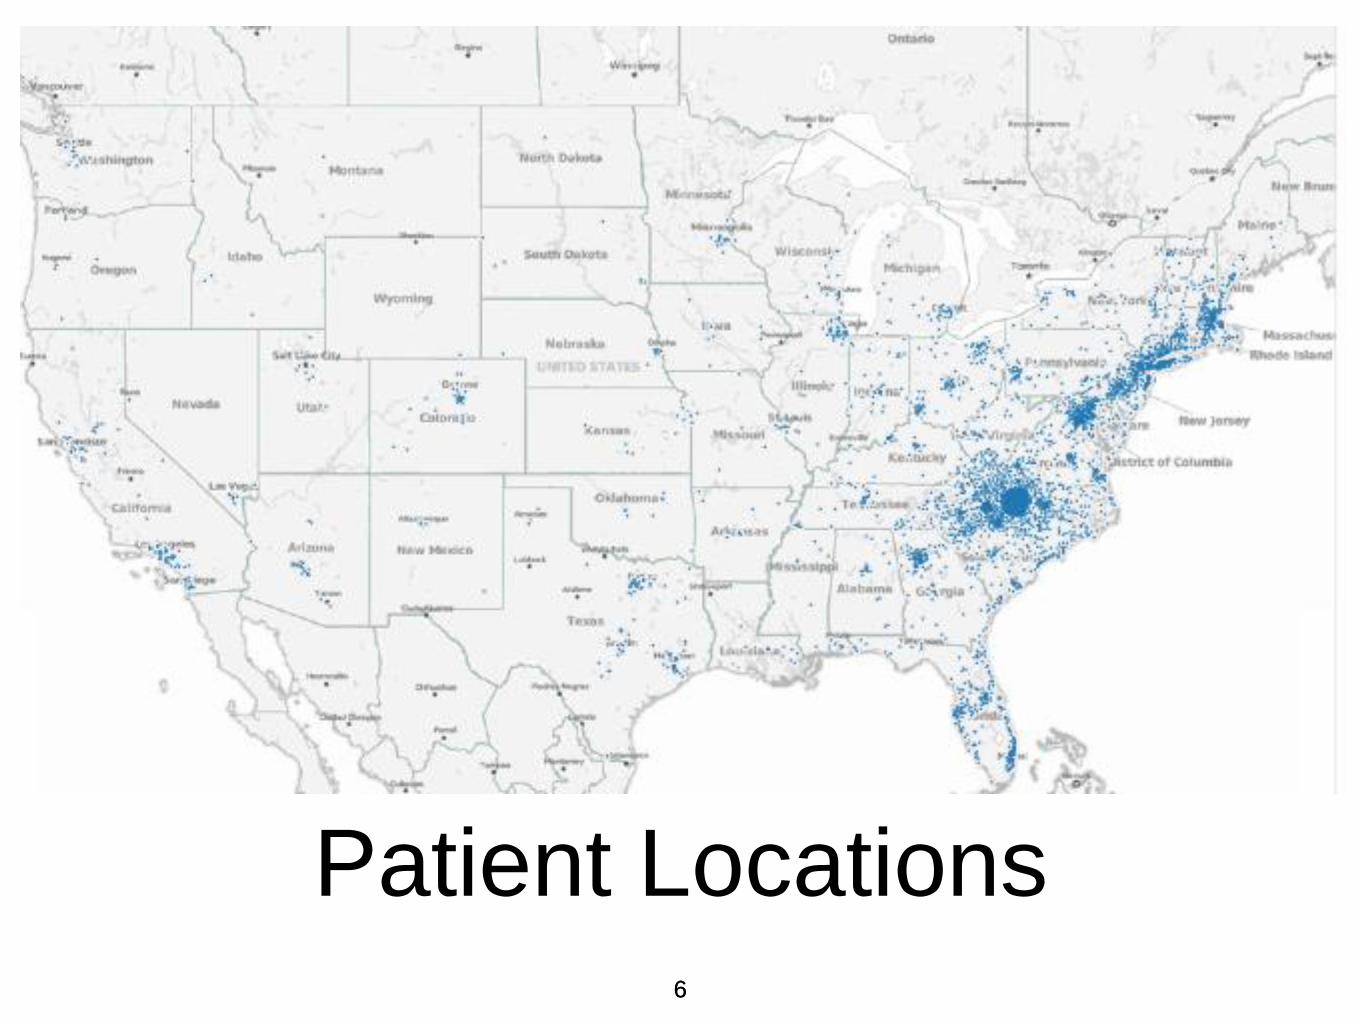
Patient Locations 6

7
Primary Care Practice
Characteristics
• Most physician providers are
Cornerstone shareholders, i.e. owners
• Few “employed” physicians, all APPs
employed
• Offices and providers manage their own
schedules
8
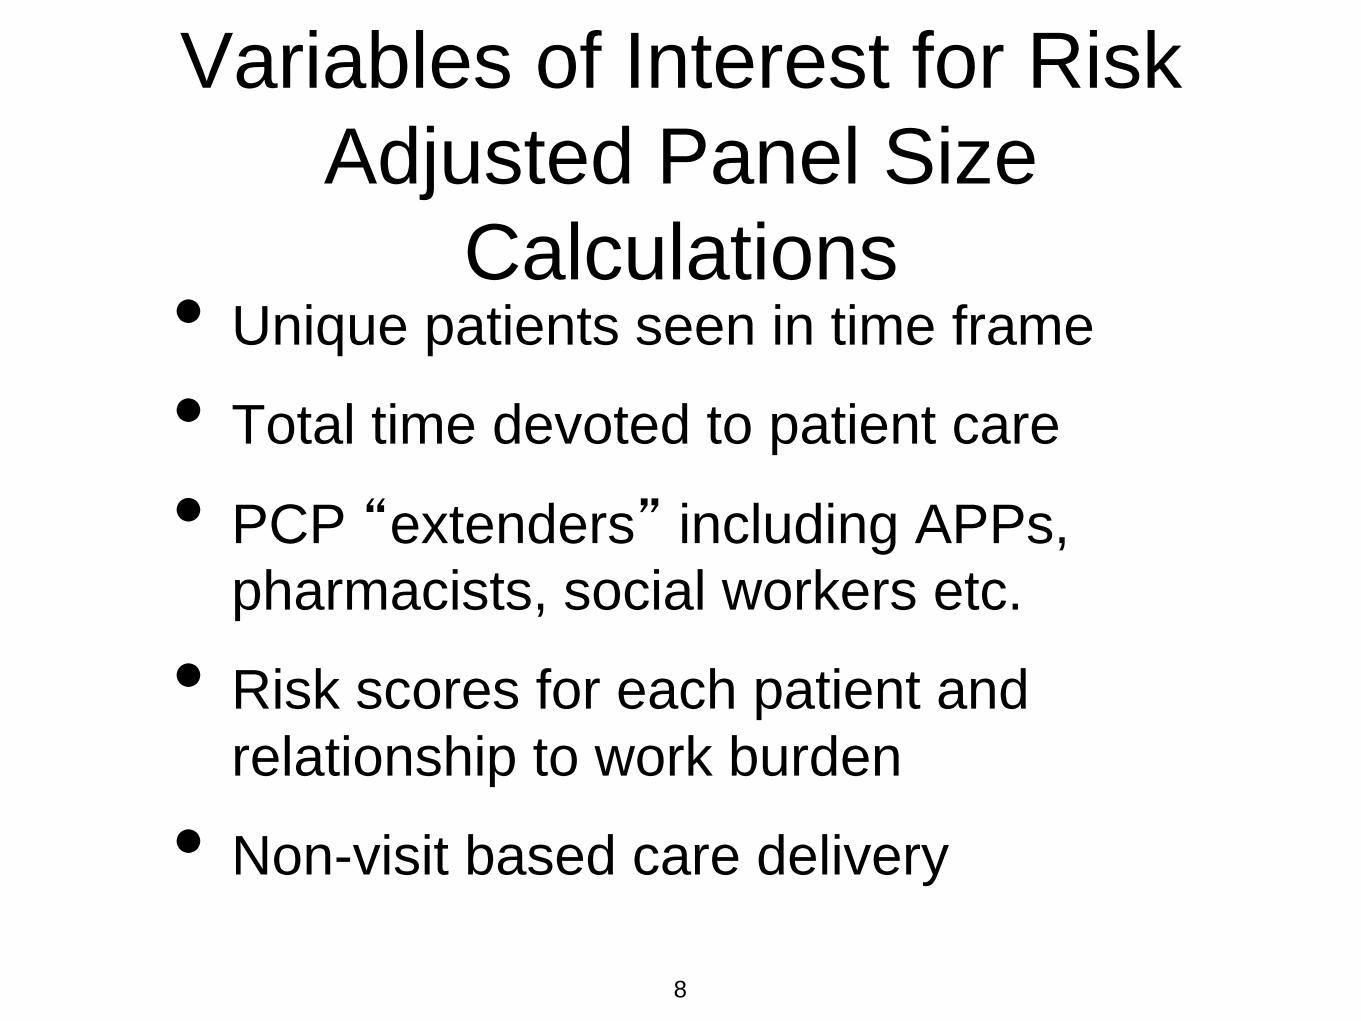
Variables of Interest for Risk
Adjusted Panel Size
Calculations • Unique patients seen in time frame
• Total time devoted to patient care
• PCP “extenders” including APPs,
pharmacists, social workers etc.
• Risk scores for each patient and
relationship to work burden
• Non-visit based care delivery
9
Traditional Definitions of
“Panel Size”
• Unique 12 (U12) and Unique 18 (U)
patient visits to a provider in 12 - 18
months

10
Patient Panel Size
Conceptual Framework • In a value based delivery model transitioning
away from strictly fee for service - “panel size” is the number of patients “under care” by a
primary care provider.
• “Under care” is loosely defined but may include
having seen the PCP in 12 - 18 months
• In a PFV environment - “under care” may
include: non-face to face visits, nurse care
navigation, social services, dieticians, and even
speciality visits arranged by the PCP

11
Patient Panel Size
Conceptual Framework
(cont.)
• FFS revenue = fx(Service Volume,
Price)
• PFV revenue = fx(Patient Panel, Value)
12
Risk Adjusted Panel Size
Rational
• Value based delivery model provider
compensation is dictated by volume of
effective care delivered by the provider
adjusted for patient complexity.
13
Compensation Example
• Total PCP compensation for 1200
patients of average disease burden with
high quality care = $240,000 or $200
PMPY
• Total PCP compensation for 400
patients with disease burden “3 times
greater” than average with high quality
care = $240,000 or $600 PMPY

14
Risk Adjusted Panel Size
Working Definition
• Unique patients managed by a provider
for 12 contiguous months adjusted for
the clinical risk of the patients

15
Definition Problems
• What is a “provider” - PCPs, APPs,
nurses, care navigators, social works,
etc?
• What is “managed” - E&M visits,
specialty referrals, home health visits,
telephone consultations, etc?
• What is a “month” - 30 days, visit hours,
days worked, hours worked, etc?

16
Definition Problems
(cont.)
• What is “risk” - demographics, historic
cost, Charlson scores, HCC scores,
claims based groupers, “complexity,” etc?
• What is “risk adjusted” - ?

17
Definition of “Provider”
• Physician and Advanced Practice
Practitioner (APP) treated equally

18
Definition of “Managed”
• “Managed” = patients with any
evidence of ongoing management in
time period - in essence, any billable
service by a provider evidenced in the
EMR

19
Definition of “Month”
• Month = median number of available
office hours in Cornerstone’s primary
care practices per month

20
Panel Size Calculation
Methodology
• Primary care practices
• 2 years of billable service counts
analyzed by rolling 12 months plotted
monthly for 12 months
• Aggregated for each practice
• Normalized by average provider time
worked (FTE) within the practice

21
Monthly Office Hours for
10 PCP Practices

22 22
Practice Hours and Visits

23
Provider Hours and Visits

24
Appointment Hours
Median Hours = 110 = “FTE”

25
Unique Patients Per
Month

26
Unique Patients per
Rolling Yr - 2 Ways
27
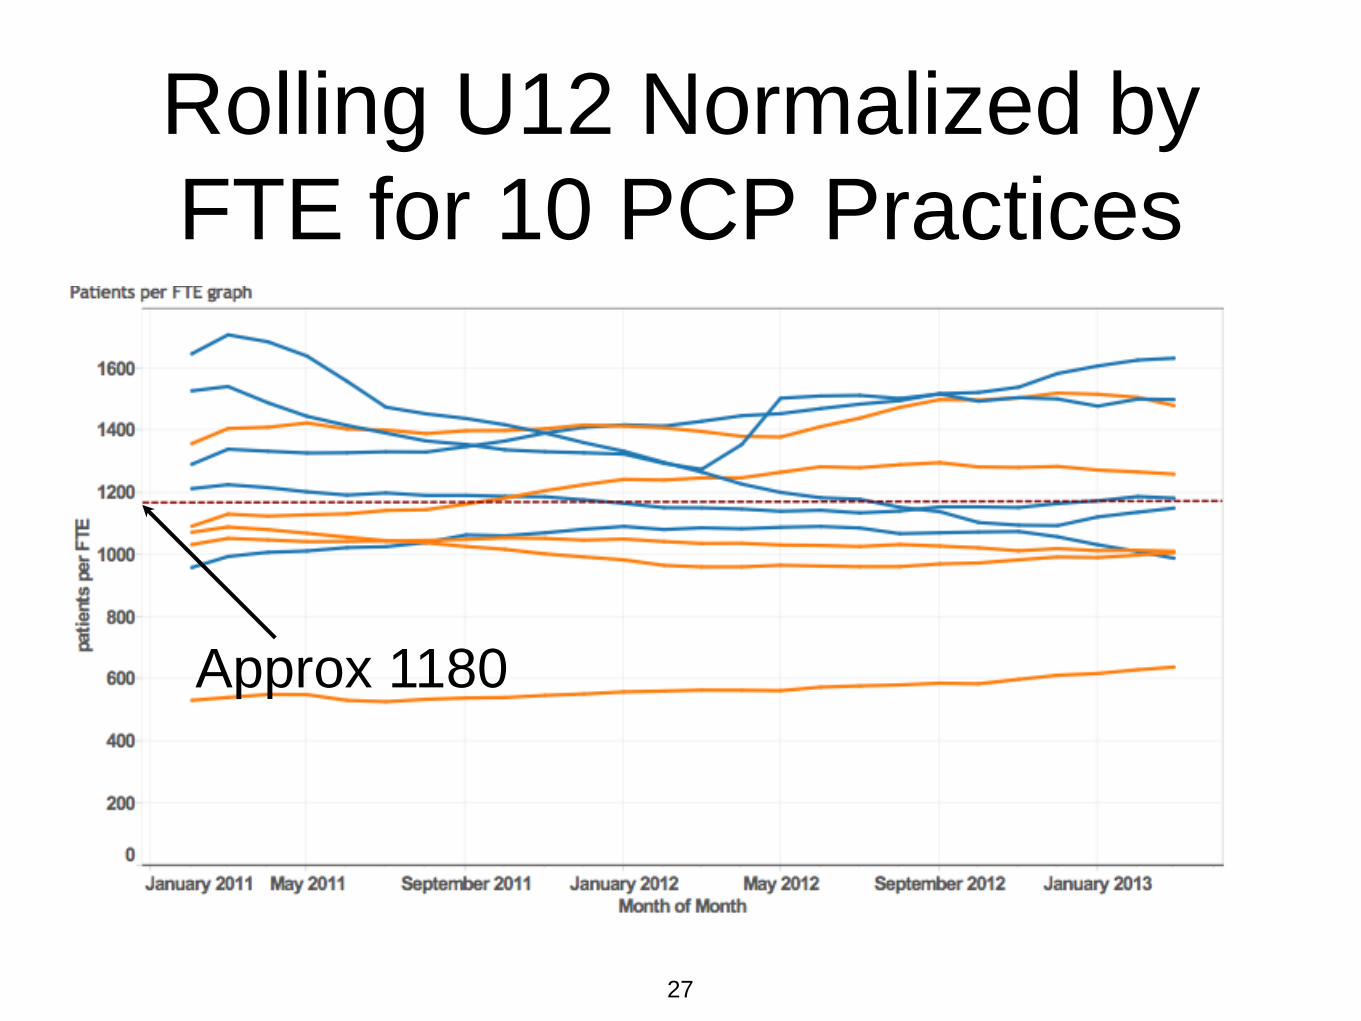
Rolling U12 Normalized by
FTE for 10 PCP Practices
Approx 1180
28
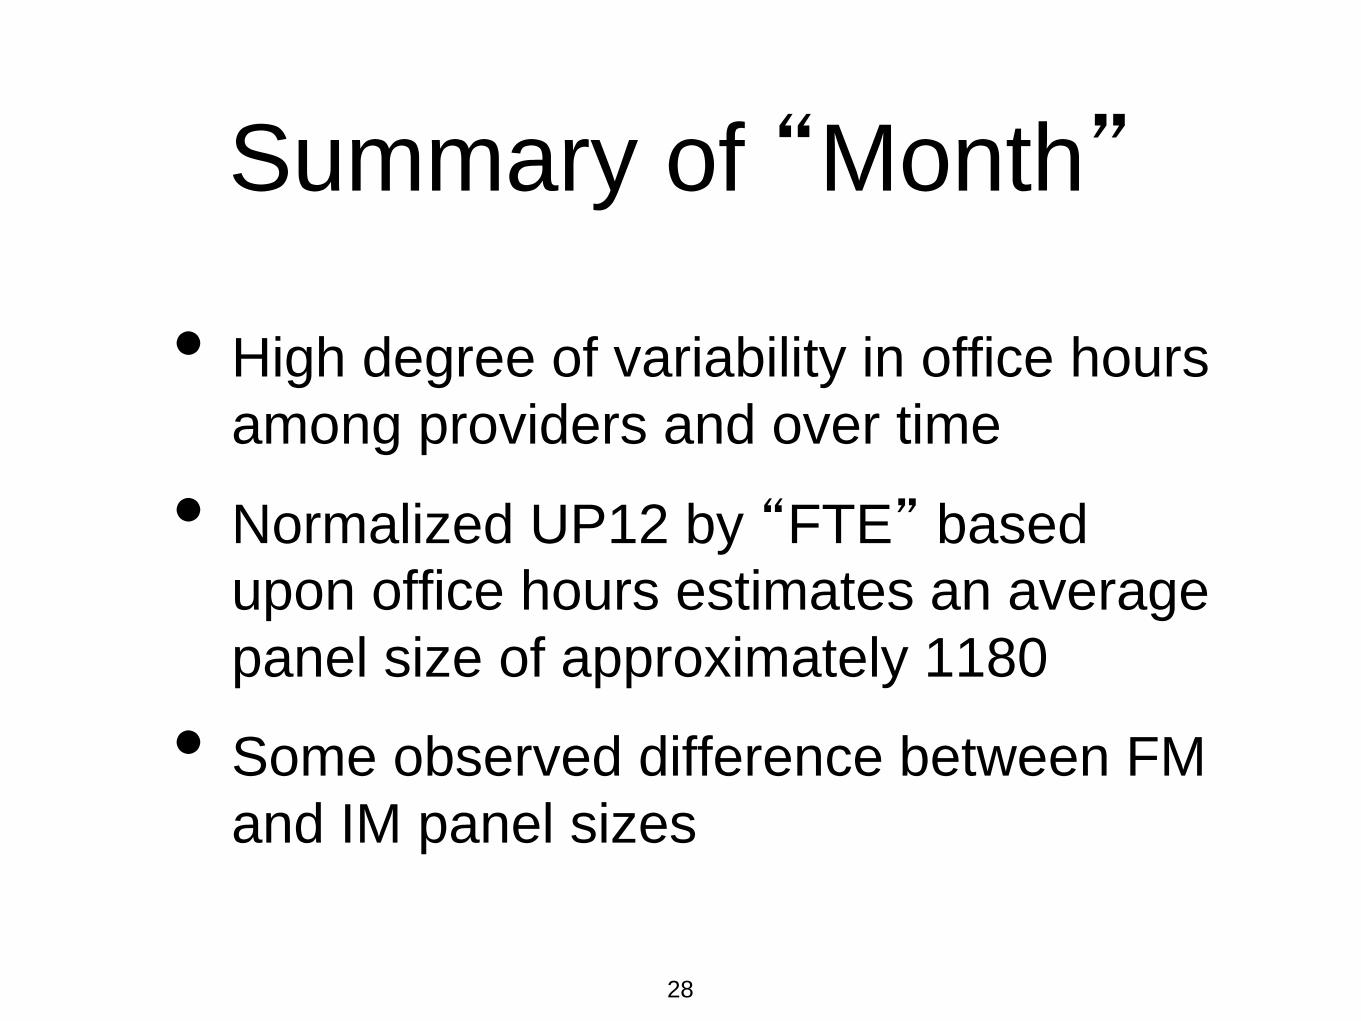
Summary of “Month”
• High degree of variability in office hours
among providers and over time
• Normalized UP12 by “FTE” based
upon office hours estimates an average
panel size of approximately 1180
• Some observed difference between FM
and IM panel sizes

29
Definition of “Risk”
• Several risk scoring methods compared
- age, HCC, Charlson, Optum Impact
Pro.
• All are inadequate representation of
“complexity” or burden of work.

30
Definition of “Risk
Adjusted”
• Normalization of U12 counts using
methods that resonates with
providers

31
Normalization of Panel
Size by Risk Burden
• “Risk burden” used as a surrogate for
“work” and “complexity” burden
• Similar concept to RVUs - although
RVU calculations are mostly artifacts of
documentation
• Age, Charlson Score, Optum Scores,
HCC scores analyzed

32
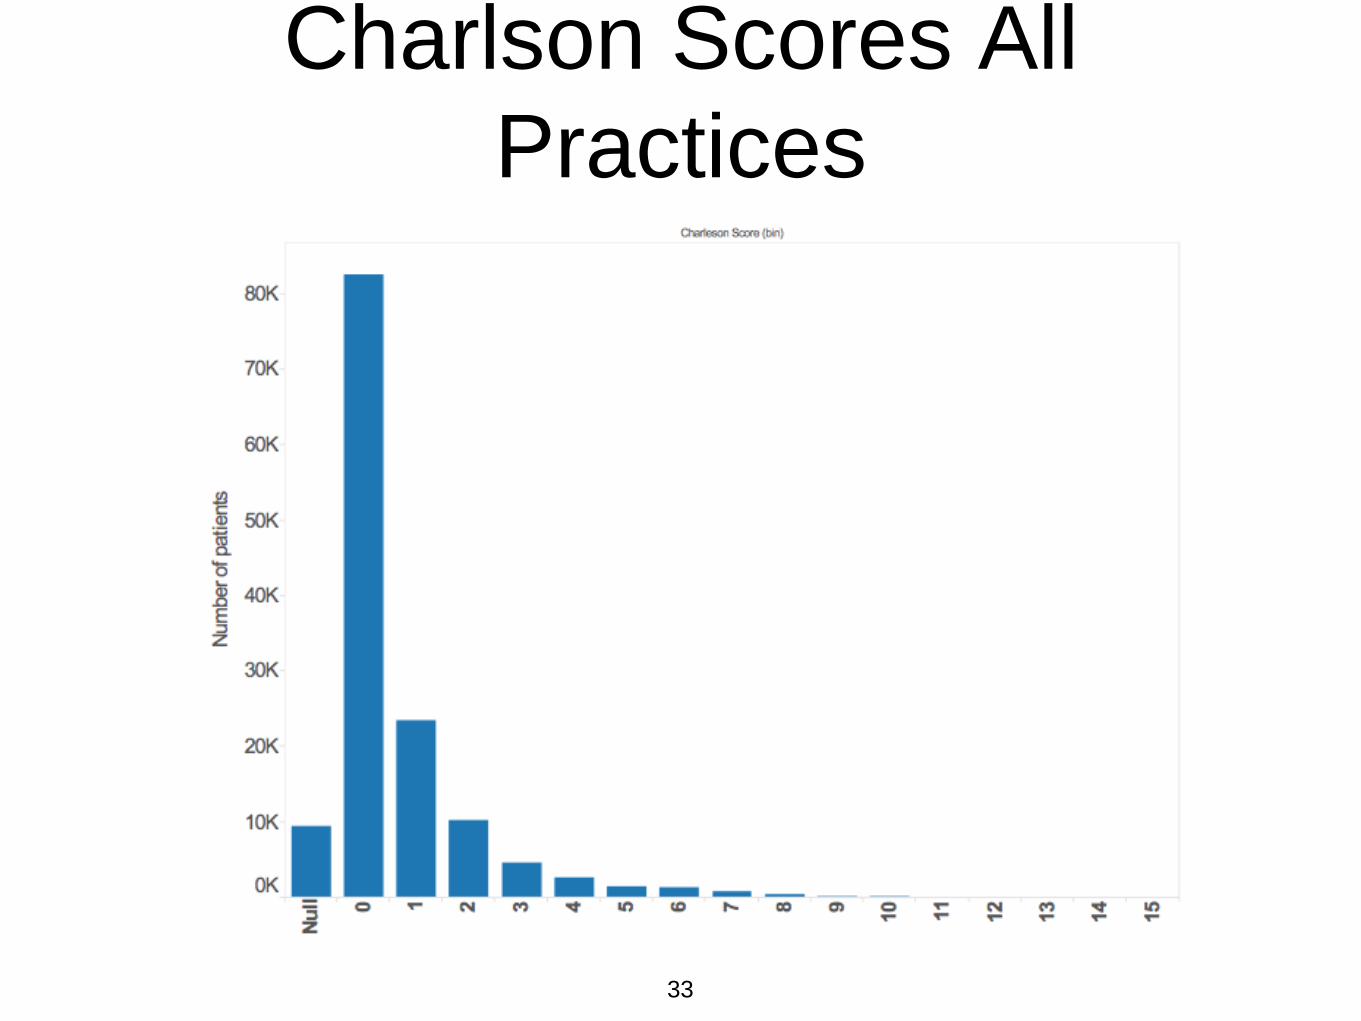
Comparison of Risk
Scores • Age
• Charles Scores - based upon age and 16
clinical conditions
• CMS-HCC - CMS Hierarchical Condition
Categories: based upon age/sex and
submitted claims - very granular measure
• Optum Impact Pro - claims and
demographics based
33
Charlson Scores All
Practices
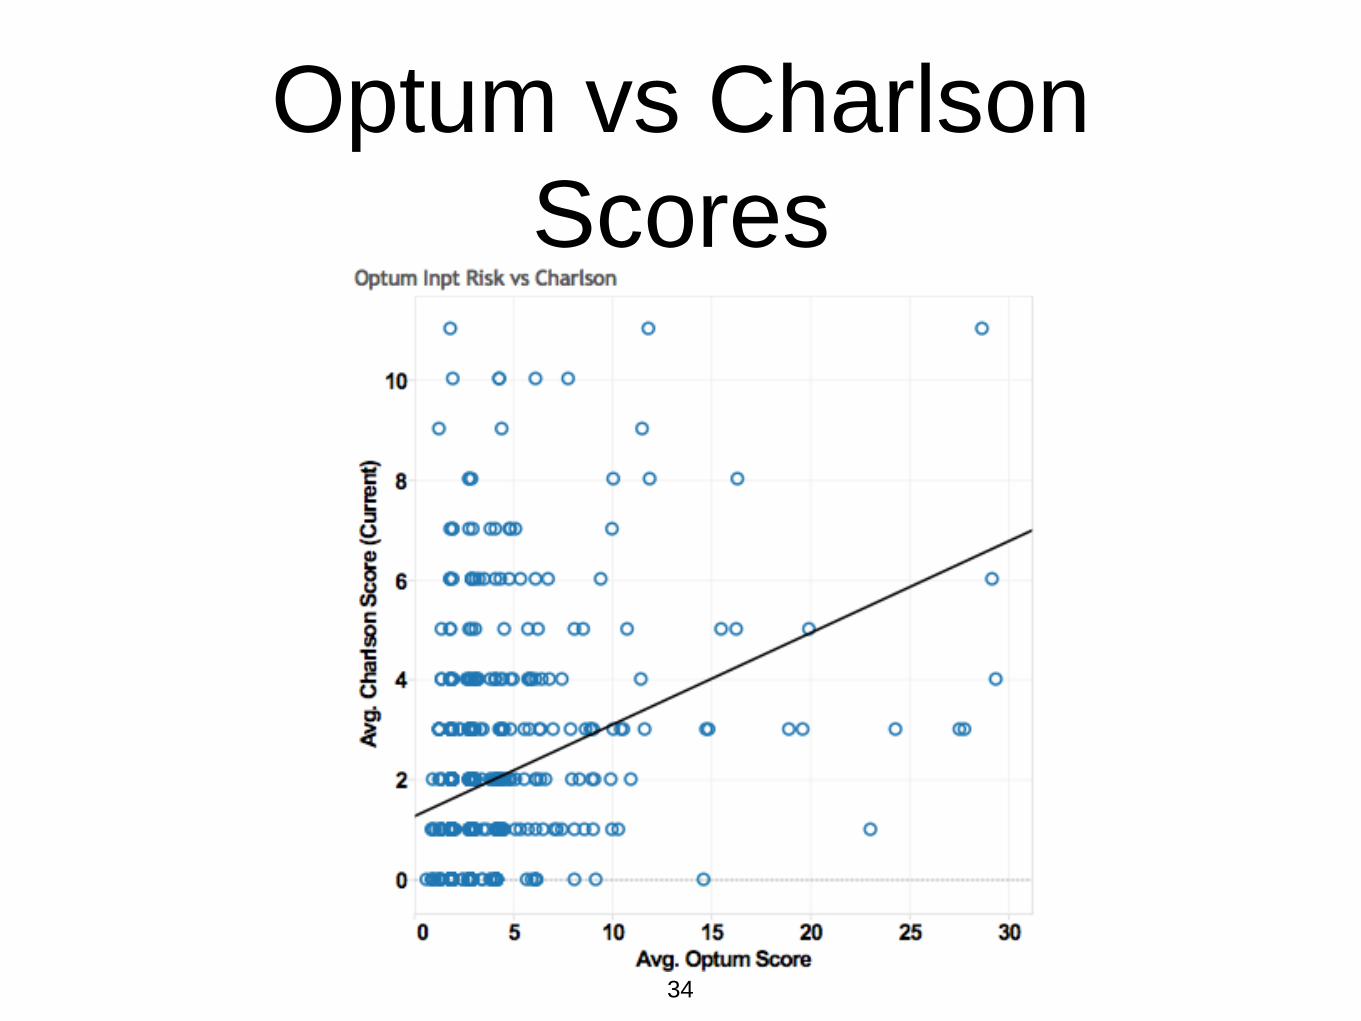
34
Optum vs Charlson
Scores

35
HCC vs Charlson

36
Need for Normalized
Risk Scoring?
• Method to directly compare the scores
with each other (even though they
largely measure different things)
• Obviate the problem of a “fractional”
patient equivalent score
• Resonate with providers

37
Normalizing Risk Scores
• Convert each individual patient score
into discrete value based upon cut point
values derived from Pareto distributions
• 0-70% = 1, 71%-95% = 2, >95% = 3

38
Optum and Charlson
Score Pareto Charts
39
Risk Burden Calculation
• Sum all normalized risk scores = Risk
Burden
• Divide Risk Burden by panel count =
Average Normalized Risk Score for a
practice (ANRSp)

40
Risk Scores and Patient
Panel Size

41
Summary of Methods
• Obtain counts of services over 1 year
aggregated by practice
• Divide counts by full time equivalent values to
derive panel size per FTE
• Sum the Normalized Risk Scores to derive
“Risk Burden”
• “Risk Burden” = Risk Adjusted Panel Size
• Calculate ANRSp by dividing Risk Burden by
average panel size per FTE

42
Hypothetical Risk
Adjusted Panel Size
Illustration

43
Panel Size Heat Map

44
HCC Sum Heat Map

45
HCC Score Heat Map

46
Caveats
• “Risk” does not necessarily = “work
burden”
• Although ANRSp using each method
are similar in magnitude, the distribution
of patients in each category varies
greatly
• There is large variability in work output
per physician provider (APPs, hrs
worked, etc)
47
Caveats (cont.)
• Patient panel size is heavily influenced
by very busy periods
• Patient management does not always
occur via billable visits and this may
increase with time

48
Balancing Metrics to
Consider • CMS-HCC coding inadequacy:
compliance audits
• Inflated panels secondary to patient visit
“flurries” and work load imbalance within
a practice: frequent panel size
assessment, visit volumes per 1000
patients by provider?
• Panel inflation: routine quality and
satisfaction feedback.

49
Summary
• Provider panel size calculations have
many variables to consider (work hours,
work load balance, attribution, non-visit,
and non-billable encounters, APPs,
ancillary services, etc.)
• “Risk” plays a small but perceptible role
in observed panel size calculations for
PCP

50
Summary (cont.)
• Risk adjusted panel sizes, if done
carefully, may have a role in value
based compensation models

51
Further Reading
• Naessens J, Baird M, Van Houten H, et al. Predicting
persistently high primary care use: Ann Fam Med
2005;3:324-30.
• Katerndahl D, Wood R, Jaen C, A Method for estimating
relative complexity of ambulatory care: Ann Fam Med
2010;8:4 341-347.
• Rosen A, Reid R, Broemeling A, Rokovski C, Applying a
risk-adjustment framework to primary care: can we improve
on existing measures? Ann Fam Med 2013;1:1 44-51.
• Evans M, et al. Evaluation of the CMS-HCC risk adjustment
model, CMS Division of Risk Adjustment and Payment
Policy Final Report March 2011