
DETERMINATION OF NORMATIVE DATA ON NON INVASIVE...
42
DETERMINATION OF NORMATIVE DATA ON NON INVASIVE ELECTROCOCHLEOGRAPHY TEST IN MALAYSIAN ADULTS By DR ZALILAH MUSA Dissertation Submitted In Partial Fulfillment Of The Requirements For The Degree of Master Of Medicine (Otorhinolaryngology- Head and Neck Surgery) UNIVERSITI SAINS MALAYSIA 2015
Transcript of DETERMINATION OF NORMATIVE DATA ON NON INVASIVE...

DETERMINATION OF NORMATIVE DATA ON NON
INVASIVE ELECTROCOCHLEOGRAPHY TEST IN
MALAYSIAN ADULTS
By
DR ZALILAH MUSA
Dissertation Submitted In
Partial Fulfillment Of The Requirements
For The Degree of
Master Of Medicine
(Otorhinolaryngology- Head and Neck Surgery)
UNIVERSITI SAINS MALAYSIA
2015

ACKNOWLEDGEMENT
In the name of Allah , the most merciful and most greatful, with his blessing has allowed me
to successfully complete this study. First and foremost, I would like to express my deep thanks
and utmost gratitude to my supervisor Professor Dr Din Suhaimi Sidek for his assistance and
contribution throughout the preparation and completion of this dissertation. My warmest
appreciation and thankfulness is extended as well to Dr Nik Adilah Nik Othman , my co-
supervisor for her support. Besides I am truly indebted and thankful to Dr Mohd Normani
Zakaria who also acted as my co-supervisor who has given full commitment, persistent help
and guidance towards the completion of this dissertation. It is also a great pleasure to thanks
all the staffs in Department of Otorhinolaryngology and Department of Audiology, Pusat
Pengajian Sains Perubatan Hospital University Sains Malaysia, Kubang Kerian for all their
help.
Not forgetting, grateful thanks to all subjects who are willingly participated in this study.
Finally to all my family members, I will forever cherish their continuous support and pray until
this dissertation was successfully completed.
ii

TABLE OF CONTENTS
TITTLE PAGE
Acknowledgement ii
Table of contents iii
List of symbols, abbreviation or nomenclature viii
List of figures xi
List of tables xii
Abstrak xiii
Abstract xvi
CHAPTER 1 : INTRODUCTION
1.1 Background of Study 1
1.2 Anatomy and Physiology of ear 3
1.3 Electrocochleogram components
1.3.1 Cochlea microphonic 8
1.3.2 Summating potential 9
iii

1.3.3 Action potential 10
1.4 Electrocochleography recording approaches 13
1.5 Electrocochleogram recording parameters
1.5.1.Electrode array 17
1.5.2 Timebase 18
1.5.3. Amplification factor 18
1.5.4. Analog Filter Setting 19
1.5.5 Repetitions 19
1.5.6. Stimuli 20
1.6 Interpretation of Electrocochleogram 20
1.7 Electrocochleogram applications
1.7.1 .Evaluation of menierre’s disease /
endolymphatic hydrops 23
1.7 .2. Auditory neuropathy 24
1.7.3. Enhancement of wave 26
1.7.4.Intraoperative monitoring 27
1.7.5. Diagnosis of perilymphatic fistula 28
1.7.6. Other applications 28
1.8 Problem statement 29
iv

CHAPTER 2 : OBJECTIVES OF STUDY
2.1 General objectives 30
2.2 Specific objectives 30
2.3 Research hypothesis
2.3.1 Null hypothesis 30
2.3.2 Alternate hypothesis 30
CHAPTER 3 : METHODOLOGY
3.1 Study design 31
3.2 Study population 31
3.3 Study method 31
3.4 Selection criteria
3.4.1 Inclusion criteria 32
3.4.2 Exclusion criteria 32
3.5 Sample size calculations 32
3.6 Equipments and materials 33
3.7 Study procedure 46
v

CHAPTER 4 : RESULTS
4.1 Age distribution 53
4.2 Gender distribution 53
4.3 Ethnic distribution 54
4.4 ECochG Findings in right and left ear 55
4.5 ECochG Findings in term of gender and
electrode placements 57
4.6 Normative data of ECochG for Malaysian adults 59
4.7 Normal ECochG recording graph 60
CHAPTER 5 : DISCUSSION
5.1 Epidemiology 62
5.2 Electrode and electrode placements 63
5.3 Subject comfort 65
5.4 Results 66
5.5 Clinical implications 73
vi
CHAPTER 6 : CONCLUSION 75
CHAPTER 7 : LIMITATIONS AND RECOMMENDATION 76
REFERENCES 79
APPENDIX A : Ethical Approval Letter 83
APPENDIX B : Consent Form 84
APPENDIX C : Data collection for ECochG 97
vii

LIST OF SYMBOL, ABBREVIATION AND NOMENCLATURE
ECochG Electrocochleography
AER Auditory evoked response
AP Action potential
CM Cochlear microphonic
SP Summating potential
ABR Auditory brain response
AEP Auditory evoked potentials
EAC External auditory canals
TM Tympanic membrane
BM Basilar membrane
ATP Adenosine Triphosphate
AC Alternating current
DC Direct current
MD Menierre’s Disease
ELH Endolymphatic hydrops
IT Intratympanic
TT Transtympanic
ET Extratympanic
BBC Broadband click
AN Auditory neuropathy
OAE Otoacoustic emission
IHC Inner hair cell
viii

OHC Outer hair cell
EABR Evoked auditory brainstem response
DP Dendritic potential
CAP Compound action potential
ABEP Auditory brainstem evoked potential
HUSM Hospital Universiti Sains Malaysia
PTA Pure tone audiometry
ix
LIST OF FIGURES PAGE
Figure 1.1: Parts of the ear. 3
Figure 1.2 : The four quadrant of Tympanic membrane 4
Figure 1.3 : The middle ear cavity 5
Figure 1.4 : Organ of corti 6
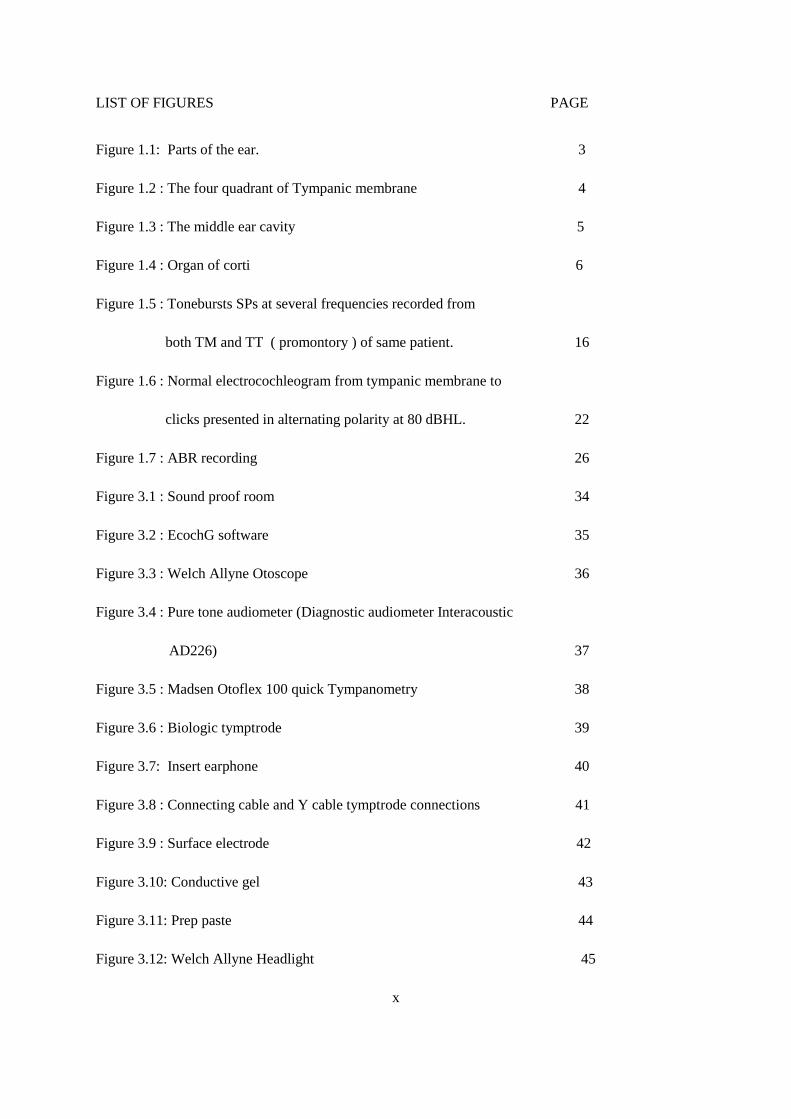
Figure 1.5 : Tonebursts SPs at several frequencies recorded from
both TM and TT ( promontory ) of same patient. 16
Figure 1.6 : Normal electrocochleogram from tympanic membrane to
clicks presented in alternating polarity at 80 dBHL. 22
Figure 1.7 : ABR recording 26
Figure 3.1 : Sound proof room 34
Figure 3.2 : EcochG software 35
Figure 3.3 : Welch Allyne Otoscope 36
Figure 3.4 : Pure tone audiometer (Diagnostic audiometer Interacoustic
AD226) 37
Figure 3.5 : Madsen Otoflex 100 quick Tympanometry 38
Figure 3.6 : Biologic tymptrode 39
Figure 3.7: Insert earphone 40
Figure 3.8 : Connecting cable and Y cable tymptrode connections 41
Figure 3.9 : Surface electrode 42
Figure 3.10: Conductive gel 43
Figure 3.11: Prep paste 44
Figure 3.12: Welch Allyne Headlight 45
x

Figure 3.13 : Single channel montage tymptrode 48
Figure 3.14 : Placement of tymptrode : (a) at the posterosuperior part of TM 49
Figure 3.15 : Tymptrode and insert earphone in ear canal 50
Figure 3.16: Connect montage 51
Figure 4.1: Gender distribution of the subject 52
Figure 4.2: Ethnic distribution of the subjects 54
Figure 4.3: Normal Electrocochleography recording graph 60
xi

LIST OF TABLES PAGE
Table 4.1: Age distribution of the subjects 53
Table 4.2: Mean of Summating potential ( SP ) , action potential (AP) and
summating potential / action potential ( SP/AP) values for right ear 55
Table 4.3: Mean of Summating potential ( SP ) , action potential (AP) and
summating potential / action potential ( SP/AP) value of left ear. 56
Table 4.4: p values of action potential (AP), summating Potential (SP) and
Summating potential/action potential (SP/AP ) when right and
left ear was compared using the independent t-test 56
Table 4.5 : 2 way MANOVA outcomes for Summating potential ( SP ),
Action potential ( AP) and ratio of summating potential
/ action potential (SP/AP) with gen and tymptrode placement
as factors. 57
Table 4.6: Tests of univariate effects 58
Table 4.7 Normative data of ECochG for Malaysian adults 59
xii

ABSTRAK
TAJUK KAJIAN : PENENTUAN DATA NORMATIF BAGI UJIAN
ELEKTROKOKLEOGRAFI TIDAK INVASIF DI KALANGAN
DEWASA DI MALAYSIA
Elektrokokleografi merupakan satu ujian respon elektrik otak ( AER) yang digunakan untuk
mengukur fungsi koklea dan saraf auditori melalui rangsangan bunyi yang diberikan.
Objektif
Tujuan kajian ini dijalankan adalah untuk mendapatkan data Elektrokokleografi di kalangan
dewasa normal di Malaysia. Ia juga bertujuan membandingkan bacaan elektrokokleografi yang
terdiri daripada potensi aksi (AP) , potensi penghasiltambahan (SP) dan nisbah potensi
penghasiltambahan kepada potensi aksi (SP/AP) di antara elektrod yang diletakkan di bahagian
atas dan bahagian bawah gegendang telinga. Kajian ini juga bertujuan membandingkan bacaan
elektrokokleografi yang normal di antara subjek lelaki dan perempuan.
Kaedah kajian
Kajian ini merupakan kajian keratan rentas yang dijalankan di Klinik Audiologi, Pusat
Pengajian Sains Perubatan HUSM bermula dari November 2011 sehingga Jun 2012. Seramai
30 orang dewasa yang terdiri daripada kakitangan Hospital Universiti SainsMalaysia , Kubang
Kerian , Kelantan yang berumur 18 hingga 50 tahun telah dipilih melalui teknik persampelan
rawak mudah.
xiii

Subjek dipastikan tidak mempunyai sebarang masalah telinga melalui pemeriksaan telinga
menggunakan otoskop. Seterusnya subjek yang telah dipilih perlu menjalani ujian pendengaran
audiometri nada tulen ( PTA ) untuk memastikan mereka mempunyai tahap pendengaran yang
normal. Subjek yang memenuhi kedua-dua syarat ini akan menandatangani borang keizinan
dan persetujuan untuk mengikuti kajian ini. Elektrod elektrokokleografi jenis timpanik dari
Biologics digunakan dalam kajian ini. Gel akan diletakkan pada hujung elektrod sebelum
dimasukkan ke dalam telinga. Dengan bantuan lampu kepala elektrod diletakkan di bahagian
atas gegendang telinga dan diikuti dengan bahagian bawah gegendang pada waktu yang
berbeza. Pada setiap kedudukan elektrod, rangsangan bunyi berupa bunyi klik jalur lebar pada
kadar 95 dBHL pada kelajuan 7.1/s.
Keputusan
Data keputusan elektrokokleografi antara lelaki dan perempuan telah digabungkan kerana tidak
ada perbezaan yang signifikan di antara kedua-dua kumpulan ini ( p >0.05). Oleh itu purata
nisbah SP/AP ialah 0.31 untuk elektrod timpanik yang diletakkan di bahagian atas gegendang
dan 0.30 untuk elektrod yang diletakkan di bahagian bawah gegendang. Purata bacaan AP pula
ialah 0.72uV dan 0.66uV untuk elektrod yang diletakkan di bahagian atas dan bawah
gegendang masing-masing. Nilai purata SP pula ialah 0.23uV untuk bahagian atas gegendang
dan 0.20uV untuk bahagian bawah gegendang.
xiv

Kesimpulan
Bacaan data normal elektrokokleografi telah didapati daripada kajian ini. Nilai purata AP, SP
dan nisbah SP/AP ialah masing- masing 0.69uV,0.21uV dan 0.31. Tidak ada perbezaan bacaan
elektrokokleografi pada telinga kanan dan kiri di antara dua elektrod timpanik sama ada yang
diletakkan di bahagian atas gegendang telinga atau di bahagian bawahnya dengan nilai p 0.49
( p > 0.05 ). Tidak ada perbezaan juga pada bacaan elektrokokleografi antara perempuan dan
lelaki dengan nilai p 0.96 ( p > 0.05 ).
xv

ABSTRACT
TITTLE : DETERMINATION OF NORMATIVE DATA ON NON INVASIVE
ELECTROCOCHLEOGRAPHY TEST AMONG MALAYSIAN ADULTS
Electrocochleography ( EcochG) is the measurement of an auditory evoked response
(AER ) to assess functional integrity of cochlea and auditory nerve. An AER is a response
from auditory system elicited by an acoustic stimulus.
Objective
The study was conducted with the aim to obtain normative data of Electrocochleography
(EcochG) among Malaysian adults. It is also done to compare EcochG outcomes amplitude
of summating potential (SP), action potential (AP) and SP/AP ratio between two different
placements of EcochG electrode at the upper part of tympanic membrane and lower part of
tympanic membrane and the difference between male and female.
Methodology
This is a cross sectional study conducted at audiology clinic HUSM starting from November
2011 until June 2012. 30 adults who consist of HUSM staffs aged 18 to 50 years old were
chosen using simple random sampling method. Subjects were confirmed to have no
pathological ear by otoscopy and have normal hearing level on pure tone audiometry
(PTA).Tympanic electrode by Biologics was used. The gel is applied at its tip prior to insertion.
xvi

With the help of head light,the electrode is introduced firstly at upper part of tympanic
membrane until subject feels that it touches the membrane with the placement of insert
earphone below the electrode. Broadband alternating clicks 95 dBHL at 7.1/s is given to the
patient and result recorded. After recording of upper placement finished, the electrode is then
placed at lower part of tympanic membrane with the insert earphone above it. Same stimulus
given and result recorded.
Results
EcochG data between males and females are combined because there was no significant
difference between them ( p > 0.05 ). The mean SP/AP ratio is 0.31 for upper TM placement
and 0.30 for lower TM placement. The mean for AP are 0.72uVand 0.66uV for upper TM
and lower TM respectively where as mean SP is 0.23uV for upper TM and 0.20uV for lower
TM.
Conclusion
The normative data for EcochG parameters were obtained. The mean for AP, SP and
SP/AP ratios are 0.69u ,0.21uV and 0.31 respectively. There was no difference in EcochG
reading of right and left ear between two different placements of tymptrode with p value of
0.49 (p > 0.05). There was also no difference in EcochG parameters between male and female
with p value of 0.96 ( p > 0.05 ).
xvii

CHAPTER 1
INTRODUCTION AND LITERATURE REVIEW

1.1 Background of Study
Electrocochleography ( ECochG) is the measurement of an auditory evoked response ( AER )
to assess functional integrity of cochlea and auditory nerve. An AER is a response from
auditory system elicited by an acoustic stimulus. To elicit an AER , sounds such as clicks and
tones of varying intensities are played through an acoustic transducer. Auditory system activity
in response to acoustic stimulus can be measured at several specific sites on head with
electrodes. The cochlear potential of interest in clinical EcochG are auditory nerve compound
action potential ( AP ), cochlear microphonic (CM ) and summating potentials ( SP).
ECochG began to be a useful clinical tool nearly 40 years following the discovery of CM in
animals by Wever and Bray in cats ( Lempert et al.,1950). Wever and Bray mistakenly
concluded that this recording was generated by auditory nerve and named their discovery
“ Wever –Bray effect’’. However the wave was concluded to be cochlear in origin and not from
the auditory nerve by Hallowell Davis from Harvard (Moore ,1983). Fromm et al.(1935) were
the first investigators to employ the ECochG technique in humans by inserting a wire electrode
through tympanic membrane and recording the CM from niche of round window. Later Fisch
and Ruben (1960 ) provided evidence of round window recordings of compound action
potentials ( AP) from both round window and eight cranial nerve in cats and mice. Ruben was
the first person to use CM and AP clinically. Since ECochG was used by Ruben et al. in 1961
to monitor cochlear and acoustic nerve action potentials intraoperatively during otosclerosis
surgery , many studies have been made of cochlear evoked potentials and their relationship in
inner ear fuction ( Ruben et al., 1960).
1

Summating potentials ( SP ), a stimulus related hair cell potential was first described by
Tasaki and colleagues in 1954( Tasaki et al., 1954). It took more than 25 years before this
component began to receive any meaningful clinical attention where Moffat et al. (1978)
demonstrated in 1978 the significance of summating potential in the pathodynamics of
endolymphatic hydrops and thus opened new possibilities for objective studies of inner ear
disorders using ECochG. Dr Ernest J.Moore ( Moore , 1971 ) was the first investigator to record
the CM from surface electrode. In 1971 , Dr Moore conducted 5 experiments where he
recorded CM and AP from 38 human subjects using surface electrodes.
Renewed and increased attention to all auditory evoked potentials (AEPs) in early 1970s was
due to the discovery and clinical application of auditory brain response (ABR). The
development and refinement of noninvasive recording techniques also facilitated clinical
application of AEPs including ECochG. The technical capability to record cochlear and
auditory nerve potentials in humans has brought to a variety of clinical applications for
ECochG. The usage of ECochG in diagnosis, assessment and monitoring of Menierre’s disease
is of primary importance in addition to its usage in the diagnosis of auditory neuropathy and
for the enhancement of wave I ABR.
Knowing the importance of ECochG especially in diagnosing Menierre’s disease, we are
conducting this study in order to get the normal values for the parameters involved in ECochG
among normal Malaysian adult since no similar study was done before in this country. These
normal values will be able to be the reference reading in comparing with the abnormal ones.
Thus it will enable us to diagnose certain disease like Menierre’s and auditory neuropathy.
2

1.2 Anatomy and Physiology of ear
To conduct the ECochG test, it is very important to understand the anatomy and physiology
of the ear. The ear is divided into 3 parts namely external ear, middle ear and inner ear. ECochg
electrode placements may involve external ear, or inner ear depending on type of electrode
which will be explained in detail .
The external ear consist of auricle , external auditory canal (EAC) and tympanic membrane
(TM). The EAC measures 25 mm from TM annulus to anterior lip of concha with diameter of
7 mm. The lateral one third of EAC comprises of cartilage , runs posterior superiorly . It is
lined with hair and cerumen glands.The medial two third is bony meatus of temporal bone.
EAC has two constrictions that are at the junction of lateral one third and medial two third. The
second one is located 5mm lateral to TM.
Figure 1.1: Parts of the ear.
3
External ear
Middle
ear
Inner ear

A study done by Resmus et al. (2002) showed a highly significant difference in size between
males and females external auditory canal ( p = 0.0003 ) .
Tympanic membrane is a thin fibrous structure covered externally with layer of stratified
squamous epithelium and internally low columnar epithelium. Fibrous tissue (lamina propria)
which provide structure for TM is in between these layers. Most of its circumference is
thickened to form fibrous cartilaginous ring called tympanic annulus.TM is the most medial of
EAC. It measures about 10mm in diameter and approximately 85 mm2 in surface area. It slant,
making 55° angle to the floor. The TM is divided into pars tensa dan pars flacida. TM can be
divided into 4 quadrants by a line drawn across the diameter of ear drum in the axis of handle
of malleus and another intersecting the first at right angles at the umbo. The 4 quadrants are
anterosuperior, anteroinferior , posterosuperior and posteroinferior quadrant.
Figure 1.2 : The four quadrant of Tympanic membrane
4
anterosuperior
anteroinferior
posterosuperior
posteroinferior

The sound stimulus from extratympanic and tympanic ECochG electrode must pass through
the middle ear structures in order to reach the cochlea. Middle ear can be likened to a six sided
box with a roof, floor, medial, lateral, anterior and posterior wall. The vertical (distance
from floor to roof ) and anteroposterior diameter of cavity are each about 15 mm. The
transverse diameter measures about 6 mm above and 4 mm below, opposite the centre of TM
( between umbo and middle ear mucosa at level of promontory ) is only 2 mm as
illustrated by figure below.
Figure 1.3 : The middle ear cavity
The ECochG electrode can also be fixed in the inner ear either at round window or promontory
(Fig 1.3). Another structure of interest is the cochlea. The bony cochlea is a coiled tube making
2.5 to 2.75 turns round a central pyramid of bone called the modiolus.The promontory is the
bony bulge due to basal coil of cochlear forming one of the structure in the medial wall of
5
promontory
6 mm
2 mm
4 mm

tympanic cavity. The bony cochlea contains 3 compartments that are scala vestibule, scala
tympani and scala media or membranous cochlea. Membranous cochlea is a blind coiled tube
formed by the basilar membrane which support organ of corti, the Reissner’s membrane which
separate it from scala vestibule and stria vascularis. The organ of Corti is a band like structure
situated on the basilar membrane and contains auditory sensory cells which are called inner
hair cell and outer hair cells ( Figure 1. 4).
Figure 1.4 : Organ of corti
In cochlear physiology, basilar membrane ( BM ) and hair cells function as a sharply tuned
frequency analyzing mechanism ( Kohlloffalcue ,1972). Once acoustic energy reaches
tympanic membrane , it is converted into mechanical energy and carried on to inner ear through
middle ear bones. As the stapes pushes the oval window , pressure wave in perilymph inside
cochlea causes the BM to vibrate. Place of maximum vibration amplitude depends on sound
frequency. The area of maximum displacement in the BM will cause the hair cells and
supporting structure to move. During the upward displacement of BM and hair cells, the
stereocillia and kinocillia of hair cells move against the tectorial membrane. Bending of
stereocillia towards the modiolus will cause the mechanically gated ion channels to open
6

allowing potassium and calcium ion to enter. An alternating current ( AC ) flows through the
hair bearing surface and this increase in the flow or decrease in the resistance has the same
frequency as BM movement and hence the acoustic stimulus frequency. This AC voltage is
called cochlear microphonics ( CM ), which mimics the stimulus. The hair cells function as a
tranducer, converting the mechanical movement of BM into electrical voltage. Adenosine tri-
phosphate ( ATP ) from the stria vascularis provides the energy for conversion. This potential
derived from the CM initiate chemical processes in hair cells that lead to the release of
neurotransmitter in the synaptic cleft between the hair cells and spiral ganglion neurons. The
neurotransmitters rapidly diffuse and combine with the receptor cells in their specific locations.
This results in a built up of postsynaptic potential or generator potential in the unmyelinated
nerve endings. When a certain threshold value is reached, generator potential depolarizes the
first neuron. The axon stimulation by depolarization results in AP. SP as the stimulus – related
potential of cochlear is the direct current (DC) response of the hair cells as they move in
conjunction with BM.
7

1.3 Electrocochleogram components
As stated earlier , the cochlear microphonic ( CM ), compound action potential (AP) and
summating potential (SP) are the 3 components of interest in cochlear potential to be studied
in ECochG.
1.3.1 Cochlea microphonic
CM which is an alternating current ( AC ) electrical potential present throughout whole
duration of acoustic stimulus which is predominantly generated by outer hair cells of cochlear
(Patuzzi,Yates ,Jonston ,1989). This voltage reflects the instantaneous displacement of basilar
membrane along some distance within the cochlea ( Ferraro and Durrant, 2002).This distance
is defined by effective site and method of recording and conditions of stimulus. As reflected
by CM, organ of Corti acts as a microphone, but the transducers are numerous as each hair cell
produce a receptor potential that is substantially AC. The historical popularity of CM in
laboratory derives from its link to cochlear transduction, from well demonstrated sensitivity to
the health of cochlear partition and certainly because it can be recorded from within or near the
cochlea. This latter factor is facilitated by the CM’s considerable magnitude compared to other
electrical phenomena associated with the auditory periphery. However the utility of CM in
differential diagnosis of inner ear versus auditory nerve disorder has yet to be establish. Even
though reductions in CM magnitude have been reported for various disorders such as
Menierre’s disease or endolymphatic hydrops (Gibson and Beagley, 1976), these features tend
to reflect general rather than specific cochlear pathology.
8

Furthermore examination of CM with confidence that recording represents the true potential
remains challenging in clinical setting. Since CM mimics the waveform of the evoking signal,
it is difficult to separate from stimulus artifact, therefore its measurement has been considered
less suitable for clinical ECochG.
1.3.2 Summating potential
Summating potential ( SP ) is another observable part of ECochG waveform which is least
understood cochlear potential. The SP is a complex response comprising several components.
Like the CM, the SP is also stimulus related but generated by inner hair cells of cochlea
( Ferraro, 2002, Hall, 2007 ). It is a reflection of the displacement time pattern of cochlear
partition. As CM mirrors the stimulus waveform, the SP displays a rectified, direct current
(DC ) version of this pattern more representative of stimulus envelope ( Ferraro ,2002, Hall,
2007 ). The SP appears as a unidirectional shift in the CM baseline, the polarity of which is
dictated by an interactive effect between stimulus parameters ( ie frequency and intensity ) and
the location of recording electrode. When recorded from tympanic membrane (TM ) or ear
canal electrode, the SP is often seen as a downward ( negative ) deflection persisting for the
duration of acoustic stimulus.
Because of its complexity, the role of SP in hearing function remains unclear. As DC responses
to AC stimuli, however at least some of its components are thought to represent nonlinearities
associated with the transduction processes in cochlea (Tasaki et al., 1954, Whitfield and Ross,
1965, Gallic et al., 1985, Ruth, 1994). By definition, rectification ( ie AC to DC conversion )
9

is a nonlinear process but whether or not the SP actually reflected intracellular receptor
potentials was uncertain for a period of time following its discovery. However , SP like
potentials have since been observed inside hair cells and it is now clear and that the SP is not
an epiphenomenon (Dallos , 1973). It is also has long been known that the SP is also sensitive
to mechanical and electrical biasing ( Durrant and Gans ,1977). The nonlinear nature of SP has
made it useful for monitoring certain clinical conditions such as Menierre’s disease (MD)or
endolymphatic hydrops ( ELH) which may augment nonlinearitis in the transduction process
where SPs displayed are enlarged in comparison to SPs of normally hearing subjects or patients
with cochlear disorder other than MD/ELH. Conventional rationale for this finding is that an
increase in endolymph volume creates mechanical biasing of vibration of organ of Corti to
which again SP is sensitive. Whether this increased distortion is mechanical and /or electrical
has not been resolved (Durrant and Gans, 1977). Other factors such as biochemical or vascular
changes may also be responsible for enlarged SP in MD/ELH. Regardless of the specific
pathophysiology, measurement of the SP to help diagnose, assess and monitor MD/ELH has
emerged as a primary application for modern day ECochG
1.3.3 Action potential
Action potential is another component recorded via EcochG which represent the summed
response of numerous, at times thousands of auditory nerve fibres firing synchronously. It is
produced by fibres within the distal portion of auditory nerve (Hall, 2007). AP is usually larger
than SP with latency of approximately 1.5 ms (Hall, 2007) When evoked by click stimuli the
10

term “ whole nerve AP ‘’ is applied since theoretically the click has a nearly flat spectrum
over the frequency range of interest and thus vibrate essentially the entire basilar membrane.
As recorded clinically however and regardless of stimulus , the AP is clearly a compound action
potential where the response of a population of neurons rather than a single unit. A stimulus
with a narrower bandwith such as toneburst excites a more limited segment of the membrane
and consequently a more restricted population of nerve fibres. More important is the fact that
these very different stimuli clicks and toneburst fail to achieve their respective objectives. That
is the spectrum of clicks that actually reaches the cochlea generally is far from flat due to
combined earphone, ear canal and middle ear response characteristics. Likewise the cochlear
response to toneburst is far from discrete due to their spectra and limited cochlear resolution.
Thus clicks do not excite ‘whole ‘ nerve and even tonebursts excite several points of vibration
along basilar membrane.
A high degree of synchrony of neural firing is essential to producing a well-defined AP, which
accounts for the popularity of click and brief –onset toneburst as evoking stimuli. In either
case the response to moderately intense stimulation ( ie 70dB nHL or more ) tends to be
dominated by neural contributions from basal or high-frequency end of the cochlea, at
least in normal ears and pathological ears with no worse than moderate hearing lost
( Kiang ,1965). Since the velocity of the travelling wave is the highest in this region, phase
shifts caused by cochlear mechanics are minimal. The AP , like CM is an AC voltage. Unlike
either of cochlear potentials whose waveforms reflect the displacement-time pattern of cochlear
partition ( ie CM and SP ), the AP waveform is characterized by a series of brief, predominantly
negative peaks of representative of the distribution of underlying neural firings. At
suprathreshold stimulus levels, the first and largest of these peaks is referred to as N1, which
11

is the same component as wave 1 of the ABR and as such arises from distal portion of
the auditory nerve (Moller and Janette, 1983).. AP peaks beyond N1 ( such as N2 and N3 ) are
analogous to corresponding ABR component ( ie waves II and III ) but have received little if
any clinical attention in ECochG.
For clinical purposes, AP magnitude and latency appear to be the most useful features. The
former is a reflection of the number of nerve fibres firing. Since the afferent fibres of auditory
nerve primarily innervate the inner hair cells, AP magnitude also can be viewed as a reflection
of inner hair cell output. AP latency which is analogous to the ‘absolute latency’ for ABR
components, represent the time between stimulus onset and peak of N1. This value incorporates
stimulus travel time from the output of the transducer to the inner ear, travelling wave
propagation time along the basilar membrane and time consumed activating synaptic
transmission between hair cells and first order neurons. As with all waves of the ABR,
reductions in signal intensity at suprathreshold levels for the AP are accompanied by absolute
latency prolongations and reductions in N1 magnitude leading to eventual disappearance into
the electrical noise floor. Since its initial recording in humans in 1960, the AP has been the
most widely studied product of EcochG.
12

1.4 Electrocochleography recording approaches
There are four approaches to ECochG recording depending on the position of ECochG
electrode (Bonucci and Hyppolito ,2009) . First approach is intratympanic (IT ) when the
electrode is placed in round window ( usually during surgery ).Second approach is
transtympanic (TT) where the active electrode is placed in promontory closed to round
window. Third type is by tympanic membrane (TM) when the electrode is placed close to
tympanic membrane in posteroinferior quadrant and the last approach is extratympanic (ET)
when the electrode is placed in the external auditory meatus. The IT and TT ECochG method
are invasive procedure. TT approaches to ECochG were introduced in late 1960s and are still
used widely in countries other than United States (Yoshie et al., 1967).The main advantage of
this recording technique is the close proximity of recording needle electrode to the cochlea
which enables large ECochG response waveform to be obtained with a minimal signal
averaging required(Ferraro and Durrant, 2002). However there are several limitations to this
method. As an invasive technique it requires a physician to place the recording needle
electrode. This can restrict the test to medical settings and consequently make it an expensive
test to perform. In addition , even with the local anaesthesia, the penetration of a needle through
tympanic membrane can be a painful experience for patient (,Bullen and Arerberg, 1990,
Ferraro and Durrant, 2002).
ET and TM ECochG method are less invasive, performed with an electrode resting against the
skin of ear canal or surface of tympanic membrane (Bullen and Arerberg, 1990, Ferraro and
Durrant, 2002). Pioneering work in ET recordings was performed by Sohmer and Feinmesser
(1967), Coats and Dickey (1970) and Cullen et al. (1972), among others.
13

By comparison, ECochG responses recorded from ET and TM sites require more signal
averaging and tend to yield smaller component magnitudes than TT or IT recordings. However
the biggest advantage of ET and TM approaches is that they can be performed in nonmedical
setting with minimal discomfort which is more tolerable to patient, obviating the need for
sedation and local anesthesia as well as not necessarily be performed by a physician. Another
factor that facilitated the use of ET or TM ECochG relates to the advances in electrode design
and the practice of using the TM as a recording site. The TM offers a good and practical
compromise between ear canal and TT or IT placement with respect to component magnitudes
and consequently signal averaging time ( Ruth and Lempert, 1989). Perhaps most importantly
for clinical purpose is the waveform patterns that lead to interpretation of the TT and IT
electrocochleogram tend to be preserved in TM recordings ( Ferraro, Thediger et al,. 1994)
even though IT and TT ECochG produces response amplitudes that are 5 to 10 times greater
than those obtained with tympanic electrode while response obtained with extratympanic
ECochG diminish rapidly with increasing electrode distance from tympanic membrane ( Coats
,1986 ). Ferraro and Ferguson (1989 ) also showed that ECochg components recorded from
TM displayed magnitudes that were at least twice as large as corresponding measurement made
from ear canal ( Ferraro and Furgeson ,1989). When performed correctly , TM ECochG should
cause minimal- to-no discomfort to the patient.
There were many studies on improving the recording approach and comparing between these
technique of recordings. Federico and Serena (2009) had presented an alternative technique
by introducing a conducting liquid inserted into the ear canal to act as a distributed electrical
interface between TM and external electrode. The concept proposed relies on a recording
14

electrode able to work without any direct contact with sensitive TM. As a conducting liquid, a
water based saline solution can be used. Its high conductivity allows a continuous and stable
electrical connection with TM and not necessarily to insert the electrode deeply into the ear
canal.
Bonucci and Hyppolito (2009) on the other hand compared the use of TM electrode and ET
electrode. Their study group consisted of 23 individuals with normal hearing with none of them
had history of auditory or vestibular disease or metabolic changes. Threshold tonal audiometry
and impedanciometry were performed to confirm the normality of audiometry thresholds.
Recording started with TM electrode first placed close to the posteroinferior quadrant of TM.
Immediately after the end of evaluation with TM electrode and its removal, ET electrode was
placed in the external auditory meatus. The results showed no significant difference between
ET and TM electrode with a mean SP/AP ratio of 0.30 and 0.32 were obtained respectively.
They concluded that both electrodes were effective for EcochG evaluation but extratympanic
one was easier to insert and did not cause discomfort. The TM electrode produce tracings of
greater amplitude and of better reproducibility.
Another study done by Noguchi et al. in 1999 comparing tympanic versus transtympanic
recording in electrocochleography. In their study 15 subject were evaluated from which 9
volunteers with normal hearing and 6 patients with sensorineural hearing loss. The TM
electrode was placed at the posterior inferior quadrant of tympanic membrane while the TT
EcochG was fixed on the promontory near round window niche.In this study, TM and TT
EcochG yielded nearly identical detection threshold, input-output curves and waveforms for
both CM and AP measurements.
15

Figure 1.5 : Tonebursts SPs at several frequencies recorded from both TM and TT
( promontory ) of same patient. Although magnitudes of TM response are approximately
¼ that of promontory response ( note the amplitude scale), the corresponding pattern of
the TM and TT recordings at each frequency are virtually identical ( Ferraro 2003 ).
16

1.5 Electrocochleogram recording parameters
Selection of recording parameters for ECochG varies according to the components of interest.
Since these components generally occur within a latency epoch of 5 msec following stimulus
onset, they can be considered to be in family of early-latency or short latency AEPs. As
members of same family, ECochG components and ABR can be recorded using similar
parameters. A notable exception occurs in the selection of the bandpass of the preamplifier for
ECochG when SP is of interest that is the filter setting must be wide enough to accommodate
both a quasi-steady- state DC component ( the SP ) and an AC component with a fundamental
frequency of approximately 1 kHz ( the AP ). Other difference involve the electrode array and
the number of samples to be averaged.
1.5.1. Electrode array
For an electrode array displays the AP as downward ( negative ) deflection, primary electrode
(i.e. the electrode connected to the positive or noninverting input of the differential
preamplifier) should rest on the TM. Sites for secondary ( negative or inverting ) electrode
include the vertex of the scalp, high forehead, contralateral earlobe or mastoid process. The
nasion, ipsilateral earlobe or ipsilateral mastoid may serve as sites for the electrode connected
to ‘common’ or ‘ground’ input to the preamplifier. If AP is preferred to be displayed as an
upward deflection, simply reversed the positive and negative inputs to the preamplifier.
17

1.5.2 Timebase
As indicated above, ECochG components generally occur within first few milliseconds after
stimulus onset. For brief transient stimuli ( such as clicks) we use a timebase ( or signal
averaging window ) of 10 msec which also allows for visualization of ABR components that
follow N1. For longer duration stimuli ( such as tonebursts) , timebase should extend beyond
duration of the stimulus envelope so that the entire response is observable within the averaging
window.
1.5.3. Amplification factor
Amplification factor is selected to maximize the signal-to –noise ratio for a given recording
condition. The amount needed for suitable recordings of the SP and/or AP for ET
measurements generally ranges between 20000 and 100000 times , where as the factor for TT
recordings can be much lower ( by 5 to 10 times). The sensitivity setting of the computer’s
analog-to-digital converter also must be taken into account. The goal is to amplify enough to
extract a good ( and real ) response without triggering the artifact rejection routine inordinately
throughout the recording.
18

1.5.4. Analog Filter Setting
SP as fundamentally a DC potential could last as long as the stimulus of any duration. Ideally
a DC recording amplifier is needed to record this component. However particularly for the
amount of gain needed, such amplifiers are notoriously unstable for electrophysiological
recordings. Fortunately the SP as evoked for practical or clinical purposes is only quasi – steady
– state,permitting the use of AC coupled amplifier typically found in commercially
manufactured AEP units. The low pass ( or high frequencies cut off ) setting of filter should be
set to allow transmission of AC components of interest. Filter setting for CM recordings would
depend on the frequencies of evoking stimuli.
1.5.5 Repetitions
Number of individual responses to extract a well defined electrocochleogram from background
noise varies with recording conditions or approach and also the subject’s degree of hearing
loss. TT recordings require fewer repetitions than ET approaches while more repetitions may
be necessary for subjects with hearing loss than normal subjects.
19

1.5.6. Stimuli
As mentioned earlier, the broadband click (BBC) is a popular stimulus for short latency
auditory evoked potentials (AEPs) because it excites synchronous discharges from a large
population of neurons to produce well-defined peaks in the response.100msec is a popular
choice for the duration of the electrical pulse driving the transducer because the first spectral
null for a click of this duration occurs at 10000 Hz ( i.e 1/100 msec ). Since the duration of
both the CM and SP are stimulus dependent, the brevity of the click makes it a less than ideal
stimulus for studying either of these potentials. Despite this limitation, the use of clicks has
proven effective in evoking the SP-AP complex for ECochG applications related to MD/ELH.
Although the click continues to remain popular, toneburst stimuli also have been used in several
ECochG studies involving MD/ELH populations ( Levine et al.,1992). Tone burst provide a
higher degree of response frequency-specificity than clicks which can be useful for monitoring
cochlear status in progressive disorders where hearing may not be affected at all frequencies.
In addition, the use of longer stimuli allows for better visualization of SP and CM ( Durrant
and Ferraro, 1991).
Stimulus polarity depends on the initial deflection of the transducer diaphragm and an
important factor for ECochG. Presenting clicks or tonebursts in alternating polarity inhibits
presence of stimulus artifact and CM as their phases are locked to the signal. Stimulus artifact
can sometimes be large enough to obscure early ECochG components , and CM generally
20
overshadows both SP and AP features that are problematic when these latter two components
potentials are component of interest. Alternating stimulus polarity can be applied to help
overcome this problem. Stimulus artifact is indeed quite large for ECochG. The nature of ET
and TM electrodes is that they tend to have high impedence and are vulnerable to radiation
from transducer and other electrical sources in the environment.
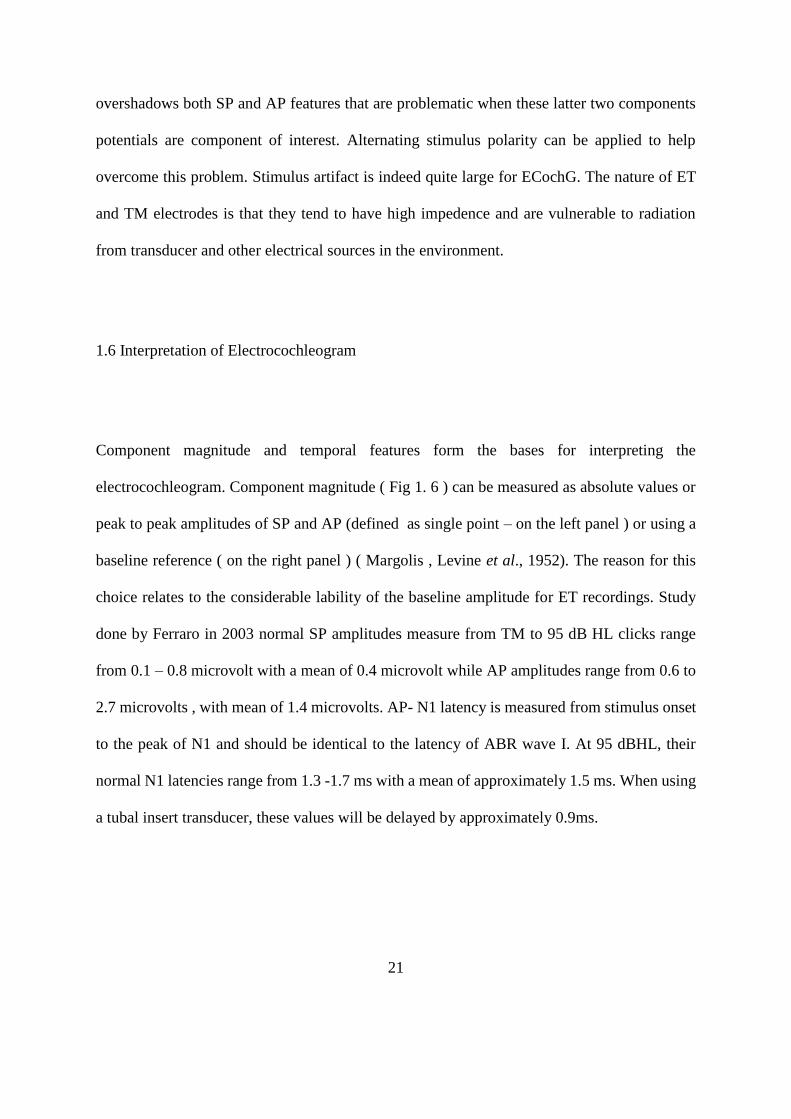
1.6 Interpretation of Electrocochleogram
Component magnitude and temporal features form the bases for interpreting the
electrocochleogram. Component magnitude ( Fig 1. 6 ) can be measured as absolute values or
peak to peak amplitudes of SP and AP (defined as single point – on the left panel ) or using a
baseline reference ( on the right panel ) ( Margolis , Levine et al., 1952). The reason for this
choice relates to the considerable lability of the baseline amplitude for ET recordings. Study
done by Ferraro in 2003 normal SP amplitudes measure from TM to 95 dB HL clicks range
from 0.1 – 0.8 microvolt with a mean of 0.4 microvolt while AP amplitudes range from 0.6 to
2.7 microvolts , with mean of 1.4 microvolts. AP- N1 latency is measured from stimulus onset
to the peak of N1 and should be identical to the latency of ABR wave I. At 95 dBHL, their
normal N1 latencies range from 1.3 -1.7 ms with a mean of approximately 1.5 ms. When using
a tubal insert transducer, these values will be delayed by approximately 0.9ms.
21

Figure 1.6 : Normal electrocochleogram from tympanic membrane to clicks presented in
alternating polarity at 80 dBHL. The amplitude of summating potential (SP) and action
potential (AP) can be measured from peak to trough ( left panel ) or with reference to a baseline
value ( right panel). Amplitude /time scale is 1.25 microvolts / 1 milisecond per gradiation.
Insert phone delay is 0.90 ms ( Ferraro, 2003).
Also as shown in Figure 1.6, SP and AP amplitudes are made from leading edge of both
components. The resultant values are used to derive the SP/AP amplitude ratio. Their mean
SP/AP amplitude ratio to click stimuli for normal subjects approximately 0.25 +/- 0.10 SD.
22

1.7 Electrocochleogram applications
1.7.1 .Evaluation of menierre’s disease / endolymphatic hydrops
ECochG has emerged as one of the more powerful tools in diagnosis, assessment and
monitoring of MD/ELH, primarily through the measurement of SP and AP. In particular it is
now well documented that the electrocochleograms of patient with MD/ELH often display
abnormally enlarged SP magnitude( Ferraro et al., 1983,Ferraro and Krishnan, 2002). The
conventional rationale for this finding is that an increase in endolymph volume creates
mechanical biasing of vibration of organ of Corti to which SP is sensitive. Whether the nature
of this increased distortion is mechanical or /and electrical has not been resolved. Other factors
such as biochemical or vascular changes may also be responsible ( Staller, 1986). An enlarged
SP/AP magnitude ratio to click stimuli should be considered a positive finding for ELH.
Although the specificity of ECochG in the diagnosis of MD/ELH has been reported to be higher
than 90% ( Ferraro et al., 1983, Murphy et al., 1997), the incidence of an enlarged SP and
SP/AP magnitude ratio in the general Menierre’s population is only approximately 55% - 65%
( Margolis ,1995, Ferraro and Tibrik, 1999). The episodic nature of MD/ELH certainly play a
role in the sensitivity of any diagnostic tool used for this disorder. Sensitivity is expected to
vary according to when the test was administered in the course of disease. EcochG is more
sensitive to test the patient when they are experiencing symptoms. Other approaches to
increasing the sensitivity of ECochG include measuring the AP-N1 latency difference between
responses to condensation versus rarefaction clicks. According to Margolis , Rieks et
al. (1995) , a difference greater than 0.38 ms is a positive finding for endolymphatic hydrops.
23

1.7 .2. Auditory neuropathy
Auditory neuropathy (AN) is classified by normal cochlear mechanical function, shown by
present otoacoustic emissions (OAE ) and/or cochlea microphonic waveforms, but absent or
severely disrupted synchronous neural activity, observed as an absent or grossly abnormal
auditory brainstem response (ABR) waveform ( Starr ,1996). A consequence of this broad
classification is that AN may encompass multiple sites of lesion, including disruption to inner
hair cells, the primary afferent synapse,or the auditory brainstem (Starr ,1996, Rance , 2005).
Therefore, more accurate classification of AN into specific sites of lesion is needed. Scalp
recording techniques, typically used for ABR measurements, have shown variable amounts of
cochlear activity.
However, round-window electrocochleography provides a higher-quality recording of basally
located hair cell and dendritic currents, which are in closer proximity to the recording electrode,
this is important in the differential diagnosis of cochlear disruptions, such as AN, where the
generation of action potentials relies on a cascade of events that is, vibration of the basilar
membrane,which is enhanced by outer hair cell (OHC) activity, causes depolarisation of inner
hair cells (IHCs), which leads to transmitter release and the generation of excitatory
postsynaptic currents, ultimately initiating action potentials. The extracellular potentials that
are generated by these events, and can be measured from the round window, include the
cochlear microphonic (CM), the summating potential (SP), the dendritic potential (DP), and
24


![Ventriculoperitoneal Shunt as Treatment for Perilymphatic ...€¦ · [5,7]. This procedure led to 6 months of vertigo-free living. Then symptoms gradually returned. In July 1999,](https://static.fdocuments.us/doc/165x107/6080c750910d2c65264f8a90/ventriculoperitoneal-shunt-as-treatment-for-perilymphatic-57-this-procedure.jpg)


