Determination of internal shear strength parameters of ...
7
Determination of internal shear strength parameters of geocomposite clay liners Kovačević Zelić, Biljana; Kovačić, Davorin; Znidarčić, Dobroslav Source / Izvornik: Geologica Carpathica, 2002, 53, 127 - 132 Journal article, Published version Rad u časopisu, Objavljena verzija rada (izdavačev PDF) Permanent link / Trajna poveznica: https://urn.nsk.hr/urn:nbn:hr:169:920211 Rights / Prava: Attribution-NonCommercial-NoDerivatives 4.0 International Download date / Datum preuzimanja: 2022-02-16 Repository / Repozitorij: Faculty of Mining, Geology and Petroleum Engineering Repository, University of Zagreb
Transcript of Determination of internal shear strength parameters of ...
Determination of internal shear strength parametersof geocomposite clay liners
Kovačević Zelić, Biljana; Kovačić, Davorin; Znidarčić, Dobroslav
Source / Izvornik: Geologica Carpathica, 2002, 53, 127 - 132
Journal article, Published versionRad u časopisu, Objavljena verzija rada (izdavačev PDF)
Permanent link / Trajna poveznica: https://urn.nsk.hr/urn:nbn:hr:169:920211
Rights / Prava: Attribution-NonCommercial-NoDerivatives 4.0 International
Download date / Datum preuzimanja: 2022-02-16
Repository / Repozitorij:
Faculty of Mining, Geology and Petroleum Engineering Repository, University of Zagreb

GEOLOGICA CARPATHICA, 53, 2, BRATISLAVA, APRIL 2002127—132
DETERMINATION OF INTERNAL SHEAR STRENGTH PARAMETERSOF GEOCOMPOSITE CLAY LINERS
BILJANA KOVAČEVIĆ ZELIĆ1, DAVORIN KOVAČIĆ2 and DOBROSLAV ZNIDARČIĆ3
1University of Zagreb, Faculty of Mining, Geology and Petroleum Engineering,Pierottijeva 6, Zagreb, Croatia; [email protected]
2BBR-CONEX, Kalinovica 3, Zagreb, Croatia; [email protected] of Colorado at Boulder, Department of Civil, Environmental, and Architectural
Engineering, Boulder, USA; [email protected]
(Manuscript received October 4, 2001; accepted in revised form December 13, 2001)
Abstract: Geocomposite clay liners (GCLs) are used in environmental, transportation and geotechnical engineeringapplications. Determination of the internal and interface shear strength parameters of GCLs has a huge importance forstability analyses. Therefore, the study of the internal shear strength of one type of nonreinforced GCLs was performed.Laboratory testing programme consisted of five series of direct shear tests. Special attention was given to the influenceof the specimen hydration procedure and horizontal displacement rate on the shear test results. The analysis of the directshear tests, presented in the paper, clearly demonstrate that the measured values of internal shear strength depend on theway of performing the laboratory tests. The internal shear strength envelopes for nonreinforced GCLs are proposed onthe basis of obtained results.
Key words: landfills, bentonite, geocomposite clay liners (GCLs), internal shear strength, direct shear test, nonreinforcedGCLs.
Introduction
Geocomposite clay liners represent one type of the geosyn-thetics that have been used more frequently since the 70’s. Ac-cording to ASTM a geosynthetic is “a planar product manu-factured from polymeric material used with soil, rock, earth,or other geotechnical engineering related material as an inte-gral part of a man-made project, structure, or system”. Koern-er (2000) gives a broad overview of the various possibilitiesfor their engineering application.
Geocomposite clay liners (IGS 2000) or geosynthetic clayliners (ASTM 1997) are manufactured hydraulic barriers con-taining a layer of high-quality sodium bentonite clay attachedor adhered to geotextiles or a geomembrane. Numerous com-mercially manufactured products of GCLs are available on theworldwide market. They are used in environmental, transpor-tation and geotechnical engineering applications. In environ-mental applications GCLs act as a hydraulic barrier compo-nent on waste disposal sites as a part of the liner and coversystems. Because of their low permeability they serve very of-ten as a replacement for low permeability soil or clay liners. Incomparison with classical clay liners they provide many ad-vantages, including a greater resistance to differential settle-ments, desiccation, and freeze-thaw deterioration. They alsohave self-healing characteristics due to their swelling poten-tial. It is also important that their installation is simple, easyand less time-consuming.
From the engineering design point of view, stability analy-ses of the hydraulic barriers at waste disposal sites are one ofthe most important issues. Therefore, proper determination ofthe shear strength parameters of all the barrier componentsplays a major role in the design process. Internal shear strengthparameters of GCLs are generally obtained from laboratory di-
rect shear tests, but the amount of the published data is limited.The principal issues for internal shear strength testing of GCLsare: test configuration, gripping technology, specimen size, de-gree of hydration and hydration liquid, normal stress range,and shear strain rate. It was found, by reviewing the publisheddata, that there is a significant variability of the test proceduresused and the results obtained. Therefore, a study of the internalshear strength of one type of nonreinforced GCL was per-formed. Special attention was given to the determination of theinfluence of two parameters: specimen hydration procedureand shear strain rate. The laboratory testing program wasplanned accordingly and consisted of five series of direct sheartests. Two procedures of specimen hydration and four differentshear strain rates were investigated in the program.
The peak and residual shear strength envelopes were deter-mined on the basis of test results. Influence of the hydrationprocedure and shear strain rate is clearly shown. The appropri-ate laboratory testing procedure is proposed for the determina-tion of internal shear strength of GCLs. With this procedurethe two most relevant parameters are included in the testingprograms.
Internal shear strength testing of GCLs
Samples
There are a wide variety of commercially manufacturedproducts of GCLs on the market. From the shear strength pointof view, they are divided into two main groups: reinforced andnonreinforced GCLs. In our investigation, one of the very fewnonreinforced GCLs known under commercial name Claymax200R (CETCO, USA) is used. It consists of approximately
MECC ‘01

128 KOVAČEVIĆ ZELIĆ, KOVAČIĆ and ZNIDARČIĆ
5.0 kg/m2 of adhesive bonded natural sodium bentonite sand-wiched between two lightweight woven geotextiles. A cross-section sketch of the nonreinforced GCL is shown in the Fig.1. In the other type of GCLs called reinforced GCLs, geotex-tiles are held together, for example, by stitch bonding or nee-dlepunching. The physical bonding of the geotextiles enhancesthe internal resistance of GCLs to shearing.
Several reasons influenced the decision to test one type ofnonreinforced GCL in our investigation. It was our opinionthat in order to understand the shearing behaviour of GCLs, itwas necessary to investigate in detail the behaviour of bento-nite itself. In the case of reinforced GCLs, their behaviour indirect shear test is influenced by the presence of syntheticyarns. Moreover, previous investigations (Gilbert et al. 1996)prove that reinforced GCLs have larger peak strengths, but theresidual strength is the same as for nonreinforced ones. Final-ly, the specimen size is not a critical parameter in testing thenonreinforced GCLs, as is the case for reinforced ones. In thecase of reinforced GCLs large specimens are necessary. Largesamples are not practical for standard tests in common geo-technical laboratories. Some investigators show that there isalso a problem of partial hydration of specimens that leads toinaccurate results in shear (Gilbert et al. 1997).
GCLs are geocomposites consisting of geological material(predominantly sodium bentonite) and synthetic materials(geotextiles, geomembranes). Bentonite is a key componentbecause its function is to maintain low hydraulic permeability.Therefore, it will be presented in some details.
Bentonite is a naturally occurring clay that is extremely hy-drophilic (water attracting). In contact with water or even wa-ter vapour bentonite attracts the water forming a complex con-figuration that leaves little free-water space in the voids. Thisfact explains the resulting low permeability of most GCLs, themost important property of barrier layers.
Bentonites, which are used for the production of GCLs, con-sist mainly of three-layer mineral montmorillonite of thesmectite group. Other ingredients like quartz, christoballite,feldspars, muscovite/illite, and other clay and nonclay miner-als are not important for the functionality in waste contain-ment applications (Egloffstein 1997). Because of the high con-tent of montmorillonite (60—90 %), bentonites have desirableproperties like swelling, high ion exchange capacity, adsorp-tion capacity against heavy metals and very low permeability.
Most of the commercially available GCLs use sodium ben-tonites. Calcium bentonites are rarely used because of lowerswelling potential and higher permeability. The water adsorp-tion capacity of sodium bentonites is approximately 400—700 %compared with the capacity of calcium bentonites of roughly200 % (Egloffstein 1995). The permeability of calcium bento-nites is 1—5×10—10 m/s and of sodium bentonites 1—3×10—11 m/s(Egloffstein 1997). GCLs manufactured in the USA use natu-ral sodium bentonites found in Wyoming. In many Europeancountries natural calcium bentonites are found (Koerner
Fig. 1. Cross-section sketch of nonreinforced GCL.
Na-bentonite Ca-bentonite
Montmorillonite content [%] 75 66Specific surface area [m2/g] 560 490Exchange capacity [meq/100g] 76 62
1997). In order to receive better swelling properties such calci-um bentonites are activated with soda (soda activated bento-nites). Some properties of natural sodium bentonites are givenin Table 1, compared to the properties of a calcium bentonite,for example, from Bavaria.
In addition to the previously mentioned favourable proper-ties of bentonites for the waste containment applications, thereare some critical issues that should be kept in mind. The ion-exchange capability of bentonite under typical use conditionscan cause the transformation of original sodium to calciumbentonites. As a consequence of that, some physical character-istics will be changed, like swelling, permeability and self-healing properties (Egloffstein 1997). This can be avoided bythe proper installation of GCLs. The design engineer shouldconsider the compatibility of GCL with the adjacent soils orliquids with which it will come into contact. GCLs should notbe used if they can come into contact with limestone. Extremeweather conditions (heavy raining, very dry areas) should alsobe avoided (Mackey 1997).
The most interesting property of bentonites for our researchis their shear strength. Previous investigations show that theyhave very low strength especially in free-swell conditions.Mesri & Olson (1970) and Olson (1974) conducted consolidat-ed-undrained triaxial tests with pore water pressure measure-ments on homoionic sodium- and calcium-montmorillonites.Gleason et al. (1997) performed consolidated-drained directshear tests on thin layers of bentonites according to ASTMD3080. The obtained values of shear strength parameters ofmontmorillonites and bentonites are shown in Table 2.
Shear apparatus
Direct shear tests were performed in a modified shear appa-ratus. Some modifications of a standard shear box as used incommon soil mechanics laboratories were necessary. Standardshear boxes have the following dimensions: specimen size 70 ×70 mm or 60 × 60 mm, specimens height 20 mm. GCLs have aheight of approximately 5 mm in as-received state, and theirheight is variable depending on the degree of saturation.Therefore, porous plates of different thickness were added tothe apparatus. Specimen size was enlarged to 100 × 100 mm. Inthat way, the maximum horizontal displacement was enlarged,too, and the measurement of residual strength was achieved.Finally, gripping of the specimens is solved by using teethedmetal plates, containing 112 teeth on the size of 100 × 100 mm.Details of the modified shear box are presented in Fig. 2.
Laboratory testing program
Published results of the internal shear strength parametersfor nonreinforced GCLs demonstrate a huge variety of data
Table 1: Properties of bentonites (Koerner 1997).

SHEAR STRENGTH PARAMETERS OF GEOCOMPOSITE CLAY LINERS 129
ing the hydration for 24 hours (normal consolidation) or 9days (extended consolidation), vertical displacements weremeasured and recorded continuously. Shearing of the speci-mens with different rates of displacements begun at the end ofthe hydration stage until the relative displacement of 15 %was achieved. Depending on the rate of displacements, shear-ing lasted from 17 minutes for series I and V to 9.5 days forseries IV (Table 3).
Results
Stress and strain components
During the direct shear testing of nonreinforced GCL, shearstress, vertical and horizontal displacements were measuredand recorded in an output file. Time intervals for recordingoutput data were adapted to the different test durations givenin Table 3. On the basis of this data, stress-displacementcurves were created for every series of testing program. Threecurves coresponding to three normal stress values (50, 100and 200 kPa) for a series III are shown on Fig. 3. It can beseen that nonreinforced GCLs demonstrate shearing behav-iour similar to that of overconsolidated clay materials exibit-ing peak and residual strengths. In our case, residual strengthswere determined at the displacement of 15 mm, that is at therelative deformation of 15 %. Total values of peak and residu-al shear strengths along with their ratios are given in Table 4.
By reviewing the data presented in Table 4, we can con-clude the following:– the obtained values of peak and residual strengths are low-er for lower displacement rates (comparing series I to IV),– strength reduction from peak to residual values are higherfor lower displacement rates,– extended consolidation produces lower strengths, too(comparing series I and V).
Homoionic Na-montmorillonite Homoionic Ca-montmorillonite Na-bentonite Ca-bentonite
CU triaxial test CD direct shear test
Liquid limit [%] 880 – 1160 190 – 220 603 124Plasticity index [%] - 160 – 190 567 98Cohesion [kPa] 7 14 6 5.8Friction angle [°] 5 15 12 21
Table 2: Shear strength parameters of montmorillonites and bentonites (Mesri & Olson 1970; Gleason et al. 1997).
Fig. 2. Cross-section of the modified shear box.
��������������������������������������������������������������������������������������������������������������������������������������������������������������������������������������������������������
����������������������������������������������������������������������������������������������������
������������������������������������������������������������������������������������������������������������������������������������������������������
�����������������������������������������������������������������������������
�����������������������������������������������������������������������������
������������������������������������������������������������������������������������������������������������������������������������������������������
Normal force
Shearingforce
Porous stone
Metal platewith teeth
GCL
(Daniel & Shan 1991; Daniel et al. 1993; Fox et al. 1998; Shan1993). The range of the measured values of friction angle, ϕ,and cohesion, c, are the following:
dry specimens ϕ = 22—37° c = 7—50 kPa,hydrated specimens ϕ = 0—27° c = 0.2—30 kPa.
There is obviously a huge scatter of the measured values ofshear strength parameters. However, by reviewing the pub-lished data, it can be seen that laboratory procedures differ sig-nificantly concerning the following issues: test configuration,specimen size, hydration procedure, normal stress range, strainrate, and maximum horizontal displacement. One of the rea-sons for the scatter is that the established test methods or stan-dards for the shear strength determination of GCLs did not ex-ist at that time. We concluded that the two most importantparameters for which the influence should be clearly deter-mined are: specimen hydration procedure and shear strain rate.Our laboratory testing program was therefore planned accord-ingly. It consisted of five series of direct shear tests (Table 3).Two procedures for specimen hydration (series I and V) andfour different shear strain rates (series I—IV) were investigatedin the program.
Specimens were placed into the direct shear box during thehydration stage. Immediately after the application of normalstress on the specimen, water was added to the shear box. Dur-
Table 3: Laboratory testing program.
Normal stress Test durationSeries Displacement rate[mm/min]
σn = 50 kPa σn = 100 kPa σn = 200 kPaI 1.219 I-1 I-2, I-2_p I-3, I-3_p 17 minII 0.1219 II-1 II-2 II-3 3 hoursIII 0.01219 III-1 III-2 III-3 27 hoursIV 0.001463 IV-1 IV-2 IV-3 9.5 daysV 1.219 V-1 V-2 V-3 17 min
I-IV: Consolidation stage 24 hours.V: Consolidation stage 9 days.
130 KOVAČEVIĆ ZELIĆ, KOVAČIĆ and ZNIDARČIĆ
Displacementrate [mm/min]
Normalstress
σn [kPa]
Peakstrengthτp [kPa]
Residualstrengthτr [kPa]
Strengthratioτr/τp
50 24.4 20.4 0.84100 46.1 37.6 0.821.219200 71.5 59.5 0.83
50 19.7 14.5 0.74100 36.3 25.7 0.710.1219200 62.5 42.8 0.68
50 14.7 7.9 0.54100 30.4 19.3 0.630.01219200 57.8 36.3 0.63
50 16.5 11.7 0.71100 28.3 16.9 0.600.001463200 47.4 25.3 0.53
50 22.5 14.9 0.66100 37.2 27.3 0.731.219*200 66.7 45.1 0.68
* Series V – extended consolidation
0
10
20
30
40
50
0 5 10 15 20Horizontal displacement [mm]
Shear stress [kPa]
σn=200 kPa
σn=50 kPa
σn=100 kPa
Internal shear strength envelopes
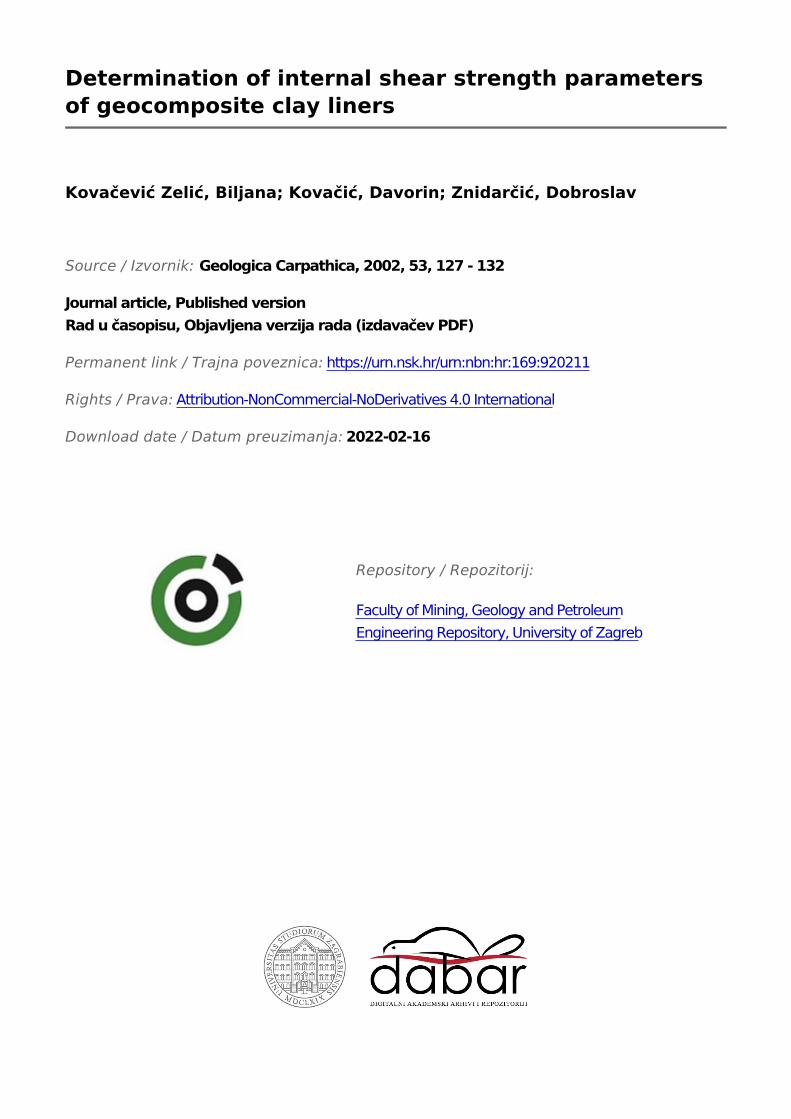
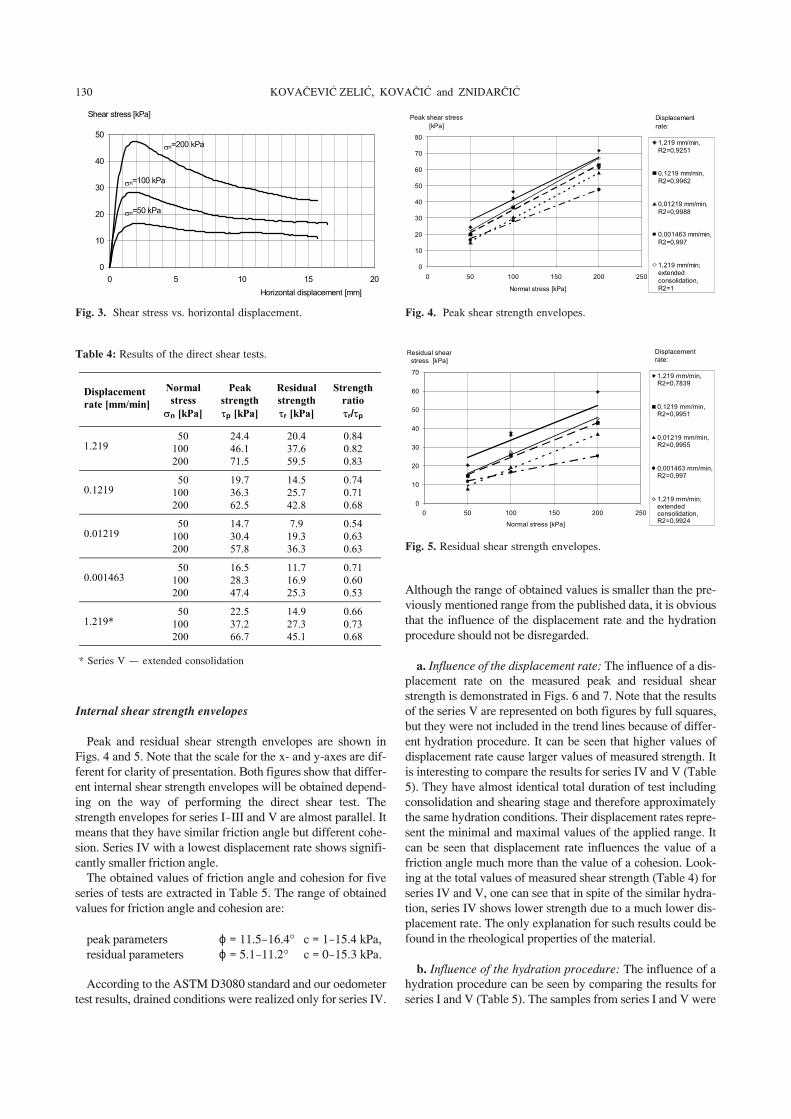
Peak and residual shear strength envelopes are shown inFigs. 4 and 5. Note that the scale for the x- and y-axes are dif-ferent for clarity of presentation. Both figures show that differ-ent internal shear strength envelopes will be obtained depend-ing on the way of performing the direct shear test. Thestrength envelopes for series I—III and V are almost parallel. Itmeans that they have similar friction angle but different cohe-sion. Series IV with a lowest displacement rate shows signifi-cantly smaller friction angle.
The obtained values of friction angle and cohesion for fiveseries of tests are extracted in Table 5. The range of obtainedvalues for friction angle and cohesion are:
peak parameters ϕ = 11.5—16.4° c = 1—15.4 kPa,residual parameters ϕ = 5.1—11.2° c = 0—15.3 kPa.
According to the ASTM D3080 standard and our oedometertest results, drained conditions were realized only for series IV.
Fig. 3. Shear stress vs. horizontal displacement.
Table 4: Results of the direct shear tests.
Fig. 5. Residual shear strength envelopes.
0
10
20
30
40
50
60
70
80
0 50 100 150 200 250
Normal stress [kPa]
Peak shear stress [kPa]
1,219 mm/min,R2=0,9251
0,1219 mm/min,R2=0,9962
0,01219 mm/min,R2=0,9988
0,001463 mm/min,R2=0,997
1,219 mm/min;extendedconsolidation,R2=1
Displacement rate:
Fig. 4. Peak shear strength envelopes.
0
10
20
30
40
50
60
70
0 50 100 150 200 250
Normal stress [kPa]
Residual shear stress [kPa]
1,219 mm/min,R2=0,7839
0,1219 mm/min,R2=0,9951
0,01219 mm/min,R2=0,9955
0,001463 mm/min,R2=0,997
1,219 mm/min;extendedconsolidation,R2=0,9924
Displacement rate:
Although the range of obtained values is smaller than the pre-viously mentioned range from the published data, it is obviousthat the influence of the displacement rate and the hydrationprocedure should not be disregarded.
a. Influence of the displacement rate: The influence of a dis-placement rate on the measured peak and residual shearstrength is demonstrated in Figs. 6 and 7. Note that the resultsof the series V are represented on both figures by full squares,but they were not included in the trend lines because of differ-ent hydration procedure. It can be seen that higher values ofdisplacement rate cause larger values of measured strength. Itis interesting to compare the results for series IV and V (Table5). They have almost identical total duration of test includingconsolidation and shearing stage and therefore approximatelythe same hydration conditions. Their displacement rates repre-sent the minimal and maximal values of the applied range. Itcan be seen that displacement rate influences the value of afriction angle much more than the value of a cohesion. Look-ing at the total values of measured shear strength (Table 4) forseries IV and V, one can see that in spite of the similar hydra-tion, series IV shows lower strength due to a much lower dis-placement rate. The only explanation for such results could befound in the rheological properties of the material.
b. Influence of the hydration procedure: The influence of ahydration procedure can be seen by comparing the results forseries I and V (Table 5). The samples from series I and V were
SHEAR STRENGTH PARAMETERS OF GEOCOMPOSITE CLAY LINERS 131
sheared with the same displacement rate, but their hydrationprocedure was totally different. The standard hydration andconsolidation procedure of 24 hours duration was used for se-ries I. For the series V extended hydration and consolidationlasted 9 days. The cohesion for series V is lower by a factor of2 or more when compared to the cohesion for series I, lookingto the peak and residual values. The friction angle in both cas-es is somewhat larger for series V than for series I. It can beconcluded that hydration procedure affects much more the co-hesion than the friction angle of GCLs.
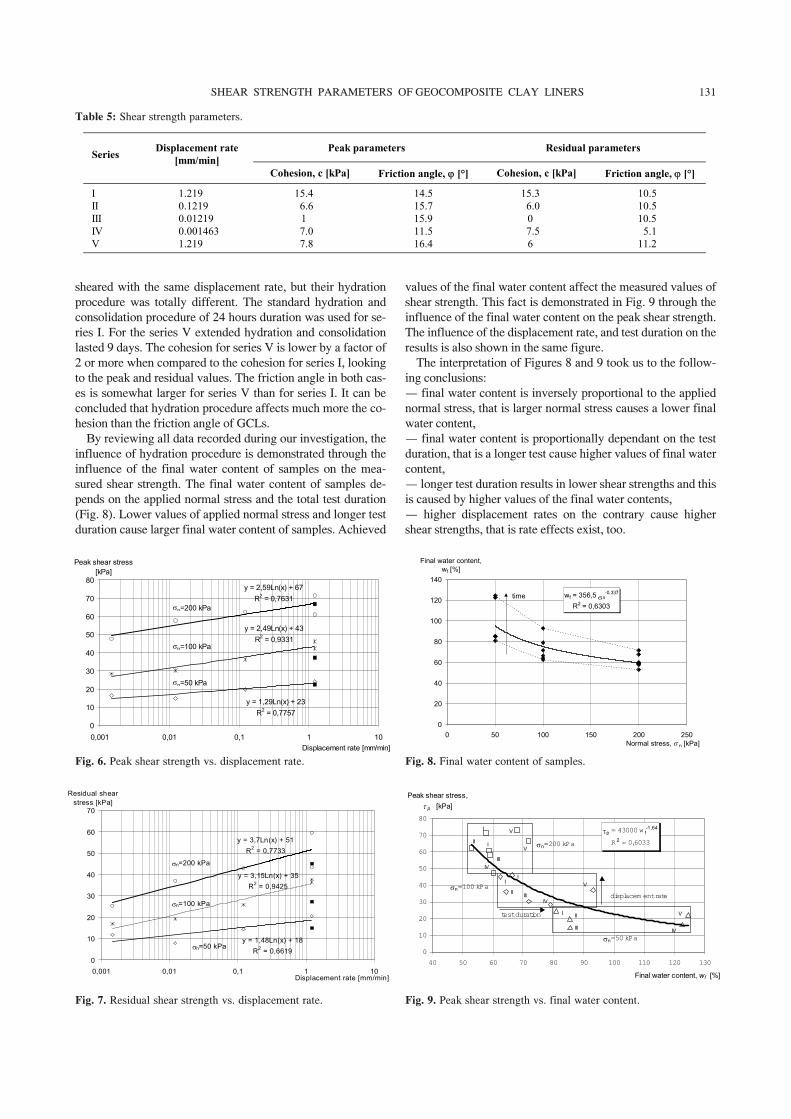
By reviewing all data recorded during our investigation, theinfluence of hydration procedure is demonstrated through theinfluence of the final water content of samples on the mea-sured shear strength. The final water content of samples de-pends on the applied normal stress and the total test duration(Fig. 8). Lower values of applied normal stress and longer testduration cause larger final water content of samples. Achieved
values of the final water content affect the measured values ofshear strength. This fact is demonstrated in Fig. 9 through theinfluence of the final water content on the peak shear strength.The influence of the displacement rate, and test duration on theresults is also shown in the same figure.
The interpretation of Figures 8 and 9 took us to the follow-ing conclusions:– final water content is inversely proportional to the appliednormal stress, that is larger normal stress causes a lower finalwater content,– final water content is proportionally dependant on the testduration, that is a longer test cause higher values of final watercontent,– longer test duration results in lower shear strengths and thisis caused by higher values of the final water contents,– higher displacement rates on the contrary cause highershear strengths, that is rate effects exist, too.
Table 5: Shear strength parameters.
Peak parameters Residual parametersSeries Displacement rate[mm/min]
Cohesion, c [kPa] Friction angle, ϕ [°] Cohesion, c [kPa] Friction angle, ϕ [°]
I 1.219 15.4 14.5 15.3 10.5II 0.1219 6.6 15.7 6.0 10.5III 0.01219 1 15.9 0 10.5IV 0.001463 7.0 11.5 7.5 5.1V 1.219 7.8 16.4 6 11.2
Fig. 6. Peak shear strength vs. displacement rate.
Fig. 7. Residual shear strength vs. displacement rate.
y = 2,59Ln(x) + 67R2 = 0,7631
y = 2,49Ln(x) + 43R2 = 0,9331
y = 1,29Ln(x) + 23R2 = 0,7757
0
10
20
30
40
50
60
70
80
0,001 0,01 0,1 1 10Displacement rate [mm/min]
Peak shear stress [kPa]
σn=200 kPa
σn=50 kPa
σn=100 kPa
y = 3,7Ln(x) + 51R2 = 0,7733
y = 3,15Ln(x) + 35R2 = 0,9425
y = 1,48Ln(x) + 18R2 = 0,6619
0
10
20
30
40
50
60
70
0,001 0,01 0,1 1 10Displacement rate [mm/min]
Residual shear stress [kPa]
σn=50 kPa
σn=100 kPa
σn=200 kPa
Fig. 9. Peak shear strength vs. final water content.
wf = 356,5 σn-0,337
R2 = 0,6303
0
20
40
60
80
100
120
140
0 50 100 150 200 250Normal stress, σ n [kPa]
Final water content, wf [%]
time
Fig. 8. Final water content of samples.
τp = 43000 w f-1,64
R 2 = 0,6033
0
10
20
30
40
50
60
70
80
40 50 60 70 80 90 100 110 120 130
Final water content, wf [%]
Peak shear stress, τ p [kPa]
σn=200 kPa
test duration
displacem ent rate
I II
III IV
V
IV
II
I
VI
II
II
III
III
V
IV
V
σn=50 kPa
σn=100 kPa

132 KOVAČEVIĆ ZELIĆ, KOVAČIĆ and ZNIDARČIĆ
Proposed internal shear strength criteria
As already mentioned in the introduction to this article, sta-bility analyses of the hydraulic barriers at waste disposal sitesare one of the most important issues for design engineers.Therefore, proper values of the shear strength parameters of allbarrier components including GCLs have to be chosen.
The analysis of the direct shear tests, presented in the paper,clearly demonstrate that the measured values of the shearstrength depend on the way of performing the laboratory tests.The main factors affecting the results are hydration procedureand displacement rate. Therefore, we propose the shearstrength envelopes as shown in Fig. 10. The envelopes are cre-ated on the basis of the results presented in Figs. 6 and 7. Peakand residual strengths are obtained by the extrapolation of thefunctions to the displacement rate of 0.001 mm/min for allthree normal stress values. These values are redrawn in Fig.10, giving the proposed envelopes. The real values of mea-sured peak and residual strengths are presented by full andblank marks, respectively. The envelopes defined in that waywill give the opportunity for engineers to design waste dispos-al facilities.
Acknowledgments: The work described in this paper is fund-ed partly by the U.S.—Croatian Joint Board on Scientific andTechnological Cooperation JF 150 “Impervious barriers forlandfills in karst” and partly by the Croatian Ministry of Sci-ence and Technology Project “Geotechnology for solid wastelandfills”. This support is gratefully acknowledged.
References
ASTM D 3080—90: Standard Test Method for Direct Shear Test ofSoils Under Consolidated Drained Conditions.
ASTM D 4439—97a: Standard Terminology for Geosynthetics.Daniel D.E. & Shan H.-Y. 1991: Results of direct shear tests on hy-
drated bentonitic blankets. Project Report, Geotech. Engrg.Ctr., The University of Texas, Austin, 1—13.
Daniel D.E., Shan H.-Y. & Anderson J.D. 1993: Effects of partialwetting on the performance of the bentonite component of ageosynthetic clay liner. Proceedings, Geosynthetics ‘93, Van-couver, B.C., IFAI Publ., 1483—1496.
Egloffstein T. 1995: Properties and test methods to assess bentoniteused in geosynthetic clay liners. In: R.M. Koerner, E. Gartung& H. Zanzinger (Eds.): Proceedings of an International Sympo-sium: Geosynthetic Clay Liners, Nurnberg, Germany 14—15,April 1994. Balkema, Rotterdam, 51—71.
Egloffstein T. 1997: Geosynthetic clay liners. Part six: Ion ex-change. Geotechnical Fabrics Report, June-July, 38—43.
Fox P.J, Rowland M.G. & Scheithe J.R. 1998: Internal shearstrength of three geosynthetic clay liners. Journal of Geotech-nical and Geoenvironmental Engineering 124, 10, 933—944.
Gilbert R.B., Fernandez F. & Horsfield D.W. 1996: Shear strengthof reinforced geosynthetic clay liners. Journal of the Geotech-nical Engineering 122, 4, 259—266.
Gilbert R.B., Scranton H.B. & Daniel D.E. 1997: Shear strengthtesting for geosynthetic clay liners. In: L.W. Well (Ed.): Testingand acceptance criteria for geosynthetic clay liners. ASTM STP1308, 121—135.
Gleason M.H., Daniel D.E. & Eykholt G.R. 1997: Calcium and sodi-um bentonite for hydraulic containment applications. Journalof Geotechnical and Geoenvironmental Engineering 123, 5,438—445.
IGS 2000: Recommended descriptions of geosynthetics functions,geosynthetics terminology, mathematical and graphical symbols.
Koerner R.M. 1997: Perspectives on geosynthetic clay liners. In:L.W. Well (Ed.): Testing and acceptance criteria for geosyn-thetic clay liners. ASTM STP 1308, 3—20.
Koerner R.M. 2000: Emerging and future developments of selectedgeosynthetic applications (The Thirty-Second Terzaghi Lec-ture). Journal of Geotechnical and Geoenvironmental Engi-neering 126, 4, 293—306.
Mackey R.E. 1997: Geosynthetic clay liners. Part five: Design, per-mitting and installation concerns. Geotechnical Fabrics Re-port, January—February, 34—39.
Mesri G. & Olson R.E. 1970: Shear strength of montmorillonite.Geotechnique 20, 3, 261—270.
Olson R.E. 1974: Shearing strength of kaolinite, illite, and montmo-rillonite. ASCE Journal of the Geotechnical Engineering Divi-sion 100, GT11, 1215—1229.
Shan H-Y. 1993: Stability of final covers placed on slopes contain-ing geosynthetic clay liners. Dissertation, The University ofTexas at Austin, 1—296.
Fig. 10. Proposed shear strength envelope.
τp=2,65+σn tg 13o
τr=2,18+σn tg 6,6o
0
10
20
30
40
50
60
70
0 50 100 150 200 250Normal stress [kPa]
Shear stress [kPa]
Conclusions
A series of direct shear tests were performed in the modifiedshear box in order to determine the internal shear strength ofone type of GCLs. The results showed that by using the modi-fied shear box, peak and residual strength could be obtainedfor the nonreinforced types of GCLs. The key parameters forperforming the direct shear tests are the hydration procedureand the applied displacement rate. The influence of these pa-rameters on the results is demonstrated. On the basis of the ob-tained results, peak and residual strength criteria are proposed.As the waste disposal facilities have a huge impact on the en-vironment, it is important for design engineers to have reliableshear strength parameters. It is believed that the proposedshear strength criteria enable designing of new facilities in asafe way.