Determination of Cane Berry Pomaces Benefits Through In ...
69
Louisiana State University LSU Digital Commons LSU Master's eses Graduate School 2013 Determination of Cane Berry Pomaces Benefits rough In Vitro Model for Human Colonic Fermentation M'Famara Goita Louisiana State University and Agricultural and Mechanical College, [email protected] Follow this and additional works at: hps://digitalcommons.lsu.edu/gradschool_theses Part of the Life Sciences Commons is esis is brought to you for free and open access by the Graduate School at LSU Digital Commons. It has been accepted for inclusion in LSU Master's eses by an authorized graduate school editor of LSU Digital Commons. For more information, please contact [email protected]. Recommended Citation Goita, M'Famara, "Determination of Cane Berry Pomaces Benefits rough In Vitro Model for Human Colonic Fermentation" (2013). LSU Master's eses. 1012. hps://digitalcommons.lsu.edu/gradschool_theses/1012
Transcript of Determination of Cane Berry Pomaces Benefits Through In ...
Louisiana State UniversityLSU Digital Commons
LSU Master's Theses Graduate School
2013
Determination of Cane Berry Pomaces BenefitsThrough In Vitro Model for Human ColonicFermentationM'Famara GoitaLouisiana State University and Agricultural and Mechanical College, [email protected]
Follow this and additional works at: https://digitalcommons.lsu.edu/gradschool_theses
Part of the Life Sciences Commons
This Thesis is brought to you for free and open access by the Graduate School at LSU Digital Commons. It has been accepted for inclusion in LSUMaster's Theses by an authorized graduate school editor of LSU Digital Commons. For more information, please contact [email protected].
Recommended CitationGoita, M'Famara, "Determination of Cane Berry Pomaces Benefits Through In Vitro Model for Human Colonic Fermentation"(2013). LSU Master's Theses. 1012.https://digitalcommons.lsu.edu/gradschool_theses/1012

DETERMINATION OF CANE BERRY POMACES BENEFITS THROUGH IN VITRO MODEL FOR HUMAN COLONIC FERMENTATION
A Thesis
Submitted to the Graduate Faculty of the Louisiana State University and
Agricultural and Mechanical College in partial fulfillment of the
requirements for the degree of Master of Science
in
The Department of Food Science
by M’famara Goita
B.S., Louisiana State University, 2008 December 2013

ii
ACKNOWLEDGEMENTS
It is with an immense gratitude I would like to thank my major professor, Dr. John
W. Finley, for all the support, guidance and help throughout this research project. I
would also like to thank my committee members, Dr. Michael Keenan and Dr. Marlene
Janes for their information and letting me use their laboratories and equipment for my
research.
I would like to acknowledge Dr. Reshani Nisansala Senevirathne for helping
initiate an experiment that was used as the root of this current project.
I would like to acknowledge Dr. Cathleen Williams and Anne M. Raggio for their
help doing the short chain fatty acid analysis of my samples.
I would also like to thank Felicia R. Goldsmith, Adriana Soto Gil and Dr Damien
Narcisse for all their help and advice with my research and studies.
I would like to give a special thanks to Kathleen McCutcheon, who helped me
with suggestions and corrections for the completion of the thesis manuscript.
iii
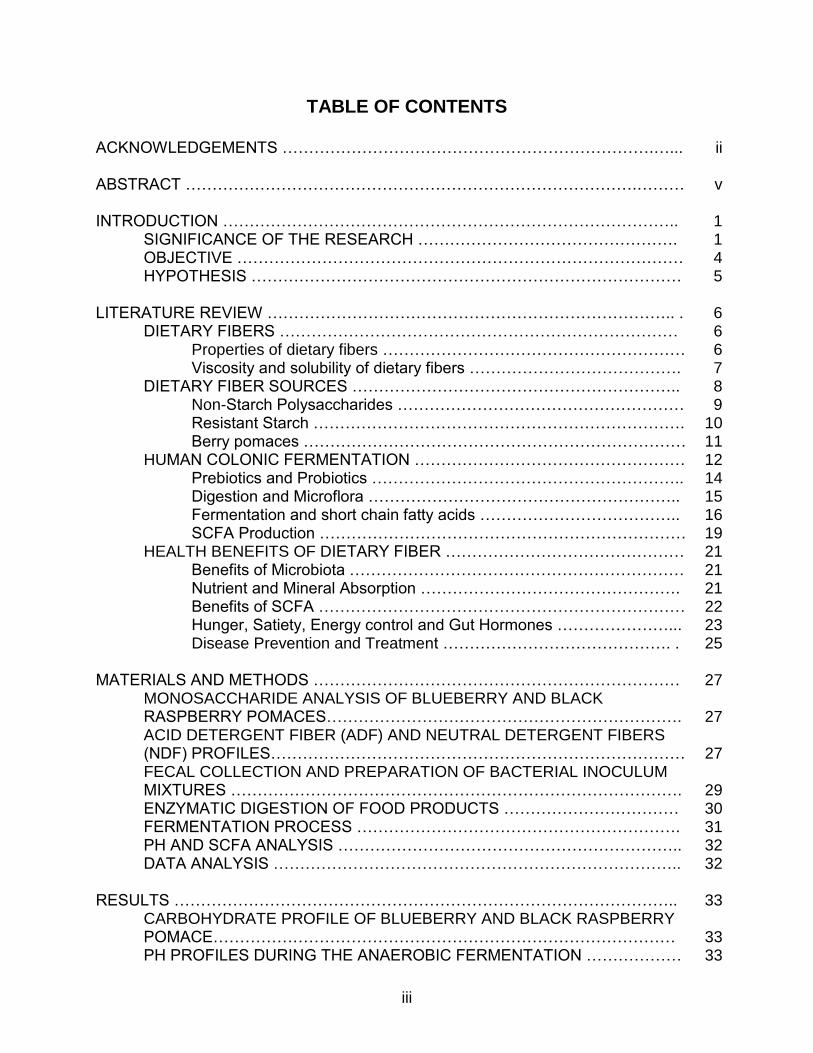
TABLE OF CONTENTS
ACKNOWLEDGEMENTS …………………………………………………………….…...
ABSTRACT ………………………………………………………………………….………
INTRODUCTION ………………………………………………………………………….. SIGNIFICANCE OF THE RESEARCH ………………………………………….
OBJECTIVE ………………………………………………………………………… HYPOTHESIS ………………………………………………………………………
LITERATURE REVIEW ………………………………………………………………….. . DIETARY FIBERS …………………………………………………………………
Properties of dietary fibers ………………………………………………… Viscosity and solubility of dietary fibers ………………………………….
DIETARY FIBER SOURCES …………………………………………………….. Non-Starch Polysaccharides ……………………………………………… Resistant Starch ……………………………………………………………. Berry pomaces ………………………………………………………………
HUMAN COLONIC FERMENTATION …………………………………………… Prebiotics and Probiotics ………………………………………………….. Digestion and Microflora ………………………………………………….. Fermentation and short chain fatty acids ……………………………….. SCFA Production ……………………………………………………………
HEALTH BENEFITS OF DIETARY FIBER ……………………………………… Benefits of Microbiota ……………………………………………………… Nutrient and Mineral Absorption …………………………………………. Benefits of SCFA …………………………………………………………… Hunger, Satiety, Energy control and Gut Hormones …………………... Disease Prevention and Treatment ……………………………………. .
MATERIALS AND METHODS …………………………………………………………… MONOSACCHARIDE ANALYSIS OF BLUEBERRY AND BLACK RASPBERRY POMACES…………………………………………………………. ACID DETERGENT FIBER (ADF) AND NEUTRAL DETERGENT FIBERS (NDF) PROFILES…………………………………………………………………… FECAL COLLECTION AND PREPARATION OF BACTERIAL INOCULUM MIXTURES …………………………………………………………………………. ENZYMATIC DIGESTION OF FOOD PRODUCTS …………………………… FERMENTATION PROCESS ……………………………………………………. PH AND SCFA ANALYSIS ……………………………………………………….. DATA ANALYSIS …………………………………………………………………..
RESULTS ………………………………………………………………………………….. CARBOHYDRATE PROFILE OF BLUEBERRY AND BLACK RASPBERRY POMACE…………………………………………………………………………… PH PROFILES DURING THE ANAEROBIC FERMENTATION ………………
ii
v
1 1 4 5
6 6 6 7 8 9
10 11 12 14 15 16 19 21 21 21 22 23 25
27
27
27
29 30 31 32 32
33
33 33

iv
Changes in pH with rat fecal samples …………………………………… Changes in pH for individual donors ……………………………………. Comparison of mixed pooled samples ………………………………….
SHORT CHAIN FATTY ACID PROFILES ………………………………………. Rat fecal samples ………………………………………………………….. Individual donors …………………………………………………………… Pooled samples …………………………………………………………….
DISCUSSION ……………………………………………………………………………… CARBOHYDRATE ANALYSIS ………………………………………………….. MICROBIAL FERMENTATION …………………………………………………. PH DETERMINATION……………………………………………………………… SCFAS ANALYSIS …………………..…………………………………………….
SUMMARY AND CONCLUSION …………………………………………………………
REFERENCES ……………………………………………………………………………..
APPENDICES ……………………………………………………………………………… A. POLYSACCHARIDES KNOWN TO BE DEGRADED BY CERTAIN HUMAN INTESTINAL BACTERIA* ………………………………………….... B. FDA RECOMMENDED DAILY INTAKE/VALUE OF FOOD COMPONENT C. SOLUTIONS FOR FIBER ANALYSIS ………………………………………..
Neutral Detergent Solution ………………………………….……………. Acid Detergent Solution ……………………………………………………
VITA …………………………………………………………………..……………………..
33 34 36 36 36 37 39
41 41 42 42 43
45
47
59
59 60 61 61 61
62

v
ABSTRACT
Cane berry pomaces have traditionally been considered waste products with little
or no value. Yet these pomaces’ high levels of phenolic compounds such as
anthocyanins, is a good source of dietary fiber. Because the pomaces are low in sugar
and rich in fiber and dietary antioxidants, they have potential as food ingredients for the
health food market. The pomace delivers health benefits associated with high fiber and
the antioxidant polyphenolic compounds associated with whole fruits and juices without
the high sugar content.
Some dietary fibers are substrates for anaerobic fermentation by the microbiome
in the lower gastrointestinal (GI) tract. The anaerobic fermentation of dietary fiber results
in a lowering of the pH in the biomass and production of short chain fatty acids. In this
study, a model system mimicking colonic fermentation in the digestive tract was
developed and used to assess fermentation of cane berry pomace by colonic bacteria.
Pomace samples from blueberry and black raspberry, and Hi-Maize© resistant starch (a
high amylose cornstarch used as the positive control) were treated with pepsin followed
by pancreatin digestion to simulate the digestive changes in the upper gastrointestinal
(GI) tract. After the digestion, the remaining undigested material was washed and air
dried. The fiber was then fermented anaerobically with an inoculum of colonic bacteria
prepared from fecal donations of healthy volunteers.
The fermentation of the blueberry and black raspberry pomaces using the
inoculum from 5 individuals resulted in a wide range of SCFA production. Fermentation
with Hi-maize© resistant starch resulted in production of higher concentrations of
SCFAs compared to the cane berry pomace substrates. An inoculum, prepared by
mixing individual stool samples from five individuals, provided a microbiota that

vi
represented a broader population, thus resulting in a more generalized result. The
production of acetate, propionate and butyrate was significantly higher in the pooled
sample compared to results from individual donors.
A different group of 5 individuals consumed a diet rich in resistant starch (RS) for
a month and at the end of that period their stool samples were collected and used to
prepare a pooled inoculum. The pooled inoculum from subjects with RS-fortified diet
produced higher level of SCFAs than the pooled inoculum with non-fortified diet expect
the Hi-Maize© RS which did not show difference at 0.05 significance level.

1
INTRODUCTION
SIGNIFICANCE OF RESEARCH
Overweight and obesity are defined as an abnormal or excessive gain in body fat
and are associated with many chronic diseases including diabetes, cardiovascular
disease and some cancers. The body mass index (BMI=mass/height2) is an
approximate measure of human body shape and obesity conditions based on the
individual mass and height (Flegal et al., 2001, McOrist et al., 2011, Meyer et al., 2011).
A BMI equal or greater than 25 is considered as overweight and a BMI over 30 is
considered as obese (Cook et al., 2005, Flegal et al., 2001, McOrist et al., 2011, Meyer
et al., 2011).
The worldwide occurrence of obesity has doubled since 1980. In the US,
overweight and obesity conditions occur in more than two thirds (68.8%) of the adult
population and in about a third (~31.8%) of children and adolescents (Ogden et al.,
2012). In 1995 obesity alone was about 15.9% of the population and that number
increased to 35.5% by 2010 (Finkelstein et al., 2009, Flegal et al., 2012). In addition the
impact on individual’s quality of life, medical cost of obesity and related conditions such
as diabetes, coronary heart diseases and some cancers is estimated to be $147 billion
per year in the U.S.(Finkelstein et al., 2009).
Although there are many diverse causes for obesity, most cases are the result of
an energy imbalance. When the energy from food intake is greater than the energy
expended through physical activity, the excess energy is stored in the body as fat
(Swinburn et al., 2009). Additional, such as stress and genetic make-up, can further
complicate energy balance and promote an even greater weight gain (Apovian, 2010).
Typically health professionals recommend more physical activity and a balanced diet

2
which matches caloric expenditure to prevent obesity or promote weight loss. This is
difficult for many people to accomplish with a more sedentary lifestyle and since the
typical American diet includes excessive consumption of energy dense food. Over the
last decades, a significant increase of the portion size and caloric contents of food
products has been observed and this increase leads to more consumption and is a
contributing factor to obesity and related conditions (Schwartz and Byrd-Bredbenner,
2006).
In recent years the food industry has introduced many products such as low fat,
low sugar, and reduced portions to help meet the consumer needs, but one of the most
beneficial approaches is to decrease the energy density of foods by increasing the level
of dietary fiber. Modern food processing such as flour milling or juice production,
however, removes much of the dietary fiber in plant products leaving highly digestible
sugars and starches in the food. Dietary fiber includes both non-fermentable cellulose
fiber and fermentable fiber such as pentosans, gums and fructooligiosaccharides. Plant
fiber increases food volume without increasing energy density, thus providing satiety
(Gropper and Smith, 2013). In addition to diluting the dietary energy, fibers can aid in
digestion, slow the absorption of glucose, and improve the absorption of nutrients,
particularly minerals (King et al., 2012, Lanza et al., 1987, Miyazato et al., 2010). When
reaching the lower GI tract, fermentable fiber can be fermented by gut microflora to
balance intestinal pH and produce short chain fatty acids. (Asa Henningsson, 2001,
Parrett et al., 1997).
The typical American diet is below the recommended daily intake for total fiber.
Adults should consume 25-38 grams per day (Institute of Medicine . Standing
Committee on the Scientific Evaluation of Dietary Reference and Institute of Medicine .

3
Panel on, 2005). According to the American Heart Association; the average American
consumes an average of 15 grams of fiber per day (Marlett et al., 2002). Some
consumers prefer taking fiber supplements (from refined sources) rather than consume
whole grain and vegetable products that are naturally rich in fiber, but often considered
less desirable because of flavor and texture. An alternative to using supplements or
adding refined fiber to foods is to produce and incorporate a low cost fiber into highly
palatable food products. Adding a low cost fiber to food would increase the fiber
content of food products, thus increasing satiety and lowering energy density.
In Juice processing, most of the fiber is removed, thus removing one of the major
benefits of fruit consumption. The pomace, including skin, seeds, and pulp from fruit and
vegetables after juice pressing, is produced from cane berry fruits such as grape,
raspberry, cranberry and blueberry. Currently pomace is an underutilized by-product
and is considered a waste product with little value; it is typically used as animal feed or
field dressings. However, many of the health promoting compounds, such as
anthocyanins and other phenolics, and 70 to 80% of the dietary fiber, remain in the
pomace. Novel reprocessing methods have made the pomace a value added product
that can be used in foods to increase the phytonutrient value and fiber content. We
hypothesize that fiber rich co-products removed during processing can be reintroduced
to the diet without affecting the taste and texture of the food.
The fiber in pomace not only decreases the energy density of foods, but has a
functional value since it is fermented by microflora in the lower gut. Each source of
pomace produces a unique composition of substrate that can provide an advantage to
certain microflora. The symbiotic combination of prebiotics (substrate used as food for
the gut microflora) and probiotics (specific microflora species unique to the substrate)
4
results in the production of specific end products including enzymes, peptides and short
chain fatty acids (SCFA). The SCFAs are utilized by the epithelial cells in the colon and
some portions are absorbed and enter the circulatory system. SCFAs, primarily acetate,
propionate and butyrate are produced when dietary fiber is fermented in the colon.
Acetate and propionate are readily absorbed and enter the peripheral circulation to be
metabolized by the peripheral tissues while the butyrate is used by the colonocytes as
primary source of energy (McOrist et al., 2008). SCFAs are important to colonic and
systemic health and can reduce the risk of developing gastrointestinal disorders,
cancer, cardiovascular disease, obesity and obesity related disorders. Therefore,
inclusion of dietary fiber which is readily fermented to SCFAs could provide health
benefits beyond simple energy dilution.
OBJECTIVE
The distribution of microflora in the individual biome is influenced by a number of
factors including “inoculation” in early life, genetics and environmental factors including
diets. These factors help account for the large diversity in the microflora found in the
large intestines of individuals across many populaces. Diets play a very important role in
the species and the number of bacteria that flourish at any given time in the gut. The
purpose of this study is to determine the differences in fermentation end products
resulting from different dietary berry pomace fibers. This project was designed to assess
the influence of anaerobic fermentation on dietary fibers from berry pomaces that are
resistant to digestion in a model system. The pomace will be predigested with pepsin
followed by pancreatin pre-digestion which will concentrate the non-digestible
oligosaccharides and polysaccharides from berry pomaces. The pomace will then be
fermented with human fecal inoculum and the short chain fatty acid production will be

5
measured. The study also assessed the differences in fermentation of pomace fiber by
individuals consuming different dietary levels of fiber.
HYPOTHESIS
Increasing fermentable dietary fiber will alter the microbiota of many individuals
and will result in increased production of short chain fatty acids. Our hypothesis is that
when provided a fermentable substrate as pre-treatment of gut microbiota, it will
become more responsive to other fiber substrates such as resistant starch or cane
berries pomace, therefore will produce more butyrate which is an indication of a shift
toward butyrate producing bacteria.

6
LITERATURE REVIEW
DIETARY FIBERS
Dietary fiber is defined as components of a diet that resist digestion and
absorption in the upper gastrointestinal tract and reach the illium and large intestine.
Some types of fiber stay unaltered until excretion. Others undergo a complete or partial
fermentation by microbiota in the large intestine (Du et al., 2010, Eastwood and Morris,
1992, Wijnands et al., 1999). There are a wide variety of fiber sources, mainly from
plant cells walls and can be found in cereals, fruits and vegetables. They can be
classified depending on their physical and chemical structures, and properties such as
volume, viscosity, water holding capacity, solubility and fermentability (Burton-Freeman,
2000, Howarth et al., 2001). Dietary fiber has historically been defined by many scientist
as complex non-starch carbohydrates formed from cellulose, hemicellulose, β-glucans,
pectins, mucilages, gums and non-polysaccharide lignins (polymers of phenylpropane)
(Burton-Freeman, 2000, Eastwood and Morris, 1992). More recently, residues such as
lactulose, resistant starch, condensed tannins and some non-digestible protein can be
included in this category since they are also fermented by bacteria in the lower gut
(Saura-Calixto et al., 1991).
Properties of dietary fibers
Dietary fibers have three primary modes of action; bulking, viscosity and
fermentation. The physical and chemical properties of the various dietary fibers
determine the functional benefits provided to the host. Chemical properties include type
or mixture of monosaccharides; how they are joined, including branching; and the
molecular weight of the polymers. The physical organization of the fiber and cell wall
material, including the complexion with non-digestible or other fermentable components
7
such as lignins, can also influence the ability of enzymes or microbes to access the
specific fiber component (Eastwood and Morris, 1992).
All fiber is defined as resistant to digestion in the small intestine; however, it can
be further classified as fermentable and non-fermentable. Dietary fiber is also divided
according to the physical properties and defined by viscosity and solubility. Other
factors such as the physicochemical nature (lipid, protein, carbohydrate) of the meal
and the microflora present in the lower gut can influence fermentability (Bird et al.,
2007). The degree of fermentability varies with the type of fiber, and the fiber
contributes varying amounts of energy from fermentation products such as SFAs which
are absorbed by the body.
Viscosity and solubility of dietary fibers
Soluble fiber just means it disperses in water. Most soluble fiber is viscous,
allowing it to absorb and retain water, forming a gel. Plant foods contain both soluble
and insoluble types of fiber in varying degrees. The solubility plays an important role in
its functional properties and resulting health benefits. The water soluble fibers increase
the viscosity in the intestine to slow gastric emptying time. Because of this, it has a
tendency to hinder macronutrient (glucose and sterol) absorption to stabilize blood
glucose and reduce blood cholesterol in the upper GI tract. And soluble fiber is mostly
fermentable by bacteria in the lower GI tract which contributes to the production of short
chain fatty acids and absorption of nutrients in the lower digestive tract (Isken et al.,
2010, Mallillin et al., 2008). Types of soluble dietary fibers can include a variety of
complex carbohydrates (oligosaccharides or polysaccharides) such as gums,
polydextrose and pectins (Theuwissen and Mensink, 2008). Insoluble fibers, composed
of lignins, cellulose and hemicellulose can bind water and add bulk to stool but are not

8
fermented in the human colon. Both soluble and insoluble fibers are believed to reduce
the exposure of colonocytes to potential carcinogens by diluting the fecal toxins
contents and are attributed to moderate weight loss due to low energy density and
increased satiety (Chen et al., 2010, Isken et al., 2010, Mallillin et al., 2008, Theuwissen
and Mensink, 2008).
DIETARY FIBER SOURCES
Fiber is defined to be the components of plants that resist human digestive
enzymes that include lignin, polysaccharides, resistant starches, inulin and other
oligosaccharides (Anderson et al., 2009, Burton-Freeman, 2000). Some edible portions
of plants such as the skin, pulp, seeds, stems, leaves, and roots, contain both insoluble
and soluble fiber components. The three main categories are dietary, functional and
total fiber. Total fiber is the combination of both dietary and functional fiber. Dietary
fiber includes non-digestible carbohydrates and lignin that are part of the plant cell walls
and act as bulking agents. Functional fiber includes carbohydrates that have beneficial
physiological effects in humans and can also be classified as fermentable fiber.
Fermentable fibers are non-digestible carbohydrates that are metabolized by the gut
microflora and include Resistant starches (RS), some non-starch polysaccharides
(NSP), and oligosaccharides. This type fiber will increase the beneficial bacterial loads
in the large intestine and are also known as prebiotics (Cani et al., 2007b, Topping and
Clifton, 2001, Wang et al., 2004).
Lignin, considered part of the dietary fiber complex, is insoluble and can be found
in plants filling the spaces in the cell wall between cellulose, hemicellulose, and pectin
components (Burton-Freeman, 2000). Lignin is covalently linked to hemicellulose, thus
crosslinking different plant polysaccharides and conferring mechanical strength to the

9
cell wall and, by extension, to the plant as a whole. The polysaccharide components of
plant cell walls are highly hydrophilic and thus permeable to water, whereas lignin is
more hydrophobic. Lignin is indigestible by animal enzymes, but some fungi and
bacteria are able to secrete lignases that can biodegrade the polymer (Chabannes et
al., 2001).
Oligosaccharides are polymers of simple sugars with 2 to 20 monomer units and
are often found as a component of glycoproteins or glycolipids (Macfarlane et al., 2008).
These compounds can be only partially digested by humans and are fermented by gut
microflora. Galactooligosaccharides (GOS), which also occur naturally, consist of short
chains of galactose molecules. GOS is naturally found in soybeans and can be
synthesized from lactose (milk sugar). Fructooligosaccharides (FOS), which are found
in many vegetables, consist of short chains of fructose molecules. FOS products
derived from chicory root contain significant quantities of inulin (a β 2,1-linked fructosyl
residue ending with a glucose). Inulin has a higher degree of polymerization than FOS
and belongs to a group of naturally occurring polysaccharides known as fructans. It is
highly available to the gut bacterial flora making it similar to resistant starches and other
fermentable carbohydrates. FOS and inulin are found naturally in Jerusalem artichoke,
burdock, chicory, leeks, onions, and asparagus (Meyer et al., 2011)
Non-Starch Polysaccharides
Fiber in the human diet is principally non-starch polysaccharides (NSP) and is
subdivided into soluble and insoluble NSP. The classification is based on their solubility
in aqueous solutions, but not necessarily under physiological conditions (Topping and
Clifton, 2001). They consist of long chains of repeating monosaccharide units joined by
bonds called beta-acetal linkages that cannot be split by the enzymes in the digestive

10
tract. Non-starch polysaccharides include celluloses, hemicelluloses, gums, pectins,
xylans, mannans, glucans and mucilages. The effects of slowly fermentable NSP may
be due to increased fecal bulk or reduced transit time that dilutes toxins and their
contact time with the colonic epithelium. Increased SCFA production, in particular
butyrate, is another proposed mechanism for the protective effect of insoluble NSP (Le
Leu et al., 2002).
Resistant Starch
RS is considered as a type of dietary fiber and is found in unprocessed foods, in
high amylose grain foods or as a refined food additive. Physiologically, resistant starch
(RS) behaves like soluble fiber, but it also has some characteristics of an insoluble fiber
(Cummings et al., 2001). RS is defined as starches or products of starch degradation
not absorbed in the small intestine (Brouns et al., 2007, Goni et al., 1996). It is not
hydrolyzed in by digestive enzymes, but it is fermented in the colon by the gut microflora
(Zheng et al., 2010). RS can be found in many food products (for examples bananas,
corn, potatoes, yams, whole grain bread, beans, oatmeal, and brown rice). The
resistance to digestion is dependent on factors such as amylose-amylopectin ratio,
physical form, and processing (Asp, 1992).
RS can be categorized into 5 types: RS1, found usually in seeds, legumes or
unprocessed whole grains are physically inaccessible by digestive enzymes; RS2 found
in uncooked potatoes, green bananas and high amylose corn usually occurs in natural
granular form and is inaccessible by digestive enzymes due to the physical structure of
the starch (d-glucose units linked by α-1,4/α-1,6 glucosidic bonds) or the starch
backbone; RS3 is found after retrogradation (recrystallization) of starchy food that have
been cooked and cooled such as bread, pasta, rice, potatoes, and cornflakes; RS4, not

11
found in nature, are chemically modified starches, for example cross-linked starches,
starch ethers, starch esters, that are water-insoluble semi-crystalline structures
preventing enzymes from digesting them; and RS5, recently introduced and not
commercially available, occurs as starch-lipid or amylose-lipid complex that forms when
starchy foods are heated or cooked in the presence of fats or lipids and offers
resistance to enzymatic digestion based on steric hindrance by the complex (Aparicio-
Saguilán et al., 2008, Brouns et al., 2007, Ratnayake and Jackson, 2008, Reed, 2012)
Berry pomaces
Small berries such as grapes, blueberries, blackberries, raspberries, and other
cane berries are recognized for their health promoting materials. These fruits are rich in
phenolic acids, anthocyanins, proanthocyanindins and flavonoids (Zadernowski et al.,
2005). Most berries are harvested from cultivators for the purpose of fresh market or
production of juices. They are often considered as “super fruits” because of the high
content of anthocyanins, the water-soluble flavonoids responsible for the red, blue and
purple color in the fruits (Su and Chien, 2007, Zadernowski et al., 2005). The content of
phenolics in berries is influenced by the variety of the fruit, the degree of maturity at
harvest, and harvest conditions (Zadernowski et al., 2005). Processing the fruits into
juice increases the commercial life of the product and provides convenient consumer
access to the healthy products (Brambilla et al., 2008). The phenolic compounds in
berries have been reported to have antioxidant, anticancer, anti-inflammatory, and anti-
neurodegenerative biological properties (Seeram, 2008). Although many of the
beneficial components in fruit are retained in the juice, much of the bioactive
components remain in the pomace that is discarded after juice production.

12
Pomace is the by-product residue consisting of skins, pulps, seeds and stems
remaining after fruits and vegetables have been pressed for juice, wine or other
products. Millions of pounds of pomace are produced each year with most of it disposed
of in landfills. The primary use currently is in animal feeds and field dressings, have an
additional value in the food industry, potential applications include production of flavors
and value added components such as anthocyanins, citric acid, and seed oils (Su and
Silva, 2006). Pomace constitutes approximately 20% of the initial fruit weight and can
contain 25-50% of the polyphenolics, thus containing many of the potential beneficial
health components found in fresh fruit, including the anthocyanins, other phenolics and
dietary fiber (Khanal et al., 2009). The bioactive compounds, such as anthocyanins in
fresh fruits are poorly absorbed in the upper gastrointestinal tract, however, when the
pomaces are used as a dietary fiber additive in foods, the anthocyanins are fermented
by the microbiome in the lower gastrointestinal tract resulting in improved bioavailability.
HUMAN COLONIC FERMENTATION
Physiologically, humans do not have the enzymes capable of metabolizing
dietary fibers in the GI tract. When these non-digestible carbohydrates reach the large
intestine, they are met by an entire anaerobic metabolic system comprised of bacteria
which possess enzymes capable of doing the process. (Hernot et al., 2009, Louis and
Flint, 2009). The human large intestine serves as a vessel for fermentation and the
microbiota generated by-products can be utilized by the host (Cummings et al., 2001).
These by-products play an essential role in the host’s health with the production of
nutrients and energy and the protection against diseases (Backhed et al., 2005).
The GI tract has different type of bacterial populations according to the location
and environmental conditions. Each bacteria affects digestion and absorption of

13
intestinal contents during passage throughout the GI Tract (Table 1). The mouth has the
second largest population of bacteria including Firmicutes, Bacteroidetes,
Proteobacteria, Fusobacteria and Actinobacteria (Tlaskalova-Hogenova et al.,
2004)(Figure 1). The stomach has less bacterial populations, due to high acidity and
digestive enzymes, which are mostly gram positive and gram negative (Helicobacter
pylori) aerobic bacteria (Tlaskalova-Hogenova et al., 2004). The small intestine has a
relatively higher concentration of bacteria that are mainly Firmicutes such as
Lactobacilli, Bacilli, gram positive Coci and some Bacteroidetes, Proteobacteria,
Fusobacteria and Actinobacteria. The large intestine contains an average of the largest,
mostly anaerobic bacterial populations. The colonic microbiota changes due to a
nutritional shifts, aging, stress or variation of food intake (Topping and Clifton, 2001).
Table 1. Dimensions of the Human GI Tract, passage time of intestinal contents, and corresponding microbial density (Rajilic-Stojanovic et al., 2007)
Gastrointestinal segment
Length (cm)
Passage time
(hours)
Density of microbiota cells/ml (g)
Stomach 12 2--6 100-104
Duodenum 25
3--5
104-105
Jejunum 160 105-107
Ileum 215 107-105
Caecum 6
41567.00 1010-1011
Ascending colon 15
Transverse colon 50
Descending colon
25
Signoid colon 40
Rectum 18 1.00 1010-1011

14
1 Mouth/Esophagus Firmicutes, Bacteroidetes, Proteobacteria, Fusobacteria and Actinobacteria 3 Stomach Helicobacter pylori 5-10 Small intestines Bacteroides, Lactobacillus, Enterococcus Clostridium, Enterobacterium, Gram positive Coci 11 Colon Bacteroides, Bifidobacterium, Eubacterium, Lactobacillus, Fusobacterium, Enterococcus Clostridium, Escherichia coli, Staphylococcus, Streptococcus
Figure 1. Human GI Tract Microbiota (Rajilic-Stojanovic et al., 2007)
Prebiotics and Probiotics
The term prebiotic, which overlaps the definition of dietary fiber, was defined as
"a non-digestible food ingredient that is beneficial to the host by selectively stimulating
the growth and/or activity of one or a limited number of bacteria in the colon" (Gibson et
al., 2004, Schrezenmeir and de Vrese, 2001).Dietary fibers that increase the beneficial
bacterial load in the large intestine are known as prebiotics. The term probiotic was
defined as "A live microbial feed supplement which beneficially affects the host by
improving its intestinal microbial balance" (Fuller, 1986, 1989, Parker, 1974). Probiotics
have n vast range of health benefits including inhibiting the attachment and growth of
pathogenic microbes in the epithelium of the intestinal tract (Macfarlane and Cummings,
1999). Probiotics can improve the immune response, increased the ability to digest
food, and alleviate many common digestive disorders such as constipation, diarrhea
and Irritable bowel syndrome IBS. In-vitro and in-vivo studies showed that when pH-
controlled co-culture of Bifidobacterium infantis was inoculated together with

15
Escherichia coli, and Clostridium perfringens, with the presence of oligo-fructose the
Bifidobacteria has expressed an inhibitory effect on the growth of the other two species
(Cummings et al., 2001, Senevirathne, 2010). Prebiotic fiber supplements do not always
need a probiotic supplementation since the normal microbial populations in the human
body exceeds 100 trillion cells with close to 1000 different species of bacteria in the
adult GI tract (Cani et al., 2007b, Kurokawa et al., 2007)Even though the bacterial
community in the GI tract is extremely diverse; the majority of species belongs to a few
bacterial divisions or pyla, namely Firmicutes, Bacteroidetes Actinobacteria and
Proteobacteria (Backhed et al., 2005).
Digestion and Microflora
The digestive system is a complex and complicated biological system. Digestion
of food starts in the mouth. During the oral phase of digestion food starts with
mechanical breakdown, then salivary α-amylase hydrolysis and finally bolus formation
prior to swallowing (Woolnough et al., 2008). In the stomach hydrolysis of protein,
carbohydrate and fat occurs. Protein digestion is initiated by pepsin and hydrochloric
acid resulting in to peptide formation; Carbohydrate digestion is initiated by salivary
amylase and lipid digestion occurs with gastric lipase. Further hydrolyzation occurs in
the small intestine. Protein and peptide passing from the stomach are exposed to the
pancreatic converted into free amino acids and smaller peptides. Carbohydrates are
further hydrolyzed by pancreatic amylase to maltose and to dextrin, then, after exposure
to maltase, lactase, sucrose, and isomaltase are converted to monosaccharides. Lipid is
also exposed to enzymes and co-enzymes such as pancreatic lipase, carboxylic ester
hydrolase, phospholipase and colipase. Pancreatic lipase breaks down triacylglycerols
into monoacylglycerols and fatty acids, the carboxylic ester hydrolase breaks down
16
carboxylic esters, and phospholipase breaks down fatty acids into the 2-position of
glycerophospholipid. The presence of bile salts enhances the activity of lipase and the
absorption of long-chain fatty acids and monoacylglycerols. The amino acids, peptides
simple sugar molecules and digested fatty acid are absorbed in small intestine (Boisen
and Eggum, 1991).
The remaining undigested fat, proteins and carbohydrates pass into the large
intestine (Saunders and Sillery, 1988). From 10-20 % of nitrogen from protein is
recovered by microflora in the large intestine. Protein (mucin) and carbohydrates
(Resistant starch (RS), oligo saccharides, Inulin) are metabolized by bacterial enzymes.
The 2% of undigested fatty acids reaching the large intestines cannot be fermented by
bacterial enzymes, so lipids are only slightly affected during passage through the large
intestine. The major by-product of dietary fiber and protein fermentation are the
production of short chain fatty acids (SCFA), which can be absorbed and act as an
energy source in humans (Boisen and Eggum, 1991).
Fermentation and short chain fatty acids
When food products are consumed, normal digestive enzymes convert complex
food components into a range of absorbable compounds for use throughout the body.
Many dietary fibers, because of their structure do not get metabolized in the upper
digestive tract, but are fermented in the lower intestine by the resident microflora.
(Valeur and Berstad, 2010). The metabolism of these carbohydrates is dependent on
the specific bacteria present, the non-digested substrate available, the enzymes
produced and most importantly the anaerobic conditions (Duncan et al., 2002b,
Schröder et al., 1994, Yasuda et al., 2007). SCFAs and gases (carbon dioxide,
hydrogen, and methane) are produced in the large intestines when non-digested

17
carbohydrates go through this anaerobic fermentation process (Cherbut, 2002, Hernot
et al., 2009, Macfarlane and Englyst, 1986). Three (3) major SCFAs of interest, acetate,
propionate and butyrate, can be metabolized and produced through various pathways
(Asa Henningsson, 2001).
Acetate the most abundant of the three SCFAs and can be produced through
several different pathways. In glycolysis, the pyruvate can be converted to Acetyl CoA
and later into acetate. It also can be synthesized by the Wood–Ljungdahl pathway, also
called the reductive Acetyl-CoA pathway. This pathway occurs when acetogenic and
methanogenic bacteria are present with the help of two enzymes, carbon monoxide
dehydrogenase and acetyl-CoA synthase, and acetyl CoA is produced from the
synthesis of CO2, CO and hydrogen used as the electron donor (de Graaf and Venema,
2007, Westermann et al., 1989).
Propionate is formed through the succinate pathway by decarboxylation of
succinate in presence of CO2. It can also be produced by some bacteria in the Acrylate
pathway, where pyruvate, through a series of reactions is transformed into propionyl-
CoA, which is later converted to propionate (Hosseini et al., 2011, Miller and Wolin,
1996). Propionate, mainly metabolized in the liver, has been shown to inhibit
gluconeogenesis and increase glycolysis in rat hepatocytes (Asa Henningsson, 2001). It
has also been shown to lower cholesterol synthesis by inhibiting the 3-hydroxy-3-
methylglutaryl-CoA reductase activity (Mallillin et al., 2008).
Butyrate is probably the most studied of all the SCFAs because of its utilization
as an energy source by the epithelial cells in the colon. Acetate produced during
fermentation is utilized by some bacteria to make butyrate (Duncan et al., 2004). Also,
depending on the species, enzymes such as butyryl CoA and acetate CoA transferase

18
or phosphotransbutyrylase/butyrate kinase are used to produce butyrate (Pryde et al.,
2002).
In vitro studies about gut anaerobic fermentation of various sources of fiber have
been conducted, and the produced SCFAs vary greatly with the substrates and also the
fermentation. Table 2 is an example of variability between produced SCFAs from
numerous sources of fibers in raw and processed forms (Hernot et al., 2008).
Table 2: pH Change and Acetate, Propionate, Butyrate, And Total Short-Chain Fatty Acid (tSCFA) Production following 12 h of in Vitro Fermentation of Native and Extruded Cereal Grains and Components (Hernot et al., 2008).
S u b s t r a t e s pH change Mg /g o f DMG
acetate* propionate butyrate tSCFA
barley
native WG -0.16 3.8 (6.5) 14.7 (24.9) 40.5 (68.6) 59.0
processed WG -0.14 57.2 (55.0) 20.4 (19.6) 26.3 (25.3) 104.0
Corn
Native WG 0.06 0.0 1.2 (2.6) 45.5 (45.5) 46.7
Processed WG -0.03 0.0 13.0 (40.3) 19.3 (59.7) 32.2
bran 0 0.0 10.1 (62.7) 6.0 (37.3) 16.0
Oat
native WG 0.08 5.4 (8.6) 21.3 (34.3) 35.4 (57.1) 62.0
processed WG 0 31.4 (32.1) 27.0 (27.6) 39.4 (40.3) 97.8
bran -0.07 11.2 (14.2) 28.0 (35.8) 39.4 (50.2) 78.6
Rice
native WG 0.03 9.4 (27.7) 4.3 (12.8) 20.1 (59.5) 33.8
processed WG -0.02 0.0 8.1 (62.8) 4.8 (37.2) 12.9
Wheat
native WG 0.17 58.1 (46.7) 12.1 (9.7) 54.2 (43.6) 124.4
processed WG 0.09 8.2 (18.4) 12.6 (28.3) 23.8 (53.3) 44.5
bran -0.13 52.3 (46.4) 20.2 (17.9) 40.1 (35.6) 112.6
germ -0.16 53.5 (37.7) 33.4 (23.6) 54.9 (38.7) 141.8
Standards
Solka Floc -0.12 0.8 (100.0) 0.0 0.0 0.8
inulin Ultra-FOS -1.78 212.6 (44.5) 94.4 (19.7) 171.2 (35.8) 478.2
Pectin HM Rapid -1.44 308.3 (67.6) 70.6 (15.5) 77.3 (16.9) 456.1
SEM 0.02 4.25 1 1.8 5.8
*Values in parentheses are individual fractions expressed as a percentage of total SCFA.

19
SCFA Production
The gut microflora is comprised of a variety of bacteria species which play a very
important role in human health. They coexist with the host, and mutually benefit both of
them by providing nutrients, energy and protection while feeding on the indigestible
carbohydrates (Backhed et al., 2005, Belenguer et al., 2006, Xu and Gordon, 2003).
The human colon host bacteria species mostly belonging to the Bacteroidetes and
Firmicutes phyla (Turroni et al., 2008, Xu and Gordon, 2003). A new born is sterile at
birth but acquires the first set of bacteria from contact with the mother and the
environment (Morelli, 2008). Gut microflora become dominated by bifidobacteria and
lactobacilli through breast milk, but later in life other bacteria are found in the population
including Enterobacteriaceae, enterococci, Bacteroides, and clostridia (Fooks and
Gibson, 2002, Morelli, 2008). The population and types of some of the most dominating
species, including bifidobacteria and lactobacilli, differ individually because of the
provided substrate (Hernot et al., 2009, Parrett et al., 1997). The species and the
substrates play a very important role in SCFA production. Several strains of Roseburia
sp., Faecalibacterium prausnitzii, and Coprococcus sp in the colon produce a significant
amount of butyric acid (Duncan et al., 2002b).
Bifidobacterium spp is classified under phylum Actinobacteria; it is a Gram-
positive strictly anaerobic branched rod that produces lactic and acetic acid without
generation of CO2. The genus Bifidobacterium is the third most numerous bacterial
populations in the human intestine after the genera Bacteroides and Eubacterium.
Bifidobacterium is about 6% of total fecal bacteria (Matsuki et al., 2004). Bifidobacterium
spp can be used as a probiotic because it improves digestion, absorption and helps to
decrease the side-effects of antibiotic therapy. This organism has a symbiotic
20
relationship in the metabolism of resistant starches, fructo-oligosaccharides and inulin,
transgalactosylated oligosaccharides and soybean oligosaccharides (Cani et al., 2004,
Falony et al., 2006, Gibson G R, 1995, Gibson et al., 1995, Gibson et al., 2004, Ito et
al., 1993, Topping and Clifton, 2001, Wang et al., 2004). Bifidobacterium spp can
change the position of starch molecules and produces acetate and lactate as end
products, which helps to promote butyrate.
Lactobacilli are Gram-positive non-spore-forming rods that belong to the general
category of lactic acid bacteria under the phylum Firmicutes. Lactobacillus spp.
produces lactic acid as the major acid during fermentation of glucose with acetic,
succinic and formic acids in minor quantities.
Bacteroides spp. is strictly anaerobic Gram-negative, dominant bacillus bacterial
group in human gastrointestinal tract. Bacteroides spp. can break down a wide variety
of indigestible dietary carbohydrate by producing acetate and succinate as the major
metabolic end products. This organism increased rapidly soon after the introduction of
prebiotics such as Resistant Starch. This bacterium attaches to starch molecules and
starts the fermentation process (Bird et al., 2000, Brown et al., 1997, Wang and Gibson,
1993). During young age higher population of Bacteroides spp. are seen in the intestinal
tract compared to the elderly age.
Clostridium clusters categorization has done based on16S rRNA sequence
analysis, According to Phylogenetic analysis of 16S rRNA genes shows that the group
is very diverse, it includes non-clostridial species in deeply branching clusters. The main
two butyrate producing Clostridium clusters groups are normally present in healthy
humans (Senevirathne, 2010).

21
HEALTH BENEFITS OF DIETARY FIBER
Benefits of Microbiota
Microbes in the digestive system have a symbiotic relationship with the host
providing a stable environment with nutrients for the microbes (Leser and Molbak,
2009). Gut microbiota help the host by providing defense against pathogens, synthesis
of vitamins, fermentation of dietary fibers and dietary proteins; priming the immune
system early in life; and stimulating the gut motility (Cani et al., 2007a, Cani and
Delzenne, 2007, Leser and Molbak, 2009, Topping and Clifton, 2001). The gut
microbiota helps to increase thickness of the villi in the intestinal wall and exhibits fast
epithelial cell turnover (Leser & Molbak, 2009).The microbiota in the gut contributes to
the development of healthy conditions within the intestinal tract by suppressing
colonization of pathogenic organisms (Itoh et al., 1995, Spinler et al., 2008). Production
of Short chain fatty acids (SCFA) is one of the most useful benefits of gut microbes.
Nutrient and Mineral Absorption
Fermentation of dietary fibers by the gut microflora results in SCFAs that are
absorbed through the intestinal lumen providing direct and indirect health benefits.
SCFAs, especially butyrate, are the primary energy source required by the colonocytes
resulting in growth of intestinal epithelial cells producing a thicker mucosa and
increasing the number of villia in the intestinal lining (Campbell et al., 1997). The
healthier epithelial cells allow for more effective absorption of nutrients, minerals,
peptides, and SCFAs which are transported to the liver and metabolized for circulation
to various other tissues in the body.

22
Benefits of SCFA
The basic fermentative reaction in the human colon is similar to that of obligate
herbivores (Topping and Clifton, 2001). Intestinal microbial communities hydrolyze non-
digestible plant polysaccharides such as lignin, hemicelluloses, pectin, cellulose and RS
into SCFA. The acetate, propionate, and butyrate are found in greater concentration in
the feces of those who consume a diet containing dietary fibers (Morita et al., 1999).
The typical ratios of SCFA in feces are proportion of 3:1:1 in acetate: propionate:
butyrate (Duncan et al., 2002a). These SCFA help regulate the colonic physiological
processes and maintain normal bowel function. Reduction of pH values from SCFA help
to reduce the growth pathogenic organisms and reduce absorption of toxic compounds
with carcinogenic potential in the gut (Bird et al., 2000).
Butyrate is a major energy source for epithelial cells of colonic mucosa which
stimulates cell proliferation (Sato et al., 2008, Schrezenmeir and de Vrese, 2001).
Butyrate is the major SCFA that in providing protection against cancer and ulcerative
colitis by reducing cell proliferation, blocking the absorption of cancer-causing
substances and making the colon less vulnerable to DNA damage (Pitcher and
Cummings, 1996). It also helps to boost the absorption of calcium to maintain a healthy
epithelium (Cummings and Macfarlane, 1991, Gibson and McCartney, 1998, Hagopian
et al., 1977). Dietary resistant starch was associated with increased gene and hormone
expression for peptide YY (PYY) and glucagon-like peptide-1(GLP-1), which are also
associated with increased butyrate in the cecum in rats (Keenan et al., 2006, Zhou et
al., 2006).
Propionate is the primary precursor for gluconeogenesis and may inhibit
liponeogenesis and protein synthesis (Louis et al., 2007, Schwiertz et al., 2010).

23
Propionate is believed to inhibit the synthesis of fatty acids in the liver and also involved
in the control of hepatic cholesterol synthesis. It helps to lowers plasma cholesterol
concentrations by inhibiting hepatic cholesterogenesis through colonic fermentation
(Cheng and Lai, 2000). The propionate concentration and proportion of total SCFA
increases significantly in lean subjects and could be an important factor that contributes
to weight gain in obese subjects (Schwiertz et al., 2010).
Acetate is the major SCFA produced by the colonic microflora. It is around 60–
75% of the total SFCA detected in feces and is formed by many of the colonic microflora
with one-third coming from reductive acetogenesis which is produced by anaerobic
bacteria (Louis et al., 2007, Miller and Wolin, 1996). Acetate is not metabolized in the
colon because It is quickly absorbed after production and transported to the liver.
Remaining acetate is further utilized by colonic microbiota and covert into butyrate.
Acetate is essential for cholesterol synthesis in the body (Hijova and Chmelarova,
2007). It acts as an energy substrate for muscles and has been shown to suppress
harmful bacteria (Araya-Kojima et al., 1995)
Hunger, Satiety, Energy control and Gut Hormones
One of the most beneficial aspects of dietary fibers is the capability to control
(delay or inhibit) hunger after being consumed because of the bulking and viscous
capabilities. This results in stomach expansion, an longer time and effort for chewing,
and a prolonged intestinal phase for nutrient digestion and absorption (Slavin and
Green, 2007). Dietary fibers have zero or low energy value and fiber rich foods play an
important role in energy balance because their bulking properties dilute the energy of
the food. Energy density is defined as the number of kilojoules per unit weight of food,
and most high fiber foods have a reduced energy density (Burton-Freeman, 2000).

24
Some fibers have water retention properties and are not metabolized in the GI tract, but
contribute to the stool size. Furthermore the consumption of dietary fiber also affects the
concentration of Peptide Tyrosine-Tyrosine (PYY) and Glucagon-like peptide-1 (GLP)
secreted in the blood (Bosch et al., 2009). GLP-1 and PYY are satiety hormones
secreted by the gut in response to nutrient intake. GLP-1, secreted from the L-cells of
the intestinal mucosa, and PYY inhibits esophageal muscle contraction and gastric acid
secretion and delays gastric emptying (Bohorquez et al., 2011, Näslund et al., 1999).
Both hormones decrease the food intake and body weight in animal and human models
(Buddington and Weiher, 1999, Näslund et al., 1999).
Peptide YY (PYY) and glucagon-like peptide 1 (GLP-1), are two main hindgut
hormones that are produced in greater amounts in response to large amounts of food
passing through the small intestine in to the large intestine (Cani et al., 2005, Keenan et
al., 2006, Shen et al., 2009, Zhou et al., 2006). The gut hormone PYY is produced by L
endocrine cells mainly located in the ileum, large intestine and rectum (McGowan &
Bloom, 2004). GLP-1 is also produced by L endocrine cells that are located in the ileum
and large intestine (Kreymann et al., 1987, Kreymann et al., 1988). GLP-1 acts through
binding to the GLP-1 receptors that are found on many cell types including, beta cells of
the pancreas, neuronal cells in the brain, adrenal, pituitary, kidney, and throughout the
gastrointestinal tract (Gotthardt et al., 2006). GLP-1 enhances both early and late
phase of insulin secretion stimulated by glucose and is important in the treatment of
diabetes mellitus (Wicki et al., 2007). GLP-1 controls feeding behavior in the brain that
affects energy intake and energy expenditure making it a potential treatment for weight
control (Perez-Tilve et al., 2006). Peptide YY (PYY) is also plays a role in energy
balance and adiposity since it helps to inhibit both food intake and gut motility and fat

25
oxidation (Adams et al., 2006, Adams et al., 2004)PYY is also important in the control of
insulin sensitivity and controlling obesity (Boey et al., 2006a, Boey et al., 2006b, Boey et
al., 2007).
The increase of butyrate in the intestinal tract by fermentation of prebiotics may
help to increase PYY and GLP-1 (Keenan et al., 2006, Zhou et al., 2006). PYY and
GLP-1 are associated with reduced body fat and decreasing the blood glucose level,
reducing body weight and improving insulin sensitivity in mammalians (Young et al.,
1999). Lower respiratory exchange ratio is prominent in mice fed RS, indicating a
partitioning of fat to oxidation rather than storage (Zhou et al., 2009).
Disease Prevention and Treatment
The metabolic processing in the colon by microflora yields SCFA end-products,
primarily butyrate, that controls the proliferation and differentiation of intestinal epithelial
cells, thus altering intestinal growth by changing the expression of the cell surface. The
healthier epithelial cells prevent injury to the gut mucosa from occurring with significant,
beneficial health effects such as reduction of infectious inflammatory bowel disorders
and colonic tumors. Dietary fiber reduces the exposure time of colonocytes to potential
carcinogens by diluting fecal toxins. It also prevents the reabsorption of bile acid in the
liver that can aid in lowering circulating triglycerides (Chen et al., 2010, Mallillin et al.,
2008). Dietary fiber improves carbohydrate metabolism and glucose tolerance. The
possible mechanisms include a relaxed glycemic response to a meal that reduces the
highs or lows that stimulate appetite as well as the increased release of gut satiety
peptides, GLP-1 and PYY. This can also prevent or reduce obesity and related
disorders by decreasing blood glucose levels for storage as fat, increasing insulin
26
sensitivity resulting in less insulin to push lipogenesis and decreased fatty acid synthase
activity.
Beneficial bacteria reinforces the intestinal walls by crowding out pathogenic
organisms that compete for available nutrients, receptors, and growth factors and
increases antimicrobial and antibacterial compounds such as bacteriocins, cytokines
and butyrate. Improvement in mineral absorption and balance can prevent osteoporosis
and improve bone density. Also, the increased absorption through the intestinal
epithelium causes lymphoid tissue near the gut to grow to stimulate immunomodulatory
cells to boost the immune system for an overall health effect.
27
MATERIALS AND METHODS
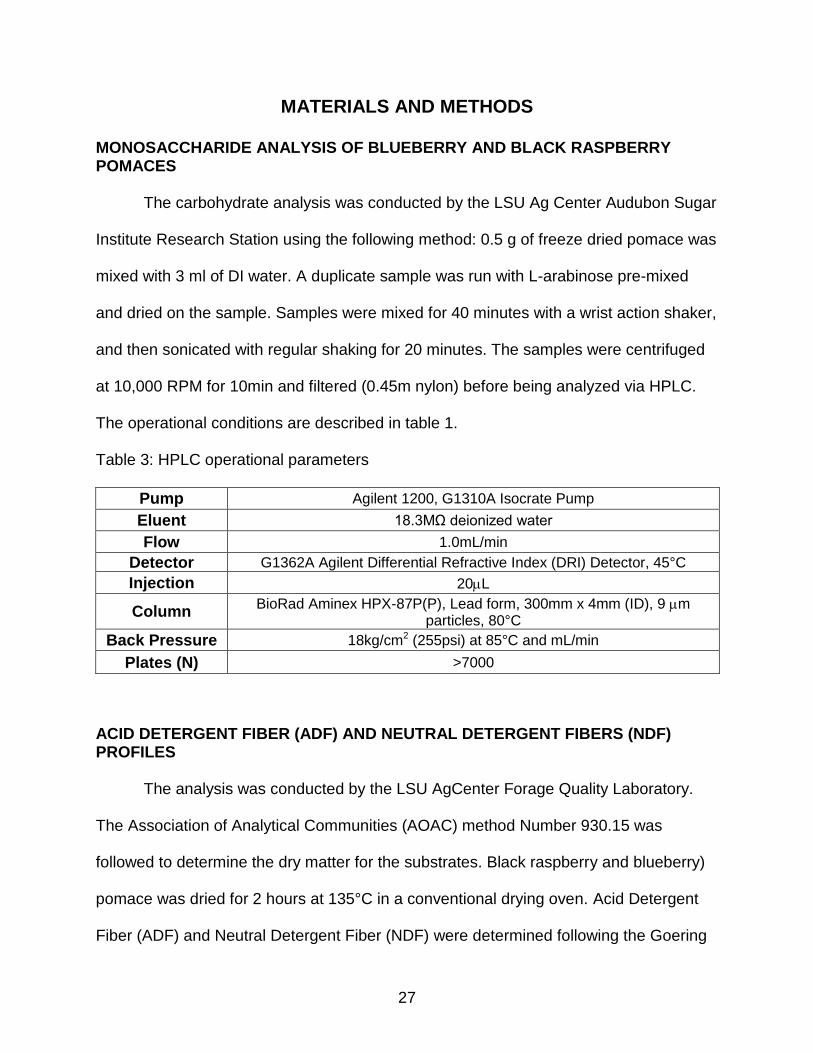
MONOSACCHARIDE ANALYSIS OF BLUEBERRY AND BLACK RASPBERRY POMACES
The carbohydrate analysis was conducted by the LSU Ag Center Audubon Sugar
Institute Research Station using the following method: 0.5 g of freeze dried pomace was
mixed with 3 ml of DI water. A duplicate sample was run with L-arabinose pre-mixed
and dried on the sample. Samples were mixed for 40 minutes with a wrist action shaker,
and then sonicated with regular shaking for 20 minutes. The samples were centrifuged
at 10,000 RPM for 10min and filtered (0.45m nylon) before being analyzed via HPLC.
The operational conditions are described in table 1.
Table 3: HPLC operational parameters
Pump Agilent 1200, G1310A Isocrate Pump
Eluent 18.3MΩ deionized water
Flow 1.0mL/min
Detector G1362A Agilent Differential Refractive Index (DRI) Detector, 45°C
Injection 20L
Column BioRad Aminex HPX-87P(P), Lead form, 300mm x 4mm (ID), 9 m
particles, 80°C
Back Pressure 18kg/cm2 (255psi) at 85°C and mL/min
Plates (N) >7000
ACID DETERGENT FIBER (ADF) AND NEUTRAL DETERGENT FIBERS (NDF) PROFILES
The analysis was conducted by the LSU AgCenter Forage Quality Laboratory.
The Association of Analytical Communities (AOAC) method Number 930.15 was
followed to determine the dry matter for the substrates. Black raspberry and blueberry)
pomace was dried for 2 hours at 135°C in a conventional drying oven. Acid Detergent
Fiber (ADF) and Neutral Detergent Fiber (NDF) were determined following the Goering

28
and Van Soest method (McOrist et al., 2008). The neutral-detergent procedure for cell-
wall constituents is a rapid method for analyzing the total fiber while the acid-detergent
fiber procedure provides a rapid method for lignocellulose determination in feedstuffs.
The NDF was determined as described below:
Into a beaker with reflux, the following was added in the specific order listed, with a
calibrated scoop: 0.5-1.0g of dried sample (ground), 100 ml of a neutral-detergent
solution (at room temperature), 2 ml of decahydronaphthalene, and 0.5 g of sodium
sulfite. The mixture was heated to boiling in 5 to 10 minutes while avoiding foaming.
Temperature was adjusted as needed for an even boiling and reflux level for 60
minutes, timed from onset of boiling.
After suspending the solids, the solution was transferred into Gooch crucibles,
previously tared on filter manifold. No vacuum was admitted until the crucible was filled.
A low vacuum was initially applied, then increased as more force was needed. The
sample was rinsed into the crucible with minimum amount of hot (90°-100° C.) water.
The vacuum was removed and the crucible was filled with hot water. The liquid
was filtered and the washing steps were repeated, and then washed twice with acetone
in the same manner and suck dry. The crucibles were then dried at 100° C for 8 hours
and weighed. The percent of cell-wall constituents was reported as yield of recovered
NDF. Estimate cell soluble material determined by subtracting this value from 100.
The residue was ashed in the crucible for 3 hours at 500° to 550° C, weighed and
reported as ash insoluble in neutral-detergent.
The ADF procedure was done as described below:
Into a beaker with reflux, the following was added, in the specific order listed: 1.0g of
dried sample (ground), 100 ml of cold (room temperature) acid detergent solution and 2

29
ml. decahydronaphthalene. The mixture was heated to boiling for 5 to 10 minutes and
the heat was reduced as needed to avoid foaming and reflux for 60 minutes, timed from
onset of boiling.
The mixture was filtered on a previously tared crucible using a filter manifold with
a light suction. After breaking it up with a rod, the filter mat was washed twice with hot
water (90°-100° C). The sides of the crucibles were washed in the same manner. The
wash procedure was repeated with acetone until all the colors were removed. The ADF
was dried at 100° C. for 8 hours and weighed.
The ADF was calculated using the equation below:
FECAL COLLECTION AND PREPARATION OF BACTERIAL INOCULUM MIXTURES
The in-vitro bacteria inoculum was prepared using feces that were taken from
three different groups and were prepared as followed. Group 1, where the fecal samples
were freshly collected from Sprague Dawley (SD) rats that were on a hi-maize
controlled diet from 8 weeks prior collection. The samples were then stored at -80°C
until usage. The fecal samples for the next two groups were collected from human
volunteers (male and female of varied ages). The donors were healthy and free of
antibiotics for at least three weeks prior to the collection. The non-fortified group (group
2) that was free feeding without diet restriction or dietary fiber additives and the RS-
fortified group (group3) had yogurt with RS added to their daily diet. The amount of RS
started at 25 g per day and increased by 25 g every week until reaching 75 g per day.
The feces samples were frozen (-4°C) immediately after collection, then transferred to
an ultra-low freezer (-80°C) until usage. For the non-fortified group, each individual fecal

30
sample was mixed with distilled water at a 1 to 1 weight by weight ratio, and stored in
aliquots of 50 g. The pooled fecal samples were prepared by mixing equal amount of
the individual mixtures, and divided in 50 g aliquots. The pooled fecal samples for the
RS-fortified group was prepared following the same process and also divided in 50 g
aliquots. Individual mixtures were not made or this group. All the aliquots (individual,
unfortified pooled and RS-fortified pooled mixture) were stored at -80°C until usage.
ENZYMATIC DIGESTION OF FOOD PRODUCTS
A method mimicking the human digestion and absorption process before entering
the large intestine was applied to the berry pomace substrates in order to prepare the
products for fermentation. The enzymatic digestion using pepsin followed by
pancreatin, was conducted to remove the digestible, non-fibrous contents of the
substrate. Pepsin is an enzyme used to degrade protein into peptides and the
pancreatin is a mixture of amylase, lipase and protease produced by pancreatic
exocrine cells. The protease works to hydrolyze proteins into oligopeptides; amylase
hydrolyzes starches into oligosaccharides and the disaccharide maltose; and lipase
hydrolyzes triglycerides into fatty acids and glycerols. The digestion was done as
followed:
Sixty (60) g of dried pomace substrate was added to 100 mL distilled water with
Hydrochloric acid (HCl) to bring the solution to a pH of 2. The mixture was incubated for
ten (10) min while shaking to bring the temperature to 37°C. Then 0.5 g (3500 U/mg) of
pepsin was added to the mixture and incubated while shaking for another 3 hours. Next,
the pH was brought to 7.5 with a sodium hydroxide (NaOH) or sodium bicarbonate
(NaHCO3) solution, and incubated for 10 min to bring the temperature back to 37°C
before adding 4.0 g of pancreatin (SIGMA-ALDRICH) and 1g of bile salts (Mixture of

31
sodium cholate and sodium deoxycholate from SIGMA-ALDRICH). The solution was
mixed thoroughly for 10 min then incubated at 37°C for another 2 hours. The mixture
was microwaved for 3-5 min to denature the enzymes and then filtered to obtain the
solids. Those remaining solids of the mixture were then washed with ethanol and filtered
again before being dried overnight. The dried substrate was later made into a powder
and kept frozen until utilized for the fermentation step. All substrates except for the ones
used with the rats fecal samples went through the pre-digestion process.
FERMENTATION PROCESS
The anaerobic buffer solution was prepared according to the following steps and
was used throughout the fermentation process. The anaerobic solution was a mixture of
two solutions, A and B, at the ratio 9:1 and prepared as follows:
Solution A (per liter of distilled water) contained 11.76 g of sodium bicarbonate
(NaHCO3), 11.1 ml of Hemin (0.78 mmol/L of water), 1.1ml of menadione (0.36
mmol/L of water) and 1.1 ml of resazurin (3.98 mmol/L of water) as a redox
indicator. The solution was autoclaved at 121°C for 15min after preparation.
Solution B (per liter of autoclaved distilled water) contained 0.48 mol NaCl, 0.02
mmol (Dipotassium phosphate) K2HPO4, and 0.63 mmol L-Cysteine-HCl.
The in-vitro bacteria inoculum was prepared using 50 g of the feces that was mixed with
200 mL of the buffer then filtered with either cheese cloth or a filter whirlpak bag. The
solution is incubated at 37°C under anaerobic conditions for one hour.
One (1) liter glass bottles used as vessels were autoclaved at 121°C for 15 min prior to
usage. To each vessel was added: 350mL of the anaerobic solution (solution A+B) and
10 g of the fermentation substrate. Then an aliquot of 50mL of the incubated solution
was added to each vessel and flushed with an anaerobic gas mixture (10% CO2, 80%

32
N2 and 10% H2) for 10 min. The samples were then incubated at 37°C, while shaking or
stirring. Samples were collected at times 0, 12, and 24 hours, stored in 15 mL falcon
tubes and frozen until usage. The process was done in triplicate for each individual
mixture, the unfortified pooled and RS-fortified pooled mixture.
PH AND SCFA ANALYSIS
For each of the samples, the pH was measured as an indicator of SCFA
fermentation using a with Mettler Toledo seven easy pH meter. One milliliter (1mL) of
the fermentation samples was thoroughly mixed with 1mL of distilled water. To it, 1ml of
an acid solution (metaphosphoric acid (3.72M) plus 2-ethylbutyrate (3.72M)) was
added and vortexed. The mixture was then centrifuged for 10 min at 3000rpm. An
aliquot of the supernatant was collected in auto sampling vials and analyzed using gas
chromatography (GC) for short chain fatty acids (butyrate, propionate and acetate).
Table 4. GC operational conditions
GC HP 6890 SERIES GC SYSTEM
AUTOSAMPLER Agilent Technologies 7683 Series
°C/min Next °C Hold Min Run time
Initial 0.1 0.10
Ramp 1 10 150C 0.1 3.70
Ramp 2 11 170C 2.0 7.52
DATA ANALYSIS
The obtained results were used to calculate the actual amount of SCFAs
produced from the original amount of substrate. Data was analyzed using SAS 9.3.
ANOVA with two factors used as a test comparison of the means (expressed as means
± Standard deviation), and the results were presented at a significance p<0.05.

33
RESULTS
CARBOHYDRATE PROFILE OF BLUEBERRY AND BLACK RASPBERRY POMACE
The carbohydrate analysis of both dried pomaces showed the presence of simple
sugars such as sucrose, D-glucose, L-Arabinose, D-fructose. Blueberry had smaller
values compared to the black raspberry. As showed in table 5, both pomaces show
levels ranging from 0 to 16%. The sucrose level was lower than other sugars for black
raspberry and was not at a detectable level in the blueberry pomace with fructose levels
highest in the profile for each pomace. As shown in table 6, the blueberry pomace was
much higher in fiber and lower in digestible nutrients.
Table 5. Carbohydrate profile of blueberry and black raspberry pomace.
Samples Analytes µg/g of sample Percentage (%)
Blueberry pomace Sucrose 0 0.00
D-Glucose 52573 5.26
L-Arabinose 2580 0.26
D-Fructose 57881 5.79
Black Raspberry pomace Sucrose 2932 0.29
D-Glucose 160265 16.03
L-Arabinose 3530 0.35
D-Fructose 206375 20.64
Table 6. Fiber profile of berry pomaces
Blueberry Black Raspberry
Dry Matter % 100.00 100.00
Acid Detergent Fiber (ADF) % 26.14 5.61
Neutral detergent fiber (NDF) % 43.28 7.43
Total Digestible Nutrients (TDN) % 70.72 92.65
PH PROFILES DURING THE ANAEROBIC FERMENTATION
Changes in pH with rat fecal samples
The fermentation using the rat fecal samples to prepare inoculum was able to
decrease the pH for the Hi-Maize RS for after 12 hours and stayed constant. The black

34
raspberry and blueberry pomaces as shown in figure 2 did not have significant changes
in the pHs during the fermentation process.
Figure 2: pH of fermentation products using rat fecal inoculum Groups different from other groups are indicated with a and b for significant differences of substrate means across all time points for the 24hours Changes in pH for individual donors
Figures 2, A through E represent the measurement of the pH which indicated
differences between individual donors and the three substrates. The changes in pH
from the 5 donors using the substrates from Hi-Maize RS, blueberry pomace and black
raspberry pomace were fermented over a 24 hour period. For each individual donor
there was distinctive fermentation pattern. Donors 1 and 3 showed a significant
difference in pH for the hi-maize RS. The significant differences could also be noticed in
other fermentation substrates. Blueberry pomace for donor 1 through 3 showed a
continuous decrease of pH until the 24 hours pull time whereas for the same substrate
the pH increased after the 12 hours incubation time for donors 4 and 5. All 5 donors
showed similarities in the decrease rate for the pH except for donor 2 who had
significantly lower pH for the 24 hours incubation period.
a
b b
a a a a a a
4.00
6.00
8.00
0 12 24 0 12 24 0 12 24
Hi-Maize RS Blueberry Black Raspberry
pH
Incubation time (hours)

35
Figure 3: Comparison in pH for individual stools samples
A
B
C
D
E
A: Donor #1 B: Donor #2 C: Donor #3 D: Donor #4 E: Donor #5
Groups different from other groups are
indicated with a, b, c and d for significant differences of substrate means across all
time points for the 24hours
a a
a a
a a
a
a
b
5
7
9
0 12 24 0 12 24 0 12 24
Blueberry Blackraspberry
Hi-Maize RS
pH
Incubation Time (hours)
a a
a,b
a a
b
a
a,b
b
5
7
9
0 12 24 0 12 24 0 12 24
Blueberry Blackraspberry
Hi-Maize RS
pH
Incubation Time (hours)
a a a
b b a,b
a
b,c
c
5
7
9
0 12 24 0 12 24 0 12 24
Blueberry Blackraspberry
Hi-Maize RS
pH
Incubation Time (hours)
a
a,b a a
a,b a,b
a
b b
5
7
9
0 12 24 0 12 24 0 12 24
Blueberry Blackraspberry
Hi-Maize RS
pH
Incubation Time (hours)
a a,b,c a,b a
b,c,d b,c,d
d
c,d d
5
7
9
0 12 24 0 12 24 0 12 24
Blueberry Blackraspberry
Hi-Maize RS
pH
Incubation Time (hours)

36
Comparison of mixed pooled samples
The pooling of donated samples allowed the mixture to contain a wide variety of
microorganisms. The pH changes of the three substrates (Hi-Maize RS, blueberry
pomace and black raspberry pomace) respectively in pooled non-fortified and pooled
RS-fortified donors.
Figure 4: Comparison in pH for pooled mixed stools samples Groups different from other groups are indicated with a, b, c and d for significant differences of substrate means across all time points for the 24hours
None of the substrates showed significant changes after 12 hours of fermentation
in the non-fortified diet. For the RS fortified diets, the blueberry pomace did not show
significant differences in pH while hi-maize RS and black raspberry showed a pH
decrease by the 12 hour measurement and was significantly lower at the 24 hours pull
time suggesting that the microflora were adjusting to the substrate.
SHORT CHAIN FATTY ACID PROFILES
Rat fecal samples
The fermentation products showed an increasing concentration of SCFAs over
the 24 hours period time. As inlustrated on table 7, the measured SCFAs indicated
variations with all the utilized substrates. Hi-Maize RS as expected produced highest
a
b b
a
a a
a
c c
4
5
6
7
8
9
0 12 24 0 12 24 0 12 24
Blueberry Blackraspberry
Hi-maize RS
pH
Incubation time (hours)
A: non-fortified diet donors
a,b a,b,c a,b,c, a,b,c,
b,c
d
a
b,c c
4
5
6
7
8
9
0 12 24 0 12 24 0 12 24
Blueberry Blackraspberry
Hi-Maize RS
pH
Incubation time (hours)
B: RS-fortified diet donors
37
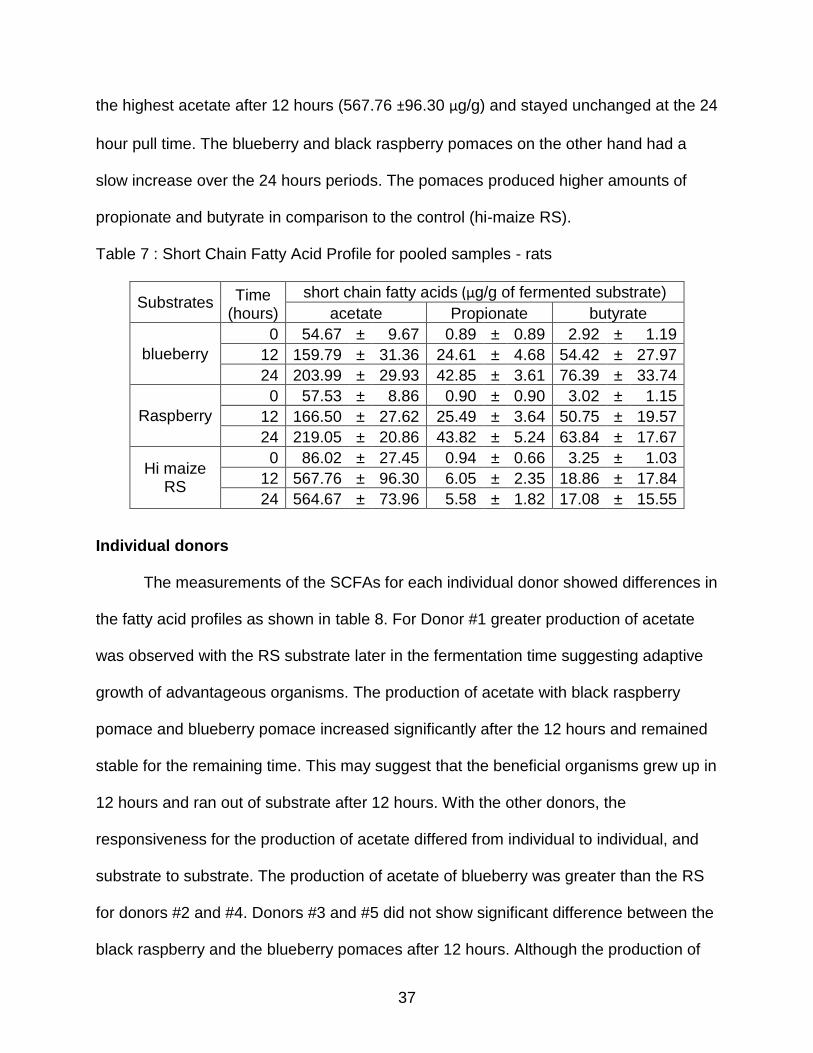
the highest acetate after 12 hours (567.76 ±96.30 µg/g) and stayed unchanged at the 24
hour pull time. The blueberry and black raspberry pomaces on the other hand had a
slow increase over the 24 hours periods. The pomaces produced higher amounts of
propionate and butyrate in comparison to the control (hi-maize RS).
Table 7 : Short Chain Fatty Acid Profile for pooled samples - rats
Substrates Time (hours)
short chain fatty acids (µg/g of fermented substrate)
acetate Propionate butyrate
blueberry
0 54.67 ± 9.67 0.89 ± 0.89 2.92 ± 1.19
12 159.79 ± 31.36 24.61 ± 4.68 54.42 ± 27.97
24 203.99 ± 29.93 42.85 ± 3.61 76.39 ± 33.74
Raspberry
0 57.53 ± 8.86 0.90 ± 0.90 3.02 ± 1.15
12 166.50 ± 27.62 25.49 ± 3.64 50.75 ± 19.57
24 219.05 ± 20.86 43.82 ± 5.24 63.84 ± 17.67
Hi maize RS
0 86.02 ± 27.45 0.94 ± 0.66 3.25 ± 1.03
12 567.76 ± 96.30 6.05 ± 2.35 18.86 ± 17.84
24 564.67 ± 73.96 5.58 ± 1.82 17.08 ± 15.55
Individual donors
The measurements of the SCFAs for each individual donor showed differences in
the fatty acid profiles as shown in table 8. For Donor #1 greater production of acetate
was observed with the RS substrate later in the fermentation time suggesting adaptive
growth of advantageous organisms. The production of acetate with black raspberry
pomace and blueberry pomace increased significantly after the 12 hours and remained
stable for the remaining time. This may suggest that the beneficial organisms grew up in
12 hours and ran out of substrate after 12 hours. With the other donors, the
responsiveness for the production of acetate differed from individual to individual, and
substrate to substrate. The production of acetate of blueberry was greater than the RS
for donors #2 and #4. Donors #3 and #5 did not show significant difference between the
black raspberry and the blueberry pomaces after 12 hours. Although the production of

38
propionate was negligible compared to the acetate, significant variations in the types of
substrates used, incubation times and donors were observed. As expected, the
produced butyrate was much lower than acetate. The control (hi-maize resistant starch)
for donor #1 had the highest butyrate production. The next observed measurements
were the same for donors #4 and #5. After 24 hours, the measurements for the other
substrates shows detection, but much lower than the amount produced from the
fermentation Hi-Maize RS.
Table 8: Acetate µg/g of fermented substrate from individual donors
Substrates Time
(hours)
Donors
# 1 # 2 # 3 # 4 # 5
Blueberry
0 8.58 ± 2.95 7.85 ± 2.96 6.78 ± 1.92 9.58 ± 2.60 8.85 ± 2.63
12 42.37 ± 9.24 42.47 ± 12.30 30.96 ± 28.20 47.32 ± 4.56 37.24 ± 9.24
24 51.56 ± 7.43 52.31 ± 10.04 41.93 ± 11.56 58.77 ± 8.37 49.04 ± 11.02
Black raspberry
0 4.00 ± 0.40 3.07 ± 0.40 2.60 ± 0.24 3.92 ± 1.13 3.10 ± 0.49
12 45.67 ± 10.14 25.01 ± 0.62 31.96 ± 3.06 29.69 ± 2.23 40.90 ± 2.52
24 41.62 ± 1.35 29.48 ± 1.30 31.25 ± 1.69 36.71 ± 1.26 44.78 ± 5.85
Hi-maize RS
0 6.65 ± 9.67 1.61 ± 0.36 0.47 ± 0.57 2.08 ± 0.45 0.00 ± 0.00
12 34.06 ± 8.80 18.49 ± 6.42 22.09 ± 7.67 23.18 ± 7.58 25.59 ± 3.82
24 83.86 ± 32.49 37.77 ± 2.33 31.04 ± 24.20 40.59 ± 9.65 52.40 ± 14.13
Table 9: Propionate µg/g of fermented substrate from individual donors
Substrates Time
(hours)
Donors
# 1 # 2 # 3 # 4 # 5
Blueberry
0 0.34 ± 0.29 0.00 ± 0.00 0.00 ± 0.00 0.63 ± 0.01 0.00 ± 0.00
12 0.54 ± 0.47 0.54 ± 0.54 0.96 ± 0.24 0.80 ± 0.18 0.17 ± 0.30
24 2.47 ± 0.97 3.06 ± 1.31 4.36 ± 0.91 1.27 ± 0.39 3.58 ± 0.40
Black raspberry
0 0.42 ± 0.07 0.00 ± 0.00 0.00 ± 0.00 0.54 ± 0.02 0.00 ± 0.00
12 0.59 ± 0.14 0.84 ± 0.03 0.74 ± 0.07 0.14 ± 0.25 0.84 ± 0.09
24 1.53 ± 0.05 1.72 ± 0.05 1.92 ± 0.07 1.07 ± 0.09 2.73 ± 0.31
Hi-maize RS
0 0.35 ± 0.24 0.00 ± 0.00 0.00 ± 0.00 0.66 ± 0.07 0.00 ± 0.00
12 0.13 ± 0.26 0.27 ± 0.31 0.29 ± 0.35 0.36 ± 0.33 0.11 ± 0.22
24 1.15 ± 0.78 2.18 ± 0.67 3.28 ± 2.11 0.36 ± 0.32 1.26 ± 0.65

39
Table 10: Butyrate µg/g of fermented substrate from individual donors
Substrates Time (hours)
Donors
# 1 # 2 # 3 # 4 # 5
Blueberry
0 0.86 ± 0.14 0.00 ± 0.00 0.00 ± 0.00 0.60 ± 0.05 0.00 ± 0.00
12 0.96 ± 0.32 0.00 ± 0.00 0.00 ± 0.00 0.59 ± 0.06 0.00 ± 0.00
24 1.21 ± 0.33 0.67 ± 0.55 0.00 ± 0.00 0.91 ± 0.15 0.22 ± 0.38
Black raspberry
0 0.75 ± 0.03 0.00 ± 0.00 0.00 ± 0.00 0.56 ± 0.01 0.00 ± 0.00
12 1.07 ± 0.22 0.00 ± 0.00 0.60 ± 0.04 0.00 ± 0.00 0.94 ± 0.07
24 1.09 ± 0.04 0.87 ± 0.09 0.00 ± 0.00 0.61 ± 0.02 0.00 ± 0.00
Hi-maize RS
0 0.95 ± 0.08 0.00 ± 0.00 0.00 ± 0.00 0.61 ± 0.04 0.00 ± 0.00
12 21.33 ± 5.37 0.00 ± 0.00 0.00 ± 0.00 6.76 ± 2.09 3.98 ± 2.54
24 43.60 ± 7.72 2.16 ± 1.19 2.58 ± 2.43 19.00 ± 19.45 11.84 ± 8.02
Pooled samples
The inoculum prepared from mixed pooled samples resulted in a significantly
different SCFA profile during fermentation than observed for individual inocula. As
shown in table 11, for pooled non-fortified diet, there is increase in all the SCFAs during
the fermentation period. The highest concentration of short chain fatty acids (acetate
and butyrate) was recorded for the blueberry and hi-maize RS, but the black raspberry
had the smallest for all the fermentation times. While being significantly lower than
acetate, there is still we still increased propionate over the 24 hours fermentation times.
With blueberry and black raspberry pomace; butyrate increased consistently over time,
but less total butyrate was produced over time. It is likely that this is because the berry
pomaces were lower in fermentable carbohydrate than the RS. For the RS fortified diet,
on table 12, the SCFA profile appeared significantly different from the one in the non-
controlled diet. The substrate hi-Maize RS as expected, had good production of SCFAs,
but the gut microbiota became more responsive in the fermentation of other substrate
and which produced more acetate and butyrate compared to the non-fortified diet. The

40
production of acetate for blueberry and black raspberry pomaces were comparable or
even higher than the hi-maize RS ones.
All 3 SCFAs profiles (rats, non-fortified and RS-fortified diets) show significant
differences with the rat fecal inoculum that produced a higher amount of SCFAs.
Table 11 : Short Chain Fatty Acid Profile for pooled samples - Non-fortified diet
Substrates Time (hours)
short chain fatty acids (µg/g of fermented substrate)
Acetate Propionate Butyrate
Blueberry
0 5.10 ± 0.98 0.00 ± 0.00 0.00 ± 0.00
12 43.04 ± 6.63 0.65 ± 1.10 0.11 ± 0.33
24 59.15 ± 4.89 11.63 ± 6.69 1.19 ± 1.06
Black raspberry
0 6.88 ± 0.89 0.00 ± 0.00 0.63 ± 0.92
12 31.95 ± 6.02 0.57 ± 0.44 0.14 ± 0.21
24 33.52 ± 2.99 1.71 ± 0.65 0.34 ± 0.32
Hi-maize RS
0 0.00 ± 0.00 0.00 ± 0.00 0.63 ± 0.73
12 38.70 ± 11.73 1.17 ± 1.04 12.65 ± 8.18
24 68.22 ± 21.70 3.50 ± 2.07 24.71 ± 18.54
Table 12 : Short Chain Fatty Acid Profile for pooled samples - RS Fortified diet
Substrates Time (hours)
short chain fatty acids (µg/g of fermented substrate)
Acetate Propionate Butyrate
Blueberry
0 0.00 ± 0.00 0.00 ± 0.00 1.76 ± 2.73
12 116.10 ± 100.86 1.80 ± 2.80 0.00 ± 0.00
24 157.02 ± 105.93 8.21 ± 9.07 1.44 ± 2.23
Black raspberry
0 15.17 ± 21.03 0.00 ± 0.00 16.75 ± 5.56
12 227.44 ± 182.95 0.00 ± 0.00 21.46 ± 4.59
24 285.70 ± 183.43 0.00 ± 0.00 4.98 ± 1.87
Hi-maize RS
0 0.00 ± 0.00 0.00 ± 0.00 0.00 ± 0.00
12 77.16 ± 60.14 0.00 ± 0.00 11.80 ± 13.84
24 115.72 ± 77.78 2.42 ± 3.34 20.55 ± 16.57

41
DISCUSSION
The objective of the study was the utilization of a developed in-vitro model
capable of mimicking the gut fermentation of undigested carbohydrates and also the
assessment of the fermentability of dietary fibers present in the black raspberry and
blueberry pomaces through the model. Our expectation for the study was to develop
and perfect a system capable of mimicking the digestion of food products and the in
vitro colonic fermentation of undigested dietary fiber. The system will also allow us to
assess the fermentability of dietary fibers in food products and difference between the
individual microbiota.
CARBOHYDRATE ANALYSIS
The analysis of the dried pomaces from the blueberry and black raspberry
determined a composition of 70-90% dietary fiber and included low levels of phenolic
compounds, proteins and others carbohydrates. The concentration of nutrients and
carbohydrates remaining in the pomace can vary significantly between different of the
species of cane berry fruits, but also varies due to processing and juice pressing
methods (Goni et al., 2007, Silva et al., 2005). Food components such as sugars,
proteins and lipids, even though present in pomaces in very small amounts, may
influence the fermentation process, however, those nutrients were removed through the
pre-digestion process. The chemical composition of the fiber and the presence of other
compounds are a factor in the fermentation process, causing the fibers to react
differently from one source to another. The fermentability of dietary fibers in the gut may
be dependent on the linkages (α-1,4 and β-1,4 glycosidic bonds, and β-glucan bonds)
which vary in different type of dietary fiber.

42
MICROBIAL FERMENTATION
In a previous study (unpublished data) the effects of RS on the gut microbiota
was assessed using an animal model and the results showed that the microbial
population was favorable in butyrate formation. Lactobacillus spp Bifidobacterium spp,
Clostridial clusters IV and XIVa & b and Bacteroides in the cecum of the rats fed an RS
diet were significantly higher than those from the cecum of rats fed an energy control
diet. Another animal study conducted by Keenan et al (2006), where rats were fed an
RS diet, had a lower pH and significantly higher SCFA concentration compared to rats
fed the control diet (Keenan et al., 2006). A study done with pigs fed hi-amylose
starches showed that the animal fed 85% amylose starch had the fecal pH drop by one
unit compared to the fecal pH of those fed 50% amylose starch (Bird et al., 2007).
These results are comparable to the data presented in this study where the Hi-maize
RS control substrate had a lower pH and higher SCFA levels in all individual and pooled
samples when compared to the berry pomaces.
The second factor to consider during fermentation is the diversity of microflora
population found in individuals. The human colon is host to more than 500 species of
bacteria and each bacterial population differs from one individual to another (Turroni et
al., 2008, Xu and Gordon, 2003). The difference between each individual can be
identified by the resulting fermentation by-products.
PH DETERMINATION
The pH is an important measurement in the fermentation because it is an
indicator of microflora growth. In many species, the rate of fermentation can be
controlled by the pH. For example, an increase in the rate of fermentation corresponded
to the lowering of the gut pH while inhibiting metabolism of lactate (McOrist et al., 2011).

43
Research conducted by Walker et al, showed that during anaerobic fermentation, a low
pH of 5.5 produced a higher level of butyrate compared to samples with a pH of 6.0
(Walker et al., 2005). Likewise, a study on the effects of the pH on anaerobic
fermentation showed that, in a pH environment below 5, methanogenic activities are
inhibited while yielding butyrate as the main by-product (Flegal et al., 2001).
As expected in this study, in all individual or pooled samples, the HI-maize
controls showed that lower the pH gets, the higher the amount of SCFAs produced. Hi-
maize RS substrates had a lower reduction in the pH for each pull time. When
compared to the berry pomaces, the pH did not significantly change after 12 hours.
There was a reduction in pH with both the pre-digested blueberry and black raspberry
pomaces, but they did not reach the pH of 6.0 that was measured with the Hi-Maize RS.
SCFAS ANALYSIS
Bacterial fermentation is dependent on the conditions that can generate several
pathways to yield different compounds as end products such as SCFAs (acetate,
propionate, butyrate), lactate, formate, hydrogen and carbon dioxide (Cole et al., 2005,
Louis and Flint, 2009). The production of SCFAs with the rat fecal inoculum did not
correlate with the pH with the black raspberry and blueberry pomaces. In comparison to
the human fecal inoculum, the rat’s showed higher SCFAs. The presence of other food
components beside the fibers in the pomaces which did not go through the enzymatic
pre-digestion may have played an important role in the higher amount of SCFAs. When
monosaccharides are readily available, they are used by anaerobic bacteria before
processing of the oligo and polysaccharides. With the individual inoculum used, there
was a higher production of acetate with the resistant starch as the substrate. The berry
pomace substrates produced different SCFAs and fermentation patterns. Overall, the

44
Hi-maize RS produced more acetate, propionate and butyrate than the berry pomaces
for the individuals.
The resident microflora present in each individual was shown by the varied SCFA
profile from each donor. The presence and the growth of bacteria such as Bacteroides,
Bifidobacteria, Ruminococci, Eubacteria, or Clostridia and their anaerobic fermentation
of dietary fibers can produce different pH levels. A pH reduction can selectively facilitate
the growth of butyrigenic producing bacteria (Macfarlane and Macfarlane, 1993,
Palframan et al., 2002).
There were significant differences in SCFAs during the fermentation between the
rats, non-fortified diet and the RS-fortified diets. In the non-fortified diets, the ratio of
produced acetate came up significantly higher than butyrate and propionate whereas, in
the RS-fortified diets, the produced butyrate was comparable to the acetate. Similar
observations have been seen in a study conducted by Belenguer et al., where some
bacteria produced butyrate in the gut ecosystem by the consumption of the acetate and
lactate end products of fermentation in addition cross-feeding and partial breakdown of
other end products (Belenguer et al., 2006). The two pathways, “pyruvate to butyrate”
and “acetate to butyrate” through the help of butyrate CoA: acetate CoA transferase
could have caused of the higher amount of the butyrate in this case (Duncan et al.,
2004). It has been shown by Duncan et al. that strains of butyrate-producing bacteria
such as F. prausnitzii, which constitute about 15% of the human fecal microflora, require
an acetate rich environment for growth, and about 50% of the butyrate producing strains
proved to have net acetate consumption (Duncan et al., 2002b). A diet such as RS can
be a way to induce an increase and a switch of the microbial population of butyrigenic
bacteria (McOrist et al., 2011).

45
SUMMARY AND CONCLUSION
Dietary fibers are defined as carbohydrates or complexes that do not get broken
down by the enzymes present in the digestive tract and do not get absorbed in the small
intestine. The gut ecosystem is comprised of several types of bacteria which help
metabolize these food components that escape digestion. These non-digestive
components are mainly grouped as prebiotics and serve as nutrient sources for the
bacteria which metabolize them through the anaerobic fermentation taking place in the
large intestine. The short chain fatty acids (SCFAs) such as butyrate propionate and
acetate are the major by-products of this fermentation process. SCFAs are beneficial to
human health.
The anaerobic fermentation process used in our experiment was designed to
completely mimic the in vivo digestion in the large intestine with in vitro fermentation of
non-digestible carbohydrates in anaerobic conditions.
Hi-maize RS, blueberry pomace and black raspberry pomace were used to
assess the individuality and the fermentability of the microflora of each donor. This
individuality was indicated by the differences in the pH and the amount of SCFAs
produced from each substrate for each donor. Hi-Maize RS showed a better response
in the production of acetate and butyrate with higher production of propionate for the
blueberry pomace and black raspberry pomace.
The prepared pooled inoculates produced lower pHs during the fermentation
process. The production of SCFAs was much higher in pooled samples compared to the
individual samples. After mixing the RS fortified diets, the microflora became more
proficient of fermentation. The berry pomaces using the RS-fecal inoculum fermented
significantly better compared to the non-fortified diet. Even though, the berry pomaces

46
substrates’ fermentability was higher, the hi-maize RS did not show any significant
difference between the two diets for the 24 hours period. The SD rats, being on a high
RS diet allowed them to development a microbiota capable of fermentation of dietary
fibers and better production of SCFAs. Using their fecal samples to make the bacteria
inoculum in the in vitro model led to a greater SCFAs production, even for himaize RS.
We could conclude that dietary fibers, when put through the system will ferment
and produce SCFAs. The fermentability of a fiber depends on its chemical structure and
on the microflora available for the breakdown of that substrate. Every individual has a
specific native microflora and will ferment differently from one another. The
consumption of RS for a prolonged period causes the gut microbiota to be able to
produce more SCFAs and can aid in the fermentability of other sources of fiber.

47
REFERENCES
Adams, S. H., C. Lei, C. M. Jodka, S. E. Nikoulina, J. A. Hoyt, B. Gedulin, C. M. Mack, and E. S. Kendall. 2006. PYY[3-36] administration decreases the respiratory quotient and reduces adiposity in diet-induced obese mice. J Nutr 136(1):195-201.
Adams, S. H., W. B. Won, S. E. Schonhoff, A. B. Leiter, and J. R. Paterniti. 2004. Effects of peptide YY[3-36] on short-term food intake in mice are not affected by prevailing plasma ghrelin levels. Endocrinology 145(15284202):4967-4975.
Anderson, J. W., P. Baird, R. H. Davis Jr, S. Ferreri, M. Knudtson, A. Koraym, V. Waters, and C. L. Williams. 2009. Health benefits of dietary fiber. Nutrition reviews 67(4):188-205.
Aparicio-Saguilán, A., F. Gutiérrez-Meraz, F. J. García-Suárez, J. Tovar, and L. A. Bello-Pérez. 2008. Physicochemical and Functional Properties of Cross-linked Banana Resistant Starch. Effect of Pressure Cooking. Starch - Stärke 60(6):286-291.
Apovian, C. M. 2010. The causes, prevalence, and treatment of obesity revisited in 2009: what have we learned so far? American journal of clinical nutrition AJN 91(1):277s-279s.
Araya-Kojima, T., N. Ishibashi, S. Shimamura, K. Tanaka, and H. Takahashi. 1995. Identification and molecular analysis of Lactococcus lactis rpoD operon. Biosci Biotechnol Biochem 59(7765979):73-77.
Asa Henningsson, I. B. a. M. N. 2001. Short-chain fatty acid formation at fermentation of indigestible carbohydrates. Food & Nutrition Research 45:165-168.
Asp, N. G. 1992. Resistant starch : proceedings from the 2nd plenary meeting of EURESTA : European Flair Concerted Action no. 11 (Cost 911) physiological implications of the consumption of resistant starch in man / edited by Nils-George Asp. in European journal of clinical nutrition ; v. 46, suppl. 2. London : Dept. of Human Nutrition, St. Bartholomew's Hospital Medical College, [1992].
Backhed, F., D. A. Peterson, J. I. Gordon, R. E. Ley, and J. L. Sonnenburg. 2005. Host-bacterial mutualism in the human intestine. Science 307(5717):1915-1920.
Belenguer, A., S. H. Duncan, A. G. Calder, G. Holtrop, P. Louis, G. E. Lobley, and H. J. Flint. 2006. Two routes of metabolic cross-feeding between Bifidobacterium adolescentis and butyrate-producing anaerobes from the human gut. Appl Environ Microbiol 72(5):3593-3599.
Bird, A. R., I. L. Brown, and D. L. Topping. 2000. Starches, resistant starches, the gut microflora and human health. Curr Issues Intest Microbiol 1(11709851):25-37.
Bird, A. R., D. L. Topping, I. Brown, and M. Vuaran. 2007. Two high-amylose maize starches with different amounts of resistant starch vary in their effects on

48
fermentation, tissue and digesta mass accretion, and bacterial populations in the large bowel of pigs. British journal of nutrition 97(1):134-144.
Boey, D., L. Heilbronn, A. Sainsbury, R. Laybutt, A. Kriketos, H. Herzog, and L. V. Campbell. 2006a. Low serum PYY is linked to insulin resistance in first-degree relatives of subjects with type 2 diabetes. Neuropeptides 40(17045646):317-324.
Boey, D., S. Lin, T. Karl, P. Baldock, N. Lee, R. Enriquez, M. Couzens, K. Slack, R. Dallmann, A. Sainsbury, and H. Herzog. 2006b. Peptide YY ablation in mice leads to the development of hyperinsulinaemia and obesity. Diabetologia 49(16680491):1360-1370.
Boey, D., A. Sainsbury, and H. Herzog. 2007. The role of peptide YY in regulating glucose homeostasis. Peptides 28(17210210):390-395.
Bohorquez, D. V., R. Chandra, L. A. Samsa, S. R. Vigna, and R. A. Liddle. 2011. Characterization of basal pseudopod-like processes in ileal and colonic PYY cells. J Mol Histol 42(1):3-13.
Boisen, S. and B. O. Eggum. 1991. Critical evaluation of in vitro methods for estimating digestibility in simple-stomach animals. Nutr Res Rev 4(1):141-162.
Bosch, G., A. F. B. v. d. Poel, G. P. J. Janssens, W. H. Hendriks, A. Verbrugghe, M. Hesta, and J. J. Holst. 2009. The effects of dietary fibre type on satiety-related hormones and voluntary food intake in dogs [electronic resource]. British journal of nutrition 102(2):318-325.
Brambilla, A., D. Torreggiani, G. Bertolo, and R. Lo Scalzo. 2008. Steam-Blanched Highbush Blueberry (Vaccinium corymbosum L.) Juice: Phenolic Profile and Antioxidant Capacity in Relation to Cultivar Selection [electronic resource]. Journal of Agricultural and Food Chemistry 56(8):2643-2648.
Brouns, F., E. Arrigoni, A. M. Langkilde, I. Verkooijen, C. Fässler, H. Andersson, B. Kettlitz, M. van Nieuwenhoven, H. Philipsson, and R. Amadò. 2007. Physiological and Metabolic Properties of a Digestion-Resistant Maltodextrin, Classified as Type 3 Retrograded Resistant Starch. Journal of Agricultural and Food Chemistry 55(4):1574-1581.
Brown, I., M. Warhurst, J. Arcot, M. Playne, R. J. Illman, and D. L. Topping. 1997. Fecal numbers of bifidobacteria are higher in pigs fed Bifidobacterium longum with a high amylose cornstarch than with a low amylose cornstarch. J Nutr 127(9278566):1822-1827.
Buddington, R. K. and E. Weiher. 1999. The application of ecological principles and fermentable fibers to manage the gastrointestinal tract ecosystem. Journal of nutrition 129(7S):1446s-1450s.
Burton-Freeman, B. 2000. Dietary fiber and energy regulation. Journal of nutrition 130(2S):272s-275s.

49
Campbell, J. M., G. C. Fahey, Jr., and B. W. Wolf. 1997. Selected indigestible oligosaccharides affect large bowel mass, cecal and fecal short-chain fatty acids, pH and microflora in rats. J Nutr 127(1):130-136.
Cani, P. D., J. Amar, M. A. Iglesias, M. Poggi, C. Knauf, D. Bastelica, A. M. Neyrinck, F. Fava, K. M. Tuohy, C. Chabo, A. Waget, E. Delmee, B. Cousin, T. Sulpice, B. Chamontin, J. Ferrieres, J.-F. Tanti, G. R. Gibson, L. Casteilla, N. M. Delzenne, M. C. Alessi, and R. Burcelin. 2007a. Metabolic endotoxemia initiates obesity and insulin resistance. Diabetes 56(17456850):1761-1772.
Cani, P. D. and N. M. Delzenne. 2007. Gut microflora as a target for energy and metabolic homeostasis. Curr Opin Clin Nutr Metab Care 10(18089955):729-734.
Cani, P. D., C. Dewever, and N. M. Delzenne. 2004. Inulin-type fructans modulate gastrointestinal peptides involved in appetite regulation (glucagon-like peptide-1 and ghrelin) in rats. The British journal of nutrition 92(3):521-526.
Cani, P. D., S. Hoste, Y. Guiot, and N. M. Delzenne. 2007b. Dietary non-digestible carbohydrates promote L-cell differentiation in the proximal colon of rats. The British journal of nutrition 98(1):32-37.
Cani, P. D., A. M. Neyrinck, N. Maton, and N. M. Delzenne. 2005. Oligofructose promotes satiety in rats fed a high-fat diet: involvement of glucagon-like Peptide-1. Obes Res 13(15976142):1000-1007.
Chabannes, M., K. Ruel, A. Yoshinaga, B. Chabbert, A. Jauneau, J.-P. Joseleau, and A.-M. Boudet. 2001. In situ analysis of lignins in transgenic tobacco reveals a differential impact of individual transformations on the spatial patterns of lignin deposition at the cellular and subcellular levels. The Plant Journal 28(3):271-282.
Chen, H.-L., Y.-C. Wang, and Y.-M. Lin. 2010. Comparative Effects of Cellulose and Soluble Fibers (Pectin, Konjac Glucomannan, Inulin) on Fecal Water Toxicity toward Caco-2 Cells, Fecal Bacteria Enzymes, Bile Acid, and Short-Chain Fatty Acids [electronic resource]. Journal of Agricultural and Food Chemistry 58(18):10277–10281-10277–10281.
Cheng, H. H. and M. H. Lai. 2000. Fermentation of resistant rice starch produces propionate reducing serum and hepatic cholesterol in rats. J Nutr 130(8):1991-1995.
Cherbut, C. 2002. Inulin and oligofructose in the dietary fibre concept. British journal of nutrition 87(suppl.2):s159-s162.
Cole, T. J., M. Heo, A. Pietrobelli, and M. S. Faith. 2005. What is the best measure of adiposity change in growing children: BMI, BMI %, BMI z-score or BMI centile? (Erratum: 2005 June, v. 59, no. 6, p. 807.). European journal of clinical nutrition 59(3):419-425.

50
Cook, Z., S. Kirk, S. Lawrenson, and S. Sandford. 2005. Use of BMI in the assessment of undernutrition in older subjects: reflecting on practice. Proceedings of the Nutrition Society 64(3):313-317.
Cummings, J. H. and G. T. Macfarlane. 1991. The control and consequences of bacterial fermentation in the human colon. The Journal of applied bacteriology 70(6):443-459.
Cummings, J. H., G. T. Macfarlane, and H. N. Englyst. 2001. Prebiotic digestion and fermentation. Am J Clin Nutr 73(2 Suppl):415S-420S.
de Graaf, A. A. and K. Venema. 2007. Gaining Insight into Microbial Physiology in the Large Intestine: A Special Role for Stable Isotopes. Pages 73-314 in Advances in Microbial Physiology. Vol. Volume 53. K. P. Robert, ed. Academic Press.
Du, H., G. Masala, B. Buijsse, H. Boeing, D. Palli, E. J. M. Feskens, W. H. M. Saris, T. I. A. S©ırensen, M. U. Jakobsen, N. G. Forouhi, H. C. Boshuizen, D. L. van der A, N. J. Wareham, K. Overvad, A. Tj©ınneland, and J. Halkj©Œr. 2010. Dietary fiber and subsequent changes in body weight and waist circumference in European men and women. American journal of clinical nutrition AJN 91(2):329-336.
Duncan, S. H., A. Barcenilla, C. S. Stewart, S. E. Pryde, and H. J. Flint. 2002a. Acetate utilization and butyryl coenzyme A (CoA):acetate-CoA transferase in butyrate-producing bacteria from the human large intestine. Appl Environ Microbiol 68(12324374):5186-5190.
Duncan, S. H., S. E. Pryde, H. J. Flint, A. Barcenilla, and C. S. Stewart. 2002b. Acetate utilization and butyryl coenzyme A (CoA):acetate-CoA transferase in butyrate-producing bacteria from the human large intestine. Applied and environmental microbiology 68(10):5186-5190.
Duncan, S. H., C. S. Stewart, H. J. Flint, A. G. Calder, G. Holtrop, and G. E. Lobley. 2004. Contribution of acetate to butyrate formation by human faecal bacteria. British journal of nutrition 91(6):915-923.
Eastwood, M. A. and E. R. Morris. 1992. Physical properties of dietary fiber that influence physiological function: a model for polymers along the gastrointestinal tract. American journal of clinical nutrition 55(2):436-442.
Falony, G., A. Vlachou, K. Verbrugghe, and L. De Vuyst. 2006. Cross-feeding between Bifidobacterium longum BB536 and acetate-converting, butyrate-producing colon bacteria during growth on oligofructose. Applied and environmental microbiology 72(12):7835-7841.
Finkelstein, E. A., J. G. Trogdon, J. W. Cohen, and W. Dietz. 2009. Annual Medical Spending Attributable To Obesity: Payer-And Service-Specific Estimates. Health Affairs 28(5):w822-w831.

51
Flegal, K. M., M. D. Carroll, B. K. Kit, and C. L. Ogden. 2012. Prevalence of obesity and trends in the distribution of body mass index among US adults, 1999-2010. JAMA : the journal of the American Medical Association 307(5):491-497.
Flegal, K. M., C. L. Ogden, R. Wei, R. L. Kuczmarski, and C. L. Johnson. 2001. Prevalence of overweight in US children: comparison of US growth charts from the Centers for Disease Control and Prevention with other reference values for body mass index. Am J Clin Nutr 73(6):1086-1093.
Fooks, L. J. and G. R. Gibson. 2002. Probiotics as modulators of the gut flora. British journal of nutrition 88(Suppl.1):s39-s49.
Fuller, R. 1986. Probiotics. Symposium series - Society for Applied Bacteriology 15(15):1s-7s.
Fuller, R. 1989. Probiotics in man and animals. Journal of applied bacteriology 66(5):365-378.
Gibson G R, R. M. B. 1995. Dietary modulation of the human colonie microbiota: introducing the concept of prebiotics. Journal of nutrition 125:1401-1412.
Gibson, G. R., E. R. Beatty, X. Wang, and J. H. Cummings. 1995. Selective stimulation of bifidobacteria in the human colon by oligofructose and inulin. Gastroenterology 108(4):975-982.
Gibson, G. R. and A. L. McCartney. 1998. Modification of the gut flora by dietary means. Biochemical Society transactions 26(2):222-228.
Gibson, G. R., H. M. Probert, J. V. Loo, R. A. Rastall, and M. B. Roberfroid. 2004. Dietary modulation of the human colonic microbiota: updating the concept of prebiotics. Nutr Res Rev 17(2):259-275.
Goni, I., A. Brenes, C. Centeno, A. Viveros, F. Saura-Calixto, A. Rebole, I. Arija, and R. Estevez. 2007. Effect of dietary grape pomace and vitamin E on growth performance, nutrient digestibility, and susceptibility to meat lipid oxidation in chickens. Poult Sci 86(3):508-516.
Goni, I., L. Garcia-Diz, E. Manas, and F. Saura-Calixto. 1996. Analysis of resistant starch: a method for foods and food products. Food chemistry 56(4):445-449.
Gotthardt, M., G. Lalyko, J. van Eerd-Vismale, B. Keil, T. Schurrat, M. Hower, P. Laverman, T. M. Behr, O. C. Boerman, B. Goke, and M. Behe. 2006. A new technique for in vivo imaging of specific GLP-1 binding sites: first results in small rodents. Regul Pept 137(16930741):162-167.
Gropper, S. A. S. and J. L. Smith. 2013. Advanced nutrition and human metabolism / Sareen S. Gropper, Jack L. Smith. Vol. 6th ed. Belmont, CA : Wadsworth/Cengage Learning, c2013.

52
Hagopian, H. K., M. G. Riggs, L. A. Swartz, and V. M. Ingram. 1977. Effect of n-butyrate on DNA synthesis in chick fibroblasts and HeLa cells. Cell 12(3):855-860.
Hernot, D. C., T. W. Boileau, L. L. Bauer, I. S. Middelbos, M. R. Murphy, K. S. Swanson, and G. C. Fahey, Jr. 2009. In vitro fermentation profiles, gas production rates, and microbiota modulation as affected by certain fructans, galactooligosaccharides, and polydextrose. J Agric Food Chem 57(4):1354-1361.
Hernot, D. C., T. W. Boileau, L. L. Bauer, K. S. Swanson, and G. C. Fahey, Jr. 2008. In vitro digestion characteristics of unprocessed and processed whole grains and their components. J Agric Food Chem 56(22):10721-10726.
Hijova, E. and A. Chmelarova. 2007. Short chain fatty acids and colonic health. Bratisl Lek Listy 108(8):354-358.
Hosseini, E., C. Grootaert, W. Verstraete, and T. Van de Wiele. 2011. Propionate as a health-promoting microbial metabolite in the human gut. Nutrition reviews 69(5):245-258.
Institute of Medicine . Standing Committee on the Scientific Evaluation of Dietary Reference, I. and M. Institute of Medicine . Panel on. 2005. Dietary reference intakes for energy, carbohydrate, fiber, fat, fatty acids, cholesterol, protein, and amino acids / Panel on Macronutrients, Panel on the Definition of Dietary Fiber, Subcommittee on Upper Reference Levels of Nutrients, Subcommittee on Interpretation and Uses of Dietary Reference Intakes, and the Standing Committee on the Scientific Evaluation of Dietary Reference Intakes, Food and Nutrition Board ; Institute of Medicine of the National Academies. Washington, D.C. : National Academies Press, c2005.
Isken, F., S. Klaus, M. Osterhoff, A. F. Pfeiffer, and M. O. Weickert. 2010. Effects of long-term soluble vs. insoluble dietary fiber intake on high-fat diet-induced obesity in C57BL/6J mice. J Nutr Biochem 21(4):278-284.
Ito, M., M. Kimura, Y. Deguchi, A. Miyamori-Watabe, T. Yajima, and T. Kan. 1993. Effects of transgalactosylated disaccharides on the human intestinal microflora and their metabolism. Journal of nutritional science and vitaminology 39(3):279-288.
Itoh, T., Y. Fujimoto, Y. Kawai, T. Toba, and T. Saito. 1995. Inhibition of food-borne pathogenic bacteria by bacteriocins from Lactobacillus gasseri. Lett Appl Microbiol 21(7576495):137-141.
Keenan, M. J., J. Zhou, K. L. McCutcheon, A. M. Raggio, H. G. Bateman, E. Todd, C. K. Jones, R. T. Tulley, S. Melton, R. J. Martin, and M. Hegsted. 2006. Effects of resistant starch, a non-digestible fermentable fiber, on reducing body fat. Obesity (Silver Spring) 14(9):1523-1534.
Khanal, R. C., R. L. Prior, C. R. Brownmiller, and L. R. Howard. 2009. Influence of Extrusion Processing on Procyanidin Composition and Total Anthocyanin Contents of Blueberry Pomace [electronic resource]. Journal of food science an official publication of the Institute of Food Technologists 74(2):h52-h58.
53
King, D. E., A. G. Mainous Iii, and C. A. Lambourne. 2012. Trends in Dietary Fiber Intake in the United States, 1999-2008. Journal of the Academy of Nutrition and Dietetics 112(5):642-648.
Kreymann, B., G. Williams, M. A. Ghatei, and S. R. Bloom. 1987. Glucagon-like peptide-1 7-36: a physiological incretin in man. Lancet 2(2890903):1300-1304.
Kreymann, B., Y. Yiangou, S. Kanse, G. Williams, M. A. Ghatei, and S. R. Bloom. 1988. Isolation and characterisation of GLP-1 7-36 amide from rat intestine. Elevated levels in diabetic rats. FEBS Lett 242(3203741):167-170.
Kurokawa, K., T. Itoh, T. Kuwahara, K. Oshima, H. Toh, A. Toyoda, H. Takami, H. Morita, V. K. Sharma, T. P. Srivastava, T. D. Taylor, H. Noguchi, H. Mori, Y. Ogura, D. S. Ehrlich, K. Itoh, T. Takagi, Y. Sakaki, T. Hayashi, and M. Hattori. 2007. Comparative metagenomics revealed commonly enriched gene sets in human gut microbiomes. DNA research : an international journal for rapid publication of reports on genes and genomes 14(4):169-181.
Lanza, E., D. Y. Jones, G. Block, and L. Kessler. 1987. Dietary fiber intake in the US population. The American Journal of Clinical Nutrition 46(5):790-797.
Le Leu, R. K., Y. Hu, and G. P. Young. 2002. Effects of resistant starch and nonstarch polysaccharides on colonic luminal environment and genotoxin-induced apoptosis in the rat. Carcinogenesis 23(5):713-719.
Leser, T. D. and L. Molbak. 2009. Better living through microbial action: the benefits of the mammalian gastrointestinal microbiota on the host. Environ Microbiol 11(19737302):2194-2206.
Louis, P. and H. J. Flint. 2009. Diversity, metabolism and microbial ecology of butyrate-producing bacteria from the human large intestine [electronic resource]. FEMS microbiology letters 294(1):1-8.
Louis, P., K. P. Scott, S. H. Duncan, and H. J. Flint. 2007. Understanding the effects of diet on bacterial metabolism in the large intestine. J Appl Microbiol 102(17448155):1197-1208.
Macfarlane, G. T. and J. H. Cummings. 1999. Probiotics and Prebiotics: Can Regulating the Activities of Intestinal Bacteria Benefit Health? BMJ: British Medical Journal (7189):999.
Macfarlane, G. T. and H. N. Englyst. 1986. Starch utilization by the human large intestinal microflora. Journal of Applied Microbiology 60(3):195-201.
Macfarlane, G. T. and S. Macfarlane. 1993. Factors affecting fermentation reactions in the large bowel. Proceedings of the Nutrition Society 52(2):367-373.

54
Macfarlane, G. T., H. Steed, and S. Macfarlane. 2008. Bacterial metabolism and health-related effects of galacto-oligosaccharides and other prebiotics. J Appl Microbiol 104(2):305-344.
Mallillin, A. C., K. Dagbay, A. S. Loyola, T. P. Trinidad, and R. Raterta. 2008. Dietary fibre and fermentability characteristics of root crops and legumes (Erratum: 2008 Sept., v. 100, no. 3, p. 685.). British journal of nutrition 100(3):485-488.
Marlett, J. A., M. I. McBurney, and J. L. Slavin. 2002. Position of the American Dietetic Association: health implications of dietary fiber. J Am Diet Assoc 102(7):993-1000.
Matsuki, T., K. Watanabe, J. Fujimoto, T. Takada, and R. Tanaka. 2004. Use of 16S rRNA gene-targeted group-specific primers for real-time PCR analysis of predominant bacteria in human feces. Appl Environ Microbiol 70(12):7220-7228.
McOrist, A. L., G. C. Abell, C. Cooke, and K. Nyland. 2008. Bacterial population dynamics and faecal short-chain fatty acid (SCFA) concentrations in healthy humans. The British journal of nutrition 100(1):138-146.
McOrist, A. L., R. B. Miller, A. R. Bird, J. B. Keogh, M. Noakes, D. L. Topping, and M. A. Conlon. 2011. Fecal butyrate levels vary widely among individuals but are usually increased by a diet high in resistant starch. J Nutr 141(5):883-889.
Meyer, D., S. Bayarri, A. Tárrega, and E. Costell. 2011. Inulin as texture modifier in dairy products. Food hydrocolloids 25(8):1881-1890.
Miller, T. L. and M. J. Wolin. 1996. Pathways of acetate, propionate, and butyrate formation by the human fecal microbial flora. Applied and environmental microbiology 62(5):1589-1592.
Miyazato, S., H. Tagami, H. Hara, C. Nakagawa, and Y. Kishimoto. 2010. Promotive effects of resistant maltodextrin on apparent absorption of calcium, magnesium, iron and zinc in rats [electronic resource]. European journal of nutrition 49(3):165-171.
Morelli, L. 2008. Postnatal Development of Intestinal Microflora as Influenced by Infant Nutrition. The Journal of Nutrition 138(9):1791S-1795S.
Näslund, E., J. Bogefors, S. Skogar, P. Grybäck, H. Jacobsson, J. J. Holst, and P. M. Hellström. 1999. GLP-1 slows solid gastric emptying and inhibits insulin, glucagon, and PYY release in humans. American Journal of Physiology - Regulatory, Integrative and Comparative Physiology 277(3):R910-R916.
Ogden, C. L., M. D. Carroll, B. K. Kit, and K. M. Flegal. 2012. Prevalence of obesity and trends in body mass index among US children and adolescents, 1999-2010. JAMA : the journal of the American Medical Association 307(5):483-490.

55
Palframan, R. J., G. R. Gibson, and R. A. Rastall. 2002. Effect of pH and dose on the growth of gut bacteria on prebiotic carbohydrates in vitro. Anaerobe 8(5):287-292.
Parker, R. B. 1974. Probiotics. The other half of the antibiotics story. Animal Nutr Health 29:4.
Parrett, A. M., C. A. Edwards, and E. Lokerse. 1997. Colonic fermentation capacity in vitro: development during weaning in breast-fed infants is slower for complex carbohydrates than for sugars. The American Journal of Clinical Nutrition 65(4):927-933.
Perez-Tilve, D., R. Nogueiras, F. Mallo, S. C. Benoit, and M. Tschoep. 2006. Gut hormones ghrelin, PYY, and GLP-1 in the regulation of energy balance [corrected] and metabolism. Endocrine 29(16622293):61-71.
Pitcher, M. C. and J. H. Cummings. 1996. Hydrogen sulphide: a bacterial toxin in ulcerative colitis? Gut 39(8881797):1-4.
Pryde, S. E., C. S. Stewart, H. J. Flint, S. H. Duncan, and G. L. Hold. 2002. The microbiology of butyrate formation in the human colon. Federation of European Microbiological Societies. FEMS microbiology letters 217(2):133-139.
Rajilic-Stojanovic, M., H. Smidt, and W. M. de Vos. 2007. Diversity of the human gastrointestinal tract microbiota revisited. Environ Microbiol 9(9):2125-2136.
Ratnayake, W. S. and D. S. Jackson. 2008. Thermal behavior of resistant starches RS 2, RS 3, and RS 4. Journal of food science 73(5):C356-366.
Reed, M. 2012. Development and utilization of resistant starch in cooked rice grains and breads. Page 116 in Graduate Theses and Dissertations. .
Sato, T., K. Matsumoto, T. Okumura, W. Yokoi, E. Naito, Y. Yoshida, K. Nomoto, M. Ito, and H. Sawada. 2008. Isolation of lactate-utilizing butyrate-producing bacteria from human feces and in vivo administration of Anaerostipes caccae strain L2 and galacto-oligosaccharides in a rat model. FEMS Microbiol Ecol 66(3):528-536.
Saunders, D. R. and J. K. Sillery. 1988. Absorption of triglyceride by human small intestine: dose-response relationships. Am J Clin Nutr 48(4):988-991.
Saura-Calixto, F., I. Goñi, E. Mañas, and R. Abia. 1991. Klason lignin, condensed tannins and resistant protein as dietary fibre constituents: Determination in grape pomaces. Food chemistry 39(3):299-309.
Schrezenmeir, J. and M. de Vrese. 2001. Probiotics, prebiotics, and synbiotics--approaching a definition. American journal of clinical nutrition 73(2S):361s-364s.
Schröder, C., M. Selig, and P. Schönheit. 1994. Glucose fermentation to acetate, CO2 and H2 in the anaerobic hyperthermophilic eubacterium Thermotoga maritima :

56
involvement of the Embden-Meyerhof pathway. Archives of Microbiology 161(6):460-470.
Schwartz, J. and C. Byrd-Bredbenner. 2006. Portion distortion: typical portion sizes selected by young adults. J Am Diet Assoc 106(9):1412-1418.
Schwiertz, A., D. Taras, K. Schafer, S. Beijer, N. A. Bos, C. Donus, and P. D. Hardt. 2010. Microbiota and SCFA in lean and overweight healthy subjects. Obesity (Silver Spring) 18(1):190-195.
Seeram, N. P. 2008. Berry fruits: compositional elements, biochemical activities, and the impact of their intake on human health, performance, and disease. J Agric Food Chem 56(3):627-629.
Senevirathne, R. N. 2010. EFFECT OF RESISTANT STARCH ON MICROBIAL CONTENT OF THE INTESTINAL TRACT. LOUISIANA STATE UNIVERSITY.
Shen, L., M. J. Keenan, R. J. Martin, R. T. Tulley, A. M. Raggio, K. L. McCutcheon, and J. Zhou. 2009. Dietary resistant starch increases hypothalamic POMC expression in rats. Obesity (Silver Spring) 17(18948970):40-45.
Silva, J. L., J. O. Garner, Jr., J. Stojanovic, E. Marroquin, and F. B. Matta. 2005. Physicochemical, carbohydrate and sensory characteristics of highbush and rabbiteye blueberry cultivars. Journal of the science of food and agriculture 85(11):1815-1821.
Slavin, J. and H. Green. 2007. Dietary fibre and satiety [electronic resource]. Nutrition bulletin 32:32-42.
Spinler, J. K., M. Taweechotipatr, C. L. Rognerud, C. N. Ou, S. Tumwasorn, and J. Versalovic. 2008. Human-derived probiotic Lactobacillus reuteri demonstrate antimicrobial activities targeting diverse enteric bacterial pathogens. Anaerobe 14(18396068):166-171.
Su, M. S. and P. J. Chien. 2007. Antioxidant activity, anthocyanins, and phenolics of rabbiteye blueberry (Vaccinium ashei) fluid products as affected by fermentation [electronic resource]. Food chemistry 104(1):182-187.
Su, M. S. and J. L. Silva. 2006. Antioxidant activity, anthocyanins, and phenolics of rabbiteye blueberry (Vaccinium ashei) by-products as affected by fermentation. Food chemistry 97(3):447-451.
Swinburn, B., G. Sacks, and E. Ravussin. 2009. Increased food energy supply is more than sufficient to explain the US epidemic of obesity. The American Journal of Clinical Nutrition 90(6):1453-1456.
Theuwissen, E. and R. P. Mensink. 2008. Water-soluble dietary fibers and cardiovascular disease. Physiol Behav 94(2):285-292.

57
Tlaskalova-Hogenova, H., R. Stepankova, T. Hudcovic, L. Tuckova, B. Cukrowska, R. Lodinova-Zadnikova, H. Kozakova, P. Rossmann, J. Bartova, D. Sokol, D. P. Funda, D. Borovska, Z. Rehakova, J. Sinkora, J. Hofman, P. Drastich, and A. Kokesova. 2004. Commensal bacteria (normal microflora), mucosal immunity and chronic inflammatory and autoimmune diseases. Immunol Lett 93(2-3):97-108.
Topping, D. L. and P. M. Clifton. 2001. Short-Chain Fatty Acids and Human Colonic Function: Roles of Resistant Starch and Nonstarch Polysaccharides. Physiological Reviews 81(3):1031-1064.
Turroni, F., A. Ribbera, E. Foroni, D. van Sinderen, and M. Ventura. 2008. Human gut microbiota and bifidobacteria: from composition to functionality. Antonie van Leeuwenhoek 94(1):35-50.
Valeur, J. and A. Berstad. 2010. Colonic fermentation: a neglected topic in human physiology education. Adv Physiol Educ 34(1):22.
Walker, A. W., S. H. Duncan, E. C. M. Leitch, M. W. Child, and H. J. Flint. 2005. pH and peptide supply can radically alter bacterial populations and short-chain fatty acid ratios within microbial communities from the human colon. Applied and environmental microbiology 71(7):3692-3700.
Wang, J. F., Z. Wang, B. B. Jensen, Y. H. Zhu, and D. F. Li. 2004. In vitro fermentation of various fiber and starch sources by pig fecal inocula. Journal of animal science 82(9):2615-2622.
Wang, X. and G. R. Gibson. 1993. Effects of the in vitro fermentation of oligofructose and inulin by bacteria growing in the human large intestine. The Journal of applied bacteriology 75(8226394):373-380.
Westermann, P., B. K. Ahring, and R. A. Mah. 1989. Acetate Production by Methanogenic Bacteria. Applied and environmental microbiology 55(9):2257-2261.
Wicki, A., D. Wild, D. Storch, C. Seemayer, M. Gotthardt, M. Behe, S. Kneifel, M. J. Mihatsch, J.-C. Reubi, H. R. Macke, and G. Christofori. 2007. [Lys40(Ahx-DTPA-111In)NH2]-Exendin-4 is a highly efficient radiotherapeutic for glucagon-like peptide-1 receptor-targeted therapy for insulinoma. Clin Cancer Res 13(17575235):3696-3705.
Wijnands, M. V. W., M. J. Appel, V. M. H. Hollanders, and R. A. Woutersen. 1999. A comparison of the effects of dietary cellulose and fermentable galacto-oligosaccharide, in a rat model of colorectal carcinogenesis: fermentable fibre confers greater protection than non-fermentable fibre in both high and low fat backgrounds. Carcinogenesis 20(4):651-656.
Woolnough, J. W., J. A. Monro, C. S. Brennan, and A. R. Bird. 2008. Simulating human carbohydrate digestionin vitro: a review of methods and the need for standardisation. International journal of food science & technology 43(12):2245-2256.

58
Xu, J. and J. I. Gordon. 2003. Honor thy symbionts. Proceedings of the National Academy of Sciences 100(18):10452-10459.
Yasuda, K., M. Inui, H. Yukawa, S. Okino, T. Jojima, and M. Suda. 2007. Analyses of the acetate-producing pathways in Corynebacterium glutamicum under oxygen-deprived conditions [electronic resource]. Applied microbiology and biotechnology 77(4):853-860.
Zadernowski, R., J. Nesterowicz, and M. Naczk. 2005. Phenolic acid profiles in some small berries. Journal of Agricultural and Food Chemistry 53(6):2118-2124.
Zhou, J., M. Hegsted, K. L. McCutcheon, M. J. Keenan, X. Xi, A. M. Raggio, and R. J. Martin. 2006. Peptide YY and proglucagon mRNA expression patterns and regulation in the gut. Obesity (Silver Spring) 14(16741270):683-689.
Zhou, J., R. J. Martin, R. T. Tulley, A. M. Raggio, L. Shen, E. Lissy, K. McCutcheon, and M. J. Keenan. 2009. Failure to Ferment Dietary Resistant Starch in Specific Mouse Models of Obesity Results in No Body Fat Loss. Journal of Agricultural and Food Chemistry 57(19):8844-8851.

59
APPENDICES
A. POLYSACCHARIDES KNOWN TO BE DEGRADED BY CERTAIN HUMAN
INTESTINAL BACTERIA*
Bacteria Polysaccharides
Bacteroides Arabinogalactan, pectin, cellulose, xylan, guar gum, mucins, heparin. Chondroitin sulphate, starch gum
arabic, xylan Bifidobacteria Arabinogalactan, pectin, starch, mucin, Ruminococci Mucins, guar gum
Eubacteria Starch, pectin Clostridia Starch, pectin
*Types of bacteria and main polysaccharides they degrades data are from (Macfarlane and Macfarlane, 1993).

60
B. FDA RECOMMENDED DAILY INTAKE/VALUE OF FOOD COMPONENT
Food Component Daily Value
Total Fat 65 grams (g)
Saturated Fat 20 g
Cholesterol 300 milligrams (mg)
Sodium 2,400 mg
Potassium 3,500 mg
Total Carbohydrate 300 g
Dietary Fiber 25 g
Protein 50 g
Vitamin A 5,000 International Units
(IU)
Vitamin C 60 mg
Calcium 1,000 mg
Iron 18 mg
Vitamin D 400 IU
Vitamin E 30 IU
Vitamin K 80 micrograms µg
Thiamin 1.5 mg
Riboflavin 1.7 mg
Niacin 20 mg
Vitamin B6 2 mg
Folate 400 µg
Vitamin B12 6 µg
Biotin 300 µg
Pantothenic acid 10 mg
Phosphorus 1,000 mg
Iodine 150 µg
Magnesium 400 mg
Zinc 15 mg
Selenium 70 µg
Copper 2 mg
Manganese 2 mg
Chromium 120 µg
Molybdenum 75 µg
Chloride 3,400 mg

61
C – SOLUTIONS FOR FIBER ANALYSIS
Neutral Detergent Solution
Reagents
Distilled water (liters) 1.00
Sodium lauryl sulfate, USP (grams) 30.00
Disodium ethylene diamine tetra acetate (EDTA),dihydrate crystal, reagent grade (grams)
18.61
Sodium borate decahydrate, reagent grade (grams) 6.81
Disodium hydrogen phosphate, anhydrous, reagent grade (grams) 4.56
2-ethoxyethanol (ethylene glycol monoethyl ether), purified grade (milliliters) 10.00
Preparation
Put EDTA and Na2B4O7 • 10H2O together in a large beaker, add some of the distilled water, and heat until dissolved; then add to solution containing sodium lauryl sulfate and 2-ethoxyethanol (ethylene glycol monoethyl ether). Put Na2HP04 in beaker, add some of the distilled water, and heat until dissolved; and then add to solution containing other ingredients. Check pH to range 6.9 to 7.1. If solution is properly made, pH adjustment will rarely be required.
Acid Detergent Solution
Reagents
Sulfuric acid, reagent grade standardized to 1N (100=percent assay) (grams)
16.04
Cetyl trimethylammonium bromide (CTAB), technical grade (grams) 20.00
Preparation
Weigh sulfuric acid and make up to volume with distilled water at 20° C. Check normality by titration before addition of detergent. Then add CTAB and stir.

62
VITA
M’famara Goita was born in 1985 in Baton Rouge, Louisiana USA. He received
his primary and secondary educations in Jean Paul II catholic school in Bamako, Mali
W. Africa. He went to high school at “La Chaine Grise Monseigneur Didier de Montclos
de Bamako”, where he received his Bachalaureat in 2002. Two years later, he started
his undergraduate studies at Louisiana State University. He participated in couple of
Research Experience for Undergraduates (REU) programs, then presented his work at
the SERMACS at Memphis, TN in 2008. In 2008, he received his Bachelor of Science
degree in Chemsitry, then he started working as a researcher associate for the
department of food science at LSU.
He started his graduate studies under at Louisiana State University. During his
graduate career, Mfamara worked as a graduate research assistant. He worked in the
development of couple of products included a healthy breakfast bar named “Cocoa
Bleuet”, a Protein ball and Vitamin Candies. He also presented his work at the
Experimental Biology 2012, San Diego, CA.
Mfamara plans to graduate with his Master’s in Food Science with a
concentration in Food Chemistry. Eventually, Mfamara would like to obtain a Doctorate
degree and pursue his professional career in a food manufacturing company.