Quantitative determination of pore and throat parameters ...
Upload
trinhthienCategory
view
223download
4
Determination of a preclinical protocol for
quantitative measurements of perfusion
and permeability in the rat lung using
dynamic contrast enhanced-MRI
Master Thesis in Radiation Physics 09/10
Annie Olsson
Supervisors: Frank Risse
Lars E. Olsson
Imaging centre
AstraZeneca R&D
Mölndal
University of Gothenburg
Department of Radiation Physics
Sahlgrenska Academy

1
ABSTRACT
Quantitative values of pulmonary perfusion and permeability are useful in the diagnostics of
common pulmonary diseases. Furthermore, they can be employed to quantify changes after
therapeutic intervention in preclinical drug research.
These parameters can be measured by dynamic contrast enhanced MRI using an intravenous
injection of a paramagnetic contrast agent. MR imaging of rodents include extra requirements
such as better spatial and temporal resolution. Therefore, protocols for DCE-MRI
measurements of perfusion and permeability in the rat lung were developed in this work.
The contrast agent concentration was optimized for the perfusion protocol. Since the contrast
agent Gd-DTPA has only a linear signal to contrast agent concentration relationship for a
specific range of concentrations, this range was determined for the current situation. The
range was first investigated in vitro and after that linked to the in vivo situation by a
combined experiment placing in vitro samples in FOV during a DCE-MRI measurement in
rat. Unexpected factors affected the combined experiment which consequently motivated a
direct in vivo measurement. The results from the in vivo measurement were largely affected
by inflow and 3D scanning should therefore be used in order to reduce these effects.
However, it was not possible to sample as rapid 3D sequences as needed for the perfusion
measurements with the present technical limitations. Even though it was not feasible to
perform perfusion measurements in this report the major pitfalls in performing pulmonary
perfusion were investigated.
Permeability is a slow process having less demand of good temporal resolution. 3D scanning
was therefore used for the permeability measurements. After the optimization of the
acquisition method, contrast agent concentration and flip angle, the resulting protocol
included an untriggered 3D sequence with flip angle of 20 º and contrast agent concentration
of 0.4 mmol/ml. A pilot study investigating changes in pulmonary permeability between
healthy rats and rats with lung inflammation was performed using the resulting permeability
protocol. It showed that the protocol was successfully implemented with regards to
acquisition method and relative enhancement. However, no changes in permeability could be
seen in the pilot study and consequently the method and analyses require further evaluation.

2
1 INTRODUCTION ......................................................................................................... 4
2 THEORY .................................................................................................................... 6
2.1 Respiratory system ................................................................................................................................. 6
2.2 Perfusion and permeability in the lung ................................................................................................... 6
2.3 MRI of the lung ....................................................................................................................................... 7
2.3.1 Physical principles MRI ........................................................................................................................ 7
2.3.2 T1 and T2 relaxation theory .................................................................................................................. 8
2.3.3 Difficulties with MRI of the lung .......................................................................................................... 8
2.3.4 Dynamic contrast enhanced MRI ........................................................................................................ 9
2.3.5 FLASH ................................................................................................................................................. 10
2.3.6 Contrast agent theory........................................................................................................................ 11
3 MATERIAL AND METHODS ...................................................................................... 13
3.1 General ................................................................................................................................................. 13
3.1.1 Animals and animal preparation ....................................................................................................... 13
3.1.2 Contrast agent injection .................................................................................................................... 13
3.1.3 MR scanner ........................................................................................................................................ 13
3.1.4 Respiratory triggering ........................................................................................................................ 14
3.1.5 Imaging method ................................................................................................................................ 14
3.2 Perfusion measurement ....................................................................................................................... 15
3.2.1 The signal-concentration curve ......................................................................................................... 15
3.2.2 In vivo experiment ............................................................................................................................. 18
3.2.3 Partial volume effect ......................................................................................................................... 18
3.2.4 Inflow effect ...................................................................................................................................... 18
3.3 Permeability measurements ................................................................................................................. 20
3.3.1 Optimization of the imaging method ................................................................................................ 20
3.3.2 Pilot study .......................................................................................................................................... 21
3.4 Image analyses ..................................................................................................................................... 22
3.4.1 Perfusion measurements................................................................................................................... 22
3.4.2 Permeability measurements ............................................................................................................. 23
4 RESULTS .................................................................................................................. 24
4.1 Contrast agent enhancement ............................................................................................................... 24
4.2 The optimal flip angle ........................................................................................................................... 25
4.3 Perfusion measurements ...................................................................................................................... 26
4.3.1 Signal concentration curve ................................................................................................................ 26
4.3.2 Partial volume effect ......................................................................................................................... 30
4.3.3 Inflow effect ...................................................................................................................................... 31

3
4.4 Permeability measurements ................................................................................................................. 33
4.4.1 Optimization of the imaging method ................................................................................................ 33
4.4.2 Pilot study .......................................................................................................................................... 35
5 DISCUSSION ............................................................................................................ 36
5.1 The optimal flip angle ........................................................................................................................... 37
5.2 Perfusion measurement ....................................................................................................................... 38
5.3 Permeability measurement .................................................................................................................. 42
6 CONCLUSION .......................................................................................................... 44

4
1 INTRODUCTION
Functional pulmonary imaging is important for the diagnostics of many pulmonary diseases.
There are three feasible techniques for functional pulmonary imaging today; nuclear
medicine, computed tomography (CT) and magnetic resonance imaging (MRI).
The primarily advantages of MRI compared to nuclear medicine are the absence of ionizing
radiation and a considerably better spatial and temporal resolution (Ohno et al., 2004).
CT is the standard for lung morphology in clinical imaging but functional CT imaging for
clinical applications is not as developed. Techniques as multiple detector computed
tomography (MDCT) and the use of contrast agents have thus enabled functional CT
imaging. However, the radiation dose becomes considerably high in dynamic CT scanning
and is therefore a limiting factor.
MRI includes no ionizing radiation and has both morphologic and functional possibilities,
which in the future would make it possible to perform one combined scan giving both
morphologic and functional information (Kauczor et al., 2000).
Furthermore, many lung diseases are chronic and require multiple scans for follow-up over
time, which makes the lack of ionizing radiation in MRI even more important (van Beek,
2008). Hence, there is a large interest of the development and research of functional MR
imaging in the lung.
The gas exchange of the lung can be determined by functional MRI methods. It is important
to have a match between the perfusion of blood and the ventilation of air in order to have an
effective and properly working gas exchange (Mistry et al., 2008). There is often a mismatch
between these parameters in many pulmonary diseases. Measurements of perfusion and
ventilation can therefore be used for the diagnostics and follow up of pulmonary diseases
such as chronic obstructive pulmonary disease (COPD), cystic fibrosis and pulmonary
hypertension (Kauczor et al., 2009).
Measurements of pulmonary perfusion with dynamic contrast enhanced MRI have been
investigated in clinical settings both in 2D (Hatabu et al., 1999) and 3D (Ohno et al., 2004).
However, quantitative perfusion MRI is not very common in clinical diagnostics and
preclinical quantitative assessments are even more uncommon. Quantitative measurements of
pulmonary perfusion with rodents have only been done in one study (Mistry et al., 2008).
MRI of rodents involves difficulties such as requirements for better spatial resolution due to
smaller vessels and organs. The body weight of rat is around 300 times less compared to man.
Additionally, better temporal resolution is needed because of the cardiac rate in rats is about 5
times faster compared to man (Mistry et al., 2008).
Permeability is another important parameter that can be investigated by functional MRI
methods. A change in permeability can indicate a region of inflammation in the lung.
Methods and models for permeability measurements have mostly been developed for
applications in cancer (Naish et al., 2009). However, they are also applicable in functional
lung imaging.

5
Consequently measurements of pulmonary perfusion and permeability are useful tools in
clinical diagnostics. In addition, they can be applied in preclinical research, e.g. in the
pharmaceutical industries, where these parameters can be used in lung disease models during
the development of novel drugs.
The aim of this project is to develop protocols suitable for quantitative measurements of
perfusion and permeability in the rat lung using dynamic contrast enhanced MRI.
Additionally, the developed protocol will be used in a pilot study including healthy animals
and animals with lung inflammation.

6
2 THEORY
2.1 Respiratory system
The main function for the respiratory system is to oxygenate the blood by a gas exchange
between oxygen, O2 and carbon dioxide, CO2. The breathing air flows through the trachea,
which divides and continues as two main bronchi in the two lungs. Further, the main bronchi
get more and more narrow and become bronchioles, which end in a small lumen surrounded
by a capillary net, the alveoli (fig. 1). The air in the alveoli oxygenates the blood flowing
through the capillary net and a gas exchange occurs (Sand, et al., 2007).
Figure 1. Respiratory system of man. The lung contains millions of alveoli, which is
the place of the gas exchange between oxygen and carbon dioxide.
(http://www.southtynesidepic.nhs.uk/master_code/childrenscentre/pilsinl/117.gif)
(http://arditobook.pbworks.com/f/1180404291/Alveoli_diagram.png)
2.2 Perfusion and permeability in the lung
Perfusion is the capillary blood flow and is measured in units of ml min-1
100g-1
, indicating
the blood volume, that perfuse through a mass of tissue, per unit time. It is important that the
ventilation of air match the capillary perfusion of blood in order to have a properly working
gas exchange. A change in the perfusion and/or the ventilation can therefore be an indication
of a pulmonary disease. Consequently, measurements of these parameters can be used as a
diagnostic tool (Mistry et al., 2008).
Permeability is the possibility for particles and fluid to penetrate a barrier. An increased
permeability can be an indicator of inflammation, which is the response of the immune

7
system to an infection (Wilhelm, 1973). Blood plasma containing immune cells and proteins
are gathered in the tissue by an increased vascular permeability, resulting in an oedema.
2.3 MRI of the lung
MRI is a well developed image modality for many parts of the body. However, MRI of the
lung is challenging and has been limited to research applications. It has even been stated that
among all organs imaged by MRI, the lung is very likely the most difficult (Kauczor et al.,
2009). However, the development of new MRI techniques have made it possible to perform
pulmonary MRI, which today is an area of increased interest with many potential
applications.
2.3.1 Physical principles of MRI
The most common molecule in our body is water. Every proton within the water molecule
has a rotational motion called spin and is positively charged.
According to the laws of electromagnetism a small magnetic moment can be detected from
each proton. If an external magnetic field is applied to the water molecule, the protons within
it will align from being in random directions. Larmor’s equation gives the frequency of the
precessional motion called larmor frequency
𝑓 = 𝛾
2𝜋∙ 𝐵0 , Eq. 1
where f is the frequency [Hz], γ is the gyro magnetic ratio [MHz T-1
] and B0 [T] is the static
external magnetic field. This relation is also called the resonance condition and has to be
satisfied in order to transfer energy to the system.
All protons in a system, exposed to the same magnetic field will resonate with the same
frequency in the same direction. Together they will create a net magnetic moment along the
direction of the external field. The amplitude of the net magnetization vector in equilibrium is
called M0 and depends on the strength of the static magnetic field (B0) and on the proton
density.
The small net magnetic moment coming from the protons in tissue is only detectable if it is
flipped to an angle, α to the external field B0. This is done by energy from a radio frequency
(RF) pulse, which has to satisfy the resonance condition to be able to transfer energy. The net
magnetization is flipped and the result is two components of the initial vector; one
longitudinal (Mz), which is parallel to the static field B0 and one transverse (Mxy), which is
perpendicular to B0.
After the disturbance of the RF pulse, the spins return back to equilibrium by two different
processes, T1 and T2 relaxation (2.3.2). The MR signal is created from the transverse net
magnetization, Mxy which rotates in the transverse plane and gives rise to an oscillating
magnetic field. This oscillation induces a current in a receiver coil, which becomes the MR
signal, called free induction decay (FID).

8
For image formation, different sequences of RF pulses and magnetic field gradients are
applied. The pulse sequences create echoes in the form of a spin echo (SE) or gradient echo
(GE).
2.3.2 T1 and T2 relaxation theory
A proton in a strong static magnetic field behaves approximately like a small needle magnet;
it will align to the direction of the static field. The alignment happens due to a relaxation
mechanism called T1 or spin-lattice relaxation. The same relaxation mechanism will have an
effect after a disturbing RF pulse.
There are two types of relaxation mechanisms after a disturbing RF pulse, T1 and T2
relaxation. They happens simultaneously but T2 is always shorter than T1.
T1 relaxation occurs when the longitudinal component of the magnetic moment returns back
to its initial value M0 after an RF pulse. The energy that the spins absorbed from the RF pulse
is transferred to the surrounding lattice by dipole-dipole interactions. The magnetic dipole
moment from the surrounding lattice has to fluctuate at the larmor frequency and satisfy the
resonance condition in order to enable energy transfer. The fluctuation of the magnetic dipole
moment arises from the random molecule motion and is dependent on the physical state and
structure of the tissue. Only a number of spins will oscillate at the larmor frequency and
consequently different amounts of spins will contribute to T1 relaxation in different types of
tissue.
Immediately after the RF pulse, all spins will resonate in phase at the larmor frequency and
the transversal net magnetization, Mxy has its maximum value. The transverse relaxation, T2,
occurs as the phase coherence is lost between the spins and Mxy decays back to zero. The
dephasing is caused by small magnetic field inhomogenities. Either internal caused by the
random molecule motion (T2) or external caused by the external field (T2*).
The efficiency of T1, T2 and T2* relaxation is dependent on the structure of tissue, which
makes relaxation time to a characteristic property for different types of tissue (McRobbie et
al., 2007). If MRI is done with a suitable pulse sequence, contrast between different tissues
can be achieved weighted on the T1, T2 or proton density (McRobbie et al., 2007).
2.3.3 Difficulties with MRI of the lung
MRI of the lung is difficult due to a number of reasons. First, the lung region is disturbed by
respiratory and cardiac motions, which can contribute to motion artifacts. Secondly, the
structure of the lung is not optimal for MRI. It has a low proton density creating low signal
and it contains many interfaces between air and tissue arising from the large number of air
filled lumen, alveoli. The interfaces results in susceptibility differences, which creates
magnetic field inhomogenities in the tissue. Consequently T2* relaxation time is short in the
lung (Kauczor et al., 2009).

9
2.3.4 Dynamic contrast enhanced MRI
Dynamic contrast enhanced MRI (DCE-MRI) is a functional MRI method, which is based on
a T1 weighted dynamic MRI sequence, measured during an intravenous injection of contrast
agent (CA). The effect of CA in blood is a shortening of T1 leading to an increased signal
intensity on T1 weighted images (2.3.6).
The signal intensity for each image is plotted, resulting in an enhancement curve (fig. 2). In
ideal cases the enhancement curve should display the first passage of CA. However, very
good temporal resolution is needed in order to track the first passage of the CA.
Figure 2. A typical enhancement curve from a DCE-MRI measurement.
The identification of changes of perfusion and permeability values requires different parts of
the CA enhancement curve and has therefore different demands on temporal resolution.
The first part of the curve is needed for calculation of perfusion values and consequently,
perfusion imaging demands very good temporal resolution as the CA perfuse out in tissue
with the heart rate. The last part can be used for the calculation of permeability. If there is
increased vessel permeability in the lung, CA will leak out in the parenchyma and build up a
more or less constant concentration in tissue. CA concentration in normal tissue decays more
continuously. A permeability change can therefore be seen as a change of the after-peak-
slope in the CA enhancement curve. Permeability is therefore a rather slow process requiring
less temporal resolution.
Finding quantitative values of perfusion and permeability includes curve fitting of different
mathematical models. Dependent on the mathematical model used, an arterial input function
(AIF) can be required. It shows the concentration of CA at each time point in the blood
supply of the tissue of interest. How well the AIF can be determined, has often a large effect
on the accuracy of the resulting quantitative values of perfusion and permeability. However,
AIF determination is challenging as it requires good temporal resolution (Yankeelov, 2007).
Sign
al
Image
Enhancement curve

10
2.3.5 FLASH
FLASH (Fast Low Angle SHot) is a spoiled gradient echo (GRE) sequence which belongs to
the group of fast GRE sequences. This group of sequences decreases the scan time by having
flip angles ≤ 90° and shorter repetition times (TR). When TR is shorter than the T2 relaxation
time, there is a nonzero transverse magnetization left at the time of the next repetition. After
a few regular TRs the remaining transversal net magnetization will come to a constant value
at each TR and a nonzero steady state will be reached. The transversal steady state creates
several echoes parts from the gradient echo coming from the FID. Spoiled GRE sequences
like FLASH remove the transverse net magnetization before each TR (McRobbie et al.,
2007).
FLASH is a useful pulse sequence for DCE-MRI. Strongly T1 weighted images can be
produced using short repetition times and small flip angles. The advantage of using GRE-
sequences compared to SE-sequences in DCE-MRI is mainly the short achievable acquisition
time.
The signal equation for FLASH can be written as (McRobbie et al., 2007)
𝑆 = 𝜌 1 − 𝑒− 𝑇𝑅∙𝑅1 ∙ sin 𝛼
(1 − 𝑐𝑜𝑠𝛼 ∙ 𝑒− 𝑇𝑅∙𝑅1 )∙ 𝑒−(𝑇𝐸∙𝑅2
∗) ,
Eq. 2
where S is the signal, ρ is the proton density, 𝑅1= 1
𝑇1and 𝑅2
∗ =1
𝑇2∗ are the relaxation rates [s
-1]
and α is the flip angle [rad].
In DCE-MRI a CA is distributed in tissue. The effect on the relaxation rate of a CA can be
written as
𝑅′ = 𝑅 + 𝑟 ∙ 𝐶 , Eq. 3
where R , R´ [s-1
] are the relaxation rate before and after the administration of contrast agent,
r is the specific relaxivity [mmol-1
·ms-1
] demonstrating the effect of T1 and T2 from CA and C
is the CA concentration [mmol∙ml-1
].
The signal from FLASH after administration of such a CA can be written as a combination of
Eq. 2 and Eq. 3
𝑆 ′ = 𝜌 1 − 𝑒−𝑇𝑅∙ 𝑅1+𝑟1∙𝐶 ∙ sin 𝛼
1 − cos 𝛼 ∙ 𝑒−𝑇𝑅∙ 𝑅1+𝑟1∙𝐶 ∙ 𝑒−𝑇𝐸∙ 𝑅2
∗+𝑟2∗∙𝐶 ,
Eq. 4
where S´ is the signal after administration of CA.

11
The flip angle, α giving the highest SNR from the GRE pulse sequence is the so called Ernst
angle, which is dependent on TR and T1 (McRobbie et al, 2007)
𝛼𝑒𝑟𝑛𝑠𝑡 = cos−1(𝑒−𝑇𝑅/𝑇1 ) Eq. 5
2.3.6 Contrast agent theory
Contrast agents affect the MR signal by shortening of the relaxation times and can
consequently increase the contrast between tissues. There are a lot of complexes used for this
purpose and more are on the research level. As mentioned earlier (2.3.5) the specific
relaxivity of the contrast agent specifies how effective the CA can reduce T1, T2 which is
characteristic for different kinds of CA.
The most common contrast agents in MRI today are Gadolinium (Gd) – DTPA complexes.
On the market it can be found as, for example Magnevist® (Gd – DTPA) or Omniscan® (Gd-
DTPA-BMA), two solutions having the same CA properties.
Gd – DTPA is a contrast agent consisting of two parts, the pure Gadolinium and the chelate
DTPA. DTPA is required for shielding since Gadolinium is toxic in its normal state
(McRobbie et al., 2007).
Gadolinium (7+) is a paramagnetic compound meaning that it has one or more unpaired
electrons in its atomic structure. The magnetic moment of an unpaired electron is much larger
than from a proton, which results in stronger dipole-dipole interactions when CA is
administrated in tissue. Stronger dipole-dipole interactions make the relaxation more efficient
and consequently T1 is shortened. Furthermore, CA can shorten T2 by varying the correlation
time (Wood, Hardy 1993).
Gd-DTPA belongs to the group of positive enhancers, which mainly affect T1. T2 and T2* are
thus also affected but with only to a smaller extent. However, at larger concentrations of CA,
the susceptibility differences between the paramagnetic CA and tissue will be so extensive
that T2* gets even more pronounced. When T2* dominates over T1 the result is a suppressed
signal on T1-weighted images. Consequently, there is a nonlinear signal concentration curve
for higher concentrations of CA (fig. 3). The effect from CA and hence the linear range of
concentrations are dependent on the pulse sequence and its timing parameters (Shahbazi-
Gahrouei et al., 2001).

12
Figure 3. Example of a signal CA concentration curve showing that the signal from a
distributed range of CA has a non linear relationship due to T2* effects.

13
3 MATERIAL AND METHODS
3.1 General
3.1.1 Animals and animal preparation
The experiments including animals were all performed with permission from the ethical
committee of University of Göteborg, according to ethical approval no. 400-2008 and 40-
2008.
All animals in the study were male Wistar rats, which had body weights in a range from
239 g - 412 g. During the experiments the rats were anesthetised with a mixture of air, pure
oxygen and 2-3 % isoflurane. Their temperature was kept constant by surrounding tubes with
a temperature of 36° C. Their breathing rate was kept constant at 50-60 breath/minute by
adjusting the settings of the anesthesia.
Injections of CA were performed during the study. These injections were all performed
intravenously in the tail. An extra long injection line made it possible to perform more than
one injection in the same rat, without removing it from the scanner.
A disease model was included in one of the studies. It was a lipopolysaccharide (LPS), which
is an antigen creating inflammation. The administration of LPS was done intratracheally.
3.1.2 Contrast agent injection
The contrast agents used in this study were Magnevist® (C = 0.5 mmol/ml Gadolinium-
DTPA, Bayer-Schering, Berlin, Germany) and Omniscan® (C = 0.5 mmol/ml Gadolinium-
DTPA-BMA, NYCOMED IMAGING AS Oslo, Norway). Magnevist® was used in all
experiments apart from the pilot study (3.3.2) where Omniscan® was used due to the lack of
Magnevist®. Dilution was done with saline in order to get the concentration and volume of
interest. The volume of CA solution used in all experiments was 0.4 ml, which was injected
manually during 10 seconds.
All notations of contrast agent concentration in the report are noted in mmol of
Gd-DTPA/ Gd-DTPA-BMA per ml of the total injected volume.
3.1.3 MR scanner
The MR scanner used for all MR imaging was a 4.7 T Bruker Biospec (Bruker, Ettlingen,
Germany) 47/40 at Astra Zeneca in Mölndal, Sweden. A quadrature proton coil with a
diameter of 72 mm and a Gradient insert S112 with max gradient 400 mT/m was used during
the experiments. Image acquisition and reconstruction of the MR data was done with
Paravision 5.0 (Bruker, Ettlingen, Germany).

14
3.1.4 Respiratory triggering
A triggering module for respiratory triggering (SA instruments, Inc, Stony Brook, NY, USA)
was connected to the scanner. Respiratory triggering reduces artifacts from motion by a
trigger pulse that activates the scanner at a constant position of the diaphragm. The sensor, a
small pad, is fastened on the chest of the rat giving a signal when it is compressed by the
rising diaphragm (fig. 4).
Figure 4. Schematic overview of the principle of triggering where the trig pulse is set to activate the scanner
at a constant position of the diaphragm.
3.1.5 Imaging method
The method used for the measurements of perfusion and permeability was DCE-MRI, which
was based on a T1-weighted FLASH sequence optimized for a short echoe time (TE)
(Månsson, 2008).
DCE-MRI measurements were all performed according to a standard scheme presented here.
The rat being imaged was lying supine with the head first in the scanner. The breathing rate
was assessed by a connected triggering module. Before the image acquisition could start, the
rat was positioned in the center of the scanner with assistance of scout images and a suitable
slice containing as much lung as possible was chosen.
A 2D FLASH acquisition sequence was used for the perfusion measurements with TE/TR
0.6/2 ms, slice thickness 4 mm and the number of exitations (NEX) was 4. The temporal
resolution for this sequence was, because of the triggering, dependent on the breathing rate,
but had an average of about 1 second. It was the highest temporal resolution achievable with
the current equipment.
In the permeability experiments a 3D FLASH sequence was used with TE/TR 0.6/5 ms,
which had a temporal resolution of 1 minute per 3D slab, containing 20 slices.
The CA injection started 30 seconds after the start of 2D FLASH and 2 minutes after 3D
FLASH in order to both have pre-contrast baseline images and images of the CA
enhancement. The different delays of injection between 2D and 3D were due to the temporal
resolution of each sequence.
If two injections were performed in the same rat, they were separated by 20 min in order to
have a sufficient wash-out (Weinmann et al., 1984). A complete wash out is important in
order to return back to same baseline signal after each injection and avoid build up of the
signal.

15
3.2 Perfusion measurement
3.2.1 The signal concentration curve
The signal concentration curve of the CA is not linear (2.3.6). At higher concentrations T2*
effects will contribute, which result in a suppressed signal. A suitable CA concentration for a
perfusion measurement has no suppressed signal and lies consequently in the linear range.
The aim of this section was therefore to determine the linear signal concentration range for a
DCE-MRI perfusion measurement in the lung.
3.2.1.1 In vitro experiment
The purpose of this experiment was to determine the relationship between the MR signal and
the CA concentration in vitro with the same FLASH sequence used as in the DCE-MRI
measurements. This was done in order to find the interesting range of CA concentrations for
further investigation.
The phantom used was built from a plastic tube holding smaller glass tubes (3.7 ml) filled
with different concentrations of contrast agent (fig. 5). They were all surrounded by water.
The investigated concentrations of CA ranged from 0.005 mmol/ml to 0.2 mmol/ml and were
divided on two scans according to Table 1.
A 2D FLASH (matrix 96 x 128; FOV 6.47 x 6.65 cm2; respiratory triggering off) according
to section 3.1.5 was used as acquisition sequence.
a) b)
Figure 5. The left image a) shows a schematic setup of the phantom for the in vitro experiment and the
right image b) shows the resulting axial MR image.

16
Table 1. The investigated CA concentrations in the in
vitro experiment were divided in two scans with five
samples each.
Scan 1 Scan 2
1 0.005 mmol/ml 1 0.05 mmol/ml
2 0.01 mmol/ml 2 0.06 mmol/ml
3 0.05 mmol/ml 3 0.07 mmol/ml
4 0.1 mmol/ml 4 0.08 mmol/ml
5 0.2 mmol/ml 5 0.1 mmol/ml
3.2.1.2 Combined in vitro/in vivo experiment
The in vitro and in vivo relation of the signal concentration curve is not comparable and
consequently a linking experiment was needed in order to find the signal CA concentration
curve in vivo. The next step was therefore to use in vitro samples with concentrations from
the linear range, determined in the original in vitro experiment (3.2.1.1), as a reference of
linearity to in vivo DCE-MRI measurements with different concentrations of CA. However,
the in vitro signal can only be compared with the in vivo signal if they are done in the same
scan. Therefore, the principle of this experiment was to combine an in vitro and an in vivo
experiment by placing in vitro tubes in the FOV during a DCE-MRI measurement in rat. The
relationship of the signal concentration curves was investigated to determine whether the
resulting concentrations in vivo in the lung were in the linear range or not.
A standard DCE-MRI measurement as described in section 3.1.5, 2DFLASH (flip angle 20°;
matrix 96 x 128; FOV 7-7.5 x 5-5.8 cm2 (suited for individual animal size); respiratory
triggering on) was carried out for two injections of CA, 0.1 mmol/m and 0.2 mmol/ml.
Additionally, in vitro samples made of 2 ml glass tubes with CA concentrations 0.01, 0.02,
0.04 mmol/ml were placed next to the neck of the rat (fig. 6). The samples were heated to 36º
before the measurement started to preserve the same temperature for all reference in vitro
samples.
The reference in vitro samples were measured two by two during injection 1 and 2, having
one sample in common as a reference. The receiver gain that controls the MR signal was set
to a constant value, which allowed for a comparison between the two scans as the experiment
was repeated in two animals.

17
a)
b)
Figure 6. The experimental setup for the combined in vitro/in vivo experiment. Image a) shows an
schematic image and b) shows the resulting MR image
(http://www.biologycorner.com/resources/rat_circ_vein.gif)
3.2.1.3 Investigation of potential confounders of the combined in vitro/in
vivo experiment
The samples from the original experiment and the ones used in the combined in vitro/in vivo
experiment differed in parameters like respiratory triggering on/off, tube size and surrounding
media. These three parameters were investigated in order to see if some of them affected the
in vitro signal concentration curve.
Respiratory triggering was used during all injections in the combined in vitro/in vivo
experiment but not in the original in vitro experiment. To see if triggering affected the signal
from the in vitro samples next to the rat, one precontrast scan was performed with the same
sequence as in the combined in vitro/in vivo experiment but with respiratory triggering off.
The tube size of the original in vitro experiment was 3.7 ml compared to 2 ml in the
combined in vitro in vivo experiment. The signal from three different CA concentrations,
0.01 mmol/ml, 0.02 mmol/ml and 0.04 mmol/ml in 3.7 ml tubes was compared with the
signal from the same concentrations in 2 ml tubes to see if the geometry of the samples had
an effect. The two sets of samples were measured with the exact same pulse sequence as in
the in vitro experiment (3.2.1.1), both surrounded by water.
The surrounding media of the original in vitro experiment was water but in the combined in
vitro/in vivo experiment it was air. The dependence of different surrounding media was
therefore investigated by scanning three CA concentrations 0.01 mmol/ml, 0.02 mmol/ml and
0.04 mmol/ml with the same tube size (2 ml) surrounded by two different media, air and
water. The same acquisition sequence as in the in vitro experiment (3.2.1.1, flip angle 20º)
was used with a slightly different FOV (6.97 x 6.65 cm2).

18
3.2.2 In vivo experiment The combined in vitro/in vivo experiment resulted in unexpected parameters dependencies
(4.3.1.2), which consequently motivated a measurement of the signal concentration relation
directly in vivo. Four CA concentrations 0.05 mmol/ml, 0.1 mmol/ml, 0.2 mmol/ml and 0.3
mmol/ml were injected and measured by standard DCE-MRI (3.1.5) with 2DFLASH (flip
angle 20°; matrix 96 x 128; FOV 5.0 x 5.0 cm2; respiratory triggering on) in the same rat. The
experiment was carried out in four animals with similar body weight.
The minimal delay time between two measurements for sufficient wash out was 20 min
(Weinmann et al., 1984). This was important to consider since the baseline signal for all
measurements in the same rat should be constant. Measurements including delay times in all
four rats required a distribution of the measurements over two days according to the injection
scheme in figure 7.
Figure 7. The scheme of injections for the in vivo experiment in one rat.
3.2.3 Partial volume effect
The objective of this experiment was to determine if partial volume effects were a potential
problem in DCE-MRI measurements in rat.
Partial volume effects arise if more than one type of tissue contributes to the signal in one
voxel. If the voxels gets smaller e.g. the slice thickness is reduced, the potential effect should
be decreased.
Two measurements with the same contrast agent concentration, 0.05 mmol/ml but with
different slice thicknesses, 2 mm and 4 mm, were performed in the same rat. The position and
FOV was kept constant when changing the slice thickness.
The measurements were performed by standard DCE-MRI (3.1.5) with 2DFLASH (flip angle
20°; matrix 96 x 128; FOV 5.0 x 5.0 cm2
; respiratory triggering on).
3.2.4 Inflow effect
The inflow effect may appear when vessels with significant blood flow are in an imaged
slice. Since the RF pulse only affects the blood that is in the slice at the moment, fully relaxed
blood can enter the slice of interest between RF pulses and give high signal in GRE
20 min
min
mkin
Injection
0.05 mM/ml Injection
0.2 mM/ml
Injection
0.1 mM/ml
Injection
0.3 mM/ml
20 min 24 h
min
mkin

19
sequences (McRobbie et al., 2007). This is a problem when searching for small signal
changes due to different concentrations of CA, which can be saturated by the inflow signal.
3D scanning can reduce inflow artifacts because the RF pulse will then be applied not only in
one slice but over a larger volume. More blood gets excited and inflow artifacts are reduced.
The aim of this experiment was to investigate if inflow effects caused problems when
analyzing the 2D FLASH signal from enhanced vessels. 2D scans from the perfusion section
3.2.2 was compared with 3D scans from the permeability section 3.3.1.3, which had the same
CA concentrations, 0.1mmol/ml and 0.2 mmol/ml. For details of the measurements see each
section.

20
3.3 Permeability measurements
Pulmonary permeability was the second aim of the project. The latter part of the enhancement
curve is mainly affected by permeability, which is a slow process and consequently less
temporal resolution is needed. The saved time can therefore be used in 3D scanning. 3D
scans have several advantages over 2D like the reduction of inflow effects and the possibility
of image reconstruction in any plane of interest (McRobbie et al., 2007).
3.3.1 Optimization of the imaging method
All permeability measurements were done with a 3D FLASH sequence. To make it suitable
for DCE-MRI permeability measurements, optimization of imaging method, flip angle and
CA concentration were done.
3.3.1.1 In vivo 3D scanning
The 3D sequence was first studied in vivo to have a starting point for the optimization.
According to the standard injection scheme (3.1.5), DCE-MRI measurements using a 3D
FLASH sequence (flip angle 20°; matrix 192 x 192 x 20; FOV 5 x 5 x 4 cm3; NEX 4;
respiratory triggering on) with CA concentration 0.5 mmol/ml were carried out in one rat.
3.3.1.2 Optimization of the acquisition scheme
One scan was done with respiratory triggering on and one was done with respiratory
triggering off in order to see if triggering in a combination with the 3DFLASH sequence
caused artifacts. Besides triggering, the two scans were identical standard DCE-MRI
measurements (3.1.5) with 3D FLASH (flip angle 20°; matrix 192 x 192 x 20; FOV 5 x 6.5 x
6.5 cm3; NEX 4). A plastic immovable QA phantom was used in this experiment (fig. 8).
A dynamic series should consist of at least 8 images to be able to show if the occuring signal
fluctuations were a coincidence. However, for the untriggered 3DFLASH sequence the
number of images that could be sampled consecutively was limited by the gradients of the
scanner, which were overloaded after four repetitions and automatically stopped the
sequence. A dynamic series of 8 images was therefore sampled by setting the acquisition
sequence to stop after each completed 3D image set and start over again with the next one
during 8 repetitions. The gradient system could then recover between each image. This way
of sampling is henceforward called repeated3DFLASH.

21
Figure 8. An MR image of the static, plastic QA phantom used for the
trigger optimization. The marked region is the region of interest (ROI)
used for the analyses.
3.3.1.3 In vivo optimization of repeated3DFLASH
In this experiment the repeated3DFLASH sequence was studied in vivo. Two rats were
measured for the in vivo optimization of the flip angle and the CA concentration.
Two CA concentrations, 0.1 mmol/ml and 0.2 mmol/ml were therefore investigated with two
different flip angles, 20° and 30° using the standard DCE-MRI (3.1.5) with the
repeated3DFLASH (matrix 192 x 192 x 20; FOV 5 x 6.5 x 6 cm3; NEX 8; respiratory
triggering off) according to Table 2. NEX was increased from 4 to 8 in order to compensate
for the fact that no triggering was used in the repeated3DFLASH sequence.
Table 2. The injection scheme for the in vivo
optimization of repeated 3DFLASH.
Animal 1 Animal 2
20° 0.1 mmol/ml 0.2 mmol/ml
30° 0.1 mmol/ml 0.2 mmol/ml
3.3.2 Pilot study
After the optimization of the protocol, a pilot study was performed to investigate if it was
possible to find a significant difference in pulmonary permeability in healthy rat lungs
compared to rat lungs with inflammation. The inflammation was created by 0.2 ml
(C = 1 mg/ml) solution of LPS per animal. The time between administration of LPS and
measurement was 24 h. The same standard DCE-MRI measurement (3.1.5) with the
repeated3DFLASH (flip angle 20°; matrix 96 x 96 x 20; FOV 5 x 6.5 x 6 cm3; NEX 8;
respiratory triggering off) was performed with CA dose 0.4 mmol/ml before and after
administration of LPS (day 0 and day 1). Anatomical landmarks were used to ensure the same
position of the FOV on both days.

22
3.4 Image analysis
The image analysis of the MR data was performed using ImageJ (Rasband WS. ImageJ,
Bethesda, USA; Abramoff MD et al. 2004). When enhancement curves was considered in the
analyses, a region of interest (ROI) was defined by hand in order to find representative curves
for different types of tissue. If the ROI consisted of more than one pixel, an average was done
over all pixels within it. The ROI selection in the pulmonary artery was done by choosing a
homogenous region in the pulmonary bifurcation and in the lung it was done by taking a large
homogenous region avoiding clearly enhanced blood vessels (fig. 9).
Figure 9. Examples of ROI selections of the pulmonary artery (upper ROI)
and the lung (lower ROI).
3.4.1 Perfusion measurements
The measurement of the samples in the original in vitro experiment (3.2.1.1) was done in two
scans. One of the samples (CA concentration 0.05 mmol/ml) was used in both scans for
normalization in order to show a signal concentration curve over the whole range.
DCE-MRI measurements generated enhancement curves of the passage of CA. All
enhancement curves for the perfusion measurements were normalized to the signal of the
baseline of each curve, defined as the second to the last precontrast image.
The in vivo signal CA concentration curve was investigated in the in vivo experiment (3.2.2).
The signal value for each concentration was calculated using a signal average of five images
after the maximum concentration had passed (image 50 – 55). In addition, the resulting signal
average was averaged over the four rats in order to have one signal value for each
concentration. Image 50 – 55 were chosen instead of the maximum concentration images
because the magnitude of the peak was dependent on the time of injection.

23
3.4.2 Permeability measurements
All enhancement curves for the permeability measurements were normalized to an average of
their own baseline signal consisting of two precontrast images.

24
4 RESULTS
4.1 Contrast agent enhancement
All DCE-MRI measurement in rat resulted in an enhancement of the blood vessels as in
figure 10 where image a) demonstrates a precontrast image and the following images
different times after administration of CA. Image c) demonstrates the maximal enhancement
of the lung and image d) demonstrates the enhancement of the liver.
a) b) c)
d)
e)
Figure 10. Enhancement of a rat lung from DCE-MRI measurements with 0.2 mmol/ml CA injected. Image
a=1second, b = 29 seconds, c = 33 seconds, d = 59 seconds and e = 360 seconds after the start of the MRI
acquisition sequence.

25
4.2 The optimal flip angle
αernst was simulated for different T1 values (fig. 11), showing that αernst is larger for decreasing
values of T1. T1 in the lung at 4.7 T is about 1500 ms (Abdlamer, 2007), which results in
αernst of ≈ 3°. However, when choosing the flip angle for the FLASH sequence in DCE-MRI
measurements, more parameters have to be considered. First, the distribution of CA will
shorten T1, which will result in a variable but larger αernst (fig. 11). Secondly, stronger T1-
weighting can be achieved with larger flip angles, which is desirable in DCE-MRI. A
simulation of the signal after administration of CA (fig. 12) shows the degree of linearity.
The third parameter that affects the choice of α is the fact that inflow effects can be reduced
with larger flip angles. Therefore, considering these three parameters the flip angle used in
the FLASH sequence for DCE-MRI measurements was 20º.
Figure 11. Ernst angle for different values of T1, showing an increased αernst for decreasing
values of T1.
Figure 12. Calculations of the signal concentration curve for different flip angles (TE/TR 0.6/
2ms; T1 1500ms; T2 50 ms; r2 0.005 mmol-1
ms-1
), showing that the linearity decreases with a
decreased flip angle.
0
2
4
6
8
10
0 500 1000 1500 2000 2500
Ern
st a
ngl
e [
º]
T1 [ms]
Ernst angle
R² = 0.985
R² = 0.9979
R² = 0.9995
R² = 0.9998
R² = 1
0
0.01
0.02
0.03
0.04
0.05
0.06
0 0.1 0.2 0.3 0.4 0.5
Sign
al [
a.u
]
C oncentration [mmol/ml]
Signal concentration curve for differentflip angles 5°
10°
15°
20°
30°

26
4.3 Perfusion measurements
4.3.1 Signal concentration curve
4.3.1.1 In vitro experiment
Measurements of in vitro samples with different concentrations of CA surrounded by water
resulted in a maximum signal at a CA concentration of 0.06 mmol/ml (fig. 13). From this
experiment a linear signal concentration range (0 – 0.06 mmol/ml) was defined. This range
was used as the starting point for the combined in vitro/in vivo experiment.
Figure 13. The signal concentration curve from the in vitro experiment. The maximum
signal was seen at a CA concentration of 0.06 mmol/ml.
4.3.1.2 Combined in vitro/in vivo experiment
Image analysis of the combined in vitro/in vivo experiment showed that the signal-
concentration curve from the reference in vitro samples placed next to the rat (fig. 14) did not
show the same linearity as the signal concentration curve from the samples in the original in
vitro experiment (fig. 13). The same effect was seen in the analysis of the two animals.
Some parameters differed in the set-up of the combined in vitro/in vivo experiment compared
to the in vitro experiment, which were studied in order to find the contributing factor to the
difference of the in vitro signal CA concentration relationship.
0
0.2
0.4
0.6
0.8
1
1.2
1.4
1.6
0 0.05 0.1 0.15 0.2 0.25
Sign
al [
a.u
]
Concentration [mmol/ml]
Signal concentration curve in vitro

27
Figure 14. The resulting signal concentration curve from the in vitro samples in the
combined in vitro/in vivo experiment. The signal from all three CA concentrations
showed almost the same signal level.
When the effect from triggering was investigated, it showed that the signal variations from
the vitro samples were about the same for the triggered and the untriggered sequence (fig.15),
indicating that triggering had no effect.
The next factor to be studied was the dependence from the sample geometry. The result
showed that the larger samples of 3.7 ml had a slightly more linear curve than the samples of
2 ml (fig. 16).
The last parameter investigated was the surrounding media. The result showed a difference of
the relationship for samples surrounded by air and by water (fig. 17). The difference could
primarily be seen in the third and largest CA concentration, i.e. different surrounding media
had the strongest effect at the highest CA concentration.
Figure 15. Signal from a triggered and an un triggered 2DFLASH sequence. The signal
variations were about the same indicating no effect from triggering.
0
0.2
0.4
0.6
0.8
1
1.2
1.4
1.6
0 0.01 0.02 0.03 0.04 0.05
Sign
al [
a.u
.]
Concentration [mmol/ml]
In vitro samples in the combined in vitro/in vivo experiment
Animal 1
Animal 2
0
0.2
0.4
0.6
0.8
1
1.2
1.4
1.6
0 20 40 60 80
Sign
al [
a.u
.]
Image number
Trigger dependence
Respiratory triggering off
Respiratory triggering on

28
Figure 17. The signal concentration curves for different surrounding media. The signal
concentration relation differed for air and water, indicating that the surrounding media had
an impact on the signal concentration curve in vitro.
0
0.2
0.4
0.6
0.8
1
1.2
1.4
1.6
0 0.01 0.02 0.03 0.04 0.05
Sign
al [
a.u
]
Concentration [mmol/ml]
Surrounding media dependence
Air
Water
Figure 16. The signal concentration curves for different sample geometry showing that the
relation is slightly more linear for the larger samples than for the smaller samples.
0
0.2
0.4
0.6
0.8
1
1.2
1.4
1.6
0 0.01 0.02 0.03 0.04 0.05
Sign
al [
a.u
.]
Concentration [mmol/ml]
Sample geometry dependence
Large samples
Small samples

29
4.3.1.3 In vivo experiment
The four DCE-MRI measurements in the four rats were all completed and could all be
analyzed. The results showed different signal concentration curves from a ROI of the lung
(fig. 18a) compared to a ROI of the pulmonary artery (fig. 18b). The four concentrations in
the lung gave almost a linear signal relation whereas all four concentrations had about the
same signal in the pulmonary artery. The same result could be seen when plotting relative
enhancement curves of the pulmonary artery and the lung in the same diagram for one rat
(fig. 19) (see Appendix A1 for all four rats). This result indicated a suppressed signal in the
pulmonary artery and an unsuppressed signal in the lung.
a) b)
Figure 18. The signal concentration curves from the in vivo experiment taking a ROI in a) the lung and b)
in the pulmonary artery. The signal is an average of image 50-55 in the dynamic series The error bars
represent the standard deviation of the average.
0
0.5
1
1.5
2
2.5
3
0 0.2 0.4
Sign
al [
a.u
.]
Concentration [mmol/ml]
Signal concentration curveLung
0
0.5
1
1.5
2
2.5
3
0 0.2 0.4
Sign
al [
a.u
.]
Concentration [mmol/ml]
Signal concentration curve Pulmonary artery

30
Figure 19. Enhancement curves of a ROI in the lung and a ROI in the pulmonary artery for concentrations
0.05, 0.1, 0.2, 0.3 mmol/ml in the same rat, indicating a suppressed signal in the pulmonary artery.
4.3.2 Partial volume effect
The results from the investigation of different slice thicknesses and thus a potential partial
volume effect showed that the relative enhancement for slice thickness 4 mm were higher
compared to 2 mm, for both the lung and the pulmonary artery (fig. 20). However, the
relation between the relative enhancement curves of the pulmonary artery and the lung did
not change by a thinner slice thickness, indicating that the suppressed signal was not caused
by a partial volume effect.
0
1
2
3
4
5
6
0 200 400
Sign
al [
a.u
.]
Image number
0.05 mmol/ml
0
1
2
3
4
5
6
0 200 400
Sign
al [
a.u
.]
Image number
0.1 mmol/ml
0
1
2
3
4
5
6
0 200 400
Sign
al [
a.u
]
Image number
0.2 mmol/ml
0
1
2
3
4
5
6
0 200 400
Sign
al [
a.u
]
Image number
0.3 mmol/ml

31
Figure 20. The results from the investigation of the partial volume effect for different slice thickness. The
relative enhancement curves for 4 mm slice thickness in the left figure and 2 mm slice thickness in the right
figure. No change of the relative enhancement could be seen in the pulmonary artery.
4.3.3 Inflow effect
The effect from inflow was investigated in order to find what contributed to the suppressed
signal in the pulmonary artery. Since 3D scans have the ability to reduce inflow, the
investigation included a comparison between a 2D and a 3D scan for two different CA
concentrations 0.1 mmol/ml and 0.2 mmol/ml.
The difference of the relative enhancement between the lung and the pulmonary artery was
different in the 3D scan compared to the 2D scan (fig. 21). The 3D scan showed a higher
relative signal in the pulmonary artery compared to lung. In addition, the signal from the
pulmonary artery increased for an increased CA concentration, whereas the 2D scan did not.
This result indicated that inflow contributed to the suppressed signal in the pulmonary artery.
0
0.5
1
1.5
2
2.5
3
0 100 200 300 400
Sign
al [
a.u
.]
Image number
4 mm
0
0.5
1
1.5
2
2.5
3
0 100 200 300 400
Sign
al [
a.u
.]
Image number
2 mm

32
2D 3D
0.1
mmol/
ml
0.2
mmol/
ml
Figure 21. Comparison between 2D and 3D scans for two CA concentrations, 0.1 mmol/ml and
0.2 mmol/ml, showing that the relation between the relative enhancement curves of the pulmonary
artery and the lung were changed.
0
2
4
6
8
10
0 100 200 300 400
Sign
al [
a.u
]
Image number
0
2
4
6
8
10
0 10 20 30
Sign
al [
a.u
.]
Image number
0
2
4
6
8
10
0 100 200 300 400
Sign
al [
a.u
.]
Image number
0
2
4
6
8
10
0 10 20 30
Sign
al [
a.u
.]
Image number
33
4.4 Permeability measurements
4.4.1 Optimization of the imaging method
4.4.1.1 In vivo 3D scanning
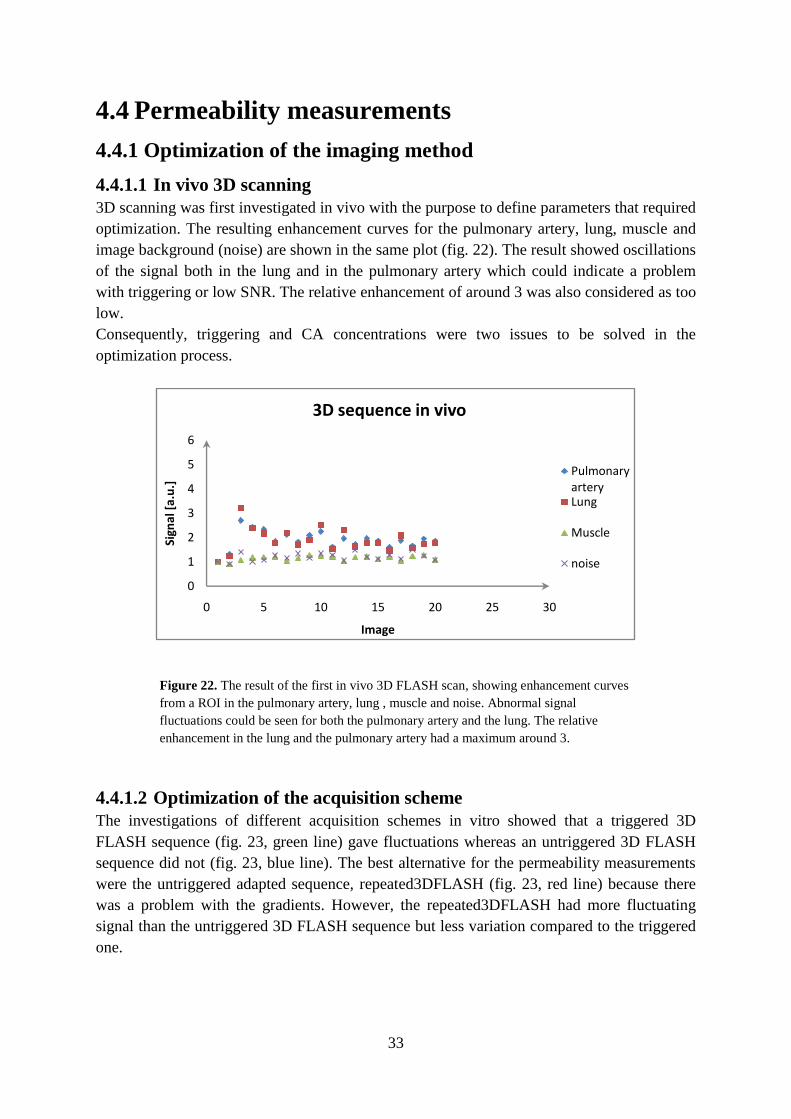
3D scanning was first investigated in vivo with the purpose to define parameters that required
optimization. The resulting enhancement curves for the pulmonary artery, lung, muscle and
image background (noise) are shown in the same plot (fig. 22). The result showed oscillations
of the signal both in the lung and in the pulmonary artery which could indicate a problem
with triggering or low SNR. The relative enhancement of around 3 was also considered as too
low.
Consequently, triggering and CA concentrations were two issues to be solved in the
optimization process.
Figure 22. The result of the first in vivo 3D FLASH scan, showing enhancement curves
from a ROI in the pulmonary artery, lung , muscle and noise. Abnormal signal
fluctuations could be seen for both the pulmonary artery and the lung. The relative
enhancement in the lung and the pulmonary artery had a maximum around 3.
4.4.1.2 Optimization of the acquisition scheme
The investigations of different acquisition schemes in vitro showed that a triggered 3D
FLASH sequence (fig. 23, green line) gave fluctuations whereas an untriggered 3D FLASH
sequence did not (fig. 23, blue line). The best alternative for the permeability measurements
were the untriggered adapted sequence, repeated3DFLASH (fig. 23, red line) because there
was a problem with the gradients. However, the repeated3DFLASH had more fluctuating
signal than the untriggered 3D FLASH sequence but less variation compared to the triggered
one.
0
1
2
3
4
5
6
0 5 10 15 20 25 30
Sign
al [
a.u
.]
Image
3D sequence in vivo
Pulmonary arteryLung
Muscle
noise

34
Figure 23. The result from an in vitro measurement using different acquisition methods. The triggered
3DFLASH sequence (green line) gave abnormal signal variation compared to the untriggered 3DFLASH
sequence (blue line). The repeated3DFLASH sequence was used because of the limitation of the gradients.
4.4.1.3 In vivo optimization of repeated3DFLASH
NEX was increased (doubled from 4 to 8) in order to compensate for the fact that no
triggering was used during the repeated3DFLASH sequence. The in vivo measurement with
this sequence (fig. 24) gave reduced signal fluctuations compared to the measurements with
the triggered 3DFLASH sequence (fig. 22). The combination of no triggering and increased
NEX was therefore considered to be successful.
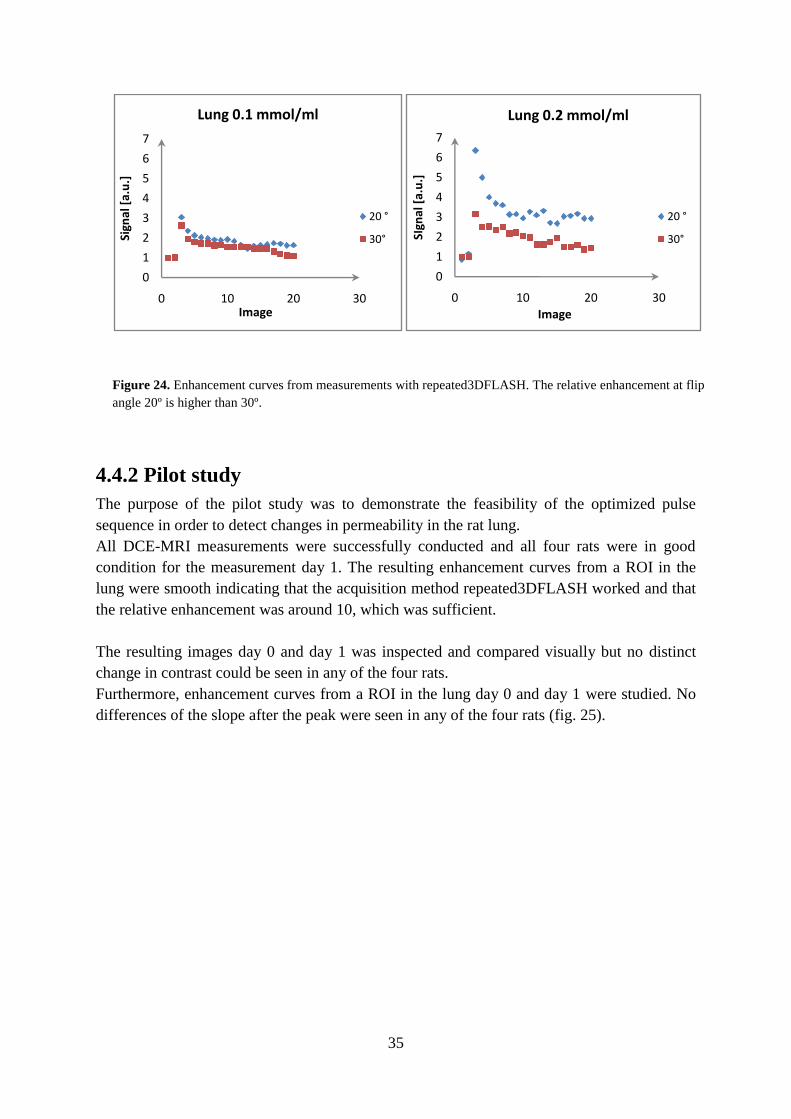
Considering the different flip angles, 20º gave a larger relative enhancement compared to 30º
for both CA concentrations. However, the effect was even clearer for the largest
concentration 0.2 mmol/ml (fig. 24).
The relative enhancement was almost doubled, when doubling the CA concentration from 0.2
mmol/ml to 0.4 mmol/ml at 20º flip angle.
0.00
0.20
0.40
0.60
0.80
1.00
1.20
0 2 4 6 8 10
Sign
al [
a.u
]
Image number
Triggering dependence
3DFLASH Triggering on
3DFLASH Triggering off
repeated3DFLASH Triggering off
35
Figure 24. Enhancement curves from measurements with repeated3DFLASH. The relative enhancement at flip
angle 20º is higher than 30º.
4.4.2 Pilot study
The purpose of the pilot study was to demonstrate the feasibility of the optimized pulse
sequence in order to detect changes in permeability in the rat lung.
All DCE-MRI measurements were successfully conducted and all four rats were in good
condition for the measurement day 1. The resulting enhancement curves from a ROI in the
lung were smooth indicating that the acquisition method repeated3DFLASH worked and that
the relative enhancement was around 10, which was sufficient.
The resulting images day 0 and day 1 was inspected and compared visually but no distinct
change in contrast could be seen in any of the four rats.
Furthermore, enhancement curves from a ROI in the lung day 0 and day 1 were studied. No
differences of the slope after the peak were seen in any of the four rats (fig. 25).
0
1
2
3
4
5
6
7
0 10 20 30
Sign
al [
a.u
.]
Image
Lung 0.1 mmol/ml
20 °
30°
0
1
2
3
4
5
6
7
0 10 20 30
SIgn
al [
a.u
.]
Image
Lung 0.2 mmol/ml
20 °
30°

36
Figure 25. Resulting enhancement curves from the four animals in the pilot study. No changes in the after peak
slope can be seen.
0
5
10
15
0 20 40
Sign
al [
a.u
.]
Image number
Animal 1
Day 0
Day 1
0
5
10
15
0 20 40
Sign
al [
a.u
.]
Image number
Animal 2
Day 0
Day 1
0
5
10
15
0 20 40
Sign
al [
a.u
.]
Image number
Animal 3
Day 0
Day 1
0
5
10
15
0 20 40
Sign
al [
a.u
.]
Image number
Animal 4
day 0
day 1

37
5 DISCUSSION
The method for measurements of pulmonary perfusion and permeability with dynamic
contrast enhanced MRI in rat was investigated in this thesis. One pilot study was performed,
which investigated the permeability in the rat lung using a LPS model.
5.1 The optimal flip angle
The flip angle used in the FLASH sequence was set to 20º, being a tradeoff between high
SNR, the reduction of inflow effects and T1 weighting. The selection was done after
simulation of the FLASH sequence.
More T1-weighting can be achieved with larger flip angles since the relative difference of the
net magnetization vector (Mz) in tissues with different T1 gets larger for an increased flip
angle. A larger relative difference can hence be seen as better T1 weighted contrast.
Theoretically, the relaxivity r2* should be used in Eq. 4 giving the effect of T2* from CA.
However, in the simulation of the postcontrast signal, the value of r2* was approximated by
the value of r2. This was done because the effect of CA on T2* is very complex involving
diffusion among other factors. Finding a more accurate value of r2* would include advanced
additional measurements, which was not within the scope of this work. Furthermore, using a
more accurate value of r2* should not affect the conclusions done. Therefore, r2 was
considered to be a reasonable approximation in order to show the linearity of the signal
concentration curve for different flip angles.
The second reason to the choice of a flip angle as high as 20º was the capacity of larger flip
angles to reduce inflow effects. This is a consequence of the required time to reach the steady
state for different flip angles. The steady state is reached immediately at flip angle 90º while
it takes some time for flip angles less than 90º. If there is fast flowing blood through an
imaged slice and the approach of steady state is slow, the blood will hence be out of the slice
before steady state is reached. Consequently fully relaxed blood will enter and give inflow
effects. Larger flip angles can thus be used to reduce such effects (Roberts, 2005).
Even though the largest SNR is achieved at αernst, much higher flip angles were preferable in
the FLASH equation for DCE-MRI. Since good SNR was not the primary objective, it was
more important to have strong T1-weightening and to reduce inflow effects. Furthermore,
SNR could be increased in other ways such as increased slice thickness, NEX or CA
concentration (lying within the linear range).

38
5.2 Perfusion measurement
The primary objective was to develop a protocol for perfusion measurements in a preclinical
situation. In order to enable a reliable perfusion measurement, the linear range of the signal-
CA concentration curve was determined.
Many investigators using contrast agent Gd-DTPA assume that the relationship between
signal and the CA concentration used is linear. However, the linearity is dependent on pulse
sequence parameters and CA concentration (Shahbazi-Gahrouei et al., 2001). Therefore,
finding the linear range of the signal concentration curve in vivo is an important step in the
process finding accurate values of pulmonary perfusion.
An in vitro experiment was first done in order to determine the linear range of the signal CA
concentration curve in vitro. From this experiment, three CA concentrations, which worked
as in vitro references were placed in FOV during DCE-MRI measurements in rat. It was
essential to perform such a linking experiment in order to find out the in vivo relation, which
differed considerably from the one in vitro.
Another consideration to do this kind of experiment was difficulties in calculating the
dilution of the injected CA. The CA was diluted from the tail vein to the pulmonary artery.
To which degree was difficult to calculate since it is dependent on blood volumes, injection
times and pharmacokinetics of the CA.
However, the same CA concentrations showed different signal CA concentration
relationships in the original in vitro experiment and the combined in vitro/in vivo experiment.
Additional experiments were performed in order to determine the factors contributing to the
deviation between the original in vitro and the combined experiment. Investigating merely
three samples were probably too few but it could nevertheless be used as an indicator of the
situation. The investigation showed that the surrounding media and the geometry of the
samples had an effect on the signal from the in vitro tubes.
The surrounding media dependence can be explained by the fact that different surrounding
media have different susceptibilities. There are larger susceptibility gradients in the border
between air and the CA sample, than between water and the CA sample. Larger susceptibility
gradients contribute to a more inhomogeneous magnetic field profile over the sample. Taking
the same ROI in a sample surrounded by air and by water can therefore give a different MR
signal, caused by the differences in the magnetic fields. Consequently, the size of the sample
also has an effect of how homogenous the magnetic field is in the ROI.
Another potential parameter that affected the signal in the in vitro samples could be the
temperature. According to Reichenbach, 1997 there is a temperature dependence of the
relaxivity of Gd-DTPA. The temperature of the original sample tubes were not controlled
during the experiments but the reference samples in the combined experiment were measured
at 36°C, which may explain the difference in signal.
Inhomogenities in the static magnetic field have also to be considered since the samples in
the two experiments had different placing and orientations towards B0. The samples in the
original experiment were placed horizontal but in the combined experiment they were placed
vertical.

39
The fact that the signal concentration curve most probably is dependent on parameters as for
example the surrounding medium resulted in the decision to end the combined in vitro/in vivo
experiment without further analyses. Even if all contributing factors could be identified, it
was hard to estimate the size of the effect, which would lead to an uncertain in vitro/in vivo
comparison.
Measurements of different CA concentrations directly in rat are presumably the most
straightforward way to find the signal concentration curve in vivo.
The in vivo experiment was carried out measuring four CA concentrations in four rats. The
analyses of the relative enhancement curve in the lung and the in pulmonary artery indicated
different signal CA concentration relationships. The signal differences for different CA
concentrations were much smaller in a ROI in the pulmonary artery compared to a ROI in the
lung. This indicated a suppressed signal in the artery.
Theoretically, if the injected CA concentration in rat was in the linear range, the relative
signal enhancement in the pulmonary artery should be higher compared to the lung, as there
is more blood containing more CA in an arterial voxel (100%) than in the lung (relative blood
volume in the lung tissue). The result of the in vivo experiment did not show that difference,
which indicated a suppressed signal in the pulmonary artery. Partial volume, inflow and T2*
effects were potential causes. The partial volume effect was investigated by varying the slice
thickness and the inflow effect was investigated by reflecting the differences between a 2D
and a 3D scan.
Even thought the partial volume effect did not show any impact, the investigation of this
effect was even more important to investigate in rat compared to man as the pulmonary artery
in rat is considerably smaller. This increase the risk of partial volume effects despite the
smaller voxel sizes in animal scanners compared to human scanners. The investigation was
only done in the slice direction. However, partial volume effects in plane could also be a
potential contributing effect.
The investigation of inflow was a comparison between a 2D and a 3D scan. Since 3D scans
have the capacity to reduce effects of inflow and this experiment showed a reduction, inflow
was very likely a reason to the suppressed signal in the pulmonary artery.
However, it cannot be assumed that the inflow effect is the only contributing factor to the
suppressed signal in the pulmonary artery. In addition, there could be effects from T2*, giving
a suppressed signal from the higher CA concentrations just as in the original in vitro
experiment for CA concentrations higher than 0.06 mmol/ml. The risk of T2* effects should
also be larger in the pulmonary artery where less dilution occurs. However, if effects from
T2* were the dominating effect, even the lowest CA concentration 0.05 mmol/ml would be a
too large concentration lying outside the linear range. This is rather unlikely considering a
reasonable degree of dilution that must occur during the passage of the blood vessel from the
injection site to the pulmonary artery. The inflow effect is therefore most likely the
dominating factor of the suppressed signal.

40
Another reason that makes the performing of the in vivo experiment difficult is choosing a
reasonable CA concentration range without knowing the degree of dilution. One way to avoid
the problem could be to do the injection of CA in the jugular vein. It would allow more
control of the concentration in the pulmonary artery since the dilution is less from the jugular
vein, than from the tail vein. However, this is a complicated method to perform in practice,
among other things because the difficulty to find the jugular veins for an injection.
If the temporal resolution of around 1 second is sufficient since the cardiac rate in rat is
around 360-500 beats/ min (Wekstein, 1965). During the time between two images in a
perfusion measurement with temporal resolution of 1 sec, 6 - 8 heart beats will pass, which
means that the enhancement of the lung happens from one image to another. Theoretically it
is thus possible to lose important information if the maximum concentration occurs between
two time points. However, the area under a theoretical signal peak occurring between two
time points is so small compared to the total area of the curve that it would probably not
make any difference (fig. 26). If there was extra time it should rather be invested in 3D
scanning.
Figure 26. The red point displays a theoretical peak between two measuring points. Note
the small change of the total area under the curve.
The most feasible solution to perform perfusion measurements would be to use rapid 3D
scanning. It would reduce effect from inflow but still have a good temporal resolution in
order to catch the rapid perfusion process. 3D scanning are also preferred if the method
should be used in diseased lungs. The whole lung parenchyma is rarely homogenously
afflicted with disease and a 2D slice will therefore not be that helpful (Risse, 2009).
Technical limitations of the scanner and settings made it impossible to sample rapid 3D
sequences as needed for measurement of pulmonary perfusion.
Sign
al
Image number
Potential peak between two time points

41
Further studies could use methods that reduce the scan time of each slice order to increase the
temporal resolution. Reduced spatial resolution, timesaving sampling strategies and parallel
imaging could be some alternatives (McRobbie et al., 2007).
Important error sources that were limiting for perfusion measurement were identified in the
perfusion section in this work. This was an important step in the process finding a method
suitable for DCE-MRI measurements of pulmonary perfusion.

42
5.3 Permeability measurement
Permeability measurements could be done in 3D because of its little requirements in terms of
temporal resolution. Optimization of the 3DFLASH sequence was done for DCE-MRI
measurements in the rat lung. The optimization process resulted in a CA concentration
injection of 0.4 mmol/ml, which was measured with an untriggered acquisition strategy called
repeated3DFLASH and flip angle 20º. In addition, NEX was set to 8 in order to reduce
artifacts from motion since no triggering was used. The optimized protocol was used in a
pilot study investigating changes in pulmonary permeability after administration of LPS.
However, no changes were found between images day 0 and day 1 after visual inspection of
images and analysis of enhancement curves.
The CA concentration of 0.4 mmol/ml was chosen after considerations of the relative
enhancement of signal from measurements with CA concentration of 0.1 mmol/ml and 0.2
mmol/ml. A concentration that high could be chosen since the latter part of the enhancement
curve is used for permeability calculations. At latter time points in the dynamic series, the
dilution in the lung is large resulting in a smaller concentration of CA and hence less risk for
T2* effects from CA.
The strategy of acquisition with 3DFLASH was investigated using a static plastic phantom.
Theoretically a signal from a static phantom should be constant, independent of if the
acquisition scheme is triggered or not. However, the investigation of the acquisition method
indicated that triggering of the 3DFLASH sequence gave an oscillation of the signal.
Potential explanations could be the fact that the time between two trigger pulses was too short
to be able to sample a complete 3D slab, which for example can cause acquisition and steady
state problems.
The untriggered repeated3DFLASH acquisition method was used because the gradients
limited a subsequent scan to 4 repetitions. NEX was increased since no triggering was used in
the repeated3DFLASH sequence. NEX can reduce motion artifacts by averaging scans
affected by respiratory motion, which commonly is quite steady. Hence, a larger number of
averages will reduce the artifacts.
The optimized protocol was used in a pilot study including four animals measured before and
after the administration of the inflammatory antigen LPS.
Since it was expected to easily see changes from the distributed dose of LPS, no verification
of inflammation was done. However, visual comparison of the images from the pilot study
day 0 and day 1 did not show any findings and hence it could not be stated whether the
inflammation was not visible on the MR images or did not exist at all. The comparison of the
enhancement curves from a ROI in the lung day 0 and day 1 showed neither any difference.
If LPS is correctly administrated it will create an inflammation in some part of the lung.
However, the inflammation will not cover the whole lung and therefore it can be hard to
define the affected region if no visible change is seen. In the analyses it is important to be
able to select a ROI that is healthy day 0 and inflammated day 1 in order to detect a change in

43
permeability. This becomes difficult and also more important when the inflammatory region
not covers the whole lung.
Therefore, further studies should use verification methods as inflammatory cell count or
morphologic MRI in order to define a region of inflammation for further analyses. T2-
weighted SE imaging could be useful if edema as a consequence of the inflammation already
was present (takes often ≥ 48 h). Inflammatory cell counting was not possible to perform in
this study due to technical limitations.

44
CONCLUSION
Protocols for quantitative measurements of pulmonary perfusion and permeability using a
preclinical MR scanner were successfully developed. However, there were difficulties
involved that limit the application of the perfusion protocol in practice. Finding an
appropriate CA concentration from the linear signal CA concentration range was hard using
2D scanning due to inflow effects. To avoid inflow effects, further experiments should
investigate the capacity of rapid 3D scanning for the determination of the signal CA
concentration range but also for the protocol of quantitative pulmonary perfusion
measurements.
A protocol for measurements of pulmonary permeability was successfully developed in this
report. During a pilot study investigating permeability changes after an administration of
LPS, no change could be found by visual inspection of the resulting images. However, this
was due to difficulties to define a region of inflammation since the entire lung was not
affected of inflammation. Therefore, further pilot studies have to use verification methods of
inflammation e.g. cell counts in order to have a reliable starting point in the identification of
changes in pulmonary permeability.

45
ACKNOWLEDGEMENT
Many people have made this work possible. First, I would like to thank my very helpful and
experienced supervisors Frank Risse and Lars E Olsson for their guidance through the
project. I would also like to thank Jelena Pesic for all assistance in the lab and for the
professional handling of the animals.
I do also want to mention Edwin, Paul, Raimo and Abdel in the DECS imaging team at
AstraZeneca for friendly welcome and support during this project.
An additional thank is sent to Yolanda Ljungqvist at AstraZeneca, which was very helpful
during the construction of the in vitro phantom and did everything in her way to find the right
materials.
Finally, thanks to Björn, family and friends for patient and invaluable support during this
master thesis.

46
REFERENCES
Abdlamer S. Mouse lung imaging using oxygen enhanced MRI. DECS Imaging AstraZeneca.
Technical report 2007.
van Beek EJR, Hoffman EA. Functional imaging: CT and MRI. Clin Chest Med 2008;
28:195-216.
Hatabu H, Tadamura E, Levin DL, Chen Q, Li W, Kim D, Prasad PV, Edelman RR.
Quantitative assessment of pulmonary perfusion with contrast-enhanced MRI.
Magn Reson Med 1999; 42:1033-1038.
Kauczor HU, Kreitner KF. Contrast Enhanced MRI of the lung. Eur J of Radiol 2000;
34:196-207.
Kauczor HU, Ley-Zaporozhan J, Ley S. Imaging of pulmonary pathologies. Focus on
magnetic resonance imaging. Proc Am Thorac Soc. 2009; 6:458-463.
Lacerda S, Law M. Magnetic resonance perfusion and permeability imaging in brain tumors.
Neuroimaging Clin N Am 2009; 19:527-57.
McRobbie DW, Moore EA, Graves MJ, Prince MR. MRI From proton to picture. Cambridge;
Cambridge University Press 2007.
Mistry NN, Pollaro J, Song J. Pulmonary perfusion imaging in the rodent lung using dynamic
contrast-enhanced MRI. J Magn Reson Med 2008; 59:289-297.
Månsson Sven. Development of an optimized FLASH MRI pulse sequence. DECS Imaging
AstraZeneca. Technical report 2008.
Naish J, Kershaw L, Buckley D, Jackson A,Waterton J, Parker G. Modeling of contrast agent
kinetics in the lung in the lung using T1-weighted dynamic contrast enhanced MRI.
J Magn Reson Med 2009; 61:1507-1514.
Ohno Y, Hatabu H, Murase K, Higashino T, Kawamitsu H, Watanabe H, Takenaka D, Fujii
M, Sugimura K. Quantitative assessment of regional pulmonary perfusion in the entire lung
using three dimensional ultrafast dynamic contrast-enhanced magnetic resonance imaging:
Preliminary experience in 40 subjects. J Magn Reson Med 2004; 20:353-365.
Reichenbach JR. 1H T1 and T2 measurements of the MR imaging contrast agents Gd-DTPA
and Gd-DTPA BMA at 1.5T. Eur J Radiol. 1997; 264-274.

47
Risse F. MR perfusion of the lung. In: H.-U. Kauczor, editor. MRI of the Lung. Berlin,
Heidelberg: Springer; 2009. p 25-34.
Roberts T. Technical and practical considerations for permeability modeling of dynamic
contrast enhanced MRI. Acad Radiol. 2005; 12:34-37.
Sand O, Sjaastad OV, Haug E, Bjålie JG. Människokroppen Fysiologi och anatomi. Oslo:
Författarna och Liber AB; 2007.
Shahbazi-Gahrouei D, Williams M, Allen BJ. In vitro study of relationship between signal
intensity and gadolinium-DTPA concentration at high magnetic field strength. Australasian
Radiology 2001; 45:298-304.
Weinmann HJ, Brasch RC, Press WR, Wesbey GE. Characteristics of gadolinium-DTPA
complex: a potential NMR contrast agent. AJR; 1984; 142:619-624.
Wekstein DR. Heart rate of the preweanling rat and its autonomic control. Am J Physiol
1965; 208:1259-1262
Wilhelm DL. Mechanisms responsible for increased vascular permeability in acute
inflammation. Agents actions 1973; 3:297-306.
Wood ML, Hardy PA. Proton relaxation enhancement. J Magn Reson Med 1993; 3:149-156.
Yankeelov TE, Cron GO, Addison CL,Wallace JC, Wilkins RC, Pappas BA, Santyr GE Gore
JC. Comparison of a Reference Region Model With Direct Measurement of an AIF in the
Analysis of DCE-MRI Data. Magn Reson Med 2007; 57:353–361.

48
APPENDIX A1. Enhancement curves from the in vivo experiment in the perfusion section (4.3.1.3) for
all four rats (A, B, C, D)
0
2
4
6
0 200 400
Sign
al [
a.u
.]
Image number
A 0.05 mM/ml
0
2
4
6
0 200 400
Sign
al [
a.u
.]
Image number
A0.1 mM/ml
0
2
4
6
0 200 400
Sign
al [
a.u
.]
Image number
A0.2 mM/ml
0
2
4
6
0 200 400
Sign
al [
a.u
.]
Image number
A0.3 mM/ml
0
2
4
6
0 200 400
Sign
al [
a.u
.]
Image number
B0.05 mM/ml
0
2
4
6
0 200 400
Sign
al [
a.u
.]
Image number
B0.1 mM/mL
0
2
4
6
0 200 400
Sign
al [
a.u
.]
Image number
B0.2 mM/ml
0
2
4
6
0 200 400
Sign
al [
a.u
.]
Image number
B0.3 mM/ml

49
,
0
2
4
6
0 200 400
Sign
al [
a.u
.]
Image number
C0.05 mM/ml
0
2
4
6
0 200 400
Sign
al [
a.u
]
Image number
C0.1 mM/ml
0
2
4
6
0 200 400
Sign
al [
a.u
.]
Image number
C0.2 mM/ml
0
2
4
6
0 200 400Si
gnal
[a.
u.]
Image number
C0.3 mM/ml
0
2
4
6
0 200 400
Sign
al [
a.u
.]
Image number
D0.05 mM/ml
0
2
4
6
0 200 400
Sign
al [
a.u
.]
Image number
D0.1 mM/ml
0
2
4
6
0 200 400
Sign
al [
a.u
]
Image number
D0.2 mM/ml
0
2
4
6
0 200 400
Sign
al [
a.u
]
Image number
D0.3 mM/ml