Determination and verification of possible resource ...hss.ulb.uni-bonn.de/2011/2588/2588.pdf ·...
112
Institut für Landtechnik Professur für Haushalts- und Verfahrenstechnik Prof. Dr. rer. nat. Rainer Stamminger _____________________________________________________________________ Determination and verification of possible resource savings in manual dishwashing I n a u g u r a l – D i s s e r t a t i o n zur Erlangung des Grades Doktor der Ernährungs- und Haushaltswissenschaft (Dr. oec. troph.) der Hohen Landwirtschaftlichen Fakultät der Rheinischen Friedrich-Wilhelms-Universität Bonn vorgelegt am 17.05.2011 von Natalie Anna Fuss aus Saarbrücken
Transcript of Determination and verification of possible resource ...hss.ulb.uni-bonn.de/2011/2588/2588.pdf ·...

Institut für Landtechnik
Professur für Haushalts- und Verfahrenstechnik
Prof. Dr. rer. nat. Rainer Stamminger
_____________________________________________________________________
Determination and verification of possible resource savings in
manual dishwashing
I n a u g u r a l – D i s s e r t a t i o n
zur
Erlangung des Grades
Doktor der Ernährungs- und Haushaltswissenschaft
(Dr. oec. troph.)
der
Hohen Landwirtschaftlichen Fakultät
der
Rheinischen Friedrich-Wilhelms-Universität Bonn
vorgelegt am
17.05.2011
von
Natalie Anna Fuss
aus
Saarbrücken

Referent: Prof. Dr. rer. nat. Rainer Stamminger
Koreferent: Prof. Dr. rer. pol. Michael-Burkhard Piorkowsky
Tag der mündlichen Prüfung: 01.07.2011
Erscheinungsjahr: 2011

Abstract
Many tests and consumer surveys have shown that manual dishwashing at home is
done in very different ways, taking also different amounts of resources. Because
almost every household, whether owning an automatic dishwasher or not still keeps on
washing up a few items by hand, it seems necessary to investigate manual dishwashing
regarding optimisation. Therefore, a project was run at the University of Bonn to find
out an optimal way to clean the dishes by hand. Optimisation in this case means to
reach a reasonably good cleaning performance with the minimum amount of resources,
as water and energy for example. First, manual dishwashing was investigated
experimentally: A repeatable method was developed for the sink washing process and
with this method, several factorial studies were performed to find the factors in the
process that influence the cleaning performance most. On the basis of the results of the
experimental investigation and the knowledge – from previous studies on manual
dishwashing – on how consumers wash up, Best Practice Tips were defined as an
applicable guide for the consumer to save resources. In order to find out if it is
possible to save resources when consumers apply the Best Practice Tips, several
verification studies were run: three comparative laboratory studies, in which the test
persons had to wash up different amounts of dishes, once with their usual behaviour
and once by applying the Best Practice Tips. The results showed that especially with
higher amounts of dishes, relevant resources of energy and water can be saved.
However – possibly due to a different method existing for washing up of only a few
items – no significant reduction was found when consumers were applying the Best
Practice Tips with small amounts of dishes. As a next step, the possibility to save
resources with the Best Practice Tips was verified in an in-home study in two countries
(Germany and Spain). The findings of the previous studies could be confirmed in
general. The savings of water and energy were especially high when persons usually
washing up under running tap water changed their behaviour and washed up the dishes
in a sink filled with water. However, the individual savings differed very much. This
work delivers fundamental knowledge how resources can be saved in manual
dishwashing. It is up to future studies to intensify the experimental investigation of
manual dishwashing and the training with the Best Practice Tips.
Deutsche Kurzfassung
Viele Tests und Verbraucherstudien zeigen, dass Handgeschirrspülen im Haushalt sehr
unterschiedlich ausgeführt wird und dabei auch sehr unterschiedliche Mengen an
Ressourcen verbraucht werden. Da in fast allen Haushalten, sprich auch in denen mit
Geschirrspülmaschine, zumindest einige Teile weiterhin von Hand abgespült werden,
erscheint es nötig das Handgeschirrspülen hinsichtlich einer Optimierung zu
untersuchen. Deshalb wurde an der Universität Bonn ein Projekt durchgeführt, um
eine optimale Weise zu finden von Hand abzuspülen. Optimierung bedeutet in diesem
Fall, ein zufriedenstellendes Reinigungsergebnis mit einem minimalen Input an
Ressourcen, wie z.B. Wasser und Energie, zu erreichen. Zuerst wurde das
Handgeschirrspülen in experimentellen Versuchen untersucht: Eine reproduzierbare
Methode wurde für das Abspülen im Becken entwickelt und mit dieser Methode
wurden mehrere Faktorenstudien durchgeführt um die Faktoren herauszufinden, die
das Reinigungsergebnis am stärksten beeinflussen. Auf Basis der Ergebnisse der
experimentellen Untersuchung und der aus den vorhergehenden Studien gewonnenen
Erkenntnisse, wie der Verbraucher zu Hause abspült, wurden Best Practice Tips als
praktikable Anleitung entwickelt, um Ressourcen einzusparen. Um herauszufinden, ob
bei der Anwendung der Tipps eine Ressourceneinsparung möglich ist, wurden mehrere
Studien durchgeführt. Zunächst fanden drei Vergleichsstudien im Labor statt, bei
denen die Testpersonen verschiedene Geschirrmengen abspülen sollten – einmal so
wie sie es auch zu Hause machen würden, und einmal unter Anwendung der Best
Practice Tips. Die Ergebnisse zeigen, dass besonders bei größeren Geschirrmengen die
Ressourceneinsparung groß ist, jedoch bei kleineren Mengen an Geschirr keine
signifikante Reduzierung ausgemacht werden konnte. Dies liegt wahrscheinlich daran,
dass es eine andere bessere Methode gibt kleine Geschirrmengen abzuspülen. Der
nächste Schritt bestand darin, die Einsparungsmöglichkeiten im Haushalt mittels
Haushaltsstudien in zwei Ländern, Deutschland und Spanien, zu überprüfen. Die
Ergebnisse der vorhergehenden Studien konnten generell bestätigt werden: Die
Einsparungen waren besonders hoch, wenn eine Person, die vorher unter fließendem
Wasser abspülte, ihr Verhalten änderte und das Geschirr dann in einem mit Wasser
gefüllten Becken abwusch. Die individuellen Einsparungen waren jedoch sehr

unterschiedlich. Diese Arbeit bietet grundlegende Erkenntnisse, wie beim
Handgeschirrspülen Ressourcen eingespart werden können. In zukünftigen Studien
sollte die experimentelle Untersuchung des manuellen Geschirrspülen intensiviert
werden, genauso wie die das Training mit den Best Practice Tips.

Contents
1 Introduction ................................................................................. 1
1.1 Household’s resource consumption................................................................ 2
1.2 Understanding and influencing the household’s resource consumption .... 5
1.3 Dishwashing as a specific task where resources are needed in the
household .......................................................................................................... 9
1.3.1 The progress of automatic dishwashing ............................................... 9
1.3.2 Consumer behaviour with dishwashing .............................................. 10
1.4 How to clean the dishes by hand? A review of dishwashing tips .............. 14
2 General objectives and structure of the thesis ....................... 22
3 Experimental optimisation of manual dishwashing .............. 23
3.1 Objective ......................................................................................................... 23
3.2 Material and methods .................................................................................... 23
3.3 Results ............................................................................................................. 29
3.4 Discussion ....................................................................................................... 30
3.5 Conclusion ...................................................................................................... 34
4 Application of Best Practice Tips in a laboratory study (1) . 37
4.1 Objective ......................................................................................................... 37
4.2 Material and methods .................................................................................... 37
4.3 Results ............................................................................................................. 41
4.4 Discussion ....................................................................................................... 46
4.5 Conclusion ...................................................................................................... 48
5 Application of Best Practice Tips in a laboratory study (2) . 49
5.1 Objective ......................................................................................................... 49
5.2 Material and methods .................................................................................... 49

5.3 Results ............................................................................................................. 53
5.4 Discussion and conclusion ............................................................................. 57
5.5 Outlook ........................................................................................................... 60
6 Application of the Best Practice Tips in an in-house study .. 61
6.1 Objectives ....................................................................................................... 61
6.2 Material and methods .................................................................................... 61
6.3 Results ............................................................................................................. 67
6.4 Discussion ....................................................................................................... 77
6.5 Conclusion ...................................................................................................... 80
7 Summary, conclusion and outlook .......................................... 81
References ........................................................................................... 85
List of abbreviations .......................................................................... 97
List of figures ...................................................................................... 99
List of tables ..................................................................................... 101
Acknowledgements .............................................................................. I
Curriculum vitae .................................................................................. I

INTRODUCTION 1
1 Introduction
Dishwashing is a mundane task in almost every household. It is either carried out by
hand or by machine. With the growing dissemination of dishwashing machines in
households, it could be assumed that manual dishwashing becomes redundant. But this
is not the case, because even in a household owning a dishwasher, at least a few items
are still cleaned by hand (RICHTER, 2010a). Besides, RICHTER found out that the
consumer behaviour with the dishwasher as well as with hand dishwashing leaves
room for more efficiency and reveals therewith the need to introduce a more
sustainable behaviour with dishwashing and “to create campaigns that are effective in
changing consumer behaviour” (RICHTER, 2010b, p. 108).
It is important to clarify what sustainability means in this context, because there are
various definitions and consequently confusion about what exactly the term means
(KUROWSKA, 2003). A lot of these definitions are not referring specifically to the
household. However, as the behaviour and the consumption patterns of households are
profoundly affecting the stocks of natural resources and the environmental quality
(OECD, 2011), a household near definition of this term seems to be necessary.
Goldsmith defines the term „sustainability‟ as follows:
„Sustainability is about conscious design and the consideration of the impacts
consumption choices make on the environment given finite resources. It involves
ethics, ecology, and estimations of system life expectancies. The ultimate goal is
sustainable development – a form of growth wherein societal needs, present and
future, are met. Sustainable development requires the input and cooperation of all
segments of society, producers as well as consumers. Towards this end, more careful
decisions at every level are being made about the products and services brought into
and used in the home.” (GOLDSMITH, 2010, p. 330)
In this definition it is considered that the household‟s resource consumption amounts
up to an important part of the total resource consumption and hence a sustainable
everyday behaviour can contribute to the conservation and the protection of the
2 INTRODUCTION
environment (UNEP, 2004). Yet, the initial base of the resource consumption in
households is different. The following chapter gives an idea of the water and energy
consumption in the residential sector.
1.1 Household’s resource consumption
In a household‟s day to day activities, especially the water and the energy consumption
have an influence on the environment, besides food consumption, waste generation
and transport choices (OECD, 2011).
According to the OECD, the share of the households of the total water consumption
amounts to 10 to 30% of the total consumption. Average water consumption among
OECD countries is at about 100,000 L per capita and year, which corresponds to a per-
day water consumption of 274 L. The exact level is influenced by household
characteristics, such as the number of persons per household and the residence size. It
was found that the water consumption per person is the higher the less persons live in a
household and the higher the income of the household is (OECD, 2011).
In Europe, the daily water consumption per person varies between 100 L and 320 L
with an average of 155 L per person and day. Ukraine and Spain are with 320 L resp.
265 L the countries with the highest water consumption per person and day, whereas
Lithuania and Estonia are with 97 L resp. 100 L at the bottom level (Figure 1-1) (EEA,
2005).

INTRODUCTION 3
Figure 1-1: Water consumption per capita and day of some European countries
Source: own illustration based on EEA (2005)
Approximately one third of the daily water consumption is used for personal hygiene,
another third for washing clothes and dishwashing, 20 to 30% for toilet flushing and
5% for drinking and cooking (EEA, 2001). The Bundesamt für Umwelt of Switzerland
(BAFU) has also published data on how water is used in the household (Figure 1-2):
Of 162 L of consumed water per person and day in Switzerland, the largest part is used
for toilet flushing (48 L) and for bathing/ showering (32 L), whereas only 3 L are
consumed for dishwashing (BAFU, 2003). It is not mentioned if this comprises
manual and automatic dishwashing or if only dishwashing machines are considered.
Figure 1-3 shows a similar categorisation with data for Germany published by the
Bundesverband der Energie- und Wasserwirtschaft (BDEW, 2011). The highest
percentage of the daily water consumption is used for bathing, showering and body
care (36%) followed by toilet flushing with 20%. The share for dishwashing is with
6% (7 L/person and day) slightly higher than in the Suisse data. But as already in the
Suisse data, no hint is given if this comprises only automatic dishwashing or also hand
dishwashing.
97
100
103
107
109
125
126
127
146
150
150
151
160
161
164
232
265
320
155
0 50 100 150 200 250 300 350
Lithuania
Estonia
Czech Republic
Belgium
Slovak Repbulic
Austria
Netherlands
Germany
Slovenia
Finland
Luxembourg
Hungary
Switzerland
Portugal
France
Cratia
Spain
Ukraine
Average
Water consumption per capita and day in L

4 INTRODUCTION
Figure 1-2: Allocation of the daily water consumption – average data from Switzerland Source: own illustration based on BAFU (2003)
Figure 1-3: Allocation of the daily water consumption – average data from Germany Source: own illustration based on BDEW (2011)
The household share for the energy consumption is comparable to the share of the
water consumption. According to data of the OECD, the commercial and residential
energy use lies between 15% and 30% of the final energy consumption. Additionally,
it is the second fastest growing area of demand after transport (OECD, 2002). Among
OECD countries, the household‟s energy use is expected to increase by some 1.4% per
year. This number is even higher in non-OECD countries (OECD, 2008).
In 2005, an average U.S. household consumed per year 94.9 million Btu (equivalent to
27811 kWh) (EIA, 2005). This is equivalent to 76.2 kWh per day and household. This
data does not include energy used for transport. The data from a German survey states
that the residential German energy consumption (without energy for transport) in 2005
is at 2609 Petajoule (FORSA and RWI, 2005). Assuming a number of around
40 million households in Germany (DESTATIS, 2009), the energy consumption per
household and year would be at 18118 kWh, which is equivalent to 49.6 kWh per
household and day.
The largest part of the energy in U.S. households is used for space heating (31%). 5%
of the energy used in households is consumed for dishwashers, washing machines and
dryers. The hot water used for manual dishwashing is assumed to fall into the category
“Water heating” which amounts up to a share of 12% (Figure 1-4) (DOE, 2007).
Toilet flushing,
48 L, 30%
Bathing and
showering, 32 L, 20%
Clothes washing
and rinsing,
30 L, 19%
Food and beverages, 24 L, 15%
Body care, hand
washing, 21 L, 13%
Gardening, 4 L, 2%
Dish-washing, 3 L, 2%
Total 162 L
Bathing, showering, body care, 44 L, 36%
Toilet flushing,
34 L, 27%
Clothes washing, 15 L, 12%
Small business
share, 11 L, 9%
Dish-washing, 7 L, 6%
Room/ car cleaning,
gardening, 7 L, 6%
Food and beverages, 5 L, 4%
Total 123 L

INTRODUCTION 5
Figure 1-4: Energy use in U.S. households
Source: own illustration based on DOE (2007)
The data gives an overview on the household‟s water and energy consumption in
general. However, the question occurs how exactly the consumption behaviour can be
explained and influenced towards more sustainability.
1.2 Understanding and influencing the household’s resource consumption
Despite the household‟s impact to the total resource consumption and the awareness
that a more sustainable behaviour is necessary (OECD, 2011), DAWES found that
consumers are facing a so-called “social dilemma” (DAWES, 1980). Collectively,
everyone is better off if they change behaviour and engage in saving resources, but
rational self-interest often leads to the contrary, i.e. environmental exploitation (KARP,
1996). Therefore, there are a lot of studies that attempt to predict conservation, as well
as understand, shape and improve the household‟s resource consumption.
Three different classifications were found on how to influence pro-environmental
behaviour. COOK and BERRENBERG describe in a conceptual framework seven
commonly used approaches to encourage conservation behaviour: persuasive
communication, evoke of attitude-consistent behaviour (when a general
Space heating, 31%
Space cooling, 12%
Water heating, 12%
Lighting, 11%Refrigeration,
8%
Electronics, 7%
Clothes washers, dryers,
dishwashers, 5%
Cooking, 4%
Computers, 1%
Other, 9%

6 INTRODUCTION
pro-conservation attitude already exists), material incentives and disincentives, social
incentives (such as social recognition), famous role models, minimizing inhibitors,
such as lack of knowledge on how to save resources and informing by feedback or
self-monitoring (COOK and BERRENBERG, 1981). GOLDSMITH categorizes four general
approaches on how consumer behaviour can be influenced towards a more sustainable
way: the punishment-oriented approach, the rewarding approach (giving incentives),
the persuasion-oriented approach and the approach to reach behaviour change with the
influence of other (GOLDSMITH and GOLDSMITH, 2011).
Another classification is presented by ABRAHAMSE et al. who evaluate the
effectiveness of interventions aiming to encourage households to reduce energy
consumption. They distinguish studies according to whether they focus on antecedent
strategies (commitment, goal setting, information, modelling) or consequence
strategies (feedback, rewards). Antecedent strategies influence determinants prior to
the performance of behaviour. Consequence interventions assume that positive or
negative consequences motivate to change behaviour (ABRAHAMSE et al., 2005).
Commitment as antecedent strategy is a promise to save resources and often linked
with a specific goal, e.g. to save 10% of energy. Goal setting means that a specific goal
to save resources is either given to the household or is set by the households itself. The
instrument of giving information can either contain information on the general
problem why resources should be saved or contain information on how resources can
be saved. Furthermore, the modelling strategy is classified among the antecedent
strategies (ABRAHAMSE et al., 2005). Modelling means after Bandura‟s learning
theory that examples are provided with recommended behaviour (BANDURA, 1977).
Among the consequence strategies, the rewards strategy is situated. Rewards are often
monetary rewards given for realised conservation. The feedback instrument is also
classified in the category of consequence strategies. It can be further distinguished
between how often feedback is given on the actual resource consumption
(continuously, daily, weekly, monthly). Another subset of the feedback strategy is the
comparative feedback: Here, information on the actual resource consumption is
presented in comparison to the consumption of others (ABRAHAMSE et al., 2005).
INTRODUCTION 7
In the reviewed literature, especially the feedback instrument was found to be studied.
This instrument was already investigated in the seventies: A study of SELIGMAN AND
DARLEY revealed that immediate feedback on the energy consumption can
significantly reduce it (SELIGMAN and DARLEY, 1976). However, this is contradicting
to some extent to what BECKER found, namely that only feedback had no influence on
the energy consumption whereas feedback combined with setting a difficult goal
shows effect on energy saving (BECKER, 1978). The feedback instrument was not only
investigated for the energy consumption but also for the water consumption. GELLER
et al. investigated three possible factors of influencing the water consumption:
Education how and where to save water, daily feedback on the water consumption and
low cost conservation devices such as a tap aerator. They revealed that significant
water savings only occurred with the water conservation devices, but not with the
instrument of feedback (GELLER et al., 1983).
Giving feedback by technology to support sustainable behaviour in private households
was studied by GRØNHØJ and THØGERSEN. They evaluated the effects of giving
households feedback about their electricity consumption on a small screen. The
participating households could save 8.1% of energy and especially families with
teenage children were receptive to this type of feedback (GRØNHØJ and THØGERSEN,
2011). The results of a study by WALLENBORN, who investigated the influence of an
installed electricity metre, were similar. The immediate feedback provided by such a
device helped to save energy, but only in the households that were already involved in
energy savings (WALLENBORN et al., 2011).
Yet, not only the consequence strategies are examined, but also antecedent strategy
investigations can be found: Instead of giving feedback STALL-MEADOWS AND
HEBERT examined in which way consumer education has an impact on a more
sustainable behaviour with different lighting alternatives. They revealed that, with an
increased understanding of the energy efficiency of the three lighting types, consumers
tend to choose the higher priced but more efficient alternative (STALL-MEADOWS and
HEBERT, 2011).

8 INTRODUCTION
Other studies are focusing more on social influence and investigate various aspects
how this can influence the household towards a more sustainable handling of
resources. A three-variable regression model with an explanation of the variation in
the residential water consumption was developed by AITKEN et al.. They showed that
the number of residents, the washing machine loads and the property value accounted
for 60% of the variance. However, they concluded that attitudes, habits and values
were poor predictors of the water consumption (AITKEN et al., 1994). This is to some
extent contradictory to what CORRAL-VERDUGO and FRIAS-ARMENTA found: They
proved that personal normative beliefs have a positive effect on the water conservation
and that anti-social behaviour inhibited that behaviour (CORRAL-VERDUGO and FRÍAS-
ARMENTA, 2006). A similar subject was investigated eight years later by PINTO et al.:
They found that water consumption increased with more socially oriented values.
Wasteful habits could be predicted by environmental awareness and personal values
(PINTO et al., 2011).
The OECD investigated in a large project about to what extent different factors
(market, demographic and policy related factors) affect the resource consumption in
the household. It was a survey with 10000 households distributed over all
OECD countries. One important result was that it is important to give the right
economic incentive to induce a behaviour change in the household towards more
sustainability. Especially, price-based incentives encourage water and energy savings.
It was also revealed that there is a lack of knowledge about the own water and energy
consumption. Therefore it was concluded that, beside the price as instrument for
savings, the so-called “softer instruments” (OECD, 2011, p. 16) like information and
education play a key role as supplement. The environmental awareness and the
household‟s concern for the environment were found to be other factors influencing
the household‟s resource consumption. On this basis, it was suggested that is an
important task for governments to promote information campaigns which aim at
reinforcing the environmental awareness and encourage behaviour changes. It was
concluded from the study that a combination of instruments is necessary to promote
effective behaviour changes. Because of a significant variation in the environmental

INTRODUCTION 9
behaviour, this mixture of instruments would have to be individually adaptable for
specific target groups (OECD, 2011).
To conclude, varying degrees of effect can be determined when looking at
interventions to conserve resources like water and energy. There are studies
investigating the same instrument that prove success and others that show failure. Yet,
all those studies have in common that they are focusing either on water or energy
consumption in general and not on a specific household task, whereas up to now no
studies were found that investigate the possibility to save resources in a specific
household task.
1.3 Dishwashing as a specific task where resources are needed in the household
Dishwashing as a specific household task consuming resources can be either carried
out by hand or by machine. While the efficiency of the automatic dishwasher is
optimised in manifold ways, both ways of doing the dishes depend on the consumer‟s
behaviour (RICHTER, 2010a).
1.3.1 The progress of automatic dishwashing
Since 1999, dishwashers on the European market have to be labelled with the
European Energy Label. Four years later, in 2003, the European Committee of
Domestic Equipment Manufacturers (CECED) published a voluntary agreement on
improving the dishwasher efficiency, which some of the dishwasher manufacturers
signed in order to diminish the energy consumption of domestic dishwashers by
reducing the fleet consumption and by a stepwise phasing out of less efficient
dishwashers (CECED, 2003). But already before this date, the efficiency of the
automatic dishwasher was improved steadily. From 1975 on, it was possible to reduce
the energy consumption of a standard household dishwasher with a capacity of 12
place settings from a bit more than 2.64 kWh per cycle down to some more than
1.14 kWh per cycle in 2005, which equals a reduction of 57% in less than 35 years

10 INTRODUCTION
(STAMMINGER, 2006). The development of the water consumption is parallel to the
energy consumption: In 1975, an average dishwasher needed more than 59.5 L of
water and in 2005 only 13.3 L, equivalent to a reduction of 78%. And the tendency of
the consumption is further decreasing: According to manufacturer‟s data, newest
technologies lead to a water consumption of 6.5 L and an energy consumption of
0.93 kWh for washing up 13 place settings (SIEMENS-ELECTROGERÄTE GMBH, 2010).
With the efficiency of automatic dishwashers, the penetration rate of automatic
dishwashers is rising: In Germany in 2010, 67% of the households own a dishwashing
machine, 47% more than in 1980 (ZVEI, 2011). In Canada, the penetration rate for
automatic dishwashers has risen from 54% in 1993 up to 70% in 2007 (OEE, 2007).
Nevertheless, a very efficient machine is useless if used in an inefficient way. RICHTER
found that there is room for improvement with the consumers‟ behaviour with a
dishwashing machine: Choosing the correct programme, using the maximum capacity
of dishwasher and pre-treating the dishes in a correct way would help to save more
resources with automatic dishwashing (RICHTER, 2010a). However, this does not mean
that manual dishwashing has become redundant. It was found that even in households
owning a dishwasher, some items are still cleaned by hand and others items are pre-
cleaned by hand before they are placed in the dishwasher (RICHTER, 2010a; RICHTER,
2011).
1.3.2 Consumer behaviour with dishwashing
Manual dishwashing was already investigated in 1971 when four housewives had to
compete with a dishwashing machine (LUECKE, 1971). In 1993, GUDD et al. compared
the dishwashing behaviour of ten persons washing up a larger amount of dishes and an
automatic dishwasher (GUDD et al., 1993). GUTZSCHEBAUCH et al. compared
systematically dishwashing by hand and in the machine regarding the detergent, life
cycle assessment, economical efficiency, consumer habits, hygiene and surfactant
residues (GUTZSCHEBAUCH et al., 1996).

INTRODUCTION 11
A cross-cultural analysis between Japan and Norway revealed that there are significant
differences in dishwashing habits between those two countries. All the participants
from Norway washed the dishes in a basin with water and detergent whereas the
majority of Japanese households washed up under running tap water. The Japanese
dishwashing behaviour is explained by too small kitchen sinks so that washing up
under running tap water is more convenient. Furthermore, it was found that the
Norway participants all used hot water for washing up whereas the majority of
Japanese persons varied the temperature with the season: hot water in the winter and
cold water in the summer (WILHITE et al., 1996).
In a study conducted at the University of Bonn the consumer behaviour and resource
consumption with manual dishwashing was investigated with 113 test participants
from 10 European countries (Germany, Poland/ Czech Republic, Italy, Spain/
Portugal, Turkey, France, Great Britain/ Ireland). For washing up 12 place settings, the
test participants needed on average 103 L of water, 2.5 kWh of energy, 35 g of
detergent and a time of 79 min. The average did not reveal the main finding of the
study, that habits and practices vary between individuals. The water consumption
varied between under 20 L and above 440 L. Some of the test persons consumed less
than 0.25 kWh of energy and others needed more than 8 kWh for washing up this
amount of dishes. The cleaning result of the dishes varied much the same as the
resource consumption. Some test persons reached a good cleaning result already with
small amounts of resources and others did not achieve an acceptable cleaning
performance with large amounts of water and energy. Despite the differences between
individuals, country specific tendencies could be made out. (STAMMINGER et al.,
2007a).
In an extension of the study from STAMMINGER et al. (STAMMINGER et al., 2007a), the
dishwashing behaviour of 100 test persons from other countries (Hungary, Russia,
Germany, South Africa and China) was studied. The same conclusion was drawn,
namely, that the water, energy and detergent consumption as well as the time for
washing up 12 place settings varied dramatically from person to person and from
country to country (BERKHOLZ and STAMMINGER, 2009).
12 INTRODUCTION
Another investigation studied the manual dishwashing behaviour of 150 U.K.
consumers and compared it to the performance of an automatic dishwasher. On
average, the test persons needed for washing up 12 place settings 49 L of water and
1.7 kWh of energy in comparison to 13 L of water and 1.3 kWh of energy for the
dishwasher. As already found by STAMMINGER et al. for consumers of different
Europeans countries (STAMMINGER et al., 2007a) and BERKHOLZ and STAMMINGER
for other countries (BERKHOLZ and STAMMINGER, 2009), the results of the U.K.
consumers revealed a wide range of washing up techniques what finds expression in
the large distribution of the consumption values. An additional questionnaire revealed
that around two thirds of the test persons who owned an automatic dishwasher
maintained washing up by hand once a day or even more often (BERKHOLZ et al.,
2010).
All the studies named above were conducted on the basis of 12 place settings, but the
manual dishwashing behaviour with smaller amounts of dishes and pots and pans was
also examined. In a study 46 with consumers washing up two place settings and pots
and pans, it was found that cleaning smaller amounts of dishes did not reduce the per
item consumption and that especially with hard soiled items such as pots and pans the
resource consumption rises. The comparison of the consumer behaviour to an
automatic dishwasher showed an advantage for the machine in terms of a better
cleaning performance as well as a lower water consumption (STAMMINGER et al.,
2007b).
A survey of the German dishwashing behaviour revealed results on the self-assessment
of the consumers. Especially interesting is the question regarding the categorisation of
the behaviour: Regardless of the possession of an automatic dishwasher, the majority
of the Germans wash up either completely in a sink or in a sink combined with
washing up under running tap water. Only few of them state that they clean their
dishes under running tap water (STAMMINGER and STREICHARDT, 2009).
Dishwashing habits by hand and in the machine were also investigated in an online
survey with 1209 consumers from four European countries. The survey showed on the
one hand the importance of low water and energy consumption when a dishwasher is

INTRODUCTION 13
to be purchased. On the other hand, the saving potential of an efficient dishwasher is
partly counterbalanced by a less efficient consumer behaviour, e.g. pre-washing the
dishes by hand before cleaning them in the dishwasher. It was also shown that
differences in manual dishwashing habits exist between households with and without
dishwasher as well as between countries: In households with a dishwasher, manually
cleaned dishes are more frequently washed up under running tap water whereas in
households without a dishwashing machine the practice of filling a sink with water is
more common. In Italian and Swedish households without a dishwasher, the habit of
cleaning dishes under running tap water is performed more often than in the U.K. and
in Germany. In these two countries, the sink washing practice is predominant,
especially in households without a dishwasher (RICHTER, 2010a).
Studies were not only conducted in the laboratory or with a questionnaire: RICHTER
ran an in-house study in which he investigated the consumer behaviour with both
manual and automatic dishwashing. In four European countries (Germany, Italy,
Sweden and the U.K.), 200 households had to record their dishwashing behaviour in a
diary. Additionally, measuring instruments were installed at the kitchen tap in some of
these households. It was proved that households owning a dishwashing machine used
on average 50% less water and 28% less energy per cleaned items in comparison to
households without a dishwasher (RICHTER, 2011). Households without a dishwasher
spent more time on cleaning the dishes by hand. However, a share between 24%
(Germany) and 42% (Italy, U.K) of the items still were cleaned by hand even in
households with a dishwashing machine. Different practices of cleaning the dishes by
hand were also compared: It was found that less water is consumed per item if the
dishes are cleaned in a sink filled with water, compared to the water consumption of
cleaning the dishes under running tap water. It was concluded that even with the rise of
the penetration of automatic dishwashers, manual dishwashing does not become
redundant and that especially with manual dishwashing the majority of dishwashing
cycles is carried out rather inefficiently under continuously running tap water
(RICHTER, 2010b).

14 INTRODUCTION
The total of the reviewed studies show the great variety of the consumer‟s behaviour
and the resource consumption when washing up the dishes by hand. As EMMEL
already claimed for automatic dishwashing, BERKHOLZ and STAMMINGER asked for
manual dishwashing and RICHTER demanded for both ways of cleaning the dishes,
there is a necessity to find information campaigns that are effective in changing the
consumer‟s behaviour (BERKHOLZ et al., 2010; EMMEL et al., 2003; RICHTER, 2010b).
1.4 How to clean the dishes by hand? A review of dishwashing tips
A general categorisation of washing dishes by hand is presented by SHI et al. (SHI et
al., 2005). They differentiate between three different methods to wash up and present
country specific differences on how often each method is used in different countries
(Table 1-1). According to this data, the so-called “full sink method”, meaning the
consumer washes up in a sink filled with water is mainly carried out in Germany, the
United Kingdom and in the United States. By contrary, the so-called “direct
application method” is applied the most often in Japan. “Direct application” refers to
the way of dosing the detergent, which – in this method – is directly poured on the
washing up implement or the dishes. Then, the dishes are cleaned under running tap
water. It is also reported about a third modification the so-called “concentrated
minisolution”. With this method, the person cleaning the dishes dilutes some detergent
in a small bowl. The implement is dunked in this “concentrated minisolution” and
applied the on the dishes. Afterwards the dishes are rinsed under running tap water.
This method is mainly applied in Mexico whereas it seems to be almost unknown in
Germany (Table 1-1). Though it is mentioned how often a certain method is carried
out in some countries, it is not specified if and in which way the methods may differ in
efficiency and resource consumption.

INTRODUCTION 15
Table 1-1: Typical consumer hand dishwashing methods in selected countries
Full sink Direct application Concentrated minisolution
Description Washing up in a sink filled with water,
detergent dosed in the sink
Washing up under running tap water,
detergent dosed on the implement
Washing up under running tap water,
detergent diluted in a small bowl
Country Data in % of dishwashing loads by consumers
United States 72 27 1
United Kingdom 82 14 4
Germany 93 7 0
France 51 38 11
Spain 35 50 15
Japan 3 90 7
Mexico 1 15 83
Source: own illustration based on unpublished data from WESTFIELD AND RUIZ-PARDO (2004) cited as
per SHI et al. (2005, p. 111)
Little more is said in scientific resources about how to clean the dishes by hand.
However, the World Wide Web provides a variety of Blogs, Forums and Websites of
organisations with tips for manual dishwashing. Table 1-2 presents an overview on the
tips and the corresponding sources from German, English, French and Spanish
speaking websites. These tips are described more in-depth and discussed in the
following.
Table 1-2: Gathering of dishwashing tips in the World Wide Web
Category Recommendation References
Time to wash up
Wash up immediately after meal.
AID INFODIENST (n.d.) ARMENDARIZ (2011) BAYAN (n.d.) FOOD-MONITOR (2010)
FORUM WASCHEN (n.d.) N.N. (2007) N.N. (2010b) N.N. (n.d.-c)
Accumulate dishes REICHMANN (2008)
Before washing up
Dispose of food leftovers into the bin.
ACSD (n.d.) AID INFODIENST (n.d.) BAYAN (n.d.) COMMENT FAIT-ON (n.d.) COTTAGE LIFE (2009)
EKOPEDIA (2011) FORUM WASCHEN (n.d.) N.N. (2007) N.N. (2008) N.N. (n.d.-b)
Pre-rinse if necessary. ACSD (n.d.) FIT GMBH (n.d.) FORUM WASCHEN (n.d.)
N.N. (2007) N.N. (2010c)
Do not pre-rinse. COTTAGE LIFE (2009)

16 INTRODUCTION
Category Recommendation References
Soak hard burnt soils with hot water.
ACI (n.d.) ACSD (n.d.) AID INFODIENST (n.d.) COTTAGE LIFE (2009) EKOPEDIA (2011) EURORESIDENTES (n.d.) FIT GMBH (n.d.) FORUM WASCHEN (n.d.)
LIFESPY (2011) N.N. (2007) N.N. (2008) N.N. (2009c) N.N. (2010a) N.N. (n.d.-c) REICHMANN (2008) ROZIO (2008)
Use detergent to soak. EURORESIDENTES (n.d.) FORUM WASCHEN (n.d.)
N.N. (2010a) TINOCO (2008)
Do not soak because of germs.
ARMENDARIZ (2011)
Washing up order
Washing up order: least soiled items (e.g. glasses) first.
AID INFODIENST (n.d.) FIT GMBH (n.d.) N.N. (2007) N.N. (2008)
N.N. (2009c) N.N. (2010c) N.N. (n.d.-b) VIVAT (n.d.)
General ways of washing up
Do not wash up under running tap water.
CAVE (n.d.) COMMENT FAIT-ON (n.d.) COTTAGE LIFE (2009) CORUZERY (2008) ECOLOGIC BARNA (n.d.) EKOPEDIA (2011) EURORESIDENTES (n.d.)
FORUM WASCHEN (n.d.) N.N. (2008) N.N. (2009a) N.N. (2010c) ROZIO (2008) TINOCO (2008) VIVAT (n.d.)
Wash up in a sink filled with water (not mentioned how many sinks).
CAVE (n.d.) ECOLOGIC BARNA (n.d.) ENNOVATIONZ (2010) EURORESIDENTES (n.d.) FORUM WASCHEN (n.d.)
N.N. (2009a) N.N. (2010c) ROZIO (2008) HENKEL AG & CO. (n.d.): sink washing presumed
Only wet the sponge for cleaning the plates (followed by rinsing).
ARMENDARIZ (2011)
Wash up in two sinks filled with water.
AID INFODIENST (n.d.) BC HYDRO (2009) COTTAGE LIFE (2009) CORUZERY (2008) EKOPEDIA (2011) N.N. (2007)
N.N. (2008) N.N. (2009b) N.N. (2010a) REICHMANN (2008) VIVAT (n.d.)
Wash up in three compartments.
BAYAN (n.d.) NFSMI (2009)
Wash up in basins or a pot placed in the sinks (less water, and possibility to dispose of fluids into the drain).
ACSD (n.d.) N.N. (2007)
Only fill your sink half with water.
BC HYDRO (2009) EKOPEDIA (2011) ENNOVATIONZ (2010)
N.N. (2007) PETERSON (2008) PRIEBE (n.d.)
Use as hot water as possible.
ACSD (n.d.) AID INFODIENST (n.d.) COMMENT FAIT-ON (n.d.) EKOPEDIA (2011)
N.N. (2007) N.N. (2009c) N.N. (2010c)
Use cold water for cleaning (in combination with hot rinsing water).
N.N. (2009b)
Wash up under hot running tap water.
N.N. (n.d.-b)
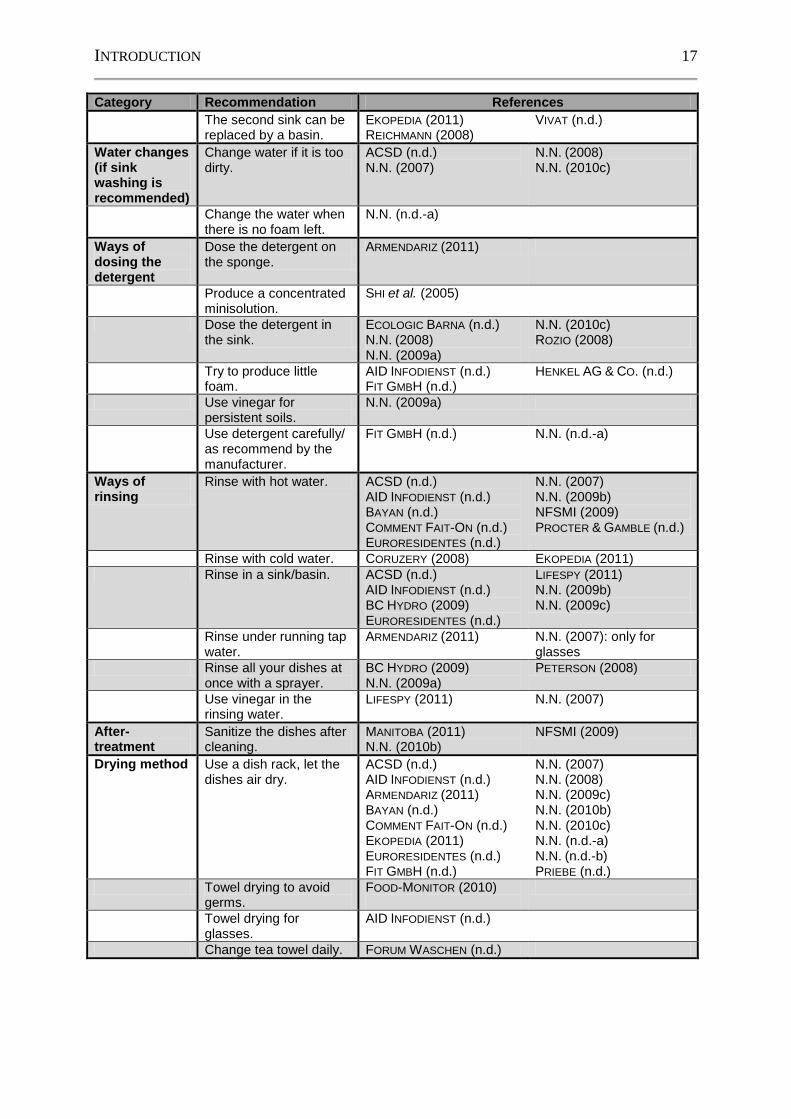
INTRODUCTION 17
Category Recommendation References
The second sink can be replaced by a basin.
EKOPEDIA (2011) REICHMANN (2008)
VIVAT (n.d.)
Water changes (if sink washing is recommended)
Change water if it is too dirty.
ACSD (n.d.) N.N. (2007)
N.N. (2008) N.N. (2010c)
Change the water when there is no foam left.
N.N. (n.d.-a)
Ways of dosing the detergent
Dose the detergent on the sponge.
ARMENDARIZ (2011)
Produce a concentrated minisolution.
SHI et al. (2005)
Dose the detergent in the sink.
ECOLOGIC BARNA (n.d.) N.N. (2008) N.N. (2009a)
N.N. (2010c) ROZIO (2008)
Try to produce little foam.
AID INFODIENST (n.d.) FIT GMBH (n.d.)
HENKEL AG & CO. (n.d.)
Use vinegar for persistent soils.
N.N. (2009a)
Use detergent carefully/ as recommend by the manufacturer.
FIT GMBH (n.d.) N.N. (n.d.-a)
Ways of rinsing
Rinse with hot water. ACSD (n.d.) AID INFODIENST (n.d.) BAYAN (n.d.) COMMENT FAIT-ON (n.d.) EURORESIDENTES (n.d.)
N.N. (2007) N.N. (2009b) NFSMI (2009) PROCTER & GAMBLE (n.d.)
Rinse with cold water. CORUZERY (2008) EKOPEDIA (2011)
Rinse in a sink/basin. ACSD (n.d.) AID INFODIENST (n.d.) BC HYDRO (2009) EURORESIDENTES (n.d.)
LIFESPY (2011) N.N. (2009b) N.N. (2009c)
Rinse under running tap water.
ARMENDARIZ (2011) N.N. (2007): only for glasses
Rinse all your dishes at once with a sprayer.
BC HYDRO (2009) N.N. (2009a)
PETERSON (2008)
Use vinegar in the rinsing water.
LIFESPY (2011) N.N. (2007)
After-treatment
Sanitize the dishes after cleaning.
MANITOBA (2011) N.N. (2010b)
NFSMI (2009)
Drying method Use a dish rack, let the dishes air dry.
ACSD (n.d.) AID INFODIENST (n.d.) ARMENDARIZ (2011) BAYAN (n.d.) COMMENT FAIT-ON (n.d.) EKOPEDIA (2011) EURORESIDENTES (n.d.) FIT GMBH (n.d.)
N.N. (2007) N.N. (2008) N.N. (2009c) N.N. (2010b) N.N. (2010c) N.N. (n.d.-a) N.N. (n.d.-b) PRIEBE (n.d.)
Towel drying to avoid germs.
FOOD-MONITOR (2010)
Towel drying for glasses.
AID INFODIENST (n.d.)
Change tea towel daily. FORUM WASCHEN (n.d.)

18 INTRODUCTION
Category Recommendation References
Additional tips Use gloves. ACSD (n.d.) AID INFODIENST (n.d.) COMMENT FAIT-ON (n.d.) EURORESIDENTES (n.d.) FORUM WASCHEN (n.d.) LIFESPY (2011) MANITOBA (2011)
N.N. (2007) N.N. (2008) N.N. (2009a) N.N. (2009c) N.N. (2010b)
The background of presenting such recommendations is different: Some sources have
the aim to provide a guide on how to save money when washing dishes (e.g. BAYAN,
n.d.) whereas others want to advise on how to get the best cleaning result (CROUZERY,
2008). Maximising the efficiency when washing dishes by hand (REICHMANN, 2008)
is also found with the objectives as the limitation of germ formation (FOOD-MONITOR,
2010). Last but not least there are sources with the objective of a sustainable
behaviour, such as saving water (e.g. CAVE, n.d.), saving energy (e.g. ENNOVATIONZ,
2010) or a general “green dishwashing behaviour” (e.g. COTTAGE LIFE, 2009).
It becomes obvious that the tips differ also in regard to the time when to do the
washing up: Some recommend to wash up immediately after a meal (e.g.
ARMENDARIZ, 2011) and others suggest to accumulate the dishes (e.g. REICHMANN,
2008). The reason for washing up directly after the dishes were used is that the soil
does not have time to dry up, whereas the accumulation of dirty dishes should help to
make sink washing more efficient.
As washing up steps besides the main cleaning step, a lot of sources include the tip to
dispose of food leftovers (e.g. EKOPEDIA, 2011). Some recommend to pre-rinse the
dishes if necessary (e.g. FORUM WASCHEN, n.d.) whereas others advise that no pre-
rinsing is necessary (e.g. COTTAGE LIFE, 2009). A lot of sources recommend the step
to soak persistent soils in hot water (EURORESIDENTES, n.d.) which is contradicting to
ARMENDARIZ, who advises against soaking because of germ formation (ARMENDARIZ,
2011). Among the sources that recommend soaking, some advise to add detergent to
the hot soaking water so that soils can be removed more easily (e.g. TINOCO, 2008).
Having removed the soil, a lot of the recommendation sources contain the tip to sort
the dishes that have to be cleaned in order to use the same water for a larger number of

INTRODUCTION 19
items. Logically, this tip is only important when washing up in a sink is recommended
because when washing up under running tap water, the same amount of water is only
used for one item. There is a consensus amongst those who suggest a washing up order
(e.g. AID INFODIENST, n.d.): Wash up less soiled items first, e.g. glasses, and clean
more soiled items last, e.g. pots and pans.
Regarding the general way of washing up, the tips from the different sources vary:
Most say that washing up in a sink filled with water is the most economical way to
clean the dishes by hand (e.g. ROZIO, 2008). However, some advisors recommend to
wash up under hot running tap water (N.N., n.d.-b), but do not give a reason.
Especially in Spanish speaking websites, it is explicitly mentioned not to wash up
under running tap water (CAVE, n.d.; ECOLOGIC BARNA, n.d.; N.N., 2009a; N.N.,
2010c; ROZIO, 2008; TINOCO, 2008), probably because in Spain it is very common to
wash up under running tap water (compare Table 1-1). According to the data presented
in Table 1-1, the Germans mainly wash up in a sink filled with water. This might be
the reason why on a website of a German detergent manufacturer, the use of the sink
washing method is taken as granted (HENKEL AG & CO., n.d.) and they only mention
to “let the water in” without referring to fill a sink with water in order to wash up.
Francophone websites in particular recommend to wash up in two sinks filled with
water, one for cleaning and one for rinsing (ACSD, n.d.; N.N., 2008; N.N., 2009b).
Sources in German and English provide the same recommendation as well (e.g. AID
INFODIENST, n.d.; N.N., 2007), yet, not one of the listed Spanish speaking sources does
so. Instead of filling sinks with water, some recommend to fill basins or pots with
water because this uses less water than filling a sink (e.g. ACSD, n.d.). A basin can be
used instead of a second sink, when there is only one available (e.g. VIVAT, n.d.). In
order to save water when filling sinks, the tip occurs to fill the sink not up to the brim
but only up to the half (e.g. PRIEBE, n.d.). The National Food Service Management
Institute of America advises to wash up in three compartments, because an additional
sanitizing step is recommended after cleaning and rinsing (NFSMI, 2009).
Not only the way of washing up is varying, but also the recommended temperatures:
On the one hand, the tip can be found to wash up with water as hot as possible (e.g.

20 INTRODUCTION
COMMON FAIT-ON, n.d.), and on the other hand there is the tip to clean the items with
cold water in order to save energy (N.N., 2009b). However, this last tip is advised in
combination with a rinse under hot water (N.N., 2009b). A very common additional tip
is to put on gloves to protect hands when using very hot water (e.g. MANITOBA, 2011).
When the sink washing method is recommended, the question occurs if and when the
water should be changed. In some of the sources, the hint is given to change the water
if one feels that it is too dirty (e.g. N.N., 2010c), others tell to change the water when
there is no foam left (N.N., n.d.-a).
The way of dosing the detergent mainly depends on the advised way to clean the
dishes: The detergent can be dosed on the utensil used to clean the dishes
(ARMENDARIZ, 2011) or a so-called “minisolution” is mentioned (SHI et al., 2005)
when the dishes are cleaned under running tap water and not in a sink filled with
water. This means that in a small bowl detergent is mixed with little water and the
sponge is dunked in this solution before cleaning the item. When sink washing is
recommended, one can mainly find the tip to dose the detergent into the water (e.g.
ECOLOGIC BARNA, n.d.). Some sources mention to try to produce little foam (AID
INFODIENST, n.d.). One reason given is that with little foam the dishes dry more easily
(FIT GMBH, n.d.). For persistent soils, vinegar can be used instead of a detergent
(N.N., 2009a). Another advice concerning the dosing of the detergent is to dose the
detergent carefully and as it is recommended by the manufacturer (FIT GMBH, n.d.).
The majority of sources mention that rinsing is necessary in order to get rid of
detergent leftovers or detached soil (N.N., 2007). However, there is a variation of tips
how to rinse: with hot water (e.g. BAYAN, n.d.), so that the dishes can dry more easily,
or with cold water (CROUZERY, 2008) in order to save energy. According to the tips of
AID INFODIENST, the rinsing can be performed in a sink (AID INFODIENST, n.d.).
ARMENDARIZ advises to rinse the dishes under hot running tap water (ARMENDARIZ,
2011) and another website recommends to rinse especially glasses under running tap
water (N.N., 2007). A variation of the running tap rinsing method is the rinsing of the
dishes all at once with a sprayer (e.g. BC HYDRO, 2009).
INTRODUCTION 21
To dry the dishes, the majority of sources suggest to let the dishes air dry in a dish rack
(e.g. EURORESIDENTES, n.d.) in order to avoid germ formation in the towel. However,
AID INFODIENST recommends towel drying for glasses (AID INFODIENST, n.d.) and the
tips of FOOD-MONITOR contain towel drying for all dishes because otherwise there
would be germ formation on the dishes (FOOD-MONITOR, 2010).
To sum up, the dishwashing tips differ as much as the dishwashing habits shown in the
previous sub-chapter. Nevertheless, tendencies can be made out, which the majority
recommend:
Disposing of food leftovers before washing up
Soaking of persistent soils
Washing up in sinks filled with water instead of washing up under running tap
water
Rinsing the dishes after cleaning them
Air drying of the dishes instead of towel drying
The question occurs with the variety of sometimes contradicting dishwashing tips, if
there is one combination of tips that proves to be optimal, uses a minimum amount of
water and energy, is efficient concerning the time and leads at the same time to a
reasonably good cleaning result.

22 GENERAL OBJECTIVES AND STRUCTURE OF THE THESIS
2 General objectives and structure of the thesis
It was shown that on the one hand almost every household – whether owning a
dishwasher or not – still keeps on washing up at least a few items by hand
(e.g. RICHTER, 2010b). On the other hand, studies on consumer behaviour when doing
the dishes showed that they use quite different ways with different amounts of
resources (e.g. STAMMINGER et al., 2007a). Both aspects taken together show the
necessity to investigate manual dishwashing.
It was the overall aim of this project to answer the question if there is a possibility to
save resources like water and energy when cleaning the dishes by hand. In order to
reach this objective, the manual dishwashing process shall be investigated and
optimised experimentally. Optimisation here means to reach a reasonably good
cleaning performance while using a minimum amount of resources. Especially the sink
washing process shall be investigated because the same amount of water can be used
for more than one item whereas the cleaning under running tap water needs a certain
amount of water for only one item. A repeatable method shall be developed for the
sink washing process in order to study the impact factors on the cleaning performance.
As an experimental optimum does not yet contribute to help the consumer saving
resources like water and energy, Best Practice Tips shall be defined and then verified
with different amounts of dishes and under different circumstances: in the laboratory
and in real life. The consumption of water, energy, detergent, time and the cleaning
results shall be compared before and after a training on the Best Practice Tips.
Furthermore, the consumer‟s attitudes towards such a guideline shall be found out.
As the project comprised different studies that were consecutive and different in their
setup, this thesis is structured in four parts each consisting of the sections “objectives”,
“material and methods”, “results” and “conclusion”.

EXPERIMENTAL OPTIMISATION OF MANUAL DISHWASHING 23
3 Experimental optimisation of manual dishwashing1
The first study of the project was dedicated to the experimental investigation of
manual dishwashing. It is described how the experiments were set up and run.
Furthermore, it is presented how the results of the experiments can be interpreted and a
model is shown, which lays out how the investigated impact factors influence the
cleaning performance.
3.1 Objective
The objective of this study is the development of a repeatable method for the sink
washing process. On this basis, a factorial study shall be run in order to find out the
main impact factors of the sink washing process influencing the cleaning performance.
A regression model shall be developed that contains the main impact factors as input
variables and the cleaning performance as output variable. Furthermore, the optimum
that leads to a reasonably good cleaning performance with a minimum amount of
resources shall be defined.
3.2 Material and methods
Thirty pizza plates (flat plates made of porcelain, diameter: 32 cm) were each soiled
with five soil types (minced meat, spinach, egg yolk, porridge and margarine). The soil
types and the preparation were chosen according to the European standard for testing
automatic dishwashers EN 50242:2008 (CENELEC, 2008). The minced meat
consisted in equal shares of beef and pork meat and was mixed with whipped eggs.
The porridge was prepared with oat flakes, milk and water. Each soil type was applied
onto one fifth of each plate (Figure 3-1). The food for preparing the soil was from the
same batch (regarding one experimental series). The plate sections were marked so
1 published in a similar way in FUSS, N. & STAMMINGER, R. (2010): Manual dishwashing: how can it be

24 EXPERIMENTAL OPTIMISATION OF MANUAL DISHWASHING
that the evaluator could tell how well each type of soil was removed by the washing
up.
Figure 3-1: Pizza plate with five soil types
Source: own illustration
The soils were dried for two hours under controlled ambient conditions (temperature:
23 °C ±2 °C, relative air humidity: 55% ±5%) in order to simulate the consumer habit
of not washing up immediately after the meal. After the drying period, the person
running the experiments cleaned the plates. The work station used for washing up
consisted of a double-bowl sink with a single-lever tap. The hot water was supplied by
an on-demand water heater. In order to guarantee a repeatable washing up process,
which allowed to clean each item under the same conditions, the work station had to
be adapted as follows (Figure 3-2): Below one sink, an additional basin was installed.
It was filled with water which was pumped through a thermostat connected to the
basin with two pipes. This application allowed keeping the temperature of the water in
the sink above constant during the cleaning process. For washing up, the plates were
placed on a metal grid installed diagonally in the sink. On the one hand, this
construction guaranteed a constant angle in which the plates were held, and on the
other hand, it simulated the consumer habit of dunking the plates partly into the water
while cleaning. The mechanical force with which a plate is cleaned was kept constant
by a mechanical device shown in (Figure 3-2) on the right. Its main part consisted of a
Minced meat
Spinach
Porridge
Margarine
Egg yolk
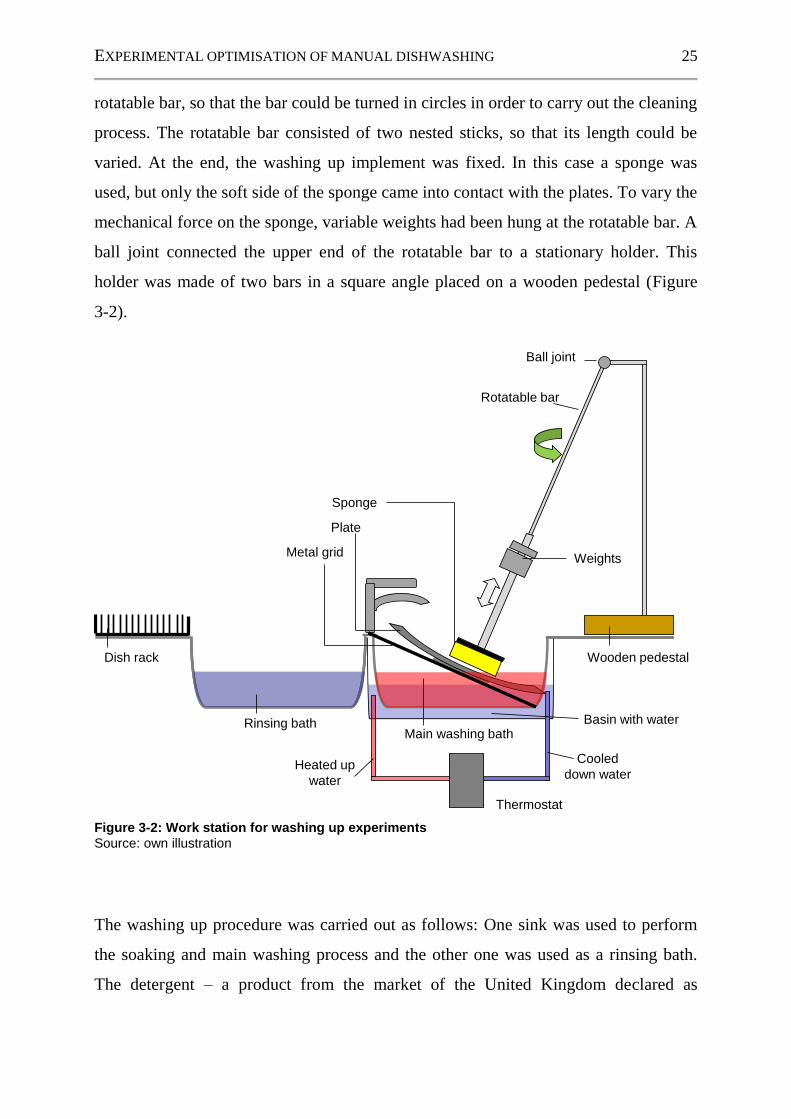
EXPERIMENTAL OPTIMISATION OF MANUAL DISHWASHING 25
rotatable bar, so that the bar could be turned in circles in order to carry out the cleaning
process. The rotatable bar consisted of two nested sticks, so that its length could be
varied. At the end, the washing up implement was fixed. In this case a sponge was
used, but only the soft side of the sponge came into contact with the plates. To vary the
mechanical force on the sponge, variable weights had been hung at the rotatable bar. A
ball joint connected the upper end of the rotatable bar to a stationary holder. This
holder was made of two bars in a square angle placed on a wooden pedestal (Figure
3-2).
Figure 3-2: Work station for washing up experiments
Source: own illustration
The washing up procedure was carried out as follows: One sink was used to perform
the soaking and main washing process and the other one was used as a rinsing bath.
The detergent – a product from the market of the United Kingdom declared as
Thermostat
Main washing bathRinsing bath
Sponge
Metal grid
Plate
Ball joint
Basin with water
Weights
Wooden pedestal
Rotatable bar
Heated up
water
Cooled
down water
Dish rack

26 EXPERIMENTAL OPTIMISATION OF MANUAL DISHWASHING
containing 15 to 30% anionic surfactants and 5 to 15% non-ionic surfactants – was
added to the main washing bath after the water let-in (6 litres of water per bath). Foam
was produced by means of a hand mixer operated for a fixed time (10 s). To assure a
constant foam level, the foam was mixed up again after every fifth cleaned plate.
Every dish was soaked for 30 seconds in the main washing bath (below the metal grid)
before it was placed on the metal grid. Meanwhile, a new sponge for every plate was
wetted in the main washing bath and attached to the mechanical wash arm. In order to
simulate the cleaning process, the person running the experiments performed four
circles (two outer and two inner circles) using the mechanical wash arm without
putting additional force on the plate before the plate was rotated by one fifth (about
72 degree). This process was repeated four times, for a total of five times. This assured
that each part of the plate was in contact with the water for the same amount of time.
As a last step of the process, the plates were dunked shortly into the second bath for
rinsing.
To assess the cleaning performance, a visual evaluation was performed according to
the standard EN 50242:2008 (CENELEC, 2008) under a bright lamp on a scale from
0 to 5, with 5 as best grade for completely clean plates: the bigger the total surface of
soil spots and the higher the number of soil spots, the lower the grade. Every fifth of
the plate with one soil type was evaluated separately.
This method of simulating manual dishwashing was tested for repeatability. The same
experiment was carried out nine times with the same factor combinations (Table 3-1).
The tests were performed in one week and always evaluated by the same person. The
arithmetic average of the cleaning performance was calculated for every experiment
(average is used when speaking of a sample and not of the total population). To check
for significant difference (with 95% probability), the Kruskal-Wallis-H test was
carried out.

EXPERIMENTAL OPTIMISATION OF MANUAL DISHWASHING 27
Table 3-1: Factors and factor levels for repeatability experiments
Dishes Amount 10 pizza plates
Soaking Handling water Soaking in main washing bath
Time 30 s
Main washing
Handling water Washing up in a bath
Time 30 s (20 circles with mechanical construction)
Water amount 6 l per bath
Water temperature 45 °C ±2 °C
Number of water changes
(WCMWB)
2 (every 10 plates)
Detergent concentration
0.08%
Implement Sponge
Mechanical weight 1.5 kg
Rinsing Handling water Rinsing bath
Time 5 s
Water amount 6 L
Water temperature 18 °C ±2°C
Number of water changes (WCRB)
0
Drying Method Air drying in a dish rack
Based on a sufficient level of repeatability, this three step washing up process with
soaking, main washing and rinsing in two sinks was chosen for follow-up factor
studies. Several experimental series were carried out to find out relevant factors
impacting on the cleaning performance and the general behaviour of these factors. In
the final series, three selected impact factors – namely the number of water changes in
main washing bath (WCMWB) and the water changes in rinsing bath (WCRB) and the
concentration of the detergent (C) in the main washing bath – were investigated in a
so-called “response surface design” with five replicates of the experiment to look for
their exact influences and their interactions. The experimental design was set up using
JMP® software (SAS INSTITUTE INC., 2009). Table 3-2 gives an overview of the
factors and the factor levels. In case only one value is given, the corresponding
variable is a possible factor but was kept constant in this series of tests.

28 EXPERIMENTAL OPTIMISATION OF MANUAL DISHWASHING
Table 3-2: Factors and factor levels for investigation of impact factors
Dishes Amount 30 pizza plates
Soaking Handling water Soaking in main washing bath
Time 30 s
Main washing
Handling water Washing up in a bath
Time 30 s (20 circles with mechanical
construction)
Water amount 6 L per bath
Water temperature 45 °C ±2 °C
Number of water changes (WCMWB)
2 (every 10 plates)
1 (every 15 plates)
0
Detergent concentration (C)
0.04 % 0.12 %* 0.20 %
Implement Sponge
Foam producing time
10 s
Mechanical weight 1.5 kg
Rinsing
Handling water Rinsing bath
Time 5 s
Water amount 6 L
Water temperature 18 °C ±2 °C
Number of water changes (WCRB)
0 1
Drying Method Air drying in a dish rack
* set by the software as a result of the chosen design (response surface design, D-optimal, 2 categorical factors, 1 continuous factors, 1 centre point)
For every experiment, the arithmetic average and standard deviation of the cleaning
performance grades for the 30 plates was calculated. These grades consist of the
averages of the values for each of the five soil types on one plate. The data were
statistically analysed using appropriate tests of the JMP® software (SAS INSTITUTE
INC., 2009): “Analysis of Variance” was used in order to determine if collectively the
regression coefficients are statistically significant (F ≤ 0.05). T-tests were performed
in order to determine whether the individual coefficient had a statistically significant
effect (p ≤ 0.05) on the response – the cleaning performance. The results hereof will be
presented in the following parts.
EXPERIMENTAL OPTIMISATION OF MANUAL DISHWASHING 29
3.3 Results
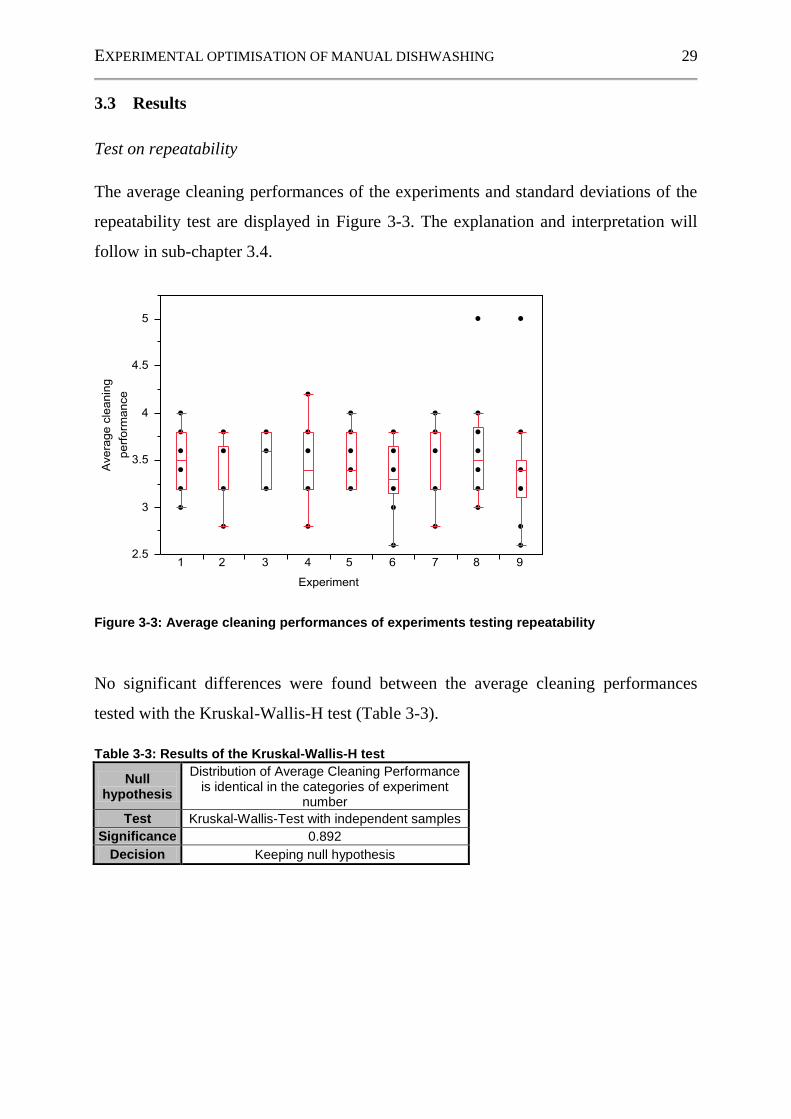
Test on repeatability
The average cleaning performances of the experiments and standard deviations of the
repeatability test are displayed in Figure 3-3. The explanation and interpretation will
follow in sub-chapter 3.4.
Figure 3-3: Average cleaning performances of experiments testing repeatability
No significant differences were found between the average cleaning performances
tested with the Kruskal-Wallis-H test (Table 3-3).
Table 3-3: Results of the Kruskal-Wallis-H test
Null hypothesis
Distribution of Average Cleaning Performance is identical in the categories of experiment
number
Test Kruskal-Wallis-Test with independent samples
Significance 0.892
Decision Keeping null hypothesis

30 EXPERIMENTAL OPTIMISATION OF MANUAL DISHWASHING
Investigation of the main impact factors
Table 3-4 reveals the average cleaning performances for each factor combination.
Table 3-4: Average cleaning performances of experiments investigating impact factors
Factor combination Resource consumption due
to factor combination Results
Detergent concentration
in %
Water changes
main bath
Water changes rinsing
bath
Total detergent
consumption in mL
Total water consumption
in L
Average cleaning
performance
Standard deviation
0.04 0 0 4.8 12 2.04 0.59
0.04 0 1 4.8 18 1.43 0.50
0.04 1 0 7.2 18 2.89 0.68
0.04 1 1 7.2 24 2.97 0.33
0.04 2 0 9.6 24 3.86 0.51
0.04 2 1 9.6 30 3.32 0.21
0.12 0 0 7.2 12 2.53 0.60
0.2 0 0 12.0 12 2.83 0.33
0.2 0 1 12.0 18 2.89 0.31
0.2 1 0 24.0 18 2.21 0.31
0.2 1 1 24.0 24 3.73 0.17
0.2 2 0 36.0 24 2.41 0.52
0.2 2 1 36.0 30 3.42 0.68
The lowest cleaning performances (between 1.50 and 2.00) are reached with a C of
0.04% and 0 WCMWB. In contrast, the highest cleaning performances (>3.00) are
depicted with factor combinations where the main washing bath is changed twice.
However, sometimes this is not the case, for example with the factor combination
0.2% C, two WCMWB and 0 WCRB the average cleaning performance is below three.
This shows that the interaction does not follow such simple rules.
3.4 Discussion
Test on repeatability
As the Kruskal-Wallis-H test does not reveal a significant difference between the
average cleaning performances of the experiments, the method can be considered to be
repeatable.

EXPERIMENTAL OPTIMISATION OF MANUAL DISHWASHING 31
Investigation of main impact factors
Regression analysis was performed to derive a regression model from the average
cleaning performances.
Table 3-5: Data of the regression model
Summary of fit
R² 0.573 R² adjusted 0.528 Root mean square error 0.506 Mean of response 2.863 Observations (or sum weights) 65 Analysis of variance
Source Degrees of
Freedom Sum of
squares Mean
square F ratio
Model 6 19.918 3.320 12.947
Error 58 14.872 0.256 Probability
> F
Total 64 34.790 <.0001
Lack of fit
Source Degrees of
freedom Sum of
squares Mean
square F ratio
Lack of fit 6 5.513 0.919 5.106
Pure error 52 9.359 0.180 Probability
> F
Total error 58 14.872 0.0003
Parameter estimates
Term Estimate Standard
error t ratio Probability
>|t|
Intercept 3.486 0.253 13.770 <.0001
Concentration (0.04, 0.2) 0.104 0.065 1.590 0.117
Water changes main washing bath [difference from level 0 to 1] -0.651 0.092 -7.050 <.0001
Water changes main washing bath [difference from level 1 to 2] 0.333 0.092 3.600 0.001
Water changes rinsing bath [0] -0.246 0.065 -3.770 0.000
Concentration*Concentration -0.600 0.261 -2.290 0.026
Water changes rinsing bath [difference from level 0 to 1] * Concentration -0.204 0.065 -3.120 0.003

32 EXPERIMENTAL OPTIMISATION OF MANUAL DISHWASHING
(3-1)
where
CP Cleaning performance
C Concentration in %
WCMWB Water changes main washing bath
WCRB Water changes rinsing bath
In Table 3-5 the results of the modelling are presented and equation 3-1 describes the
model with the best fit. The F-test reveals that the presented model itself is significant.
The coefficient of determination R² is 0.57, meaning that 57% of the variation in the
response can be attributed to factors included in the model rather than to factors
outside the model. The factors WCMWB and WCRB turn out to have a significant
impact on the cleaning performance. Likewise, C has a quadratic effect and the
interaction between C and WCRB shows significance.
The formula in equation 3-1 identifies the impact of the significant factors with the
cleaning performance. The value of the intercept is 3.49. As the WCMWB and WCRB
represent ordinal factors, only the impact figures for the number of water changes in
the respective bath are given. For example, if the water in the main washing bath is not
changed, a negative value (-0.65) is to be inserted into the formula. However, if the
main washing bath is refreshed once, a positive value (0.33) has to be inserted into the
formula. C, as a single factor has an impact weight of 0.10. This single factor did not
show significance but has to be kept due to the significance of the quadratic and the
interaction effect. The term
is appearing because of having used coded
variables, that means “-1”, “0”, “1” rather than 0.04%, 0.12%, 0.20%. The quadratic
term of the factor C has an impact on the cleaning performance with -0.60. The last
term of the formula represents the interaction of the C and WCRB.
WCRBMatchCC
WCRBMatchWCMWBMatchC
CP
%08.0
%12.02
%08.0
%12.060.0
%08.0
%12.010.049.3
0 -0.65
1 0.33
2 0.31
0 -0.24
1 0.24
0 -0.20
1 0.20

EXPERIMENTAL OPTIMISATION OF MANUAL DISHWASHING 33
Figure 3-4: Plot of single effects with maximised desirability
Figure 3-4 reveals three graphs of the cleaning performance plotted against the single
factors. The cleaning performance is rising with C up to 0.14% (this is equivalent to
8.4 mL of detergent in 6 L of water), afterwards the average cleaning performance is
descending again. The first change of the main washing bath causes a rise of the
cleaning performance of about 0.9, whereas the second water change does not induce
any increase of the cleaning performance. One refreshment of the water in the rinsing
bath generates an increase of the cleaning performance of about 0.4.
The dotted lines in Figure 3-4 indicate the optimum combination with the highest
cleaning performance of 4.10 (with a confidence interval of ± 0.58), which can be
achieved with a C of 0.14% and with one WCMWB and one WCRB. This implies a
total water consumption of 24 L of water, namely two times a filled sink for the
washing bath and for the rinsing bath, each with 6 L of water.

34 EXPERIMENTAL OPTIMISATION OF MANUAL DISHWASHING
Figure 3-5: Cleaning performance in dependence of C and WCRB
Figure 3-6: Cleaning performance in dependence of WCRB and C
Figure 3-5 and Figure 3-6 show the interaction profile of the significant interaction
effect C with WCRB. Figure 3-6 indicates that a low C generates almost no difference
in the cleaning performance if the water in the rinsing bath is not changed or refreshed
once. In contrast, a higher C reveals a greater difference. Similarly, it becomes evident
(Figure 3-6) that zero WCRB do not generate a variation in cleaning performance at a
low cleaning performance level, but that one change causes a difference in the
cleaning performance of about 1.
3.5 Conclusion
The investigation has shown that cleaning performance in manual dishwashing can be
reproduced in a laboratory measurement set-up and that three variables (WCMWB,
WCRB, C) define more than 50% of the variability of the cleaning performance in a
sink washing process.

EXPERIMENTAL OPTIMISATION OF MANUAL DISHWASHING 35
Further findings are:
An equation has been developed to express the cleaning performance of a
hand dishwashing detergent as a function of the water changes and the
product concentration (amount of product used).
Using this equation, it is possible to find conditions that maximize the
cleaning performance of the dishes, while minimizing the amount of
resources during the washing up process.
Regarding the detergent concentration (amount of product used), this
amount is not correlated linearly with the cleaning performance, but there is
a negative quadratic effect. This means that a certain C is necessary to
achieve reasonably good cleaning results, but when exceeding a maximum
concentration the cleaning performance is decreasing again. This may be
explained by the observation that a high C causes a lot of foam which is not
completely rinsed off. Consequently, soil particles are transferred by the
foam residuals.
An affirmation of this visual determination consists in the significant
interaction of C with WCRB: The higher C, the more foam emerges and the
more foam residuals stay on the plates, having to be washed off by the
rinsing bath. Therefore, the rinsing bath has to be changed more often when
C is higher in order to guarantee that foam residuals are completely rinsed
off.
In the experimental optimum, the minimum amount of resources consist in
24 L of water and 8.4 mL of detergent to achieve an average cleaning result
above 4 (on a scale from 0 to 5) when thirty pizza plates (containing 3 grams
of soil each) are to be washed up.
Comparing the results of the experiments to the findings of STAMMINGER et
al. (STAMMINGER et al., 2007a), there might be a potential that those test
persons with extremely high resource consumptions and washing up under
running tap water will save an enormous amount of water and energy when
changing their behaviour to a double sink washing up method. However,

36 EXPERIMENTAL OPTIMISATION OF MANUAL DISHWASHING
those test persons using low amounts of water and achieving low cleaning
performances might need on the one hand a slightly higher amount of
resources but would reach on the other hand a better cleaning performance.
To make a more precise statement, further studies would have to be run. However, the
tendencies presented above can indicate an approach on how to optimise dishwashing
regarding the resource of water consumption. Taking this experimental test as a
starting point, one of the next steps will be to derive a consumer recommendation on
how to wash up dishes by hand in an economic way. In the following, the development
of Best Practice Tips for manual dishwashing is presented and with a first check if
consumers are able to save resources by applying the Best Practice Tips.
.

APPLICATION OF BEST PRACTICE TIPS IN A LABORATORY STUDY (1) 37
4 Application of Best Practice Tips in a laboratory study (1)2
In this study, Best Practice Tips are presented, derived from the results of the
experimental investigation of manual dishwashing (compare chapter 3) and from the
knowledge of what the consumer is practising. Additionally, a test is described in
which the Best Practice Tips are tested on their application and on how far resource
savings are possible.
4.1 Objective
On the basis of the experimental investigation in combination with the knowledge
about the consumer‟s behaviour in real life, Best Practice Tips shall be defined. To
gain a first insight into impact of the Best Practice Tips, two comparative consumer
studies shall be run. One shall be carried out with 30 pizza plates – as in the
experimental study (compare chapter 3) – and one with two place settings to see the
effect of the tips on small amounts of dishes. It shall be the aim of these studies to
check firstly if Best Practice Tips based on the experimental optimum are applicable
(consumer understands what he has to do) and acceptable (consumer is willing to
apply recommendation). Secondly, it shall be found out if the consumers are able to
save resources by applying the Best Practice Tips in comparison to their former
washing up behaviour.
4.2 Material and methods
The Best Practice Tips
The Best Practice Tips were deduced from the knowledge gained in the experimental
manual dishwashing tests (compare chapter 3) and dishwashing tips already published
(Table 1-2). These tips are shown in Table 4-1.
2 to be published in a similar way in FUSS & STAMMINGER (2011b): Resource savings by training – how much
can be saved in manual dishwashing? Tenside, Surfactants, Detergents.

38 APPLICATION OF BEST PRACTICE TIPS IN A LABORATORY STUDY (1)
Table 4-1: Best Practice Tips
Tip 1 Wash up in sinks filled with water. Avoid washing up under running tap water.
Tip 2 Collect some items to make sink washing efficient, do not wash up single items.
Tip 3 Wash up in three steps: Soaking and main washing in one bath, rinsing in a second bath. If you do not have a second sink,you can replace it by a basin.
Tip 4 Fill two sinks half with water: The sink for soaking and main washing with hot water, the sink for rinsing with cold water.
Tip 5 Detergent: Add the detergent AFTER water let in. Dilute detergent, but avoid foam production because the foam restrains soil residuals and a fat film.
Tip 6: Washing up process 1 Dispose of food leftovers into the bin. 2 Soaking: In the sink with hot water; the harder the soil, the longer the soaking time. 3 Main wash: While some of the hard soiled items are soaking, start cleaning lighter soiled ones. 4 Rinsing: Short dunking in second sink with cold water. 5 Drying: Place the dishes in a dish rack to let them air dry. You do not need to towel dry.
Tip 7 Change the water if you feel it is too dirty. For example, if the foam emerging while washing up is collapsing again.
Source: own illustration
Step 1: soaking
Step 2: main washing
Step 3: rinsing
Step 1: soaking
Step 2: main washing
Step 3: rinsing
Hot waterHot waterCold waterCold water
½ ½
Cle
ans
er
13
4
5
Bin
Bin
2
orStep 1: soaking
Step 2: main washing
Step 3: rinsing

APPLICATION OF BEST PRACTICE TIPS IN A LABORATORY STUDY (1) 39
In order to check the applicability of the Best Practice Tips and how far a consumer is
able to save resources by applying the tips, two studies each with two parts were
conducted.
Overview of the studies
Table 4-2 gives an overview of the studies and the parts of each study. One study was
run with 30 pizza plates, in the following referred to as the PP study
(Pizza plate study), and another one with two standard place settings, in the following
referred to as the PS study (Place setting study). Each of the studies consisted of two
parts: one in which the subject had to wash up as he/ she would do at home in
everyday life (EDB part), and another part in which he/ she was trained to follow the
Best Practice Tips (BPT part).
Table 4-2: Overview of the studies and parts of the studies
PP study (Pizza plate study) PS study (Place setting study)
Part 1: Recording participants’ everyday behaviour (EDB part)
Part 2: Application of the Best Practice Tips (BPT part)
Equipment for the test participants
All studies took place in a laboratory at a double-bowl sink with a single lever tap. The
hot water was supplied by a flow-through heater which supplied a maximum water
temperature of 60 °C. Different washing up utensils and dish racks were provided for
the test participants. The test participants all used Fairy dark green washing up
detergent.
Samples of test participants
The sample in the PP study consisted of 38 German test participants. The EDB part
and the BPT part consisted of a different sample as the tests took place on different
dates and not all participants were available twice. The sample of test participants in
the PS study (EDB part and BPT part) was the same as in the second part of the
PP study.

40 APPLICATION OF BEST PRACTICE TIPS IN A LABORATORY STUDY (1)
Dishes to wash up
The PP study was performed as closely as possible to the experimental tests (compare
chapter 3) regarding the number and type of plates, soiling on the plates and soiling
drying time. Thirty pizza plates (Rösler, diameter 32 cm) were soiled with five types
of soiling (minced meat, spinach, egg yolk, porridge and margarine) (Figure 3-1). The
soiling was dried for two hours at defined ambient conditions of a temperature of
23 °C ±2 and 55% ±5 of relative humidity.
The dish load in the PS study consisted of two standard place settings (each composed
of a dinner plate, a soup plate, a dessert plate, a bread plate, a saucer, a cup, a glass, a
knife, a fork, a soupspoon, a dessertspoon, and a teaspoon). These items were soiled as
prescribed in the standard EN 50242:2008 (CENELEC, 2008), with seven types of
soiling (minced meat, spinach, egg yolk, porridge, margarine, milk and tea). Similarly
to the PP study, the soiling was dried for two hours at defined ambient conditions.
Recorded data
In both studies, the dishes washed up by the test participants were evaluated according
to the automatic dishwashing standard EN 50242:2008 (CENELEC, 2008), on a scale
from 0 to 5 with 5 as the best grade. Totally clean dishes were rated at 5.
A data logging system, which was calibrated beforehand, recorded the hot and cold
water consumption with a turbine flow meter, and the temperature in both sinks, as
well as the temperature at the tap with thermo elements. The energy consumption was
a calculated variable resulting from the hot water consumption. It was corrected by
terms considering the efficiency of the flow-through heater and the differing cold
water temperature. The data was recorded every second. The water consumption was
also recorded.
Test procedure
In the EDB part of both the PP and the PS study, the test participants were asked to
wash up the load of soiled dishes as they would do in everyday life. They were free to

APPLICATION OF BEST PRACTICE TIPS IN A LABORATORY STUDY (1) 41
choose the washing up utensil (sponge, sponge cloth, cloth, or scrubber) and they were
free to dry the dishes with a tea towel or let them air dry in a dish rack.
For the BPT part of both the PP and the PS study, the test participants were informed
about the Best Practice Tips by means of an oral briefing and a fact sheet. They were
then expected to wash up the load of soiled dishes following the Best Practice Tips. As
one of the Best Practice Tips was to let the dishes air dry in a dish rack, no tea towel
was provided. A dosage device was provided to enable to dose the detergent more
accurately. After the washing up had been completed, each test person had to fill out
an evaluation questionnaire where they were asked about the applicability and
acceptability of the given washing up recommendations. As the BPT part of the
PP study and the PS study took place at the same time, the evaluation questionnaire
was filled out only once.
Data analysis
Although the consumption data proved not to be normally distributed, the arithmetic
averages and the standard deviations of the parameters (water, energy and detergent
consumption, time taken, and cleaning performance) are presented because these
averages are of prior use for economic purposes. The Kruskal-Wallis-H test was
carried out to find statistically significant differences (with 95% probability).
4.3 Results
The graphs in Figure 4-1 to Figure 4-5 show a comparison of the average results of the
two studies before and after training on the Best Practice Tips. The error bars show the
standard deviation of each measured parameter. All percentage values mentioned in
the context of the consumption data have the value of the EDB part as 100% basis.
Results of the PP study
The average water consumption in the EDB part of the PP study was 38.9 L, whereas
in the BPT part it was 24.1 L, which is 38% less. On average, the test participants
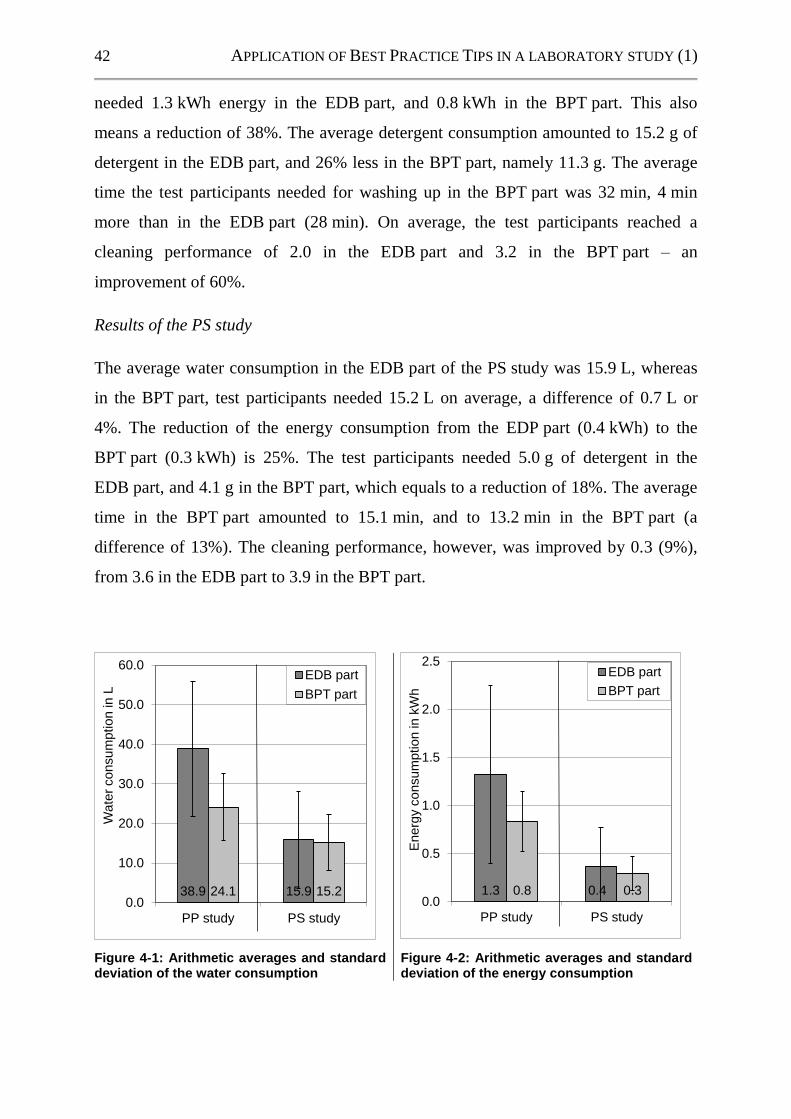
42 APPLICATION OF BEST PRACTICE TIPS IN A LABORATORY STUDY (1)
needed 1.3 kWh energy in the EDB part, and 0.8 kWh in the BPT part. This also
means a reduction of 38%. The average detergent consumption amounted to 15.2 g of
detergent in the EDB part, and 26% less in the BPT part, namely 11.3 g. The average
time the test participants needed for washing up in the BPT part was 32 min, 4 min
more than in the EDB part (28 min). On average, the test participants reached a
cleaning performance of 2.0 in the EDB part and 3.2 in the BPT part – an
improvement of 60%.
Results of the PS study
The average water consumption in the EDB part of the PS study was 15.9 L, whereas
in the BPT part, test participants needed 15.2 L on average, a difference of 0.7 L or
4%. The reduction of the energy consumption from the EDP part (0.4 kWh) to the
BPT part (0.3 kWh) is 25%. The test participants needed 5.0 g of detergent in the
EDB part, and 4.1 g in the BPT part, which equals to a reduction of 18%. The average
time in the BPT part amounted to 15.1 min, and to 13.2 min in the BPT part (a
difference of 13%). The cleaning performance, however, was improved by 0.3 (9%),
from 3.6 in the EDB part to 3.9 in the BPT part.
Figure 4-1: Arithmetic averages and standard deviation of the water consumption
Figure 4-2: Arithmetic averages and standard deviation of the energy consumption
38.9 15.924.1 15.20.0
10.0
20.0
30.0
40.0
50.0
60.0
PP study PS study
Wate
r consum
ption in L
EDB part
BPT part
1.3 0.40.8 0.30.0
0.5
1.0
1.5
2.0
2.5
PP study PS study
Energ
y c
onsum
ption in k
Wh
EDB part
BPT part

APPLICATION OF BEST PRACTICE TIPS IN A LABORATORY STUDY (1) 43
Figure 4-3: Arithmetic averages and standard deviation of the detergent consumption
Figure 4-4: Arithmetic averages and standard deviation of the time taken
Figure 4-5: Arithmetic averages and standard deviation of the cleaning performance
Statistical analysis of the PP study
It has been proved by the Kruskal-Wallis-H test as statistically significant that test
participants in the PP study used less water, less energy and less detergent when
following the recommended process of washing up and at the same time, they
15.2 5.011.3 4.10.0
5.0
10.0
15.0
20.0
25.0
30.0
35.0
PP study PS study
Dete
rgent consum
ption in g
EDB part
BPT part
28.5 15.132.1 13.20.0
5.0
10.0
15.0
20.0
25.0
30.0
35.0
40.0
45.0
PP study PS study
Tim
e in m
in
EDB part
BPT part
2.0 3.63.2 3.90.0
0.5
1.0
1.5
2.0
2.5
3.0
3.5
4.0
4.5
5.0
PP study PS study
Cle
anin
g p
erf
orm
ance
EDB part BPT part

44 APPLICATION OF BEST PRACTICE TIPS IN A LABORATORY STUDY (1)
achieved a better cleaning performance. Whereas, the time they spent on the washing
up process increased slightly, but showed no significance.
Statistical analysis of the PS study
The Kruskal-Wallis-H test revealed that the results of the PS study show a slight but
not significant decrease in water, energy, detergent, and time consumption, while the
cleaning performance increased slightly but not significantly.
Selected results of the evaluation questionnaire
In addition to the data measured, the evaluation questionnaire contributed to the
understanding of the behaviour of the test participants. In Figure 4-6, the results are
shown of how the participants evaluated each of the Best Practice Tips. All tips were
rated by 60% and more by the test participants to be “good” or “very good”. Some
were appreciated by up to 97%.

APPLICATION OF BEST PRACTICE TIPS IN A LABORATORY STUDY (1) 45
Figure 4-6: Rating of the Best Practice Tips3
In Figure 4-7, the answers are shown to the question which of the tips will probably be
applied in everyday life. The answers accord with the rating of the dishwashing tips
when considering the tips “soaking”, “amount of detergent”, “detergent add-in after
water let-in”, and “low foam production”. According to Figure 4-7, these tips will
probably be applied by a percentage up to 90%, whereas the tip “rinsing in a sink” will
less likely to be applied by the test participants.
3 Because of rounded values, it occurs that the summation per statement does not amount up to 100%.
Question:
Please rate the single tips of the Best Practice on a scale from “1: very good” to “5: not good at all”.
42%
34%
34%
26%
32%
50%
61%
42%
21%
63%
37%
45%
50%
53%
47%
37%
24%
37%
39%
34%
13%
16%
13%
16%
13%
8%
16%
18%
18%
3%
5%
5%
3%
5%
3%
21%
3%
5%
3%
3%
3%
0% 20% 40% 60% 80% 100%
Air drying of dishes
Half-filled sink
Water changes
Rinsing in a sink
Washing up in a sink
Low foam production
Detergent add-in after water let-in
Use of a dosage device
Amount of detergent
Soaking the plates
1: very good 2: good 3: moderate 4: not good 5: not good at all

46 APPLICATION OF BEST PRACTICE TIPS IN A LABORATORY STUDY (1)
Figure 4-7: Probable application of the Best Practice Tips in the everyday life
4
4.4 Discussion
Water consumption
While the PP study showed a decrease in water consumption of about 40% when
applying the recommended process of washing up, the water consumption in the
PS study only showed a small decrease. A possible reason for this phenomenon can be
found in the washing up in a sink. While for the PP study, several changes of the water
in the sinks were necessary, the place settings in the PS study could be easily washed
up just by using one (the first) filling of the sinks. It may be concluded that filling two
sinks with water is not economical when washing up only a few items. Therefore,
either a different procedure may need to be developed or the consumer is asked not to
wash up a small number of items but to collect them until a larger amount of dishes
has to be washed.
4 Because of rounded values, it occurs that the summation per statement does not amount up to 100%.
Question:
Which of the tips will you probably apply in your everyday life? Please rate on a scale from
“1: by all means” to “5: under no circumstances”
53%
42%
45%
16%
61%
50%
63%
24%
26%
61%
18%
39%
42%
11%
21%
37%
18%
16%
18%
32%
11%
16%
8%
24%
5%
11%
13%
24%
26%
3%
11%
5%
39%
13%
3%
34%
26%
5%
8%
3%
11%
3%
3%
3%
3%
0% 20% 40% 60% 80% 100%
Air drying of dishes
Half-filled sink
Water changes
Rinsing in a sink
Washing up in a sink
Low foam production
Detergent add-in after water let-in
Use of a dosage device
Amount of detergent
Soaking the plates
1: by all means 2: probably 3: undecided 4: unlikely 5: under no circumstances

APPLICATION OF BEST PRACTICE TIPS IN A LABORATORY STUDY (1) 47
Energy consumption
The data on the energy consumption is more or less in parallel with the results of the
water consumption. However, while the water reduction is nearly zero in the PS study,
the energy consumption is about 25% less after the training on the Best Practice Tips.
This is probably due to participants using more cold water for rinsing than before.
Detergent consumption
The savings of detergent is 25% in the PP study and 18% in the PS study. It is
remarkable that although the recommended amount of detergent is one of the least
“good” rated of the Best Practice Tips and people have the impression that the amount
of detergent is too much, they are using less detergent when they are applying the
recommended washing up procedure.
Time taken
The time participants used has slightly increased in the PP study and slightly decreased
in the PS study. Perhaps, this is because the participants needed some time to adapt to
the tips and the new behaviour.
Cleaning performance
Test participants could reach significantly higher cleaning performances in the
PP study when applying the dishwashing tips. In the PS study, the cleaning
performances did not differ significantly before and after training. Comparing both
studies, the average cleaning performances of the PS study are better than those of
PP study. A probable reason is that participants found the pizza plates heavy and
extremely difficult to handle. Additionally, the number of the pizza plates (30) was
higher than the number of accumulated items in two place settings (22). Test
participants were probably tiring while washing up the pizza plates, so that they did
not pay attention to the cleaning performance of the pizza plates as much as they did to
the cleaning performance of the place settings.

48 APPLICATION OF BEST PRACTICE TIPS IN A LABORATORY STUDY (1)
Evaluation questionnaire
People like rinsing in a sink more than they are willing to apply it (compare Figure 4-6
and Figure 4-7). This can be extrapolated by their comments that a second sink is not
available and they have not enough space for an additional basin.
The dosage device was quite highly accepted but will probably not be applied as much
in everyday life. The reason most given was that they could not buy a detergent bottle
with a dispenser in Germany.
4.5 Conclusion
It has been shown that important resources such as energy and water can be saved
when a large amount of dishes have to be washed by training consumers how to wash
up. However, it seems that with a smaller amount of dishes, the full sink washing up
method does not seem to be an optimal way of washing up. Therefore, more
experimental studies will have to be run to develop an optimal way of washing up
small amounts of dishes. As the sample was quite small in this test, more studies will
have to be run to confirm the water and energy savings with large amounts of dishes.
The realisation is shown in the next chapter.

APPLICATION OF BEST PRACTICE TIPS IN A LABORATORY STUDY (2) 49
5 Application of Best Practice Tips in a laboratory study (2)5
This part presents a follow up study of the one presented in chapter 4. It is used to
confirm that, with large amounts of dishes, important resource saving such as water
and energy are possible when the consumer applies the Best Practice Tips (compare
Table 4-1).
5.1 Objective
On the basis of the study reported about in chapter 4, the assumption was made that
especially with large amounts of dishes resource savings might be possible when
consumers apply the Best Practice tips. Thirty pizza plates are obviously a large
amount of dishes yet are not comparable to dishes commonly used in the household.
This shall be the aim of the current part of the project: The application of the Best
Practice Tips shall be checked with large amounts of dishes which are commonly used
in the household, such as 12 place settings. The resource consumption of consumers
applying the Best Practice Tips shall be compared to the consumption data of previous
studies in which consumers applied their everyday behaviour when washing up the
same amount of dishes. Another aim shall be to find out what test participants think of
the Best Practice Tips, how well they can be used on real life conditions and if they
would continue to apply the Best Practice Tips.
5.2 Material and methods
In general, a data comparison was conducted between data about the resource
consumption of consumers‟ everyday behaviour when washing up dishes by hand, and
data of test participants applying the Best Practice Tips.
5 published in a similar way in FUSS, N., BORNKESSEL, S., MATTERN, T. & STAMMINGER, R. (2011a): Are
resource savings in manual dishwashing possible? Consumers applying Best Practice Tips. International Journal
of Consumer Studies, 35, 2, 194-200.

50 APPLICATION OF BEST PRACTICE TIPS IN A LABORATORY STUDY (2)
The data about the everyday behaviour was taken from previously run studies (in the
following referred to as the Everyday Behaviour Studies (EDB studies)) which
includes data from the so-called EU study (STAMMINGER et al., 2007a) and the
so-called Global study (BERKHOLZ and STAMMINGER, 2009). The sample of the
EU study comprised 113 participants from seven European countries and regions
(Germany, Great Britain and Ireland, France, Spain and Portugal, Italy, Turkey,
Poland and Czech Republic). The complete sample of the Global study comprised
100 participants from all over the world. Because only Europeans participated in the
EU study, only the data of European citizens of the Global study (60 participants from
Germany, Hungary and Russia) were considered in the data comparison reported here.
Both studies have shown that individual differences of the washing up behaviour are
large and more relevant than country of origin differences. The data on the application
of the Best Practice Tips was newly gained in the current study (in the following called
the Best Practice Tips study (BPT study) by trying to have a good mixture of European
washing up practisers.
Test participants in the BPT study
Table 5-1 shows an overview on the number of test participants in the BPT study in
comparison to the EDB studies.
Table 5-1: Overview on the number of test persons in the different studies
Total number of
test persons
Test persons from European
countries
EDB studies
EU study
113 113
Global study
100 60
BPT studies Current study
53 53
Source: own illustration partly based on STAMMINGER et al. (2007a) and
BERKHOLZ and STAMMINGER (2009)
There were 53 test participants from European countries (Germany, Poland, Czech
Republic, Hungary, Slovenia and Romania) in the BPT study. The recruitment took
place in Germany and to assure that they had not yet adapted to the German

APPLICATION OF BEST PRACTICE TIPS IN A LABORATORY STUDY (2) 51
washing up behaviour only non-German European citizens were chosen who had lived
in Germany for no longer than two years. The same requirement was applied to the test
participants in the EDB studies. To make the data comparable to the two EDB studies,
we tried to recruit the same participants again. However, only seven of the test
participants taking part in the Global study were available and willing to take part
again. Therefore, the sample of the BPT study consisted of 46 newly recruited test
participants. This fact is to be taken into account when drawing conclusions.
Process of the BPT study
The test participants coming to the laboratory at the University of Bonn were
instructed by an oral briefing and a fact sheet on how to apply the Best Practice Tips.
Afterwards, they washed up 12 soiled place settings (the same sort of dishes as in the
EDB studies) by applying the Best Practice Tips. Finally, they had to fill in an
evaluation questionnaire on their opinions about the Best Practice Tips.
Work station
The work station provided for the consumers was the same used in the two
EDB studies. It consisted of a double-bowl sink with a two-handled tap. Hot water was
provided by a flow-through water heater which worked up to a maximum temperature
of 60 °C.
The test participants were free to choose between a choice of concentrated detergent
products and between a range of washing up utensils (sponge, sponge cloth, dishcloth,
and scrubber). No exact amount of detergent was prescribed, however the test
participants were given a small glass with a marker as a guideline of how much
detergent to use for a half-filled sink. This recommended amount of detergent was
based on the results of the experimental dishwashing study (FUSS and STAMMINGER,
2010). The test participants were additionally equipped with several dish racks in order
to let the dishes air dry.

52 APPLICATION OF BEST PRACTICE TIPS IN A LABORATORY STUDY (2)
Collected data
While the test participants were washing up, a data logger was recording the water
consumption with a turbine flow meter. The temperature of the water was measured by
temperature sensors (thermocouples) at the outflow of the tap. With the temperature
recorded, the energy consumption was calculated on the basis of an assumed average
cold water temperature of 15 °C.
Furthermore, the time that the test participants needed for washing up was recorded
and the detergent consumption was measured. After finishing the dish cleaning, the
cleanliness of the dishes was evaluated according to EN 50242:2008 (CENELEC,
2008) on a scale from 0 to 5, with 5 as the best grade.
Dishes to wash up
The dishes that the test participants had to wash were the same and soiled in the same
way as in the EDB studies: 12 place settings soiled with seven soil types (milk, tea,
minced meat, spinach, egg yolk, porridge and margarine). The type of dishes and the
soiling process was carried out as specified in EN 50242:2008 (CENELEC, 2008), the
European standard for automatic dishwashing. The only deviation from the standard,
but in line with the two previous studies, was the drying period of the soiled dishes for
two hours at controlled ambient conditions (temperature: 23 °C ±2 °C, relative air
humidity: 55% ±5%) instead of two hours in a thermal cabinet at 80 °C.
Although the conditions of the two EDB studies were reproduced as far as possible,
there were some restrictions. In the EDB studies, test participants were asked to dry
their dishes with a tea towel. However, as it was one of the Best Practice Tips, the test
participants in the current study were asked to let their dishes air dry in a dish rack.
This might have an influence both on the time and on the cleaning performance. It
should also be kept in mind that, despite the fact that the cleaning performance was
measured with a standard grading scale, the different studies were run with different
trained graders.

APPLICATION OF BEST PRACTICE TIPS IN A LABORATORY STUDY (2) 53
5.3 Results
Figure 5-1 shows the average water consumption of the three studies to be compared.
The averages of the EDB studies are at more than 100 L of water, whereas the average
of the BPT study is at only slightly more than 40 L of water. This is equal to a
reduction of around 60% from the EDB studies to the BPT study (the percentage
values of the consumption data is calculated with the values from the EDB studies as
100% basis). The standard deviation of the current study is much smaller compared to
the standard deviation of the Global study. Data on the standard deviation of the
EU study was not published.
Figure 5-1: Water consumption, average and standard deviation as assessed in the EDB studies and the BPT study.
Regarding the energy consumption in Figure 5-2, the test participants in the BPT study
consumed 0.8 kWh on average, whereas the energy consumption in the EDB studies
was at more than 2.5 kWh. The percentage of the reduction from the EDB studies to
the BPT study is about 70%. Furthermore, the variance of the consumer behaviour,
expressed in the standard deviation of the measured values, is much smaller in the
BPT study compared to the EDB study.
103.0 113.9 42.6
0.0
20.0
40.0
60.0
80.0
100.0
120.0
140.0
160.0
180.0
EU study(n = 113)
Global study(n = 60)
Current study(n = 53)
EDB studies BPT study
Wa
ter
co
nsu
mp
tio
n in
L

54 APPLICATION OF BEST PRACTICE TIPS IN A LABORATORY STUDY (2)
Figure 5-2: Energy consumption, average and standard deviation as assessed in the EDB studies and the BPT study.
Figure 5-3 shows the comparison of the detergent consumption. The average of the
EDB studies amounts to a detergent consumption of nearly 36 g, which is about 12.2 g
(around 34%) more than the average of the BPT study (23.7 g).
Figure 5-3: Detergent consumption, average and standard deviation as assessed in the EDB studies and the BPT study.
2.5 2.9 0.80.0
0.5
1.0
1.5
2.0
2.5
3.0
3.5
4.0
4.5
5.0
EU study(n = 113)
Global study(n = 60)
Current study(n = 53)
EDB studies BPT study
Energ
y C
onsum
ption in k
Wh
35.0 36.9 23.70.0
20.0
40.0
60.0
80.0
EU study(n = 113)
Global study(n = 60)
Current study(n = 53)
EDB studies BPT study
De
terg
en
t co
nsu
mp
tio
n in
g
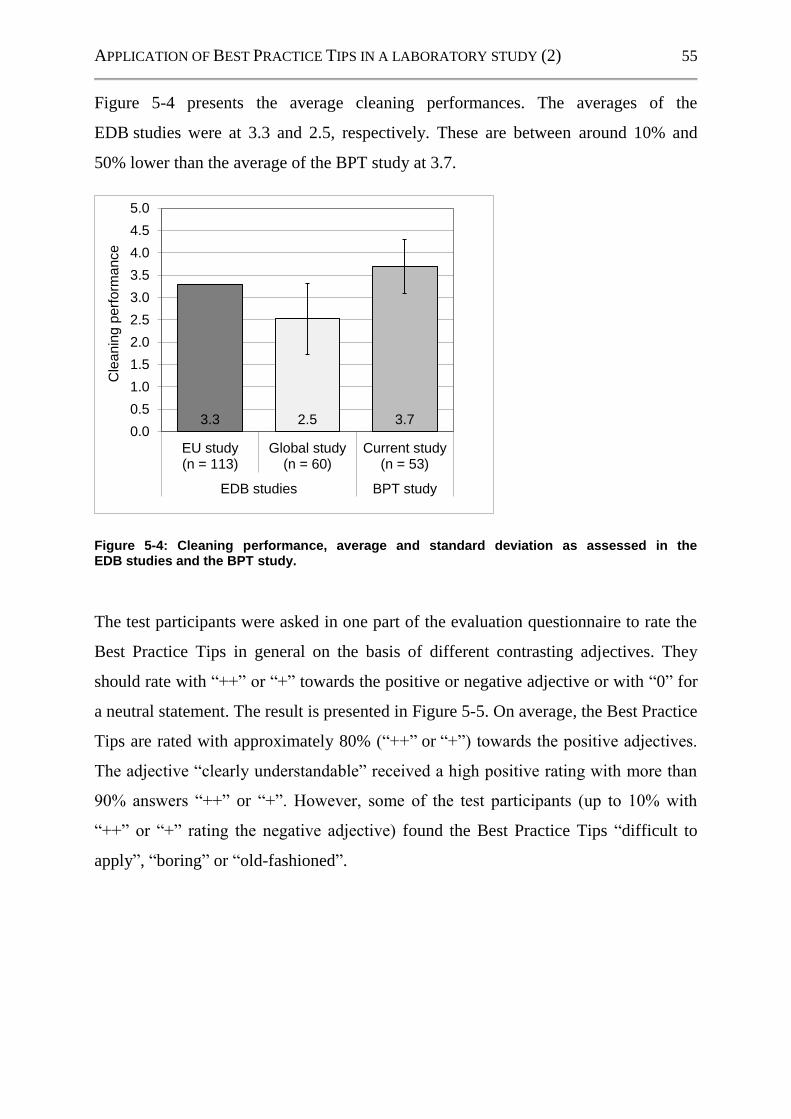
APPLICATION OF BEST PRACTICE TIPS IN A LABORATORY STUDY (2) 55
Figure 5-4 presents the average cleaning performances. The averages of the
EDB studies were at 3.3 and 2.5, respectively. These are between around 10% and
50% lower than the average of the BPT study at 3.7.
Figure 5-4: Cleaning performance, average and standard deviation as assessed in the EDB studies and the BPT study.
The test participants were asked in one part of the evaluation questionnaire to rate the
Best Practice Tips in general on the basis of different contrasting adjectives. They
should rate with “++” or “+” towards the positive or negative adjective or with “0” for
a neutral statement. The result is presented in Figure 5-5. On average, the Best Practice
Tips are rated with approximately 80% (“++” or “+”) towards the positive adjectives.
The adjective “clearly understandable” received a high positive rating with more than
90% answers “++” or “+”. However, some of the test participants (up to 10% with
“++” or “+” rating the negative adjective) found the Best Practice Tips “difficult to
apply”, “boring” or “old-fashioned”.
3.3 2.5 3.70.0
0.5
1.0
1.5
2.0
2.5
3.0
3.5
4.0
4.5
5.0
EU study(n = 113)
Global study(n = 60)
Current study(n = 53)
EDB studies BPT study
Cle
an
ing
pe
rfo
rma
nce
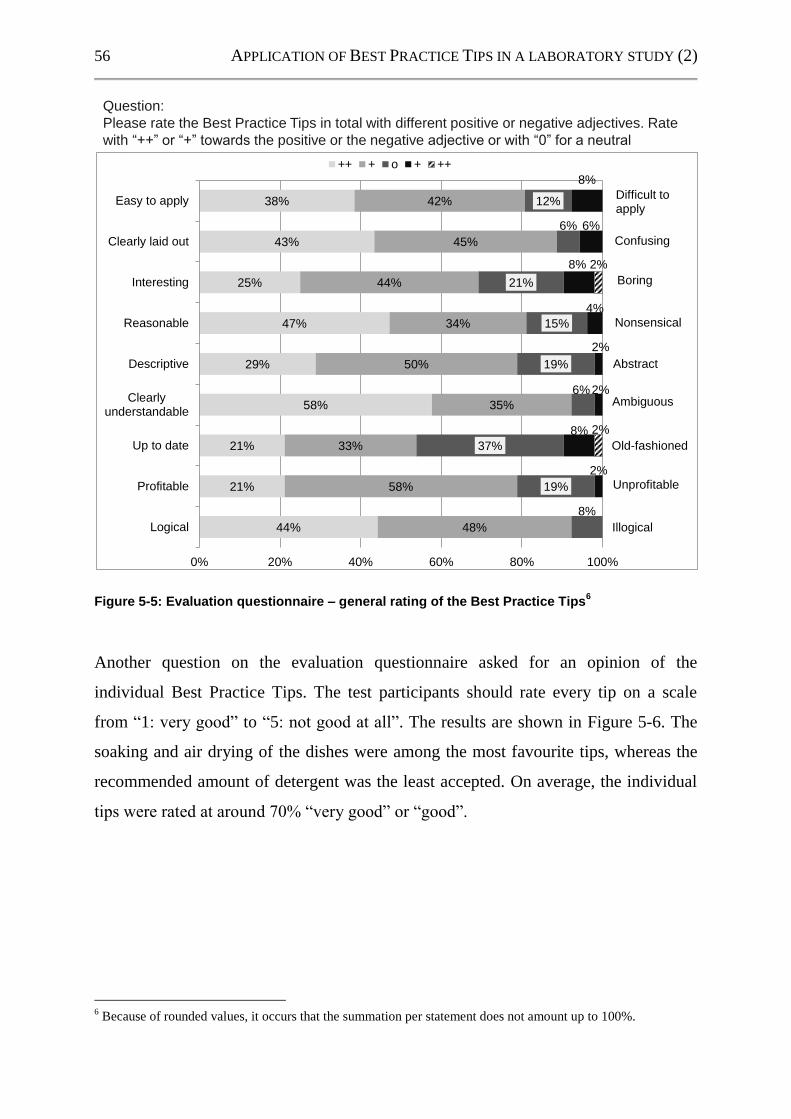
56 APPLICATION OF BEST PRACTICE TIPS IN A LABORATORY STUDY (2)
Figure 5-5: Evaluation questionnaire – general rating of the Best Practice Tips6
Another question on the evaluation questionnaire asked for an opinion of the
individual Best Practice Tips. The test participants should rate every tip on a scale
from “1: very good” to “5: not good at all”. The results are shown in Figure 5-6. The
soaking and air drying of the dishes were among the most favourite tips, whereas the
recommended amount of detergent was the least accepted. On average, the individual
tips were rated at around 70% “very good” or “good”.
6 Because of rounded values, it occurs that the summation per statement does not amount up to 100%.
Question:
Please rate the Best Practice Tips in total with different positive or negative adjectives. Rate
with “++” or “+” towards the positive or the negative adjective or with “0” for a neutral
statement.
38%
43%
25%
47%
29%
58%
21%
21%
44%
42%
45%
44%
34%
50%
35%
33%
58%
48%
12%
6%
21%
15%
19%
6%
37%
19%
8%
8%
6%
8%
4%
2%
2%
8%
2%
2%
2%
0% 20% 40% 60% 80% 100%
Easy to apply
Clearly laid out
Interesting
Reasonable
Descriptive
Clearlyunderstandable
Up to date
Profitable
Logical
++ + o + ++
Difficult to apply
Nonsensical
Old-fashioned
Unprofitable
Confusing
Boring
Abstract
Ambiguous
Illogical

APPLICATION OF BEST PRACTICE TIPS IN A LABORATORY STUDY (2) 57
Figure 5-6: Evaluation questionnaire – rating of the individual tips of the Best Practice Tips7
5.4 Discussion and conclusion
All experiments in the EDB studies and in the BPT study are performed with 12 place
settings. This is the load of dishes that is used in the measurement standard for
automatic dishwashing EN 50242:2008 (CENELEC, 2008). It is argued by
STAMMINGER et al. that a normal household may only use half of the capacity of a
dishwasher for normal dishes, using the rest of the capacity for bulky items
(STAMMINGER et al., 2007b). Other studies report that consumers only put between
40 and 70 items into a dishwasher before starting the – in the consumers opinion –
completely filled machine (RICHTER, 2010a). The difference to the 140 items of the
12 place settings fitting into a normal dishwasher can be explained by the variety of
the shapes normal dishes have which does not allow the filling of a dishwasher as
7 Because of rounded values, it occurs that the summation per statement does not amount up to 100%.
Question:
Please rate the single tips of the Best Practice on a scale from “1: very good” to “5: not good at all”.
62%
39%
38%
36%
43%
35%
38%
28%
19%
55%
17%
27%
38%
28%
30%
37%
38%
32%
40%
34%
19%
29%
20%
19%
19%
27%
21%
19%
25%
8%
2%
4%
4%
13%
8%
4%
19%
11%
4%
4%
2%
6%
0% 20% 40% 60% 80% 100%
Air drying of dishes
Half filled sink
Water changes
Rinsing in a sink
Washing up in a sink
Low foam production
Detergent add in after water let in
Use of a dosing tool
Recommended amount of detergent
Soaking the plates
1: very good 2: good 3: moderate 4: not good 5: not good at all

58 APPLICATION OF BEST PRACTICE TIPS IN A LABORATORY STUDY (2)
completely as under standardised conditions. The 12 place settings in the BPT study
were chosen to make the results comparable to the two other studies (EU study and
Global study), and also to the amount of resources an automatic dishwasher needs.
Although the samples of the three different studies washed up 12 place settings at the
same work station, it can be argued whether the behaviour of three different
populations is compared. BERKHOLZ et al. proved in their study that it is possible in
the field of manual dishwashing to use only a small sample to get a good estimate of
the everyday behaviour in manual dishwashing. In this study, a small sample of 27
randomly chosen U.K. consumers from the EU study was compared to a large sample
of 150 U.K. consumers selected to be representative. The results of the two studies
showed no significant differences in the results for water consumption, energy
consumption, time needed, and detergent consumption. The only exception was the
cleaning performance, and this was explained by the subjective visual evaluation of
the cleanliness. It was thus concluded that the populations show the same distributions,
and also that the small sample of the EU study gives a good estimation of the overall
consumer behaviour (BERKHOLZ et al., 2010). This evidence is used to assume that the
everyday behaviour of the consumers in the BPT study is the same as in the EU study
and in the Global study.
The comparison of the averages of the three studies shows that savings seem to be
actually possible by applying the Best Practice Tips resource. The application of the
Best Practice Tips especially promises high resource savings with water (60%) and
energy consumption (70%). However, the savings of the detergent consumption at
around 30% cannot be neglected either. Nevertheless, it should be kept in mind that it
is a comparison of averages and that the Global study shows a large variation between
individuals. This means that there are also consumers who use approximately the same
amount of resources or even less by the application of their everyday behaviour as test
participants who are applying the Best Practice Tips. Being aware that the figures are
based on three different samples, it is not possible to draw sound conclusions from the
comparison; however, it is possible to say that tendencies in a reduction of the
resources are obvious.
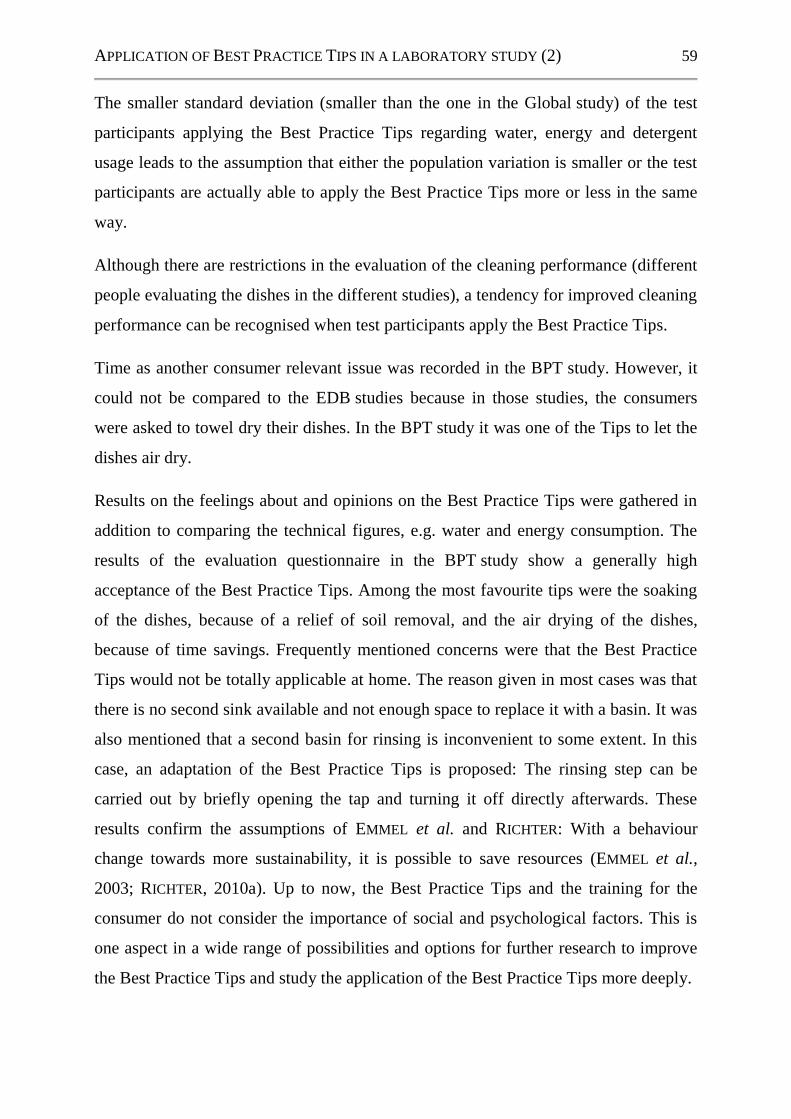
APPLICATION OF BEST PRACTICE TIPS IN A LABORATORY STUDY (2) 59
The smaller standard deviation (smaller than the one in the Global study) of the test
participants applying the Best Practice Tips regarding water, energy and detergent
usage leads to the assumption that either the population variation is smaller or the test
participants are actually able to apply the Best Practice Tips more or less in the same
way.
Although there are restrictions in the evaluation of the cleaning performance (different
people evaluating the dishes in the different studies), a tendency for improved cleaning
performance can be recognised when test participants apply the Best Practice Tips.
Time as another consumer relevant issue was recorded in the BPT study. However, it
could not be compared to the EDB studies because in those studies, the consumers
were asked to towel dry their dishes. In the BPT study it was one of the Tips to let the
dishes air dry.
Results on the feelings about and opinions on the Best Practice Tips were gathered in
addition to comparing the technical figures, e.g. water and energy consumption. The
results of the evaluation questionnaire in the BPT study show a generally high
acceptance of the Best Practice Tips. Among the most favourite tips were the soaking
of the dishes, because of a relief of soil removal, and the air drying of the dishes,
because of time savings. Frequently mentioned concerns were that the Best Practice
Tips would not be totally applicable at home. The reason given in most cases was that
there is no second sink available and not enough space to replace it with a basin. It was
also mentioned that a second basin for rinsing is inconvenient to some extent. In this
case, an adaptation of the Best Practice Tips is proposed: The rinsing step can be
carried out by briefly opening the tap and turning it off directly afterwards. These
results confirm the assumptions of EMMEL et al. and RICHTER: With a behaviour
change towards more sustainability, it is possible to save resources (EMMEL et al.,
2003; RICHTER, 2010a). Up to now, the Best Practice Tips and the training for the
consumer do not consider the importance of social and psychological factors. This is
one aspect in a wide range of possibilities and options for further research to improve
the Best Practice Tips and study the application of the Best Practice Tips more deeply.

60 APPLICATION OF BEST PRACTICE TIPS IN A LABORATORY STUDY (2)
5.5 Outlook
The results presented in this part were recorded entirely in a laboratory. Up to now, it
is unknown if it is possible to save resources in real life, and also over a longer period,
when applying the Best Practice Tips. As DEYOUNG stated, it is necessary to lay focus
on psychological aspects to reach a long-term change in dishwashing behaviour
(DEYOUNG, 1993). His proposal of instruments to change environmental behaviour in
the long term could be combined with the Best Practice Tips. This might be especially
important in countries where the resources of water and energy are restricted.
Differences between different ways of washing up have also to be considered. It would
be interesting to find out if consumers washing up under running tap water were
willing to change their behaviour to the recommended sink washing method.

APPLICATION OF THE BEST PRACTICE TIPS IN AN IN-HOUSE STUDY 61
6 Application of the Best Practice Tips in an in-house study8
In laboratory studies, it seemed to be possible to save resources by training people on
Best Practice Tips in manual dishwashing. The transfer of the idea into the consumer‟s
homes and the everyday behaviour, i.e. the verification of possible resource savings by
application of the Best Practice Tips is subject of this part.
6.1 Objectives
This study aims at finding out if the consumer is willing to apply the Best Practice
Tips for manual dishwashing in his everyday life. Besides, it shall be checked if
resource savings can be realised when consumers apply the Best Practice Tips in their
day-to-day behaviour in comparison to their usual way of cleaning the dishes by hand.
Country specific differences shall be investigated between Germany as a country
where the so-called sink washing process is mostly applied and Spain as a country
where the majority washes up under running tap water (compare Table 1-1).
6.2 Material and methods
A four week in-house study was run in two countries and data was gathered on manual
dishwashing behaviour before and after a training on the Best Practice Tips as
presented in Table 4-1. The results of both periods were compared with each other and
between the countries.
8 to be published in a similar way in FUSS, N. & STAMMINGER, R. (2011a): Application of Best Practice Tips in
manual dishwashing - a comparison between Germany and Spain. International Journal of Consumer Studies.

62 APPLICATION OF THE BEST PRACTICE TIPS IN AN IN-HOUSE STUDY
Overview on the test procedure in each household
The data gathering in every household comprised two periods of two weeks (Figure
6-1).
Figure 6-1: Overview on the test procedure
Source: own illustration
In the first period, called “Before Training (BT)”, data was recorded while the
households were performing their usual way of dishwashing. After this first period, the
households were visited and trained on the Best Practice Tips (compare Table 4-1) in
an oral briefing. Furthermore, every household got a printed copy of the Best Practice
Tips. In the second period, called “After Training (AT)”, the households should apply
the Best Practice Tips. Therefore, every household was equipped with a dish rack, a
bowl to compensate for a missing second sink and a soap dispenser in order to allow a
better dosing of the detergent. Each household had to fill out questionnaires: a
preliminary one on the household‟s usual dishwashing behaviour before the period BT

APPLICATION OF THE BEST PRACTICE TIPS IN AN IN-HOUSE STUDY 63
and an evaluation questionnaire after the end of the period AT. In addition, the
households were asked to tell in a short oral feedback what they had liked about the
training or what problems they had encountered. Over the total duration time (both
periods BT and AT), the households had to fill in a diary every time they were
cleaning the dishes. They were asked to keep track of how many dishes were cleaned,
what type of items (cooking items, plates and cups, glasses, cutlery or “other items”)
were washed up, and to give an estimation of how hard the items were soiled. Several
photographs of examples of soiled dishes were provided for support. The amount of
used detergent was also recorded in the diary. The household was asked to weigh the
bottle with detergent before and after the wash up on an electronic kitchen scale which
was provided.
Samples
The samples from Germany and Spain comprised each 20 households not owning a
dishwasher. The recruitment in Germany was performed in the region Bonn/ Cologne
and in Spain in Madrid and its suburbs. Figure 6-2 presents general data on the test
households. In the German sample, 16 of 20 households were fully evaluable and in
the Spanish sample 18 of 20. The other four (German sample) resp. two (Spanish
sample) test households could not be evaluated completely because of incomplete data
caused by temporary failure of the measuring instruments and were therefore not
included in the final results. The major part of the test households in both countries
were one- and two-person households. In the preliminary questionnaire, the
households were asked about their usual way of washing up. “Sink washing” means
washing up the dishes in a plugged sink filled with water. “Running tap washing”
stands for cleaning the dishes under running tap water while the sink is not plugged. A
mixed washer combines both ways of washing up, for example he/ she cleans the
dishes in a sink filled with water but rinses them under running tap water. While in the
Spanish sample the greatest part of the test persons claims to be a running tap washer,
the majority in the German sample states to be a mixed washer.

64 APPLICATION OF THE BEST PRACTICE TIPS IN AN IN-HOUSE STUDY
Figure 6-2: General data on the samples
Measuring instruments
In order to gather data on the household‟s resource consumption when cleaning dishes
by hand, a meter box with an adapter and a pipe was installed at the kitchen tap
(Figure 6-3). The meter box contained a turbine flow meter and a thermocouple to
measure amount and temperature of the water. When the water had passed the meter
box, it flew out through a standard tap aerator. Water consumption and water
temperature were recorded on a common personal computer. A webcam was installed
and combined with a motion detector software to record pictures of the sink as soon as
there was a movement.
16
4
8
3
1
3 3
10
18
4
9
23
0
14
4
0
2
4
6
8
10
12
14
16
18
20
of 20 1 2 3 4 Sinkwasher
Runningtap washer
Mixedwasher
Completelyevaluated
Persons living in household Usual way of washing up
Fre
qu
en
cy
German sample Spanish sample

APPLICATION OF THE BEST PRACTICE TIPS IN AN IN-HOUSE STUDY 65
Figure 6-3: Scheme of the installed measuring instruments
Source: own illustration
The energy consumption was calculated as a variable resulting of the hot water
consumption:
(6-1)
where
Q Energy in kWh
m amount of water used in kg
c specific heat capacity of water: 4.19 kJ/(kg*K)
ΔT measured water temperature – cold water temperature (15 °C) in K
To make the results comparable despite different cold water temperatures in different
countries and seasons, an average cold water temperature of 15 °C was assumed.
Water
consumption Water
temperature
Pictures of
the webcam
Pulse meterThermo couple
Turbine flow
meter
Pipe
Webcam
with motion
detector
software
Adapter
Water
outcome with
tap aerator
Meter box
Kitchen
sink
Personal
computer
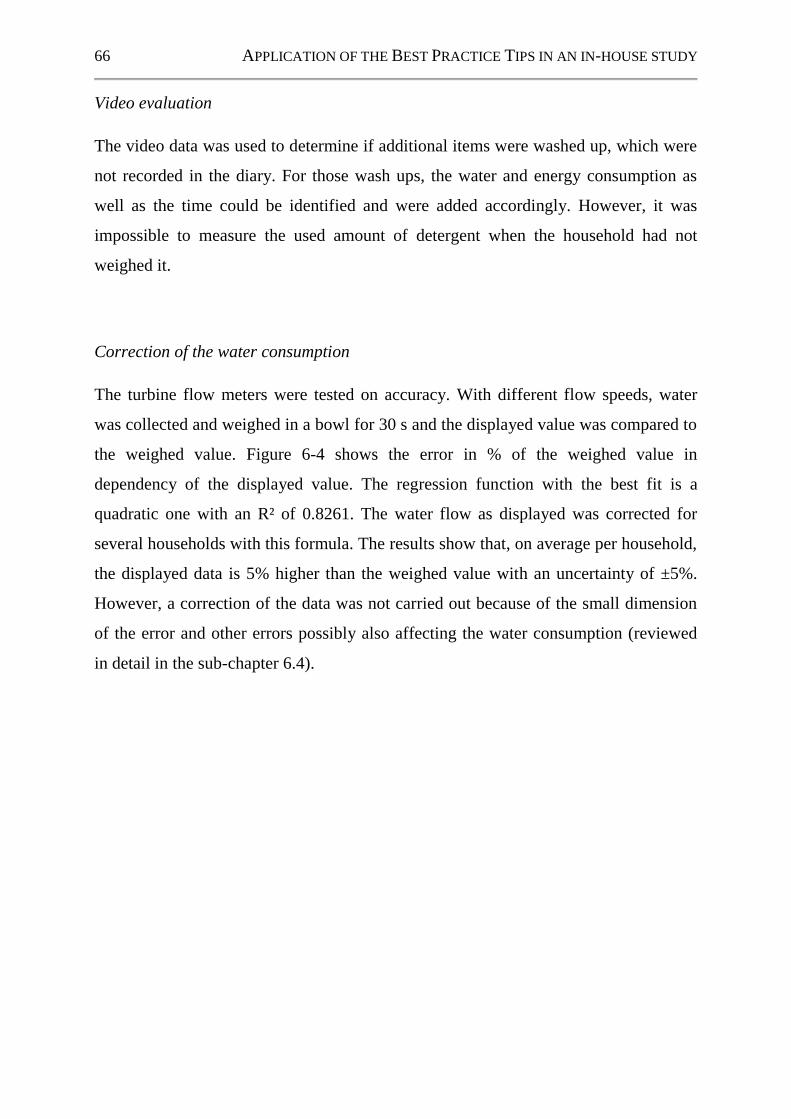
66 APPLICATION OF THE BEST PRACTICE TIPS IN AN IN-HOUSE STUDY
Video evaluation
The video data was used to determine if additional items were washed up, which were
not recorded in the diary. For those wash ups, the water and energy consumption as
well as the time could be identified and were added accordingly. However, it was
impossible to measure the used amount of detergent when the household had not
weighed it.
Correction of the water consumption
The turbine flow meters were tested on accuracy. With different flow speeds, water
was collected and weighed in a bowl for 30 s and the displayed value was compared to
the weighed value. Figure 6-4 shows the error in % of the weighed value in
dependency of the displayed value. The regression function with the best fit is a
quadratic one with an R² of 0.8261. The water flow as displayed was corrected for
several households with this formula. The results show that, on average per household,
the displayed data is 5% higher than the weighed value with an uncertainty of ±5%.
However, a correction of the data was not carried out because of the small dimension
of the error and other errors possibly also affecting the water consumption (reviewed
in detail in the sub-chapter 6.4).
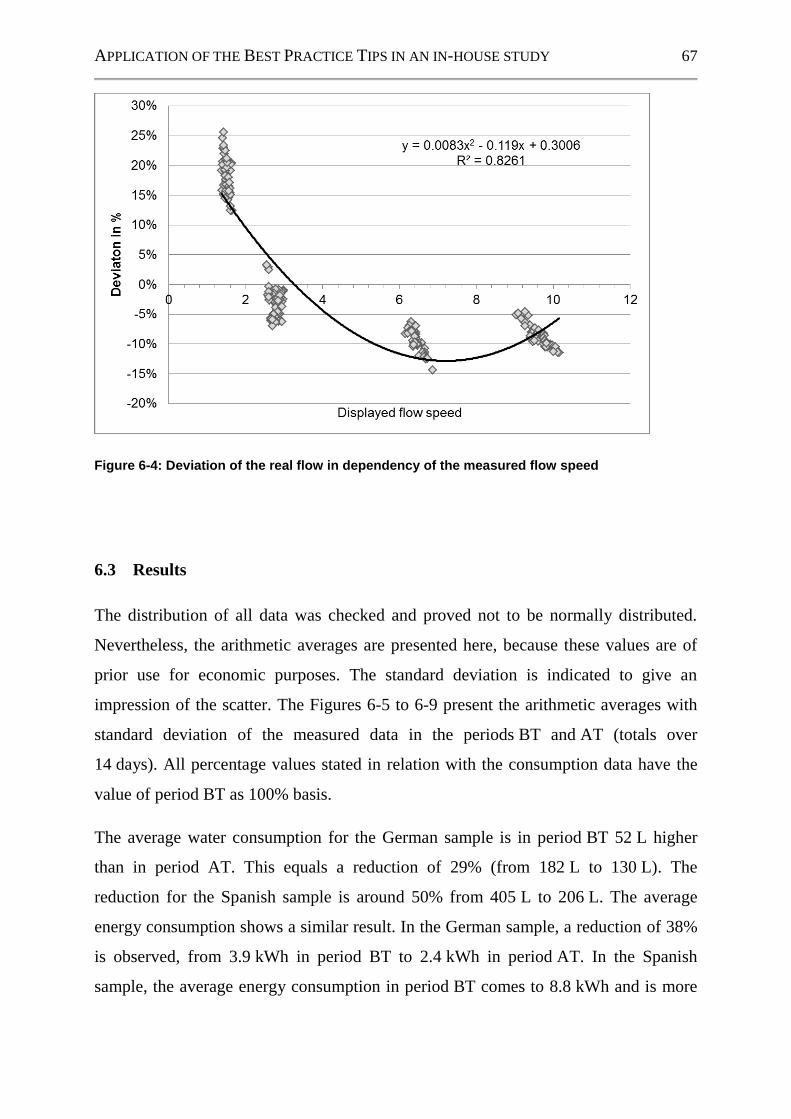
APPLICATION OF THE BEST PRACTICE TIPS IN AN IN-HOUSE STUDY 67
Figure 6-4: Deviation of the real flow in dependency of the measured flow speed
6.3 Results
The distribution of all data was checked and proved not to be normally distributed.
Nevertheless, the arithmetic averages are presented here, because these values are of
prior use for economic purposes. The standard deviation is indicated to give an
impression of the scatter. The Figures 6-5 to 6-9 present the arithmetic averages with
standard deviation of the measured data in the periods BT and AT (totals over
14 days). All percentage values stated in relation with the consumption data have the
value of period BT as 100% basis.
The average water consumption for the German sample is in period BT 52 L higher
than in period AT. This equals a reduction of 29% (from 182 L to 130 L). The
reduction for the Spanish sample is around 50% from 405 L to 206 L. The average
energy consumption shows a similar result. In the German sample, a reduction of 38%
is observed, from 3.9 kWh in period BT to 2.4 kWh in period AT. In the Spanish
sample, the average energy consumption in period BT comes to 8.8 kWh and is more

68 APPLICATION OF THE BEST PRACTICE TIPS IN AN IN-HOUSE STUDY
than 5 kWh higher than in period AT. The decrease in energy usage among the
Spanish test participants is at 61%. The numbers concerning the average detergent
consumption are as follows: In the German sample, there is a decrease from 77 g to
45 g (-42%), whereas in the Spanish sample, the average detergent consumption
decreased from 113 g to 55 g (-51%).
The average time taken for dishwashing in 14 days is in the German sample in
period BT 17% higher than in period AT. In the Spanish sample, the same value is in
period BT 30% higher than in period AT. The average number of items washed up in
one period decreases slightly: In the German sample, there are on average 51 items
less to be washed up and in the Spanish sample on average 35 items less to be cleaned.
Figure 6-5: Arithmetic average and standard deviation of the water consumption in 14 days
Figure 6-6: Arithmetic average and standard deviation of the energy consumption in 14 days
Figure 6-7: Arithmetic average and standard deviation of the detergent consumption in 14 days

APPLICATION OF THE BEST PRACTICE TIPS IN AN IN-HOUSE STUDY 69
Figure 6-8: Arithmetic average and standard deviation of the time taken in 14 days
Figure 6-9: Arithmetic average and standard deviation of the number of items in 14 days
The average data per washed item is shown in the Figures 6-10 to 6-13. The average
reduction for water consumption per washed item in the German sample comes to 19%
and in the Spanish sample to 39%. Per item, the German test persons use on average
31% less energy and the Spanish test persons consume 41% less energy after the
training (in period AT). The average detergent consumption in period AT is 38%
lower than in period BT in the German sample and 39% lower in the Spanish sample.
The time needed to wash up one item was approximately the same (3% less in
period AT compared to period BT) in the German sample, and the value for the
Spanish sample is 18% lower in period AT compared to period BT.
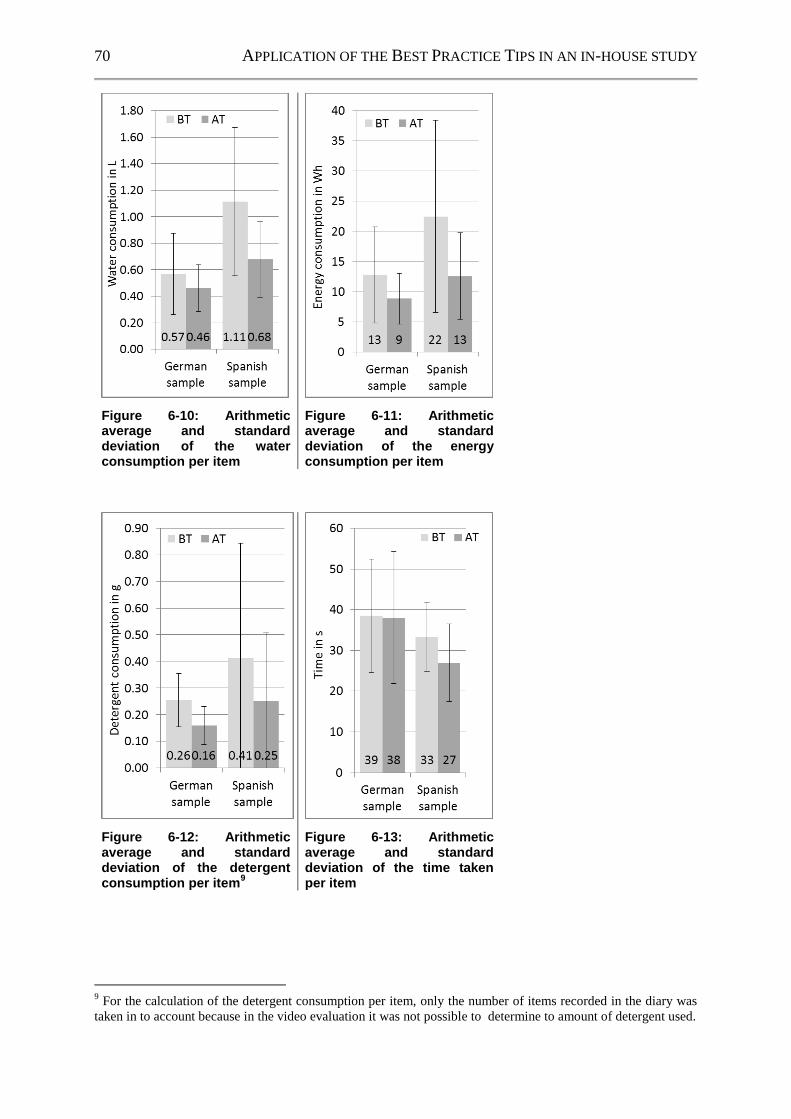
70 APPLICATION OF THE BEST PRACTICE TIPS IN AN IN-HOUSE STUDY
Figure 6-10: Arithmetic average and standard deviation of the water consumption per item
Figure 6-11: Arithmetic average and standard deviation of the energy consumption per item
Figure 6-12: Arithmetic average and standard deviation of the detergent consumption per item
9
Figure 6-13: Arithmetic average and standard deviation of the time taken per item
9 For the calculation of the detergent consumption per item, only the number of items recorded in the diary was
taken in to account because in the video evaluation it was not possible to determine to amount of detergent used.
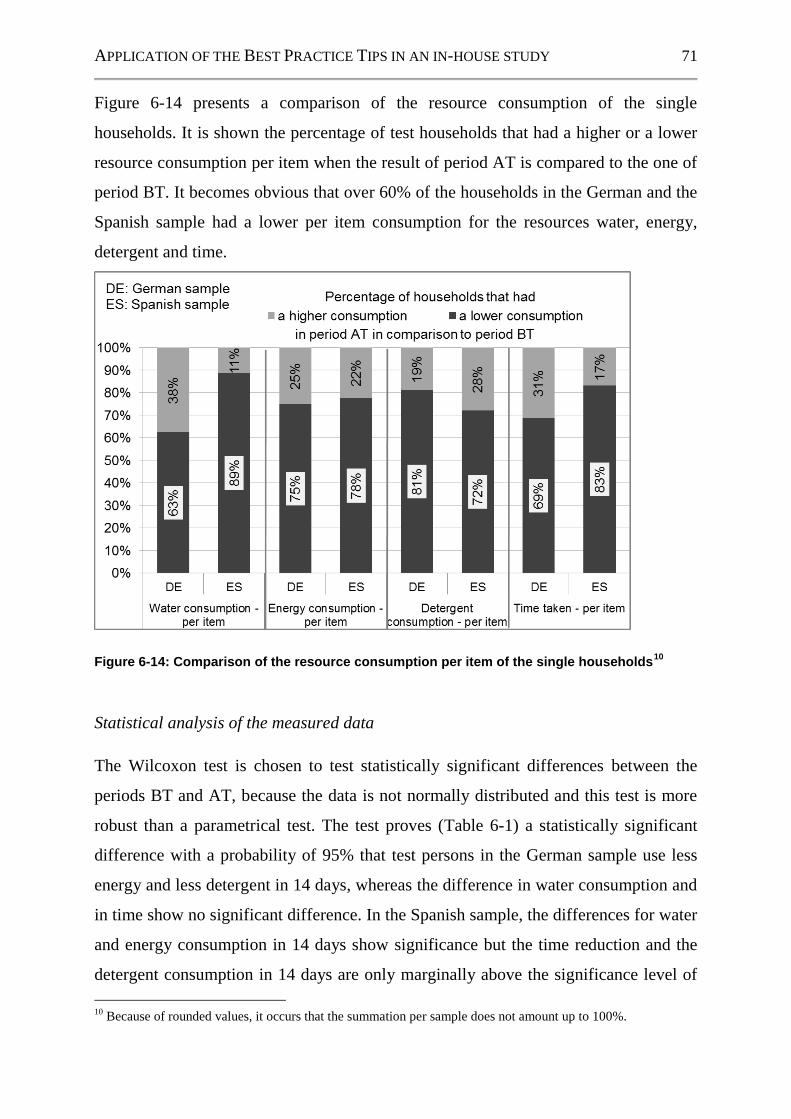
APPLICATION OF THE BEST PRACTICE TIPS IN AN IN-HOUSE STUDY 71
Figure 6-14 presents a comparison of the resource consumption of the single
households. It is shown the percentage of test households that had a higher or a lower
resource consumption per item when the result of period AT is compared to the one of
period BT. It becomes obvious that over 60% of the households in the German and the
Spanish sample had a lower per item consumption for the resources water, energy,
detergent and time.
Figure 6-14: Comparison of the resource consumption per item of the single households10
Statistical analysis of the measured data
The Wilcoxon test is chosen to test statistically significant differences between the
periods BT and AT, because the data is not normally distributed and this test is more
robust than a parametrical test. The test proves (Table 6-1) a statistically significant
difference with a probability of 95% that test persons in the German sample use less
energy and less detergent in 14 days, whereas the difference in water consumption and
in time show no significant difference. In the Spanish sample, the differences for water
and energy consumption in 14 days show significance but the time reduction and the
detergent consumption in 14 days are only marginally above the significance level of
10
Because of rounded values, it occurs that the summation per sample does not amount up to 100%.

72 APPLICATION OF THE BEST PRACTICE TIPS IN AN IN-HOUSE STUDY
0.05. The difference in the number of items between the periods BT and AT is not
significant, neither in the German nor in the Spanish sample.
The reduction per item is significant for the detergent consumption in the German
sample, the water consumption and time taken in the Spanish sample. The detergent
and energy consumption in the Spanish sample missed significance only marginally.
Table 6-1: Results of the statistical analysis
Wilcoxon-Test
H0: Medians BT and AT show no significant difference
H1: Medians BT and AT show significant difference
p < 0.05 reject H0 (significance level: 5%)
in 14 days per item
p values German sample
Spanish sample
German sample
Spanish sample
Water consumption 0.1134 0.0462 0.5465 0.0104
Energy consumption 0.0348 0.0480 0.2119 0.0842
Detergent consumption 0.0104 0.0817 0.0067 0.0577
Time taken 0.6511 0.0713 0.7063 0.0024
Number of items 0.5465 0.2293
Results of the evaluation questionnaire
In the evaluation questionnaire, the test persons were asked to rate the Best Practice
Tips in regard to different positive or negative adjectives (Figure 6-15). They should
rate with “++” or “+” towards the positive or the negative side or with “0” for a neutral
statement. In both countries, the Best Practice Tips are rated very positive in general.
Especially the Spanish test persons rate the Best Practice Tips “easy to apply” (83%
rated with “++” or “+”), “easy to understand” (95% rated with “++” or “+”) and
“profitable” (78% rated with “++” or “+”). However, some of the Spanish participants
are undecided (39% rated with “0”) whether the Best Practice Tips are “up to date” or
even “old-fashioned”. The German test persons find the Best Practice Tips “easy to
understand” (94% rated with “++” or “+”) but only a smaller part judge them “easy to
apply” (62% rated with “++” or “+”) and some of them are undecided if they can
profit from the Best Practice Tips (38% rated with “0”). In contrast to the Spanish test

APPLICATION OF THE BEST PRACTICE TIPS IN AN IN-HOUSE STUDY 73
persons, more German participants consider the Best Practice Tips “up to date”
(75% rated with “++” or “+”).
Figure 6-15: Rating of the Best Practice Tips in general11
The test persons were asked to rate each tip on a scale from “1: very good” to
“5: not good at all”. On average (Figure 6-16), the Best Practice Tips are rated with
over 80% “good” or “very good”. The tip “rinsing in a sink or a second bowl” is the
least positive rated tip in both samples (69% of the German test persons resp. 56% of
the Spanish test persons rate with “very good” or “good”). The reason given in most
cases is that there is no space for an additional sink or bowl. The most positive rated
tip is the air drying of the dishes (94% resp. 95% rated with “very good” and “good”).
This tip is chosen as favourite mostly because of time savings.
11
Because of rounded values, it occurs that the summation per statement does not amount up to 100%.
Question:
Please rate the Best Practice Tips in total with different positive or negative adjectives.
Rate with “++” or “+” towards the positive or the negative adjective or with “0” for a neutral
statement.
(DE: German sample, ES: Spanish sample)
56%
44%
69%
67%
44%
6%
38%
28%
6%
39%
25%
28%
31%
39%
25%
50%
25%
6%
25%
39%
38%
17%
13%
17%
6%
17%
6%
0% 20% 40% 60% 80% 100%
DE
ES
DE
ES
DE
ES
DE
ES
++ + 0 + ++
Difficult to apply
Easy to apply
Easy to under-stand
Up to date
Profitable
Difficult to understand
Old-fashioned
Un-profitable

74 APPLICATION OF THE BEST PRACTICE TIPS IN AN IN-HOUSE STUDY
Figure 6-16: Rating of the single tips of the Best Practice12
12
Because of rounded values, it occurs that the summation per statement does not amount up to 100%.
Question:
Please rate the single tips of the Best Practice on a scale from “1: very good” to “5: not good at all”.
(DE: German sample, ES: Spanish sample)
56%
83%
56%
28%
69%
44%
75%
28%
56%
28%
63%
17%
50%
44%
75%
78%
19%
11%
31%
67%
13%
44%
19%
67%
25%
50%
6%
39%
25%
33%
19%
17%
13%
6%
13%
6%
19%
11%
6%
6%
6%
11%
13%
22%
19%
17%
6%
13%
6%
11%
6%
22%
6%
6%
6%
13%
6%
0% 20% 40% 60% 80% 100%
DE
ES
DE
ES
DE
ES
DE
ES
DE
ES
DE
ES
DE
ES
DE
ES
Soa
kin
g t
he
pla
tes
Am
oun
t o
fd
ete
rgen
t
Dete
rge
nt
add
in
aft
er
wate
r le
t in
Low
fo
am
pro
du
ction
Wa
sh
ing
up
in a
sin
kR
insin
g in a
sin
kH
alf fill
ed
sin
kA
ir d
ryin
go
f d
ish
es
1: very good 2: good 3: moderate 4: not good 5: not good at all
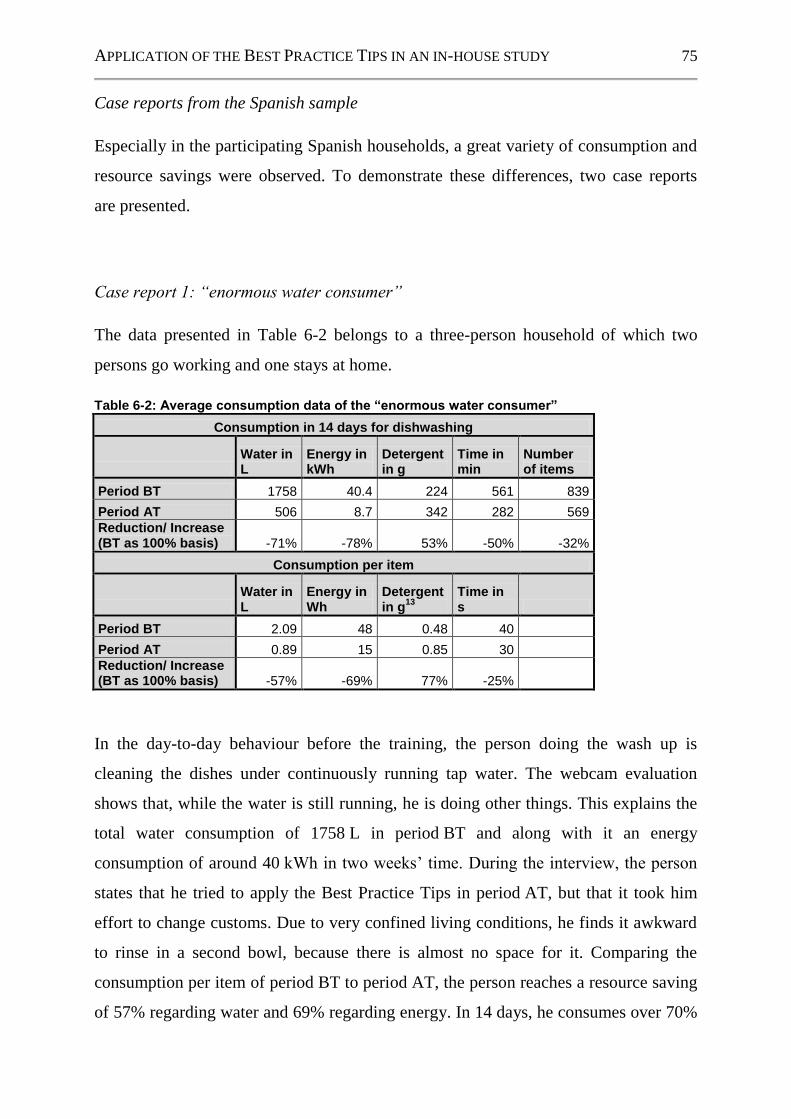
APPLICATION OF THE BEST PRACTICE TIPS IN AN IN-HOUSE STUDY 75
Case reports from the Spanish sample
Especially in the participating Spanish households, a great variety of consumption and
resource savings were observed. To demonstrate these differences, two case reports
are presented.
Case report 1: “enormous water consumer”
The data presented in Table 6-2 belongs to a three-person household of which two
persons go working and one stays at home.
Table 6-2: Average consumption data of the “enormous water consumer”
Consumption in 14 days for dishwashing
Water in L
Energy in kWh
Detergent in g
Time in min
Number of items
Period BT 1758 40.4 224 561 839
Period AT 506 8.7 342 282 569
Reduction/ Increase (BT as 100% basis) -71% -78% 53% -50% -32%
Consumption per item
Water in L
Energy in Wh
Detergent in g
13 Time in s
Period BT 2.09 48 0.48 40
Period AT 0.89 15 0.85 30
Reduction/ Increase (BT as 100% basis) -57% -69% 77% -25%
In the day-to-day behaviour before the training, the person doing the wash up is
cleaning the dishes under continuously running tap water. The webcam evaluation
shows that, while the water is still running, he is doing other things. This explains the
total water consumption of 1758 L in period BT and along with it an energy
consumption of around 40 kWh in two weeks‟ time. During the interview, the person
states that he tried to apply the Best Practice Tips in period AT, but that it took him
effort to change customs. Due to very confined living conditions, he finds it awkward
to rinse in a second bowl, because there is almost no space for it. Comparing the
consumption per item of period BT to period AT, the person reaches a resource saving
of 57% regarding water and 69% regarding energy. In 14 days, he consumes over 70%

76 APPLICATION OF THE BEST PRACTICE TIPS IN AN IN-HOUSE STUDY
less water and energy. However, the detergent consumption increases per item, as well
as in total for over 50%. The test person spends 25% less time to wash up one item by
applying the Best Practice Tips and in total 50% less time for dish cleaning. However,
it has to be taken into account that in period AT, he washes up 32% less items. He
states in the evaluation that the benefits of the Best Practice Tips are quite obvious and
that he also feels that he consumes less resources by applying them. In the future – so
his statement – he will continue to apply most of the tips, like washing up in a sink,
but he will replace rinsing in a bowl by shortly opening the tap.
Case report 2: few item consumer
The data shown in Table 6-3 belongs to a one-person household. The woman is a
professional who spends almost no time at home and prepares very few meals at home.
Therefore, only the small number of 73 resp. 76 items were dirtied in 14 days.
Table 6-3: Average consumption data of the “few item consumer”
Consumption in 14 days for dishwashing
Water in L
Energy in kWh
Detergent in g
Time in min
Number of items
Period BT 70 0.5 37 38 73
Period AT 99 1.7 49 28 76
Reduction/ Increase (BT as 100% basis) 41% 240% 32% -26% 4%
Consumption per item
Water in L
Energy in Wh
Detergent in g
13 Time in s
Period BT 0.95 6 0.60 31
Period AT 1.31 22 0.71 22
Reduction/ Increase (BT as 100% basis) 38% 267% 18% -29%
The person‟s usual dishwashing behaviour when dishwashing is to open the tap shortly
at a very low flow speed, wash and rinse the item and then close the tap before the
next item is cleaned. With this method, on average per item, she consumes 0.95 L of
water, 6 Wh of energy and 0.60 g of detergent and needs on average 31 s to per
cleaned item. When applying the Best Practice Tips, the person needs 38% more water
13
For the calculation of the detergent consumption per item, only the number of items recorded in the diary was
taken in to account because in the video evaluation it was not possible to determine to amount of detergent used.

APPLICATION OF THE BEST PRACTICE TIPS IN AN IN-HOUSE STUDY 77
(1.31 L per item), 267% more energy (22 Wh per item) and 18% more detergent
(0.71 g per item) but 29% less time (22 s per item). In the evaluation, she states that
the sink washing method of the Best Practice Tips is something completely new to her
and that she does not necessarily see the benefit for herself. However, some of the tips
please her, like the accumulation of the dishes, and she will continue to apply those.
6.4 Discussion
Looking at the average data of the studies in German and Spanish households, one can
see that it was possible to confirm the potential of resource savings of the laboratory
studies (FUSS et al., 2011; FUSS and STAMMINGER, 2011b) by applying the Best
Practice Tips. Although not all of the reductions show statistical significance at a 95%
level , the majority of households has a lower resource consumption per item in period
AT compared to period BT (Figure 6-14).
Even in the German households, which were already mostly applying the sink washing
method already before the training, an average reduction of the resource consumption
can be measured between the periods BT and AT. In Spanish households, the average
savings are higher in general (except regarding the detergent), but nevertheless the
total water and energy consumption in the Spanish sample after training is still higher
than in the German sample before training. This is possibly due to the fact that the
Spanish participants were mostly running tap washers. With the running tap method,
the water can be used essentially for one item only, whereas with the sink washing
method, the water can be used for more than one item. As the Spanish persons have to
make the “bigger” change of their everyday behaviour when applying the Best Practice
Tips, the reductions of the resource consumptions are higher than in Germany. Despite
the fact that the reduction in the number of items from period BT to AT in both
samples is not significant, this may contribute partly to the reduction of the resource
consumption.
In the German study, as well as in the Spanish study, the individual savings are very
different: There are test persons who save enormous amounts of water and energy and

78 APPLICATION OF THE BEST PRACTICE TIPS IN AN IN-HOUSE STUDY
other test persons who consume even more resources by applying the Best Practice
Tips. In general, this is possibly due to individual living conditions, such as the space
of the apartment or the percentage of meals taken out of home. Other possible reasons
are more or less speculations. Especially the number of dirty dishes in the household
seems to affect the savings. This can be seen in the presented case “few item
consumer”: She produces only a small number of dirty dishes and cleans them quite
efficiently under running tap water by turning the tap off in between. Filling two sinks
with water (one for main washing and soaking and one for rinsing) is less efficient,
even if she is accumulating the dirty dishes over a few days. This example is a
confirmation of the assumption of a study by FUSS and STAMMINGER, which state that
there might be another optimal way of cleaning the dishes by hand when there are only
a few items (FUSS and STAMMINGER, 2011b). When the two examples are compared,
it becomes also obvious that there are more and less efficient running tap washers.
Data comparison to previous data on manual dishwashing
In the German sample of this study, the average water consumption per item in
period BT lies at 0.57 L. In a German sample of RICHTER, the average per item water
consumption comes to 1.0 L in households without a dishwasher (RICHTER, 2010b).
Taking into consideration that the Italians, just like the Spanish, are mostly running tap
washers, both values can be compared as well. In the current study, the Spanish per
item water consumption is at 1.11 L and after RICHTER the Italian one is at 1.7 L of
water for households without dishwasher. The values of the reported study are lower
than the results of RICHTER‟s study (Table 5), but they are still in the range of the
variation. The differences might be explained with the small size of the samples and
the large range of the values in both studies.

APPLICATION OF THE BEST PRACTICE TIPS IN AN IN-HOUSE STUDY 79
Table 6-4: Average water consumption per item in households with and without dishwasher
Country with dishwasher (w DW) or without dishwasher (w/o DW)
Water use per item in L (arithmetic average)
Germany w DW 0.6
w/o DW 1.0
Italy w DW 1.0
w/o DW 1.7
Sweden w DW 0.8
w/o DW 1.7
UK w DW 0.6
w/o DW 1.6
Total w DW 0.7
w/o DW 1.5
Source: own illustration based on RICHTER (2010b)
Accuracy of the data
As described in the part “Material and methods”, tests on the accuracy of the turbine
flow meters showed that the displayed value of the water consumption is on average
5% higher than the real value and deviates around ±5%. However, this error fades into
the background if one considers all other influences on the accuracy of the data, for
example different consumer behaviour in different studies, the small samples with
large deviation or potential mistakes in the video evaluation. In the first place, the aim
of the study consists in comparing two periods, so the difference between the values is
more important than the absolute values which can be taken as orientation values. Not
only the water consumption, but also the calculation of the energy consumption is
affected by errors. The energy consumption was calculated on the basis of a cold water
temperature of 15 °C. However, it was not possible to take into account the line losses
and the different ways of heating the water with different speeds and also varying
efficiencies. The pictures recorded by the webcam were analysed in regard to the
question whether the household was washing up items which were not recorded in the
diaries. This evaluation was partly based on assumptions, because the exact number of
items was not countable at times.

80 APPLICATION OF THE BEST PRACTICE TIPS IN AN IN-HOUSE STUDY
6.5 Conclusion
In spite of the restrictions mentioned above, this study showed that it seems to be
possible to save, on average, resources like water and energy, not only in a laboratory
study, but also in real life. However, it also became obvious that there are restrictions
of such a training, like prejudices or difficulties in overcoming habits. Despite the
prejudices that were common especially among running tap washers, some of them
promised to continue applying the sink washing method in future time. The future
application of the proposed Best Practice Tips can only be assumed on the basis of
these statements. Therefore, it would be helpful to run a long term study that would
investigate the number of tips still applied for example after one year. Besides, it
seems necessary to gain deeper insight in how to convince and influence the
consumers so that they apply the Best Practice Tips and act more sustainably. In order
to reach a broader range of consumers, an improvement of the dissemination of the
Best Practice Tips is required.

SUMMARY, CONCLUSION AND OUTLOOK 81
7 Summary, conclusion and outlook
Previous studies about manual dishwashing concentrated on assessing how dishes are
cleaned in different countries and regions. It was shown in these studies that the
consumer behaviour and the resource consumption with manual dishwashing leaves
potential to optimise (e.g. BERKHOLZ et al., 2010). In contrast to these studies, the
target of this project was to concentrate on what can be done to change the manual
dishwashing consumer behaviour to a more sustainable one. This target was developed
by conducting four different subsequent studies:
The first study investigated the sink washing process of manual dishwashing
experimentally. It was found that the sink washing method carried out in three
steps in two sinks (soaking and main washing in one sink and rinsing in
another) led to reasonably good cleaning results. The main influencing factors
were the number of the water changes in both sinks, as well as the correct
amount of detergent. This experimental-based knowledge was combined with
experience from everyday life and put down in writing as an applicable guide
for the consumer, called Best Practice Tips in manual dishwashing.
In the second study, the application of the Best Practice Tips was checked in a
laboratory study. Consumers had to wash up different amounts of well-defined
soiled dish items: once by applying their everyday behaviour and once by
applying the Best Practice Tips. While for the larger amount of items it was
possible to save important amounts of resources, smaller dish loads showed in
average no significant reduction in the resource consumption.
In the following third study, consumers had to wash up the amount of dishes
that fit into a normal dishwasher by applying the Best Practice Tips. The gained
consumption data was compared to data of other studies where consumers had
to wash up the same load by applying their everyday behaviour. The result of
the previous study – important amounts of resources can be saved with large
amounts of dishes – could be confirmed.

82 SUMMARY, CONCLUSION AND OUTLOOK
In contrast to the first three studies, the fourth study investigated the application
of the Best Practice Tips in an in-house consumer study in Germany and Spain.
The comparison of the behaviour and the resource consumption before and after
a training on the Best Practice Tips showed that that saving considerable
amounts of resources is possible for most households when they are trained
how to apply Best Practice Tips in manual dishwashing.
Despite the fundamental results achieved about the best way of how dishes can be
cleaned with the least possible resources maintaining a reasonably good cleaning
result, the experimental investigation of manual dishwashing still has to be intensified:
It is recommendable to study in-depth more factors for the sink washing process, for
example, how different soils lead to different cleaning results. Apart from the sink
washing process which was the only process investigated in this project, it seems
necessary to study the running tap washing process, as it is a way of washing up only a
few items by hand.
Beside the thorough experimental investigation of manual dishwashing, the work with
the Best Practice Tips should be continued as well. It is suggested to optimise the
manner in which the consumer is given an understanding of the Best Practice Tips.
Different ways of trainings could be studied on its effect on the consumer behaviour,
for example, a training on the Best Practice Tips by a video record in comparison to a
personal demonstration or information on the Best Practice Tips only by a leaflet.
Besides, the strategy of giving feedback on the resource consumption and on the
possible resource savings should be studied. As mentioned in sub-chapter 1.2, this
instrument can also influence behaviour changes. Then, of course, there is the question
of how the Best Practice Tips can be disseminated so that a larger audience has
knowledge of the Best Practice Tips and can apply them. It could be considered as a
good way to disseminate them through organisations that are engaged in bringing more
sustainability into the household, for example the International Federation for Home
Economics (IFHE).
In the current project, the effects of the application of the Best Practice Tips have been
studied only in a short time perspective. It would be interesting to gain deeper insight

SUMMARY, CONCLUSION AND OUTLOOK 83
into the way in which the Best Practice Tips would affect the household‟s behaviour
on the long run. Out of such a study, knowledge could be gained what is to be done
that a sustainable behaviour in manual dishwashing is applied as everyday behaviour.
To reach a longer duration of a applying the Best Practice Tips for manual
dishwashing, it is recommended also to lay focus on psychological factors, as
DEYOUNG already claimed for a general behaviour change towards pro-environmental
behaviour (DEYOUNG, 1993).
The work with the consumers has revealed a great variety of individual manners.
Therefore, it is suggested to enlarge the Best Practice Tips by a part about
“What to do in case if…?” in order to take into account questions that might occur on
the consumers‟ side.
RICHTER claims the necessity to combine both ways of cleaning dishes, manual
dishwashing and automatic dishwashing (RICHTER, 2010b). Here, there might be some
potential for future work: It is recommended to study the impact of Best Practice Tips
that combine both manual and automatic dishwashing.
This work gives an insight into ways of contributing to a sustainable behaviour in
manual dishwashing. The idea of defining Best Practice Tips for resource savings
could not only be applied in dishwashing but also in other households‟ works, such as
clothes washing or cooking.


REFERENCES 85
References
ABRAHAMSE, W., STEG, L., VLEK, C. & ROTHENGATTER, T. (2005): A review of
intervention studies aimed at household energy conservation. Journal of
Environmental Psychology, 25, 3, 273-291.
ACI - American Cleaning Institute (n.d.): Hand dishwashing problems, causes and
solutions [Online]. Available:
http://www.cleaninginstitute.org/clean_living/hand_dishwashing_problems.asp
x [Accessed 03/2011].
ACSD - Association Canadienne de la Savonnerie et de la Détergence (n.d.): Le
lavage de la vaisselle à la main [Online]. Available:
http://www.healthycleaning101.org/french/SDAC_handdish-f.html [Accessed
03/2011].
AID INFODIENST (n.d.): Arbeitsanletung "Geschirr spülen von Hand" [Online].
Available: http://www.aid.de/downloads/handspuelen.pdf [Accessed 03/2011].
AITKEN, C. K., MCMAHON, T. A., WEARING, A. J. & FINLAYSON, B. L. (1994):
Residential water use: predicting and reducing consumption. Journal of Applied
Social Psychology, 24, 2, 136-158.
ARMENDARIZ, L. M. (2011): Cómo limpiar una casa [Online]. Available:
http://es.wikihow.com/limpiar-una-casa [Accessed 03/2011].
BAFU - Bundesamt für Umwelt Schweiz (2003): Regenwasser richtig nutzen
[Online]. Available:
http://www.bafu.admin.ch/publikationen/publikation/00323/index.html?lang=d
e [Accessed 03/2011].
BANDURA, A. (1977): Social learning theory. New York: Prentice-Hall.

86 REFERENCES
BAYAN, R. (n.d.): How to save money on dishwashing [Online]. Available:
http://www.ehow.com/how_4601410_save-money-dishwashing.html [Accessed
03/2011].
BC HYDRO (2009): Be efficient when washing dishes [Online]. Available:
http://www.bchydro.com/guides_tips/green-your-
home/appliances_guide/washing_dishes.html [Accessed 03/2011].
BDEW - Bundesverband der Energie- und Wasserwirtschaft in Deutschland (2011):
Trinkwasserverwendung im Haushalt 2010 [Online]. Available:
http://www.bdew.de/internet.nsf/id/DE_Trinkwasserverwendung-im-
Haushalt/$file/Trinkwasserverwendung%20im%20HH%202010.pdf [Accessed
03/2011].
BECKER, L. J. (1978): Joint effect of feedback and goal setting on performance: a field
study of residential energy conservation. Journal of Applied Psychology, 63, 4,
428-433.
BERKHOLZ, P. & STAMMINGER, R. (2009): Global manual dishwashing comparison.
44th International Detergency Conference Proceeding, 101-113.
BERKHOLZ, P., STAMMINGER, R., WNUK, G., OWENS, J. & BERNARDE, S. (2010):
Manual dishwashing habits: an empirical analysis of UK consumers.
International Journal of Consumer Studies, 34, 2, 235-242.
CAVE - Confederación de Asociaciones de Vecinos, Consumidores y Usuarios de
Espana (n.d.): Ahorro de agua [Online]. Available:
http://www.eurosur.org/CONSUVEC/contenidos/Consejos/serv_dom/agua/ahor
ro_agua/PAgua.html [Accessed 03/2011].
CECED - European Committee of Domestic Equipment Manufacturers (2003):
Voluntary commitment on reducing energy consumption of household
dishwashers. Third annual report to the Commission of the European
Communities [Online]. Available:

REFERENCES 87
http://www.ceced.org/ICECED/easnet.dll/GetDoc?APPL=1&DAT_IM=202DA
C&DWNLD=3rd_report_UIC_dishwashers.pdf.
CENELEC - European Committee for Electrotechnical Standardisation (2008): EN
50242:2008/ ISO 60346:2008. Electric dishwashers for household use -
methods for measuring the performance.
COMMON FAIT-ON (n.d.): Comment faire la vaisselle à la main? [Online]. Available:
http://www.commentfaiton.com/fiche/voir/8259/faire%20la%20vaisselle%20a
%20la%20main [Accessed 03/2011].
COOK, S. W. & BERRENBERG, J. L. (1981): Approaches to encouraging conservation
behavior: a review and conceptual framework. Journal of Social Issues, 37, 2,
73-107.
CORRAL-VERDUGO, V. & FRÍAS-ARMENTA, M. (2006): Personal normative beliefs,
antisocial behavior and residential water conservation. Environment and
Behavior, 38, 3, 406-421.
COTTAGE LIFE (2009): Tips for green dishwashing [Online]. Available:
http://www.cottagelife.com/index.cfm/ci_id/2979.htm [Accessed 03/2011].
CROUZERY, T. (2008): Bien faire "la plonge" [Online]. Available: http://comment-
ameliorer-son-pouvoir-dachat-sans-laide-du-gouvernement.over-
blog.com/article-23529504.html [Accessed 03/2011].
DAWES, R. M. (1980): Social dilemmas. Annual Review of Psychology, 31, 1, 169-193.
DESTATIS - Statistisches Bundesamt Deutschland (2009): Haushalte [Online].
Available:
http://www.destatis.de/jetspeed/portal/cms/Sites/destatis/Internet/DE/Content/St
atistiken/Bevoelkerung/Haushalte/Aktuell,templateId=renderPrint.psml
[Accessed 03/2011].

88 REFERENCES
DEYOUNG, R. (1993): Changing behavior and making it stick. Environment and
Behavior, 25, 4, 485-505.
DOE - U.S. Department of Energy Use (2007): Energy efficiency and renewable
energy [Online]. Buildings energy data book Available:
http://buildingsdatabook.eere.energy.gov/images/charts/2007/2005_Residential
BuildingsEnd-Use.pdf [Accessed 03/2011].
ECOLOGIC BARNA (n.d.): 20 Consejos útiles para ahorrar Agua [Online]. Available:
http://www.ecologicbarna.com/consejos_utiles.htm [Accessed 03/2011].
EEA - European Environment Agency (2001): Indicator fact sheet signals 2001 –
chapter household water consumption.
EEA - European Environment Agency (2005): Yearbook 2005.
EIA - U.S. Energy Information Administration (2005): Residential energy
consumptioin survey - detailed tables [Online]. Available:
http://www.eia.doe.gov/emeu/recs/recs2005/c&e/detailed_tables2005c&e.html
[Accessed 03/2011].
EKOPEDIA (2011): Vaisselle [Online]. Available: http://fr.ekopedia.org/Vaisselle
[Accessed 03/2011].
EMMEL, J., PARROTT, K. & BEAMISH, J. (2003): Dishwashing and Water Conservation:
An Opportunity for Environmental Education. Journal of Extension, Volume
41, 1.
ENNOVATIONZ (2010): Energy-saving dishwashing tips [Online]. Available:
http://www.ennovationz.com/learning/article/energy-saving-dishwashing-tips-1
[Accessed 03/2011].
EURORESIDENTES (n.d.): Limpiar la casa: lavavajillas o fregar los platos [Online].
Available: http://www.euroresidentes.com/vivienda/mantenimiento-casa/fregar-
los-platos.htm [Accessed 03/2011].
REFERENCES 89
FIT GMBH (n.d.): Ratgeber Spülen [Online]. Available: http://www.fit.de/fit/fit-
ratgeber/ratgeber-spuelen/ [Accessed 03/2011].
FOOD-MONITOR - Informationsdienst für Ernährung (2010): Richtig Spülen – keine
Chance für Bakterien [Online]. Available: http://www.food-
monitor.de/2010/02/richtig-spuelen-keine-chance-fuer-
bakterien/lebensmittel/ratgeber/ [Accessed 03/2011].
FORSA & RWI - Rheinisch-Westfälisches Wirtschaftsinstitut Essen (2005): The
German residential energy consumption survey 2005 [Online]. Available:
http://www.rwi-essen.de/media/content/pages/publikationen/rwi-
projektberichte/PB_Energieverbrauch-priv-HH-2005_Kurzfassung_E.pdf
[Accessed 03/2011].
FORUM WASCHEN (n.d.): Sechs goldene Regeln zum Spülen per Hand [Online].
Available: http://www.forum-waschen.de/e-trolley/page_8754/index.html
[Accessed 03/2011].
FUSS, N., BORNKESSEL, S., MATTERN, T. & STAMMINGER, R. (2011): Are resource
savings in manual dishwashing possible? Consumers applying Best Practice
Tips. International Journal of Consumer Studies, 35, 2, 194-200.
FUSS, N. & STAMMINGER, R. (2010): Manual dishwashing: how can it be optimized?
Tenside Surfactants Detergents, 5/2010, 342-348.
FUSS, N. & STAMMINGER, R. (2011a): Application of Best Practice Tips in manual
dishwashing - a comparison between Germany and Spain. International Journal
of Consumer Studies, to be published.
FUSS, N. & STAMMINGER, R. (2011b): Resource savings by training – how much can
be saved in manual dishwashing? Tenside Surfactants Detergents, to be
published.
90 REFERENCES
GELLER, E. S., ERICKSON, J. B. & BUTTRAM, B. A. (1983): Attempts to promote
residential water conservation with educational, behavioral and engineering
strategies. Population and Environment, 6, 2, 96-112.
GOLDSMITH, E. (2010): Resource management for individuals and families. Upper
Saddle River, New Jersey.
GOLDSMITH, E. B. & GOLDSMITH, R. E. (2011): Social influence and sustainability in
households. International Journal of Consumer Studies, 35, 2, 117-121.
GRØNHØJ, A. & THØGERSEN, J. (2011): Feedback on household electricity
consumption: learning and social influence processes. International Journal of
Consumer Studies, 35, 2, 138-145.
GUDD, R., KIONKA, U. & SCHMITZ-PLASKUDA, R. (1993): Versuchsbericht - Vergleich
der Wirtschaftlichkeit zwischen dem Handspülen und dem Spülen mit der
Geschirrspülmaschine. Rheinisch-Westfälisches Elektrizittswerk Ag - Bereich
Anwendungstechnik. Essen.
GUTZSCHEBAUCH, C., HÄRER, J., JESCHKE, P., SCHRÖDER, R. & ZAIKA, D. (1996):
Geschirrspülen von Hand und in der Maschine – ein Systemvergleich.
Hauswirtschaft und Wissenschaft, 2, 51-63.
HENKEL AG & CO. (n.d.): Tipps und Tricks - Wie spüle ich richtig? [Online].
Available: http://www.pril.de/tipps_tricks/5 [Accessed 03/2011].
KARP, D. G. (1996): Values and their effect on pro-environmental behavior.
Environment and Behavior, 28, 1, 111-133.
KUROWSKA, S. (2003): Sustainable consumption. International Journal of Consumer
Studies, 27, 3, 237-238.
LIFESPY - Analyzing Lifestyle (2011): Tips on washing dishes by hand [Online].
Available: http://www.lifespy.com/2011/tips-on-washing-dishes-by-hand-2/
[Accessed 03/2011].
REFERENCES 91
LUECKE, A. (1971): Hausfrauen im Wettstreit mit dem Geschirrspüler.
Haustechnischer Anzeiger, 2, 117-118.
MANITOBA (2011): Safe work tips for hand dishwashing [Online]. Available:
http://safemanitoba.com/uploads/factsheet_dishwashing2011.pdf [Accessed
03/2011].
N.N. (2007): Tips for washing dishes by hand [Online]. Available:
http://www.helium.com/items/373265-tips-for-washing-dishes-by-hand
[Accessed 03/2011].
N.N. (2008): La vaisselle à la main [Online]. Available: http://www.ecoconso.be/La-
vaisselle-a-la-main [Accessed 03/2011].
N.N. (2009a): Lavar platos de forma ecológica [Online]. Available:
http://www.ecologiablog.com/post/250/lavar-platos-de-forma-ecologica
[Accessed 03/2011].
N.N. (2009b): Lave-vaisselle ou lavage à la main? [Online]. Available:
http://www.mamanpourlavie.com/forum/sujet/lave-vaisselle-ou-lavage-a-la-
main [Accessed 03/2011].
N.N. (2009c): Trucos para hacer más liviano el fregar los platos. [Online]. Available:
http://www.reparando.es/consejos/trucos-para-hacer-mas-liviano-el-fregar-los-
platos/ [Accessed 03/2011].
N.N. (2010a): Como gastar menos agua lavando los platos [Online]. Available:
http://yollegoafindemes.carrefour.es/consejos/2010/02/02-como-gastar-menos-
agua-lavando-los-platos [Accessed 03/2011].
N.N. (2010b): Recovering the lost art of hand dishwashing (tips for when your
dishwasher is broken) [Online]. Available:
http://lifeasmom.com/2010/01/recovering-the-lost-art-of-hand-dishwashing-
tips-for-when-your-dishwasher-is-broken.html [Accessed 03/2011].
92 REFERENCES
N.N. (2010c): Secretos para limpiar los platos de forma eficiente [Online]. Available:
http://www.hogartotal.com/2010/02/18/secretos-para-limpiar-los-platos-de-
forma-eficiente/ [Accessed 03/2011].
N.N. (n.d.-a): "Das bisschen Haushalt..." - so erledigen Sie lästige Aufgaben schneller
[Online]. Available: http://www.kleinanzeigen-landesweit.de/cms/haushalt-
bewaeltigen.html [Accessed 03/2011].
N.N. (n.d.-b): Faire la vaisselle [Online]. Available: http://www.fairelavaisselle.com/
[Accessed 03/2011].
N.N. (n.d.-c): Geschirr spülen per Hand - aber richtig [Online]. Available:
http://www.kochen-essen-wohnen.de/geschirr-spuelen-per-hand.html [Accessed
03/2011].
NFSMI - National Food Service Management Institute (2009): Food safety fact sheet -
manual dishwashing [Online]. Available:
http://nfsmi.org/documentlibraryfiles/PDF/20091123115056.pdf [Accessed
03/2011].
OECD - Organisation for Economic Co-operation and Development (2002): Towards
sustainable household consumption? OECD Publishing.
OECD - Organisation for Economic Co-operation and Development (2008):
Environmental outlook to 2030.
OECD - Organisation for Economic Co-operation and Development (2011): Greening
household behaviour. OECD Publishing.
OEE - Office of Energy Efficiency Canada (2007): Survey of household energy use –
summary report [Online]. Available:
http://oee.nrcan.gc.ca/Publications/statistics/sheu07/pdf/sheu07.pdf [Accessed
02/2011].

REFERENCES 93
PETERSON, J. (2008): Five more eco friendly tips for washing dishes by hand [Online].
Available: http://planetgreen.discovery.com/home-garden/hand-washing-
dishes-tips.html [Accessed 03/2011].
PINTO, D. C., NIQUE, W. M., AÑAÑA, E. D. S. & HERTER, M. M. (2011): Green
consumer values: how do personal values influence environmentally
responsible water consumption? International Journal of Consumer Studies, 35,
2, 122-131.
PRIEBE, M. B. (n.d.): How to naturally clean your dishes [Online]. Available:
http://www.ecolife.com/green-home/cleaning/dishwashing-tips.html [Accessed
03/2011].
PROCTER & GAMBLE (n.d.): The dish on dishwashing. Dos and don‟ts for dish care.
[Online]. Available: http://dawn-dish.com/en_US/dishwashingtips/thedish.do
[Accessed 03/2011].
REICHMANN, T. (2008): Maximizing hand dishwashing efficiency in five easy steps
[Online]. Available: http://planetgreen.discovery.com/home-garden/efficient-
handwashing-dishes.html [Accessed 03/2011].
RICHTER, C. P. (2010a): Automatic dishwashers: efficient machines or less efficient
consumer habits? International Journal of Consumer Studies, 34, 2, 228-234.
RICHTER, C. P. (2010b): In-house consumer study on dishwashing habits in four
European countries: saving potentials in households with dishwashing machine.
Schriftenreihe der Haushaltstechnik Bonn, 2010/2.
RICHTER, C. P. (2011): Usage of dishwashers: observation of consumer habits in the
domestic environment. International Journal of Consumer Studies, 35, 2, 180-
186.
ROZIO (2008): Limpieza ecológica y económica. [Online]. Available:
http://www.marujasmodernas.es/category/se-ecologico/page/2/ [Accessed
03/2011].

94 REFERENCES
SAS INSTITUTE INC. (2009): JMP® 8.0 statistical software.
SELIGMAN, C. & DARLEY, J. M. (1976): Feedback as a means of decreasing residential
energy consumption. Journal of Applied Psychology, 62, 4, 363-368.
SHI, J., SCHEPER, W., SIVIK, M., JORDAN, G., BODET, J.-F. O. & SONG, B. (2005):
Dishwashing detergents for household applications. In: Showell, M. S. (ed.)
Handbook of detergents, part D. CRC Press.
SIEMENS-ELECTROGERÄTE GMBH (2010): Neuer Weltrekord im Wassersparen
[Online]. Available: http://www.siemens-
home.de/Files/SiemensNew/De/de/Press/PressRelease/ReleaseFiles/2_12-1354-
1008_Siemens%20ecoStar%206,5%20Liter.pdf [Accessed 05/2011].
STALL-MEADOWS, C. & HEBERT, P. R. (2011): The sustainable consumer: an in situ
study of residential lighting alternatives as influenced by infield education.
International Journal of Consumer Studies, 35, 2, 164-170.
STAMMINGER, R. (2006): Daten und Fakten zum Geschirrspülen mit der Hand und in
der Maschine. SÖFW-Journal, 3, 132.
STAMMINGER, R., ELSCHENBROICH, A., RUMMLER, B. & BROIL, G. (2007a): Washing-
up behaviour and techniques in Europe. Hauswirtschaft und Wissenschaft,
1/2007, 31-37.
STAMMINGER, R., RUMMLER, B., ELSCHENBROICH, A. & BROIL, G. (2007b):
Dishwashing under various consumer-relevant conditions. Haushalt und
Wissenschaft, 2, 81-88.
STAMMINGER, R. & STREICHARDT, C. (2009): Selected aspects of consumer behaviour
in the manual and mechanical dishwashing in Germany. SÖFW-Journal, 11,
50-56.
REFERENCES 95
TINOCO, D. (2008): Consejos prácticos para el ahorro de energía en el hogar [Online].
Available: http://www.quebec-venezuela.org/article.php3?id_article=199
[Accessed 03/2011].
UNEP - United Nations Environment Programme (2004): Freshwater in Europe. Facts,
figures and maps.
VIVAT (n.d.): De l'art de faire la vaisselle à la main... écolo [Online]. Available:
http://fr.vivat.be/chez-soi/article.asp?pageid=2776 [Accessed 03/2011].
WALLENBORN, G., ORSINI, M. & VANHAVERBEKE, J. (2011): Household appropriation
of electricity monitors. International Journal of Consumer Studies, 35, 2, 146-
152.
WESTFIELD, J. & RUIZ-PARDO, A. (2004): Typical consumer hand dishwashing
methods in selected countries. Unpublished data cited as per Shi et al. (2005).
WILHITE, H., NAKAGAMI, H., MASUDA, T., YAMAGA, Y. & HANEDA, H. (1996): A
cross-cultural analysis of household energy use behaviour in Japan and
Norway. Energy Policy, 24, 9, 795-803.
ZVEI - Zentralverband Elektrotechnik- und Elektronikindustrie e.V. (2011):
Zahlenspiegel 2011 des deutschen Elektro-Hausgerätemarktes [Online].
Available:
http://www.zvei.org/fachverbaende/elektro_haushalt_grossgeraete/publikatione
n/ [Accessed 04/2011].


LIST OF ABBREVIATIONS 97
List of abbreviations
°C degree Celsius
ACSD Association Canadienne de la Savonnerie et de la Détergence
AID Auswertungs- und Informationsdienst
BAFU Bundesamt für Umwelt Schweiz
BDEW Bundesverband der Energie- und Wasserwirtschaft in
Deutschland
BPT Best Practice Tips
Btu British thermal unit
C concentration of detergent
CECED European Committee of Domestic Equipment Manufacturers
CENELEC European Committee for Electrotechnical Standardisation
cm centimetre
DOE U.S. Department of Energy Use
DW dishwasher
e.g. exempli gratia (for example)
EDB everyday behaviour
EEA European Environment Agency
EIA U.S. Energy Information Administration
EN European Norm
et al. et altera (and others)
EU European
g gram
i.e. id est (that is to say)
IEA International Energy Agency
IFHE International Federation for Home Economics
K Kelvin
kJ kilojoule
kg kilogram

98 LIST OF ABBREVIATIONS
kWh kilowatt hour
L litre
min minute
mL millilitre
n.d. not dated
N.N. nomen nescio (author unkown)
OECD Organisation for Economic Co-operation and Development
OEE Office of Energy Efficiency Canada
p. page
PP pizza plate
PS place setting
resp. respectively
RWI Rheinisch-Westfälisches Wirtschaftsinstitut Essen
s second
U.K. United Kingdom
U.S. United States
w/o without
w with
WCMWB water changes in main washing bath
WCRB water changes in rinsing bath
Wh Watt hour
ZVEI Zentralverband Elektrotechnik- und Elektronikindustrie e.V.

LIST OF FIGURES 99
List of figures
Figure 1-1: Water consumption per capita and day of some European countries .......... 3
Figure 1-2: Allocation of the daily water consumption – average data from Switzerland
......................................................................................................................................... 4
Figure 1-3: Allocation of the daily water consumption – average data from Germany . 4
Figure 1-4: Energy use in U.S. households .................................................................... 5
Figure 3-1: Pizza plate with five soil types................................................................... 24
Figure 3-2: Work station for washing up experiments ................................................. 25
Figure 3-3: Average cleaning performances of experiments testing repeatability ....... 29
Figure 3-4: Plot of single effects with maximised desirability ..................................... 33
Figure 3-5: Cleaning performance in dependence of C and WCRB ............................ 34
Figure 3-6: Cleaning performance in dependence of WCRB and C ............................ 34
Figure 4-1: Arithmetic averages and standard deviation of the water consumption .... 42
Figure 4-2: Arithmetic averages and standard deviation of the energy consumption .. 42
Figure 4-3: Arithmetic averages and standard deviation of the detergent consumption
....................................................................................................................................... 43
Figure 4-4: Arithmetic averages and standard deviation of the time taken .................. 43
Figure 4-5: Arithmetic averages and standard deviation of the cleaning performance 43
Figure 4-6: Rating of the Best Practice Tips................................................................. 45
Figure 4-7: Probable application of the Best Practice Tips in the everyday life .......... 46
Figure 5-1: Water consumption, average and standard deviation as assessed in the
EDB studies and the BPT study. ................................................................................... 53
Figure 5-2: Energy consumption, average and standard deviation as assessed in the
EDB studies and the BPT study. ................................................................................... 54
Figure 5-3: Detergent consumption, average and standard deviation as assessed in the
EDB studies and the BPT study. ................................................................................... 54
Figure 5-4: Cleaning performance, average and standard deviation as assessed in the
EDB studies and the BPT study. ................................................................................... 55
Figure 5-5: Evaluation questionnaire – general rating of the Best Practice Tips ......... 56
100 LIST OF FIGURES
Figure 5-6: Evaluation questionnaire – rating of the individual tips of the Best Practice
Tips ............................................................................................................................... 57
Figure 6-1: Overview on the test procedure ................................................................. 62
Figure 6-2: General data on the samples ...................................................................... 64
Figure 6-3: Scheme of the installed measuring instruments ......................................... 65
Figure 6-4: Deviation of the real flow in dependency of the measured flow speed ..... 67
Figure 6-5: Arithmetic average and standard deviation of the water consumption in 14
days ............................................................................................................................... 68
Figure 6-6: Arithmetic average and standard deviation of the energy consumption in
14 days .......................................................................................................................... 68
Figure 6-7: Arithmetic average and standard deviation of the detergent consumption in
14 days .......................................................................................................................... 68
Figure 6-8: Arithmetic average and standard deviation of the time taken in 14 days .. 69
Figure 6-9: Arithmetic average and standard deviation of the number of items in 14
days ............................................................................................................................... 69
Figure 6-10: Arithmetic average and standard deviation of the water consumption per
item ............................................................................................................................... 70
Figure 6-11: Arithmetic average and standard deviation of the energy consumption per
item ............................................................................................................................... 70
Figure 6-12: Arithmetic average and standard deviation of the detergent consumption
per item ......................................................................................................................... 70
Figure 6-13: Arithmetic average and standard deviation of the time taken per item ... 70
Figure 6-14: Comparison of the resource consumption per item of the single
households ..................................................................................................................... 71
Figure 6-15: Rating of the Best Practice Tips in general .............................................. 73
Figure 6-16: Rating of the single tips of the Best Practice ........................................... 74

LIST OF TABLES 101
List of tables
Table 1-1: Typical consumer hand dishwashing methods in selected countries .......... 15
Table 1-2: Gathering of dishwashing tips in the World Wide Web ............................. 15
Table 3-1: Factors and factor levels for repeatability experiments .............................. 27
Table 3-2: Factors and factor levels for investigation of impact factors ...................... 28
Table 3-3: Results of the Kruskal-Wallis-H test ........................................................... 29
Table 3-4: Average cleaning performances of experiments investigating impact factors
....................................................................................................................................... 30
Table 3-5: Data of the regression model ....................................................................... 31
Table 4-1: Best Practice Tips ........................................................................................ 38
Table 4-2: Overview of the studies and parts of the studies ......................................... 39
Table 5-1: Overview on the number of test persons in the different studies ................ 50
Table 6-1: Results of the statistical analysis ................................................................. 72
Table 6-2: Average consumption data of the “enormous water consumer” ................. 75
Table 6-3: Average consumption data of the “few item consumer” ............................ 76
Table 6-4: Average water consumption per item in households with and without
dishwasher ..................................................................................................................... 79


Acknowledgements
An dieser Stelle möchte ich allen danken, die in irgendeiner Weise zum Gelingen
meiner Arbeit beigetragen haben.
Insbesondere danke ich Herrn Prof. Dr. Rainer Stamminger für die Betreuung als
Doktorvater, die Unterstützung und Anregungen, die meine Arbeit zum Ziel gebracht
haben.
Mein Dank geht auch an Herrn Prof. Dr. Michael Burkhard Piorkowsky für das
Interesse am Thema Handgeschirrspülen und für die Übernahme des Zweitgutachtens.
Bei dem gesamten Team der Sektion Haushaltstechnik möchte ich mich herzlich
bedanken für die fachlichen Diskussionen und die ständige Hilfsbereitschaft.
Ich danke Sabine Bornkessel, Thomas Mattern, Clara Janczak, Olga Reger und
Myrjam Dobesch, die durch ihre Mitarbeit zur Entwicklung der Arbeit beigetragen
haben, ebenso wie Susanne Humsch für den Beitrag zu meiner Arbeit im Rahmen ihrer
Diplomarbeit.
Ein ganz besonderes Dankeschön haben sich meine Mutter, Anke Kruschwitz und
Claudia Gilleßen verdient, denen keine Mühe zuviel war, und die die Arbeit intensiv
Korrektur gelesen haben.
Anton Berg, Walter Petriwski, Wilfried Berchtold, Roland Lutz und Dr. Gereon Broil
danke ich für die Entwicklung und Unterstützung der technischen Ausrüstung.
Mein Dank geht auch an Procter & Gamble, den finanziellen Sponsor dieses Projektes.
Nicht zuletzt möchte ich meiner Familie danken, die mir im Hintergrund stets
Rückhalt gegeben und somit ganz entscheidend zum Gelingen dieser Arbeit
beigetragen hat. Ihr habt immer ein offenes Ohr für mich gehabt, mich in jeglicher
Hinsicht bedingungslos unterstützt und wart bei Bedarf immer für mich da.
Zum Schluss möchte ich meiner Schwester Julia ein besonderes Dankeschön
schenken. Du hast mir nicht nur durch deine fachliche Mitarbeit und als Übersetzerin
in Spanien geholfen, sondern auch meine Veröffentlichungen und meine Dissertation
unermüdlich Korrektur gelesen. Zudem warst du in jeder Phase der Arbeit meine
moralische Stütze.