Determination Analysis of Energy Conservation Standards ... · LBNL-50040 Determination Analysis of...
64
LBNL-50040 Determination Analysis of Energy Conservation Standards for Small Electric Motors S. Meyers, J. McMahon, M. McNeil, L. Dale Final Draft for Public Comment April, 2002 Prepared for the Office of Building Technology U.S. Department of Energy Prepared by Environmental Energy Technologies Division Lawrence Berkeley National Laboratory University of California Berkeley, CA 94720 This work was supported by the Assistant Secretary for Energy Efficiency and Renewable Energy, Office of Building Technologies of the U.S. Department of Energy under Contract No. DE-AC03-76SF00098.
Transcript of Determination Analysis of Energy Conservation Standards ... · LBNL-50040 Determination Analysis of...
LBNL-50040
Determination Analysis of Energy Conservation Standardsfor Small Electric Motors
S. Meyers, J. McMahon, M. McNeil, L. Dale
Final Draft for Public Comment
April, 2002
Prepared for the Office of Building Technology
U.S. Department of Energy
Prepared byEnvironmental Energy Technologies Division
Lawrence Berkeley National LaboratoryUniversity of California
Berkeley, CA 94720
This work was supported by the Assistant Secretary for Energy Efficiency and Renewable Energy, Office ofBuilding Technologies of the U.S. Department of Energy under Contract No. DE-AC03-76SF00098.

iii
TABLE OF CONTENTS
ABBREVIATIONS AND ACRONYMS . . . . . . . . . . . . . . . . . . . . . . . . . . . . . . . . . . . . . . . . . viiACKNOWLEDGMENTS . . . . . . . . . . . . . . . . . . . . . . . . . . . . . . . . . . . . . . . . . . . . . . . . . . . . . viiiEXECUTIVE SUMMARY . . . . . . . . . . . . . . . . . . . . . . . . . . . . . . . . . . . . . . . . . . . . . . . . . . . . . ix
1. INTRODUCTION . . . . . . . . . . . . . . . . . . . . . . . . . . . . . . . . . . . . . . . . . . . . . . . . . . . . . . . 11.1 Background . . . . . . . . . . . . . . . . . . . . . . . . . . . . . . . . . . . . . . . . . . . . . . . . . . . . . . 11.2 Overview of Considered Small Motors . . . . . . . . . . . . . . . . . . . . . . . . . . . . . . . . . 11.3 Applications for Considered Small Motors . . . . . . . . . . . . . . . . . . . . . . . . . . . . . . 3
2. GENERAL CHARACTERIZATION OF SMALL ELECTRIC MOTORS . . . . . . . . . . . 52.1 Three-phase Squirrel Cage Induction Motors . . . . . . . . . . . . . . . . . . . . . . . . . . . . 52.2 Single-phase Squirrel Cage Induction Motors . . . . . . . . . . . . . . . . . . . . . . . . . . . . 62.3 Energy Efficiency: Basic Considerations . . . . . . . . . . . . . . . . . . . . . . . . . . . . . . . 7
3. THE MARKET FOR CONSIDERED SMALL MOTORS . . . . . . . . . . . . . . . . . . . . . . . . 93.1 Annual Shipments . . . . . . . . . . . . . . . . . . . . . . . . . . . . . . . . . . . . . . . . . . . . . . . . . 93.2 Features of Considered Small Motors . . . . . . . . . . . . . . . . . . . . . . . . . . . . . . . . . . 93.3 Range of Energy Efficiencies . . . . . . . . . . . . . . . . . . . . . . . . . . . . . . . . . . . . . . . 123.4 Market Structure and Actors . . . . . . . . . . . . . . . . . . . . . . . . . . . . . . . . . . . . . . . . 133.5 Motor Purchasing . . . . . . . . . . . . . . . . . . . . . . . . . . . . . . . . . . . . . . . . . . . . . . . . . 16
4. ENGINEERING ANALYSIS OF DESIGN OPTIONS TOIMPROVE EFFICIENCY OF CONSIDERED SMALL MOTORS . . . . . . . . . . . . . . . . 184.1 Approach . . . . . . . . . . . . . . . . . . . . . . . . . . . . . . . . . . . . . . . . . . . . . . . . . . . . . . . 184.2 Efficiency and Cost Impacts of Design Options . . . . . . . . . . . . . . . . . . . . . . . . . 214.3 Issues to Consider . . . . . . . . . . . . . . . . . . . . . . . . . . . . . . . . . . . . . . . . . . . . . . . . 25
5. LIFE-CYCLE COST ANALYSIS OF DESIGN OPTIONS TOIMPROVE EFFICIENCY OF SMALL MOTORS . . . . . . . . . . . . . . . . . . . . . . . . . . . . . 275.1 Method and Data . . . . . . . . . . . . . . . . . . . . . . . . . . . . . . . . . . . . . . . . . . . . . . . . . 275.2 Results for Capacitor Start-Induction Run Motor Options . . . . . . . . . . . . . . . . . 305.3 Results for Polyphase Motor Options . . . . . . . . . . . . . . . . . . . . . . . . . . . . . . . . . 33
6. POTENTIAL NATIONAL ENERGY AND CONSUMER IMPACTS OF ENERGYCONSERVATION STANDARDS FOR SMALL MOTORS . . . . . . . . . . . . . . . . . . . . . 356.1 Method . . . . . . . . . . . . . . . . . . . . . . . . . . . . . . . . . . . . . . . . . . . . . . . . . . . . . . . . . 356.2 Estimates of Potential Energy and Consumer Impacts . . . . . . . . . . . . . . . . . . . . 37
7. CONCLUSION . . . . . . . . . . . . . . . . . . . . . . . . . . . . . . . . . . . . . . . . . . . . . . . . . . . . . . . . 41

iv
APPENDIX A INFORMATION COLLECTION PROCESS ON USE OF SMALLMOTORS . . . . . . . . . . . . . . . . . . . . . . . . . . . . . . . . . . . . . . . . . . . . . . . . . 42
APPENDIX B METHOD FOR ESTIMATING CONSIDERED SMALL MOTORSSHIPMENTS BY INDUSTRY SECTOR . . . . . . . . . . . . . . . . . . . . . . . . 44
APPENDIX C SMALL MOTORS DISCOUNT RATE CALCULATIONS . . . . . . . . . 46
v
LIST OF FIGURES
Figure ES-1 Cumulative Primary Energy Savings and Net Present Value of Energy Efficiency Improvement for Capacitor Start Motors, Based on LBNL Engineering Calculations . . . . . . . . . . . . . . . . . . . . . . . . . . . . . . . . . . . . . . . . . . xiv
Figure ES-2 Cumulative Primary Energy Savings and Net Present Value of Energy Efficiency Improvement for Capacitor Start Motors, Based on ManufacturerEngineering Calculations . . . . . . . . . . . . . . . . . . . . . . . . . . . . . . . . . . . . . . . . . . . xv
Figure ES-3 Cumulative Primary Energy Savings and Net Present Value of Energy Efficiency Improvement for Small Polyphase Motors, Based on LBNLEngineering Calculations . . . . . . . . . . . . . . . . . . . . . . . . . . . . . . . . . . . . . . . . . . xvi
Figure 1-1 Total Domestic Shipments of Fractional Horsepower Motors in 1999 . . . . . . . . . 2Figure 3-1 Capacitor Start-IR Motors – Shipments in 2000 . . . . . . . . . . . . . . . . . . . . . . . . . 10Figure 3-2 Small 3-Phase Motors – Shipments in 2000 . . . . . . . . . . . . . . . . . . . . . . . . . . . . 11Figure 3-3 Listed Efficiency (full load) of Small Motor Models . . . . . . . . . . . . . . . . . . . . . 13Figure 4-1 Increase in Efficiency and Cost from Steel Grade Change, Capacitor
Start 1/2 hp, NEMA Data . . . . . . . . . . . . . . . . . . . . . . . . . . . . . . . . . . . . . . . . . . 20Figure 6-1 Capacitor Start Motors, National Energy and Consumer Impacts,
LBNL Analysis . . . . . . . . . . . . . . . . . . . . . . . . . . . . . . . . . . . . . . . . . . . . . . . . . . 38Figure 6-2 Capacitor Start Motors, National Energy and Consumer Impacts,
NEMA Data . . . . . . . . . . . . . . . . . . . . . . . . . . . . . . . . . . . . . . . . . . . . . . . . . . . . . 39Figure 6-3 Polyphase Motors, National Energy and Consumer Impacts, LBNL Analysis . . 40

vi
LIST OF TABLES
Table 1-1 Major Applications for Considered Small Motors . . . . . . . . . . . . . . . . . . . . . . . . 3Table 3-1 Leading Manufacturers of Considered Small Motors Sold in the U.S. . . . . . . . . 14Table 3-2 Average Utilization Characteristics for General Purpose Small Motors by
Type of Application . . . . . . . . . . . . . . . . . . . . . . . . . . . . . . . . . . . . . . . . . . . . . . . 15Table 3-3 Estimated Annual Shipments of General Purpose Small Motors by Type of
Application . . . . . . . . . . . . . . . . . . . . . . . . . . . . . . . . . . . . . . . . . . . . . . . . . . . . . . 16Table 4-1 Electrical Steel Options Considered . . . . . . . . . . . . . . . . . . . . . . . . . . . . . . . . . . 19Table 5.1 Impacts of Efficiency Improvement on Typical End User, Capacitor
Start 1/2 hp LBNL $6K . . . . . . . . . . . . . . . . . . . . . . . . . . . . . . . . . . . . . . . . . . . . 31Table 5.2 Impacts of Efficiency Improvement on Typical End User, Capacitor
Start 1/2 hp, NEMA Data . . . . . . . . . . . . . . . . . . . . . . . . . . . . . . . . . . . . . . . . . . 32Table 5.3 Impacts of Efficiency Improvement on Typical End User,
Polyphase 1 hp, LBNL Data . . . . . . . . . . . . . . . . . . . . . . . . . . . . . . . . . . . . . . . . 33Table 5.4 Impacts of Efficiency Improvement on Typical End User, Capacitor
Start 1/2 hp, NEMA Data . . . . . . . . . . . . . . . . . . . . . . . . . . . . . . . . . . . . . . . . . . 34

vii
ABBREVIATIONS AND ACRONYMS
CSCR capacitor start-capacitor run
CSIR capacitor start-induction run
EPAct Energy Policy Act of 1992
EPCA Energy Policy and Conservation Act
hp Horsepower
LBNL Lawrence Berkeley National Laboratory
LCC Life-cycle cost
HVAC Heating, ventilation, and air conditioning
NEMA National Electrical Manufacturers Association
NPV Net present value
ODP Open dripproof
OEMs Original equipment manufacturers
SMMA Small Motors and Motion Association
viii
ACKNOWLEDGMENTS
A number of individuals contributed to this study.
Austin Bonnett performed the engineering cost analysis for LBNL and provided invaluableexpertise for the study.
Easton Consultants, led by Gordon Canning, conducted market research on the utilization andshipments of the considered motors by application.
Arthur D. Little, Inc, led by Michael Rivest, assembled data on considered motors from motormanufacturers.
We are grateful for the cooperation of NEMA and SMMA in this study. They organized aworking group with representatives of a number of motor manufacturers. This group,coordinated by Robert Wisbey, provided valuable data to the study. In addition, NEMA providedimportant data on recent industry shipments of various categories of the considered motors.
The DOE program manager for this work, Jim Raba, provided strong support and advicethroughout the process.
At LBNL, Steve Greenberg provided technical expertise on motors. Xiaomin Liu assisted withsome of the spreadsheets and prepared some of the figures. Diana Morris and Karen Olsonhelped with report production.

ix
EXECUTIVE SUMMARY
Section 346(b)(1) of the Energy Policy and Conservation Act (EPCA), 42 U.S.C. 6317(b)(1),directs the Department of Energy (DOE or Department) to determine whether energyconservation standards for certain small electric motors would be technologically feasible,economically justified, and would result in significant energy savings. The purpose of thisanalysis is to provide a technical and economic basis for the Department’s determination.
Under section 340(13)(F) of EPCA, 42 U.S.C. 6311(13)(F), the term “small electric motor”means a National Electrical Manufacturers Association (NEMA) general purpose alternatingcurrent single-speed induction motor, built in a two-digit frame number series in accordance withNEMA Standards Publication MG1-1987, “Motors and Generators.” The two-digit frame seriesencompasses NEMA frame series 42, 48 and 56. The horsepower ratings for the two-digit frameseries range from 1/4 to 3 hp (hp), operate at 60 Hertz, and could be single-phase or three-phaseelectrical design (also known as “polyphase”).
Typical applications for such small electric motors include pumps, fans and blowers,woodworking machinery, conveyors, air compressors, commercial laundry equipment, serviceindustry machines, food processing machines, farm machinery, machine tools, packagingmachinery, and major residential and commercial equipment.
Section 346(b)(3) of EPCA, 42 U.S.C. 6317(b)3 also states that a standard prescribed for smallelectric motors shall not apply to any small electric motor that is a component of a coveredproduct under section 332(a) of EPCA or covered equipment under section 340. Such coveredproducts and equipment that contain small electric motors include residential air conditionersand heat pumps, furnaces, refrigerators and freezers, clothes washers and dryers, anddishwashers; and commercial package air conditioning and heating equipment, packagedterminal air conditioners and heat pumps, and warm air furnaces.
As a result of the above definition and exclusions, small electric motors covered by EPCA onlycomprise about 4 percent of the total population of small electric motors. Nevertheless, thesemotors, which we identify here as “considered small motors,” account for a major portion of theenergy consumed by the total population of small motors because of their size and use.
NEMA Standards Publication MG1 establishes performance standards, such as torque, forgeneral purpose small electric motors. Among single-phase two-digit frame motors, onlycapacitor start motors, including both capacitor start-induction run (CSIR) and capacitor start-capacitor run (CSCR), can meet the torque requirements for NEMA general purpose motors. Among three-phase small motors, only non-servo motors can meet the NEMA performancerequirements for general purpose motors.
Single-phase motors in two-digit frame sizes range from 1/4 hp through 1 hp. Three-phasemotors in a two-digit frame size range from 1/4 hp through 3 hp, although most are 1 hp or less.

1The term “fractional” generally refers to a motor that is 1 hp or less, depending upon speed and frame size.
x
A 4-pole small electric motor, which rotates at 1800 rpm, is the most common design for single-and three-phase small motors.
THE MARKET FOR CONSIDERED SMALL MOTORS
The historic trend in annual shipments of considered small motors is not clear. Data from theU.S. Census Bureau show little growth in the 1990s, but these data only include motors producedin the United States. Confidential data on two-digit frame size fractional1 horsepower motorsales to domestic customers by NEMA member manufacturers, covering the period from 1971 to2001, show an average annual growth rate of 1.5 percent. Polyphase and capacitor start single-phase motors comprise approximately 20 percent of the motors covered by these data.
A joint NEMA/Small Motor and Motion Association (SMMA) survey of domestic sales incalendar year 2000 of considered small motors estimated sales of 5.4 million units for CSIR and1.3 million units for polyphase motors. The CSIR motors accounted for approximately 95percent of total shipments of capacitor start motors. Given the low level of shipments andinherent energy efficiency of CSCR motors, the Department decided to not consider them forfurther analysis.
Open motors account for 93 percent of total CSIR shipments. The most common size categories(with roughly equal shipments) are 1/3, 1/2, and 3/4 hp, with the average size being 1/2 hp. Enclosed polyphase motors account for two-thirds of total polyphase small motor shipments,reflecting the greater use of such motors in industrial environments. Of these, the largest salescategories are 3/4 and 1 hp, with the average size being 1 hp. For each type and size ofconsidered small motor, there is a range of rated energy efficiencies on the market.
There are between five and ten companies that produce significant quantities of the consideredsmall motors. Approximately two-thirds of the considered small motors are sold to originalequipment manufacturers (OEMs), who incorporate them into larger pieces of equipment, suchas pumps and HVAC equipment. If the motor wears out, the user will typically replace thatmotor with the same model, which effectively means that practically all motor purpose decisionsare made by the OEMs. For most of the OEM equipment studied in this analysis, energyefficiency is not a high priority to an OEM in the selection of motors. OEMs report that theircustomers do not request more efficient motors, and are more concerned with first cost thansmall reductions in operating cost.
The diversity of applications for small motors poses challenges to accurately characterizingtypical small motor usage patterns. Based on considerable market research conducted for thisstudy, the estimated typical annual hours of use ranges from 800 hours for air and gascompressors to 5000 hours for industrial/commercial fans and blowers. Many of the values arein the 2000-3000 hours range, and the estimated shipment-weighted average is 2500 hours for

xi
both capacitor start and polyphase motors. Motor loading is commonly in the 60-70 percentrange.
ENGINEERING ANALYSIS OF DESIGN OPTIONS
The most practical ways to adjust motor performance to achieve increased efficiency for theconsidered small motors are changing (1) the grade of electrical steel, (2) the stack length, or(3) the flux density by adjusting the effective turns or changing the thickness of the steel. Thethird option is only done at severe expense to the production process, so we did not analyze it inthis study.
We did not analyze optimizing winding design and the quantity of wire used. With respect towinding, although there are optimum flux densities and torque-per-ampere characteristics thatwill yield the best efficiencies, the gains may be at the expense of other performancecharacteristics. With respect to wire, increased slot fill and proper end-turn configurations willresult in fewer losses, but there are physical limitations as to how much wire can be inserted intoa slot automatically. Hand insertion, which is an option in larger motors, is not practical forsmall motors.
For each product class of small motor, we selected several popular models to analyze the effectsof change in the grade of electrical steel and stack length. The analysis only considered the costchanges associated with the active material. These materials include the electrical steel, copperwinding and aluminum rotor bar/end ring. The active material costs were calculated based upontypical costs when purchased in volume. Labor and burden were not considered.
This methodology is quite commonly used by the motor industry (with some slight variations)for an initial cost estimate of the impact of design change. It is based on the assumption thatlabor costs are a very small part of the total cost for motors of this type where extensiveautomation is employed. If the design change prevents the normal processes from being used,this method is less accurate. Other costs can be broken into fixed burden and variable burden.For this study we assumed that the fixed portion is not affected, and that the variable portion isabsorbed by large volume runs and, hence, is not included in the analysis.
In addition to the analysis described above, we asked a working group of motor manufacturersestablished by NEMA and SMMA to provide comparable data. The results, provided by fourmanufacturers, show considerable variability. Although details were not given, we believe thateach manufacturer used somewhat different methods and assumptions concerning efficiency andcost changes.

xii
LIFE-CYCLE COST ANALYSIS OF DESIGN OPTIONS
To assess the impact on end users of designs that improve motor efficiency, we conducted ananalysis that compared the additional up-front cost to the value of electricity savings over the lifeof a motor. We used a mean lifetime of seven years for capacitor start motors and nine years forpolyphase motors. To value electricity savings, we used recent DOE projections of averageindustrial and commercial electricity prices, and a discount rate of 7 percent based on theweighted average cost of capital for representative end users.
In the case of capacitor start motors, the Lawrence Berkeley National Laboratory (LBNL)analysis shows that improvements to energy efficiency using any steel grade design option havelower life-cycle cost (LCC) than the base motor. However, the NEMA average data forimprovements in steel grade design show an increase in LCC for these motors. The LBNLanalysis shows that changes in stack length would increase the LCC. The NEMA data show aslight decrease for one design option and an increase for the others.
The difference in the life-cycle cost for the two design options, steel grade and stack length,reflects the situations of different manufacturers. Some are able to improve efficiency at lowercost by changing the grade of steel, while others can do so by changing the stack length.
In the case of polyphase motors, the LBNL analysis shows that all the steel grade options havelower LCC than the base motor, but the NEMA average results show increased LCC. In both theLBNL and NEMA analyses, changes in the stack length design options increase the LCC relativeto the base motors.
POTENTIAL NATIONAL ENERGY AND CONSUMER IMPACTS OF ENERGYCONSERVATION STANDARDS FOR SMALL MOTORS
In each product class, we used the average size (1/2 hp for CSIR and 1 hp for polyphase) motoras the basis for the estimation of national impacts. We assumed standards would take effect in2010, and calculated impacts for motors sold within the 2010-2030 time period. We estimatedimpacts for two scenarios of average annual growth in shipments from 2010 to 2030 of 1 percentand 1.5 percent. The accounting model calculated total end-use electricity savings in each yearwith surviving motors (some motors sold in 2030 could operate through 2040). The model used aproduct retirement function to calculate the number of units of a given vintage which would stillbe in operation in a given year.
For assessing direct economic impacts on end users, we used the incremental equipment costs foreach energy efficiency improvement level in the engineering analysis. We assumed that thecurrent estimated incremental costs would remain the same in the 2010-2030 time period ofmotor sales.

xiii
Creating a base case — what might occur to small motor efficiency in the future in the absenceof any standards — is perhaps the most difficult element of the analysis. The perspective of theNEMA/SMMA working group and other motor industry experts we consulted is that the past 20-30 years have seen “very little to moderate” improvement in efficiency. Some gains in energyefficiency to medium (1 through 500 hp) electric motors occurred in the 1970s when electricityprices increased, and consequently there were some spillover improvements to efficiency insmall motors. A number of manufacturers have introduced “premium efficiency” smallpolyphase motors. In the case of capacitor-start motors, there has been some growth in the use ofmore efficient capacitor-run models, which to some extent had reduced the need to improve themore common induction-run models.
Current expectations for future commercial and industrial electricity prices show a slightdeclining trend in the long run, which suggests that customer interest in efficiency of smallmotors may continue to be limited. It seems reasonable that a lower bound case for futureefficiency would envision very little improvement, while an upper bound case would envisionmoderate gains. In the Low Efficiency Improvement base case, the average efficiency of motorssold in the 2010-2030 period is 1/4 point better than the current base case motors. In theModerate Efficiency Improvement base case, the average efficiency is 1 point better than thecurrent base case motors. In both cases, we assume that there would be gradual efficiencyimprovement over that period of time.
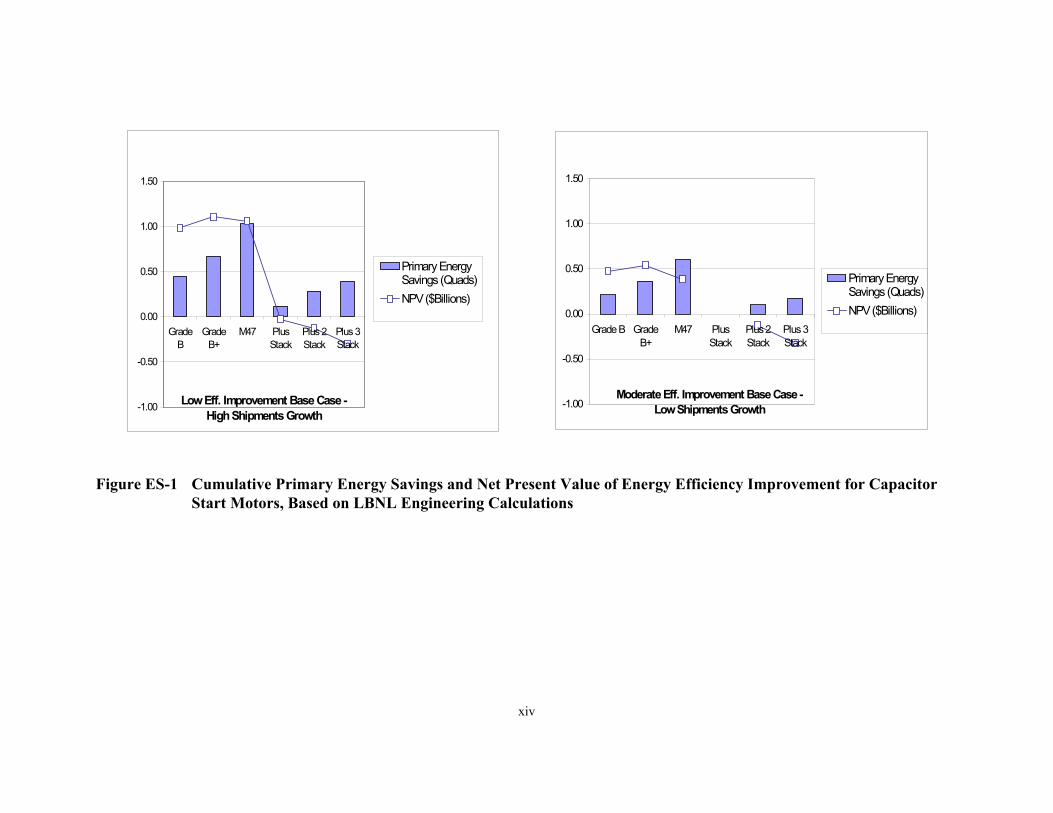
In the case of capacitor start motors, the cumulative energy savings for options with positive netpresent value (NPV), based on the LBNL analysis of steel grade change, ranges from a low of0.6 quad to a high of 1 quad (Figure ES-1). The corresponding cumulative NPV range in dollarsis from $0.6 billion to just over $1 billion. None of the stack change options have positive NPV.
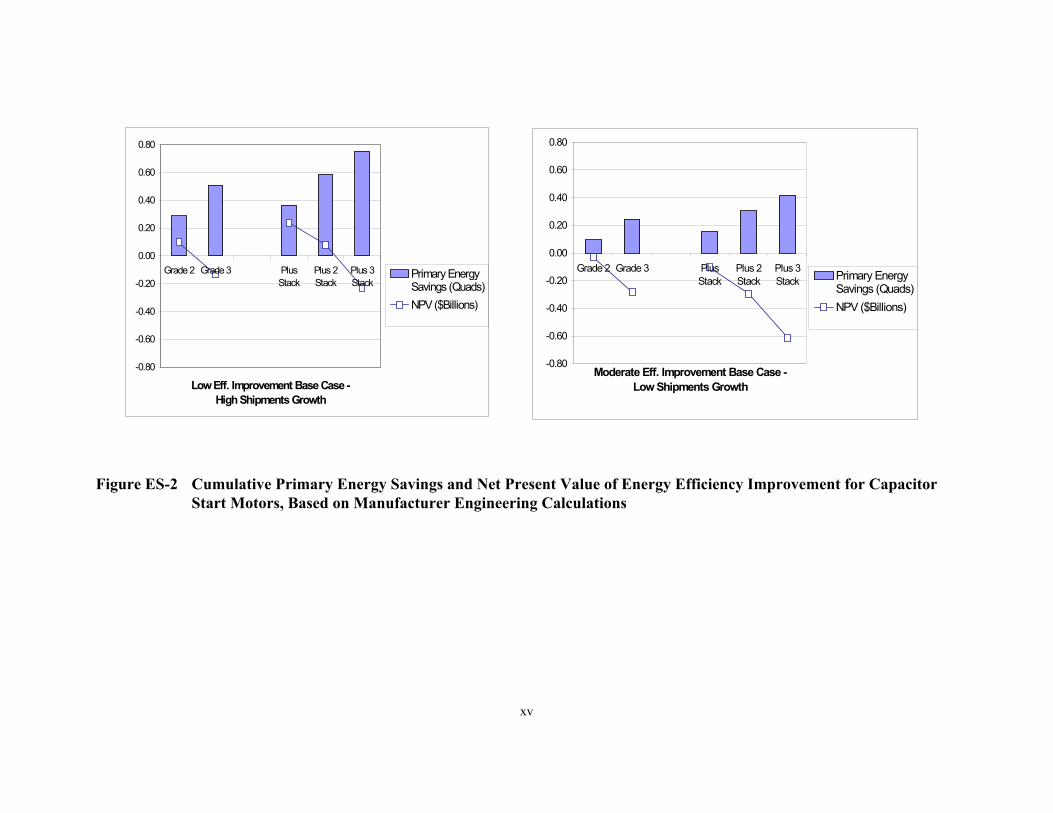
Using the NEMA average data, we see positive NPV only in a few instances (Figure ES-2). Inthe most favorable case (Low Efficiency Improvement base case, High Shipments Growth), thereare savings of 0.6 quad with an NPV of just under $0.1 billion (plus 2 stack option).
In the case of polyphase motors, the LBNL analysis shows cumulative energy savings from steelgrade change ranging from a low of 0.15 quad to a high of 0.21 quad (Figure ES-3). Thecorresponding cumulative NPV range in dollars is from $0.09 billion to $0.27 billion. The stackchange options generally do not show positive NPV. Use of the NEMA average data wouldshow lower savings than the above.
It seems likely that the potential energy savings and economic impact from energy efficiencyimprovement for small motors lie somewhere between the LBNL and NEMA/SMMA estimates.Additional technical and market share information would facilitate evaluation of data submittedby individual manufacturers.
xiv
-1.00
-0.50
0.00
0.50
1.00
1.50
GradeB
GradeB+
M47 PlusStack
Plus 2Stack
Plus 3Stack
Low Eff. Improvement Base Case - High Shipments Growth
Primary EnergySavings (Quads)NPV ($Billions)
-1.00
-0.50
0.00
0.50
1.00
1.50
Grade B GradeB+
M47 PlusStack
Plus 2Stack
Plus 3Stack
Moderate Eff. Improvement Base Case - Low Shipments Growth
Primary EnergySavings (Quads)NPV ($Billions)
Figure ES-1 Cumulative Primary Energy Savings and Net Present Value of Energy Efficiency Improvement for CapacitorStart Motors, Based on LBNL Engineering Calculations
xv
-0.80
-0.60
-0.40
-0.20
0.00
0.20
0.40
0.60
0.80
Grade 2 Grade 3 PlusStack
Plus 2Stack
Plus 3Stack
Low Eff. Improvement Base Case - High Shipments Growth
Primary EnergySavings (Quads)NPV ($Billions)
-0.80
-0.60
-0.40
-0.20
0.00
0.20
0.40
0.60
0.80
Grade 2 Grade 3 PlusStack
Plus 2Stack
Plus 3Stack
Moderate Eff. Improvement Base Case - Low Shipments Growth
Primary EnergySavings (Quads)NPV ($Billions)
Figure ES-2 Cumulative Primary Energy Savings and Net Present Value of Energy Efficiency Improvement for CapacitorStart Motors, Based on Manufacturer Engineering Calculations

xvi
-0.30
-0.20
-0.10
0.00
0.10
0.20
0.30
0.40
GradeB+
M47 PlusStack
Plus 2Stack
Plus 3Stack
Low Eff. Improvement Base Case - High Shipments Growth
Primary EnergySavings (Quads)
NPV ($Billions)
-0.30
-0.20
-0.10
0.00
0.10
0.20
0.30
0.40
GradeB+
M47 PlusStack
Plus 2Stack
Plus 3Stack
Moderate Eff. Improvement Base Case - Low Shipments Growth
Primary EnergySavings (Quads)NPV ($Billions)
Figure ES-3 Cumulative Primary Energy Savings and Net Present Value of Energy Efficiency Improvement for SmallPolyphase Motors, Based on LBNL Engineering Calculations

1
1. INTRODUCTION
1.1 Background
Subtitle B, Sect. 124, of the Energy Policy Act of 1992, Pub. L. 102-486 (EPAct) contains anamendment to Sect. 346 of the Energy Policy and Conservation Act (EPCA) (42 U.S.C Sect.6317) that requires the U.S. Department of Energy (DOE) to assess the feasibility of energyconservation standards for small electric motors. The objective of this study was to determinewhether energy conservation standards for small electric motors would be technically feasible,be economically justified, and have the potential for significant energy savings.
EPAct defines a “small electric motor” as “a National Electrical Manufacturer Association(NEMA) general purpose alternating current (AC) single-speed induction motor, built in a two-digit frame number series in accordance with NEMA Standards Publication MG1-1987.” Thisrefers mainly to NEMA frame sizes 42, 48, and 56, and includes motors that range in size from1/4 to 2 hp. It includes single-phase and three-phase (polyphase) motors.
EPAct also states that any standard prescribed for small electric motors shall not apply to anymotor that is a component of a covered product under section 332(a) of EPCA or a coveredequipment under section 340. Such covered products and equipment that contain small motorsinclude residential air conditioners and heat pumps, furnaces, refrigerators and freezers, clotheswashers and dryers, and dishwashers; and commercial package air conditioning and heatingequipment, packaged terminal air conditioners and heat pumps, and warm air furnaces.
The result of the above definition and exclusions is that the motors that fall under Sect. 124 ofEPAct are a small subset of the total population of fractional horsepower motors (see nextsection). However, such motors, which we refer to as “considered small motors,” account for adisproportionate share of the energy use by all small motors due to their greater size andutilization compared with other small motors.
1.2 Overview of Considered Small Motors
A key issue in determining exactly which motors fall under Sect. 124 of EPAct is defining whatis meant by “general purpose.” EPAct does not define the term “general purpose motor,” thoughtit does define the terms “definite purpose motor” and “special purpose motor.” However, theNEMA Standards Publication MG1 establishes various performance requirements for generalpurpose motors. Minimum levels for breakdown and locked rotor torque for general purposesmall electric motors are presented in MG1 Part 12.32.
Among single-phase two-digit motors, shaded pole, permanent split capacitor, and split phasemotors do not meet the torque requirements of NEMA general purpose motors. Capacitor startmotors, including both capacitor start-induction run (CSIR) and capacitor start-capacitor run

2
Small Motor Shipments, 1999
Perm anent split capacitor
25%
Capacitor s tart3%
Other s ingle phase10%
Skeleton type shaded pole
17%Split phase
5%
Other polyphase
1%
Conventional type shaded
pole39%
(CSCR), can provide the torque requirements for NEMA general purpose motors. Other single-phase motors such as universal, drip-proof, and series AC are designed for definite or special-purpose applications.
The CSCR motor is not interchangeable with the CSIR motor in most cases because ofdifferences in size and starting torque. The addition of a second running capacitor to the motorchanges the dimensional envelope of the motor but not the frame size. In this analysis, weconsider the CSIR and CSCR motors as separate product classes. Although not interchangeablefor all applications, there may be some applications for which the CSCR offers a high efficiencyalternative to a CSIR motor.
Among polyphase small motors, synchronous stepper motors cannot provide the torquerequirements of NEMA general purpose motors, while polyphase servo motors are for definite-purpose applications. Polyphase non-servo motors do meet the NEMA requirements for generalpurpose motors.
The small electric motors that meet the EPAct definition fall into three product classes:
· Single-phase capacitor start-induction run motors· Single-phase capacitor start-capacitor run motors· Polyphase (non-servo) motors
These classes accounted for close to 4% of total domestic shipments of fractional horsepowermotors in 1999 (Figure 1-1).
Figure 1-1 Total Domestic Shipments of Fractional Horsepower Motors in 1999
Source: US Census Bureau, Current Industrial Reports, Motors and Generators -- MA335H
3
Not all capacitor start and polyphase non-servo motors are NEMA general purpose motors.Those in the “definite-purpose” category include many motors used for fans and blowers andspecific types of pumps.
1.3 Applications for Considered Small Motors
The applications for considered small motors are listed below.
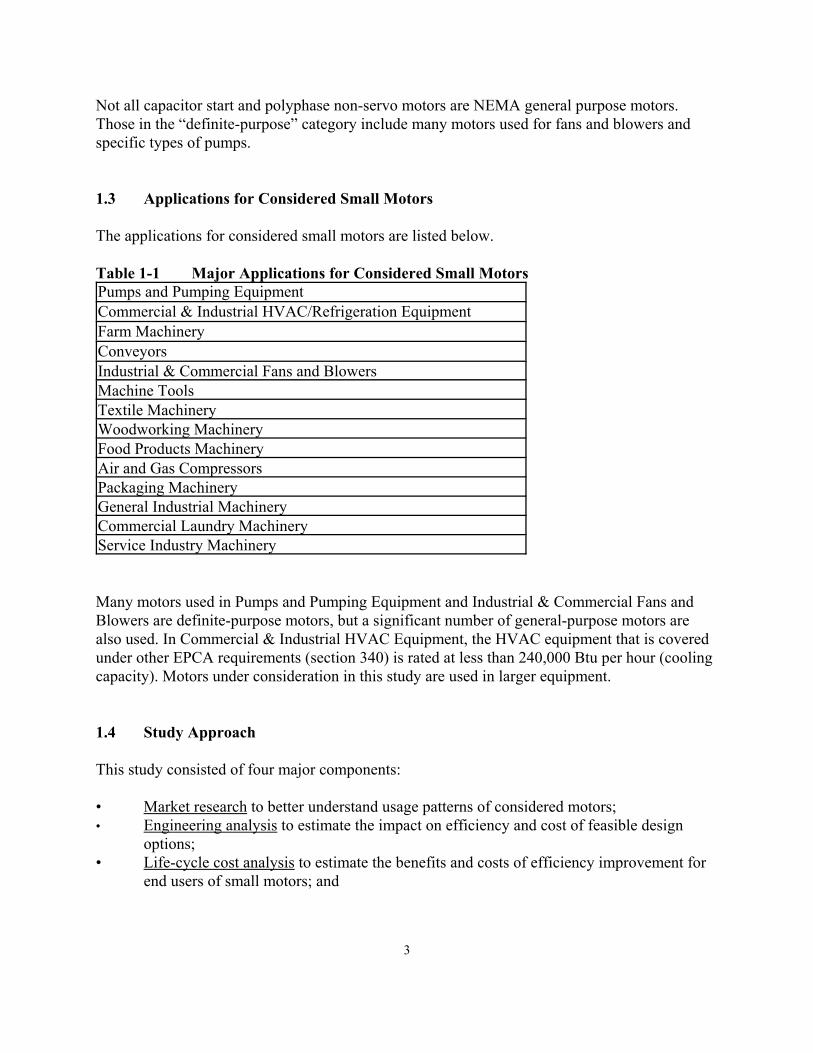
Table 1-1 Major Applications for Considered Small MotorsPumps and Pumping EquipmentCommercial & Industrial HVAC/Refrigeration EquipmentFarm MachineryConveyorsIndustrial & Commercial Fans and BlowersMachine Tools Textile Machinery Woodworking Machinery Food Products Machinery Air and Gas Compressors Packaging Machinery General Industrial Machinery Commercial Laundry Machinery Service Industry Machinery
Many motors used in Pumps and Pumping Equipment and Industrial & Commercial Fans andBlowers are definite-purpose motors, but a significant number of general-purpose motors arealso used. In Commercial & Industrial HVAC Equipment, the HVAC equipment that is coveredunder other EPCA requirements (section 340) is rated at less than 240,000 Btu per hour (coolingcapacity). Motors under consideration in this study are used in larger equipment.
1.4 Study Approach
This study consisted of four major components:
• Market research to better understand usage patterns of considered motors;• Engineering analysis to estimate the impact on efficiency and cost of feasible design
options;• Life-cycle cost analysis to estimate the benefits and costs of efficiency improvement for
end users of small motors; and

4
• National energy savings analysis to estimate the potential national energy savings fromefficiency improvement of considered motors.
• National consumer impacts analysis to estimate the potential direct economic costs andbenefits resulting from efficiency improvement of considered motors.
The methods and data sources used are discussed in the relevant chapters.

5
2. GENERAL CHARACTERIZATION OF SMALL ELECTRIC MOTORS
2.1 Three-phase Squirrel Cage Induction Motors
Three-phase squirrel cage induction motors are used as the prime mover for the majority ofcommercial and industrial sector motor applications requiring over a few horsepower, and inmany smaller applications as well.
The typical three-phase induction motor employs a wound stator and a "squirrel cage" rotor. Magnetic force acting between the stator and rotor units produces motor torque. The statorconsists of a hollow cylindrical core formed by a stack of thin steel laminations. Insulatedcopper windings are assembled into slots formed about the inner circumference of the core.Stator winding carries current through one slot and then back though a companion slot locatedapproximately one pole pitch distant from the first. For a 2-pole motor, the pole pitch is half thecircle while for 4 or 6 pole machines it is one quarter or one sixth of the circle, respectively.
The rotor unit consists of a laminated steel core press fitted to the steel shaft. Like the stator, therotor core also has windings set into slots but these are deployed about its outer circumference. Moreover, in the squirrel-cage rotor configuration the rotor windings consist of solid conductorbars that are interconnected at either end with solid-conductor end rings. Absent the laminatedsteel core this assembly of bars and end rings would look like a “squirrel cage” and hence thenomenclature for this very robust and cost-effective construction.
When the stator windings are energized by a 3-phase electrical source, a radially directedmagnetic flux is established in the “air gap” between the rotor and the stator. This flux rotates ata speed determined by the electrical frequency and number of poles given by the stator-windingconfiguration. For example with 60 Hz excitation and a 2 pole (or 1 pole-pair) winding the fluxrotates at a so-called “synchronous” speed of 60 revolutions per second (rps) or 3,600revolutions per minute (rpm). The flux produced by the energized stator windings envelops therotor cage bars and due to its motion induces current to flow in these conductors. The interactionof the rotating stator flux and the rotor bar currents develops motor drive torque.
Important characteristics of the three-phase squirrel cage induction motor are simplicity andruggedness, inherently high starting torque (without the start-assisting devices required forsingle-phase motors), and the potential to achieve high efficiency. Compared with larger motors,the efficiency of small (1 hp and below) three-phase induction motors declines rapidly as theload drops below 70% of rated load.
Polyphase motors in a two-digit NEMA frame size range from 1/4 hp to 3 hp, though themajority are 1 hp or less. They are available in 2, 4, or 6 pole configurations (corresponding tospeeds of 3500, 1750, or 1150 rpm, respectively). A 4-pole configuration is the most common.

6
2.2 Single-phase Squirrel Cage Induction Motors
The basic principal of operation of a single-phase squirrel-cage induction motor is similar to a 3-phase induction motor. A rotating magnetic field is easily established with three-phaseexcitation of motor windings as described in the preceding subsection. In a single-phaseinduction motor two counter-rotating fields are produced which develop equal and opposite rotortorque components when the motor is at standstill. However, if means are provided to urgerotation in one direction or the other, net torque will be developed to sustain the rotation anddrive the attached load. While the electromagnetic torque acting on the rotor of a three-phasemotor is relatively smooth and free from pulsating disturbances, this is not the case in the single-phase motor. In this instance, the torque may pulsate from zero to a maximum value at twice thepower line frequency—e.g., 120 Hz. In most applications, this is of little consequence as theinertia of the motor and the driven load act to smooth out the torque pulsations.
The basic construction of the single-phase induction motor includes a rotor and stator; each builtup of a stack of electromagnetic grade steel laminations as previously described for the three-phase motor. The "squirrel cage" rotor has a series of aluminum bars cast lengthwise into therotor laminations. These bars are connected with rings located at each end of the stack. Thestator laminations contain a series of slots for the windings that are aluminum or copper wire. Two sets of windings are provided, at a 90°-phase difference. The “main” or “run” windingoperates directly from line current, and stays always energized as long as the motor is running.
Single phase motors are categorized according to the way the “start and run,” “secondary”, or“auxiliary” winding is utilized for starting the motor and then running it at normal speed. Widelyused single-phase motor categories are:
• The Split-Phase or Resistance Start/Induction Run Motor -- This configuration is thelowest cost. The start winding has a higher resistance-to-reactance ratio than the mainwinding achieved by using a relatively small diameter wire. This reduces both theamount and the cost of the copper in the start winding and the space taken up in the statorslots by this winding.
• The Capacitor Start/Induction Run (CSIR) Motor -- This configuration is a relatively lowefficiency motor that provides higher starting torque than the split-phase motor.
• The Permanent Split Capacitor (PSC) Motor -- This configuration has a high potentialefficiency depending on the design.
• The Capacitor Start/Capacitor Run (CSCR) Motor -- This is an efficient runconfiguration with a large capacitance at start-up providing a large starting torque. Thestart capacitance is typically 3 - 5 times the size of the run capacitor, but can be packagedcompactly, because continuous operation (and the resulting heat dissipation) is not aconsideration.
Split phase and CSIR motors use the secondary winding for starting only; the capacitor startversion provides higher starting torque. The secondary winding uses a much smaller diameterwire energized for a limited time without overheating and automatically disconnected after start
7
up by a centrifugal switch. In PSC and CSCR motors, the secondary winding continues operatingwhen the motor is running. The capacitor in series with this winding shifts the phase of the inputvoltage approximately 90°, so the two windings together create a rotating magnetic field. Thebenefits achieved by PSC and CSCR motors are the suppression of torque pulsations and theimproved utilization of both the windings and the iron in the motor. These benefits increase theefficiency and the power factor of the motor, but at an added cost associated with the capacitor.
Single-phase motors in a two-digit NEMA frame size range from 1/4 hp to 1 hp and are availablein 2, 4, or 6 pole configurations. A 4-pole configuration is the most common.
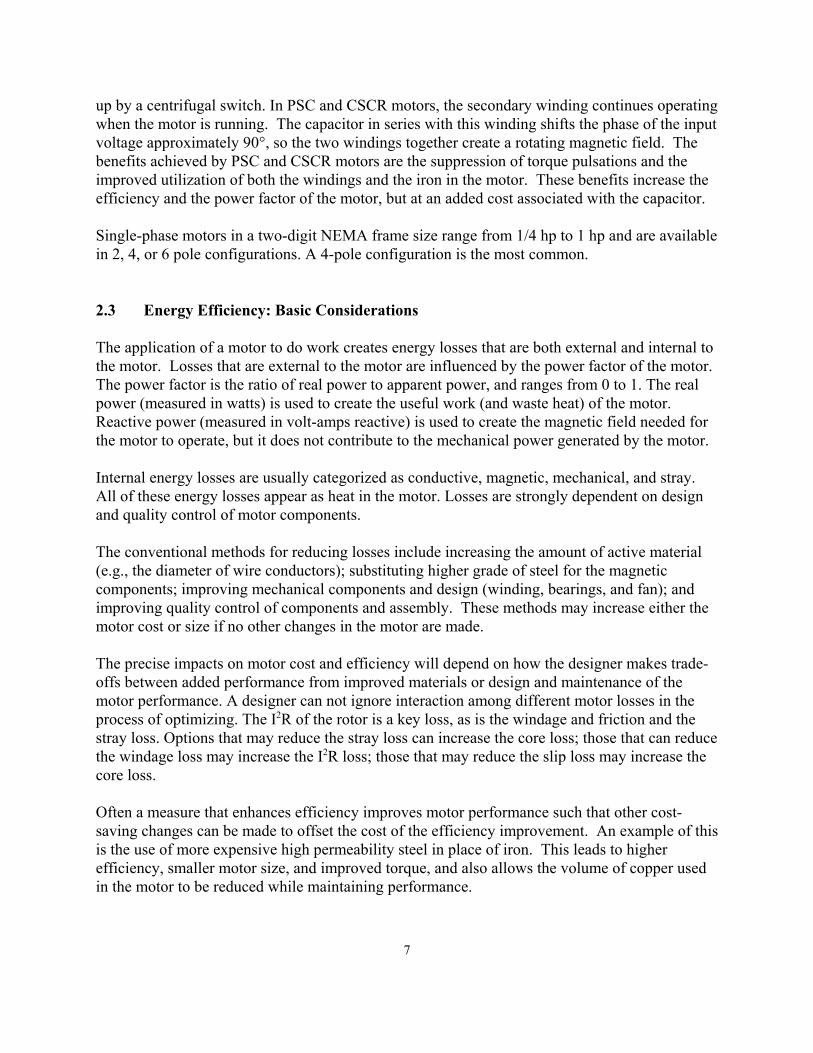
2.3 Energy Efficiency: Basic Considerations
The application of a motor to do work creates energy losses that are both external and internal tothe motor. Losses that are external to the motor are influenced by the power factor of the motor.The power factor is the ratio of real power to apparent power, and ranges from 0 to 1. The realpower (measured in watts) is used to create the useful work (and waste heat) of the motor. Reactive power (measured in volt-amps reactive) is used to create the magnetic field needed forthe motor to operate, but it does not contribute to the mechanical power generated by the motor.
Internal energy losses are usually categorized as conductive, magnetic, mechanical, and stray. All of these energy losses appear as heat in the motor. Losses are strongly dependent on designand quality control of motor components.
The conventional methods for reducing losses include increasing the amount of active material(e.g., the diameter of wire conductors); substituting higher grade of steel for the magneticcomponents; improving mechanical components and design (winding, bearings, and fan); andimproving quality control of components and assembly. These methods may increase either themotor cost or size if no other changes in the motor are made.
The precise impacts on motor cost and efficiency will depend on how the designer makes trade-offs between added performance from improved materials or design and maintenance of themotor performance. A designer can not ignore interaction among different motor losses in theprocess of optimizing. The I2R of the rotor is a key loss, as is the windage and friction and thestray loss. Options that may reduce the stray loss can increase the core loss; those that can reducethe windage loss may increase the I2R loss; those that may reduce the slip loss may increase thecore loss.
Often a measure that enhances efficiency improves motor performance such that other cost-saving changes can be made to offset the cost of the efficiency improvement. An example of thisis the use of more expensive high permeability steel in place of iron. This leads to higherefficiency, smaller motor size, and improved torque, and also allows the volume of copper usedin the motor to be reduced while maintaining performance.

8
Various component additions to a single-phase motor are known to improve the efficiency whileincreasing the cost and usually changing the motor’s dimensions. Adding an auxiliary windingwith a capacitor, adding an auxiliary winding with a starting capacitor and switch, or adding anauxiliary winding with starting capacitor, switch, and running capacitor to a single-phase motorcan reduce energy losses, increase torque, and improve the power factor. The additional windingmay be continuously energized as in the CSCR motor, or disconnected with a centrifugal switchas is often done in the CSIR motor. The CSCR motor has a switch added in series with thestarting capacitor and adds a second running capacitor in parallel to the starting capacitor that isnot switched out of the circuit after starting. The auxiliary winding and running capacitor of theCSCR motor contribute to motor output, allowing it to approach the efficiency of a polyphasemotor. The efficiency increase of the CSCR motor over the CSIR motor ranges from about 5%to about 24% (EPRI, 1987).
REFERENCES
Electric Power Research Institute, 1987. Optimization of Induction Motor Efficiency, Vol. 2:Single-Phase Induction Motors. EPRI EL-2152.

2 US Census Bureau, Current Industrial Reports, Motors and Generators -- MA335H. We have included all single-phase motors, 1 hp and over, with capacitor start motors.
3 The shares of 2- and 6-pole motors are estimated values, as complete data were lacking.
9
3. THE MARKET FOR CONSIDERED SMALL MOTORS
3.1 Annual Shipments
The historic trend in annual shipments of considered small motors is uncertain. Data from theU.S. Census Bureau2 show little growth in the 1990s, but these data only include motorsproduced in the U.S.
NEMA provided confidential data on two-digit frame size fractional horsepower motor sales todomestic customers by NEMA manufacturers, covering the period from 1971 to 2001. Aftersmoothing the data, the average annual growth rate is 1.5%. Unfortunately, the three-phase andcapacitor start motors being analyzed make up only around 20% of the motors covered by thesedata.
A joint NEMA/SMMA survey of U.S. sales of considered small motors in 2000 estimated valuesof 5.4 and 1.3 million for capacitor start-induction run (CSIR) and polyphase motors,respectively. CSIR motors accounted for approx. 95% of total shipments of capacitor startmotors.
3.2 Features of Considered Small Motors
The basic features of considered small motors sold in 2000 (according to the NEMA/SMMAsurvey) are shown in Figures 3-1 and 3-2.
Open motors account for 93% of total CSIR shipments. The most important size categories (withroughly equal shares) are 1/3, 1/2, and 3/4 hp. The average size is 1/2 hp. Four-pole motorsaccount for a somewhat higher share than two- and six-pole motors.3
For polyphase motors, enclosed motors account for two-thirds of total shipments, reflecting thegreater use of such motors in industrial environments. The largest sales categories are 3/4 and 1hp. The average size is 1 hp. Four-pole motors account for two-thirds of the total.

10
Open vs. Enclosed
Open
Enclosed7%
Number of Poles
2-Pole30%
4-Pole40%
6-Pole30%
Horsepower
1/4 HP17%
1/3 HP29%
1/2HP26%
3/4 HP22%
1 HP5%
>1 HP1%
Figure 3-1 Capacitor Start-IR Motors – Shipments in 2000
Source: NEMA/SMMA survey

11
Open vs. Enclosed
Open34%
Enclosed66%
Number of Poles
2-Pole17%
6-Pole17%
4-Pole66%
Horsepower
1/4 HP3%
1/3 HP8%
1/2 HP15%
3/4 HP26%
1 HP23%
1 1/2 HP16%
2 & 3 HP9%
Figure 3-2 Small 3-Phase Motors – Shipments in 2000
Source: NEMA/SMMA survey

12
3.3 Range of Energy Efficiencies
We assembled data from manufacturer catalogs on the listed nominal full-load efficiency andother features of over 700 different models (A.D. Little, 2001). While these data provide anapproximate picture of the spread of efficiencies on the market, two caveats bear mention. First,the reported efficiencies are not precisely comparable among different manufacturers, since theyare not all based on the same test procedure. Second, many of the models likely have a low salesvolume, so looking at the spread of the data may not give an accurate portrait of what is actuallybeing sold.
Figure 3-3 shows the full-load efficiency vs. the nominal horsepower of capacitor start and three-phase motors in a popular design. Generally speaking, larger motors have higher efficiency thansmaller motors in a given class. For open, 4-pole capacitor start motors, the efficiency range isgreater for 3/4 hp motors than for 1/3 and 1/2 hp motors. Some of the highest-efficiency motorsin the >1 hp sizes are capacitor start-capacitor run motors. For three-phase motors, there is also asignificant range in efficiency.
The range of efficiencies for a given type and size is likely due in part to different methods oftesting among the manufacturers. Differences in specific features also play a role.

13
Capacitor Start Motors: Open, 4 Pole
45
50
55
60
65
70
75
80
85
0 1/2 1 1 1/2 2
Horsepower
Eff
icie
ncy
Polyphase Motors: Enclosed, 4 Pole
50
55
60
65
70
75
80
85
0 1/2 1 1 1/2 2
Horsepower
Eff
icie
ncy
Figure 3-3 Listed Efficiency (full load) of Small Motor Models
Source: A.D. Little (2001)
3.4 Market Structure and Actors
Based on expert judgement, we estimate the sales channels for considered small motors asfollows:
Motor Manufacturers Original Equipment Manufacturers (OEMs) 40%Motor Manufacturers Distributors OEMs 25%Motor Manufacturers Distributors End Users 35%
The latter are motors sold to end users as replacements or spares.
A high percentage of considered small motors sold in the U.S. are domestically manufactured. Inaddition to imported stand-alone motors, some considered small motors are imported ascomponents of equipment built in other countries. The magnitude of such imports is difficult to
14
determine.
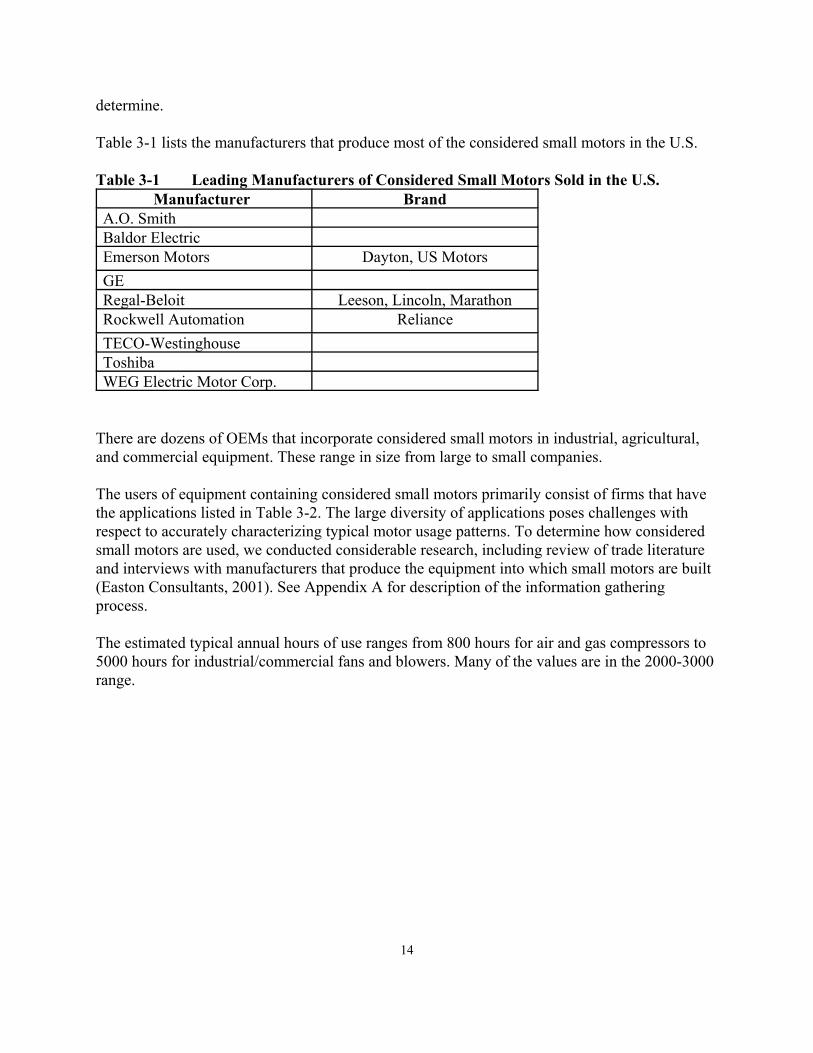
Table 3-1 lists the manufacturers that produce most of the considered small motors in the U.S.
Table 3-1 Leading Manufacturers of Considered Small Motors Sold in the U.S.Manufacturer Brand
A.O. SmithBaldor ElectricEmerson Motors Dayton, US MotorsGERegal-Beloit Leeson, Lincoln, MarathonRockwell Automation RelianceTECO-Westinghouse ToshibaWEG Electric Motor Corp.
There are dozens of OEMs that incorporate considered small motors in industrial, agricultural,and commercial equipment. These range in size from large to small companies.
The users of equipment containing considered small motors primarily consist of firms that havethe applications listed in Table 3-2. The large diversity of applications poses challenges withrespect to accurately characterizing typical motor usage patterns. To determine how consideredsmall motors are used, we conducted considerable research, including review of trade literatureand interviews with manufacturers that produce the equipment into which small motors are built(Easton Consultants, 2001). See Appendix A for description of the information gatheringprocess.
The estimated typical annual hours of use ranges from 800 hours for air and gas compressors to5000 hours for industrial/commercial fans and blowers. Many of the values are in the 2000-3000range.

15
Table 3-2 Average Utilization Characteristics for General Purpose Small Motors byType of Application
Application Hours/year
Motor loading(% of rated)
Farm Machinery 1000 70%
Conveyors 3000 50%
Machine Tools 2000 60%
Textile Machinery 3000 70%
Woodworking Machinery 2000 35%
Food Machinery 3000 60%
Pumps and Pumping Equipment 3000 65%
Air and Gas Compressors 800 85%
Industrial/Commercial Fans and Blowers 5000 80%
Packaging Machinery 3000 60%
General Industrial Machinery 2000 n/a
Commercial Laundry Machinery 2000 60%
Commercial and Industrial HVAC/Refrigeration Equipment 2500 60%
Service Industry Macinery 1500 n/aSource: Easton Consultants (2001)
We also investigated typical motor loading practices. The motor loading is commonly in the 60-70% range, though it is higher in two cases.
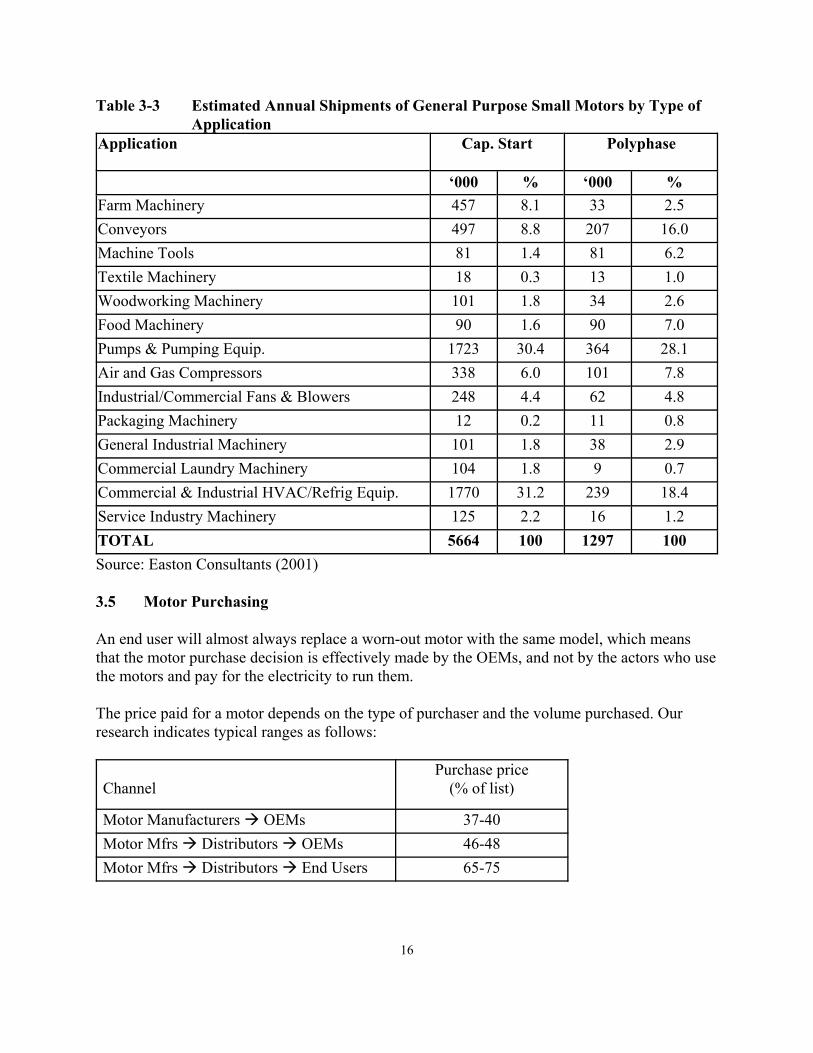
To assess the relative importance of different application categories, we estimated the magnitudeof annual shipments of considered small motors to each group (see Appendix B for method.)Motors used in pumps & pumping equipment and in commercial & industrialHVAC/refrigeration equipment each account for approximately 30% of total shipments forcapacitor start motors. No other category accounts for more than 10%. Motors used in pumps &pumping equipment are the largest category for polyphase motors, followed by commercial &industrial HVAC/Refrigation equipment and conveyors.
16
Table 3-3 Estimated Annual Shipments of General Purpose Small Motors by Type ofApplication
Application Cap. Start Polyphase
‘000 % ‘000 %Farm Machinery 457 8.1 33 2.5Conveyors 497 8.8 207 16.0Machine Tools 81 1.4 81 6.2Textile Machinery 18 0.3 13 1.0Woodworking Machinery 101 1.8 34 2.6Food Machinery 90 1.6 90 7.0Pumps & Pumping Equip. 1723 30.4 364 28.1Air and Gas Compressors 338 6.0 101 7.8Industrial/Commercial Fans & Blowers 248 4.4 62 4.8Packaging Machinery 12 0.2 11 0.8General Industrial Machinery 101 1.8 38 2.9Commercial Laundry Machinery 104 1.8 9 0.7Commercial & Industrial HVAC/Refrig Equip. 1770 31.2 239 18.4Service Industry Machinery 125 2.2 16 1.2TOTAL 5664 100 1297 100Source: Easton Consultants (2001)
3.5 Motor Purchasing
An end user will almost always replace a worn-out motor with the same model, which meansthat the motor purchase decision is effectively made by the OEMs, and not by the actors who usethe motors and pay for the electricity to run them.
The price paid for a motor depends on the type of purchaser and the volume purchased. Ourresearch indicates typical ranges as follows:
ChannelPurchase price
(% of list)
Motor Manufacturers OEMs 37-40Motor Mfrs Distributors OEMs 46-48Motor Mfrs Distributors End Users 65-75
17
Our interviews with OEMs inquired about their attitudes towards motor energy efficiency. Mostof the OEMs took a view of motor efficiency that can be summarized as follows:
1. Efficiency is not a high priority in selection of motors for most of the equipment studied. The respondents characteristically stated that they have not given much attention tomotor efficiency in this size range primarily because their customers do not request moreefficient motors, and are more concerned with first cost than small reductions inoperating cost.
2. Somewhat more interest in energy efficiency was shown in some industrial categories --conveyors, food products machinery, industrial pumps, and packaging equipment -- thanothers. Relatively more interest in energy efficiency in general was expressed in theseindustries where hours of operation are longer and the end-user customer is a moresophisticated cost-sensitive operator. These categories in total represented about 40% oftwo digit motors. (The response from the HVAC category was mixed with some OEMrespondents quite interested in greater efficiency, others not.)
3. In several instances some interest was shown in total motor system efficiency,particularly adjustable speed drives. There is wide recognition that energy can be savedwith the installation of adjustable-speed drives and other devices to control motorsystems, and considerable interest was shown, particularly in HVAC fans and industrialpumps.
Many of the product designers noted that there are few premium-efficient two-digit motorsavailable. They stated that even if an OEM wanted to use a more efficient motor it would bedifficult because motor manufacturers offer very few premium-efficient motors in these framesizes. In the case of several manufacturers of single-phase motors, the CSCR motors aredesignated “premium efficient” in contrast to CSIR motors. However, the former are not alwaysphysically interchangeable with a CSIR motor.
REFERENCES
Arthur D. Little, 2001. Small motor database (Prepared for this study).
Easton Consultants, 2001. Analysis of considered motors use by principal machinery categories(Prepared for this study).

18
4. ENGINEERING ANALYSIS OF DESIGN OPTIONS TOIMPROVE EFFICIENCY OF CONSIDERED SMALL MOTORS
4.1 Approach
The most practical ways to adjust motor performance to achieve increased efficiency for theconsidered small motors are: (1) change the grade of electrical steel, (2) change the stack length,(3) change the flux density by adjusting the effective turns or changing the thickness of the steel.The latter option is only done at severe expense to the production process, so we did not analyzeit in this study.
We did not analyze optimizing of winding and wire. With respect to winding, although there areoptimum flux densities and torque per amp characteristics that will yield the best efficiencies, thegains may be at the expense of other performance characteristics. With respect to wire, increasedslot fill and proper end turn configurations will yield less I2R losses, but there are limitations asto how much wire can be inserted automatically. Hand insertion, which is an option in largermotors, is not practical for fractional motors.
For each product class, we selected several popular models to analyze. We engaged a recentlyretired engineering executive from the motor industry (Austin Bonnett) to conduct the analysis.The testing of the sample motors was done with the dynamic reaction torque procedure with acontrolled acceleration cycle using a d.c. drive motor. In three seconds 2000 data points werecollected that characterized the motor performance. Loss segregation was then achieved throughcomputer modeling and correlation. The influence of temperature was not included in thisevaluation.
We conducted separate analyses of change in the grade of electrical steel and change in the stacklength. The electrical steel options considered are shown in Table 4-1 (see section below fordiscussion of the motor manufacturers’ analysis). For stack change, the options consideredinvolve incremental increases of 0.25 inch with respect to the sample motors.
Note: In this chapter, the term “Capacitor Start” refers to capacitor start motors with inductionrun.

19
Table 4-1 Electrical Steel Options Considered
Grade Type*Maximum Loss
(watts/lb @15kg, 60 hz)
Thickness(inch)
LBNL Analysis
Grade A Cold rolled 4.51 0.031
Grade B Cold rolled 4.15 0.031
Grade A+ Cold rolled 4.04 0.025
Grade B+ Cold rolled 2.78 0.022
M47 Semi-processedelectrical
1.53 0.019
Manufacturers’ Analysis
Grade 1 Cold rolled 0.026-0.031
Grade 2 Cold rolled 0.022-0.025
Grade 3 Semi-processedelectrical
0.018-0.022
* Semi-processed steel with full anneal after punching
The efficiency change for each design package was calculated using the traditional motorperformance program based on equivalent circuit analysis, which is used by most motormanufacturers. The model used for this program does not take into account the losses associatedwith motor heating. Hence, the stator and rotor are assumed to be at ambient temperature. TheI2R losses are understated due to a lower resistance being used in the calculations. The effectcould be overstatement of motor efficiency in the 0.25-0.75 load range. However, therelationship among various design options will be accurate.
Costing Changes in Design
Our analysis only considered the active material cost changes. These materials include theelectrical steel, copper winding and aluminum rotor bar/end ring. The active material costs werecalculated based upon typical costs when purchased in volume. No other materials wereincluded. Labor and burden were ignored. The impact on set-up time and the introduction of newpart numbers were also not considered.

20
0.9
1.0
1.1
1.2
1.3
1.4
1.5
53%
55%
57%
59%
61%
63%
65%
67%
69%Efficie n cy
Uni
t Cos
t
Com pany A
Com pany B
Com pany C
Com pany D
Four Com panyAverage
The Base motor in each case was given a “per-unit” (PU) cost of 1. All active material changesare related to the PU cost of 1. If a change in electrical steel represented a 10% change in thetotal active material cost, for example, the PU number would be 1.10 for the new design.
This methodology is quite commonly used by the motor industry (with some slight variations)for an initial cost estimate of the impact of design changes. It is based on the assumption thatlabor costs are a very small part of the total cost for motors of this type where extensiveautomation is employed. Of course, if the design change prevents the normal processes frombeing used, this method is less accurate. Other costs can be broken into fixed burden and variableburden. For this study it is assumed that the fixed portion is not effected, and that the variableportion is absorbed based on large volume runs, and hence is not included in the analysis.
Analysis Submitted by Motor Manufacturers
In addition to the analysis described above, we asked a working group of motor manufacturersestablished by NEMA and SMMA to provide comparable data. The results, provided by fourmanufacturers, show considerable variability (Figure 4-1). Each manufacturer selected a typicalmotor to use as the “base motor.” We believe that each manufacturer used somewhat differentmethods and assumptions concerning efficiency and cost changes. Furthermore, the precise steelgrades considered varied, so the data are presented in terms of Grades 1, 2, and 3 (see Table 4-1).
Figure 4-1 Increase in Efficiency and Cost from Steel Grade Change, Capacitor Start1/2 hp, NEMA Data*
* Cost for Companies A, B and D includes capital for new production tooling
For steel grade options, the “NEMA” data in the tables below refer to the average values of thefour submissions. For stack change options, the NEMA/SMMA working group provided datathat they considered most typical.

21
4.2 Efficiency and Cost Impacts of Design Options
The tables below present the results of the analyses of steel grade and stack length change. Allcalculations assume operation at 70% of rated load.
Capacitor Start Motors: Steel Grade Options
The 4K motor has relatively low efficiency, so the design options yield proportionately moreefficiency gain than for the more typical 6K motor. The NEMA average data show much lessefficiency gain than does the LBNL analysis.
Capacitor Start LBNL #4K, 1/2 hp, 4-pole, ODP
Grade A Grade B Grade B+ M47
P.U. Cost 1.00 1.03 1.08 1.25
Input (Watts) 492 462 447 438
Outpot (Watts) 265 265 265 265
Loss (Watts) 227 197 182 173
Efficiency 53.9% 57.4% 59.3% 60.5%
Capacitor Start LBNL #6K, 1/2 hp, 4-pole, ODP
Grade A Grade B Grade B+ M47
P.U. Cost 1.00 1.03 1.10 1.25
Input (Watts) 417 399 391 378
Output (Watts) 261 261 261 261
Loss (Watts) 156 138 130 117
Efficiency 62.6% 65.4% 66.8% 69.0%
22
Capacitor Start NEMA, 1/2 hp, 4-pole, ODP
Grade 1 Grade 2 Grade 3
P.U. Cost 1.00 1.10 1.21
Input (Watts) 435 423 415
Efficiency 60.0% 61.7% 62.9%
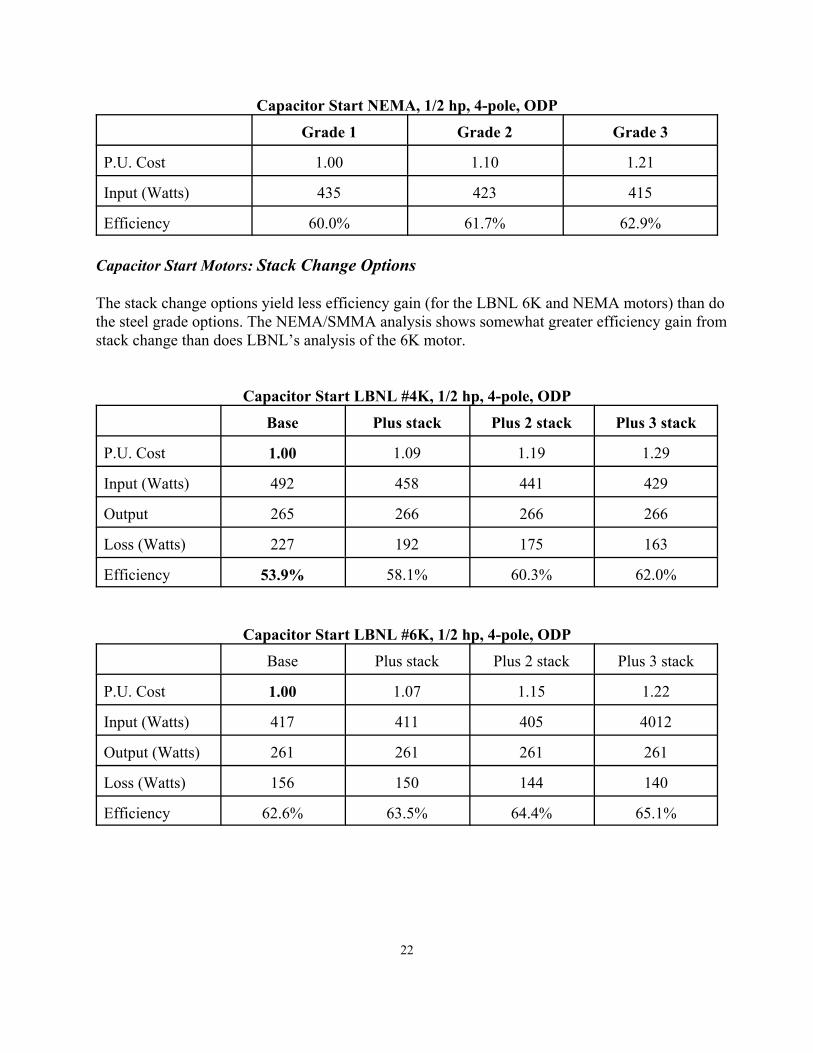
Capacitor Start Motors: Stack Change Options
The stack change options yield less efficiency gain (for the LBNL 6K and NEMA motors) than dothe steel grade options. The NEMA/SMMA analysis shows somewhat greater efficiency gain fromstack change than does LBNL’s analysis of the 6K motor.
Capacitor Start LBNL #4K, 1/2 hp, 4-pole, ODP
Base Plus stack Plus 2 stack Plus 3 stack
P.U. Cost 1.00 1.09 1.19 1.29
Input (Watts) 492 458 441 429
Output 265 266 266 266
Loss (Watts) 227 192 175 163
Efficiency 53.9% 58.1% 60.3% 62.0%
Capacitor Start LBNL #6K, 1/2 hp, 4-pole, ODP
Base Plus stack Plus 2 stack Plus 3 stack
P.U. Cost 1.00 1.07 1.15 1.22
Input (Watts) 417 411 405 4012
Output (Watts) 261 261 261 261
Loss (Watts) 156 150 144 140
Efficiency 62.6% 63.5% 64.4% 65.1%
23
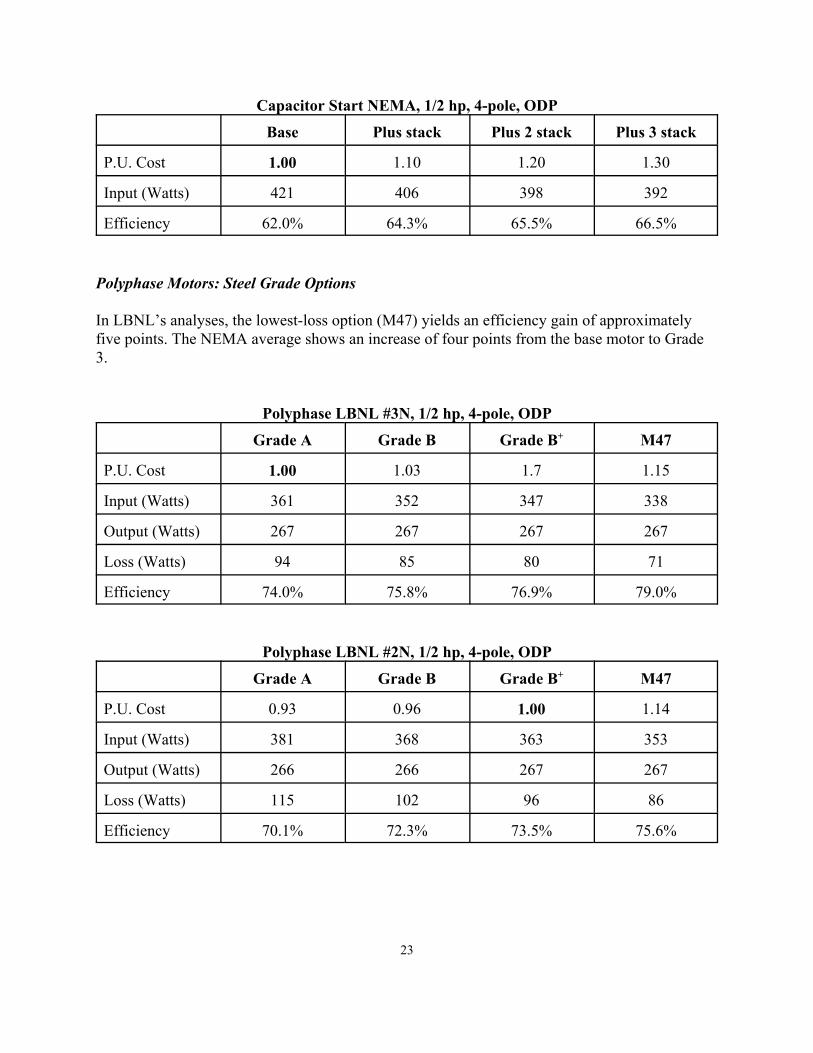
Capacitor Start NEMA, 1/2 hp, 4-pole, ODP
Base Plus stack Plus 2 stack Plus 3 stack
P.U. Cost 1.00 1.10 1.20 1.30
Input (Watts) 421 406 398 392
Efficiency 62.0% 64.3% 65.5% 66.5%
Polyphase Motors: Steel Grade Options
In LBNL’s analyses, the lowest-loss option (M47) yields an efficiency gain of approximatelyfive points. The NEMA average shows an increase of four points from the base motor to Grade3.
Polyphase LBNL #3N, 1/2 hp, 4-pole, ODP
Grade A Grade B Grade B+ M47
P.U. Cost 1.00 1.03 1.7 1.15
Input (Watts) 361 352 347 338
Output (Watts) 267 267 267 267
Loss (Watts) 94 85 80 71
Efficiency 74.0% 75.8% 76.9% 79.0%
Polyphase LBNL #2N, 1/2 hp, 4-pole, ODP
Grade A Grade B Grade B+ M47
P.U. Cost 0.93 0.96 1.00 1.14
Input (Watts) 381 368 363 353
Output (Watts) 266 266 267 267
Loss (Watts) 115 102 96 86
Efficiency 70.1% 72.3% 73.5% 75.6%

24
Polyphase NEMA, 1/2 hp, 4-pole, ODP
Grade 1 Grade 2 Grade 3
P.U. Cost 1.00 1.10 1.20
Input (Watts) 383 369 362
Efficiency 68.1 70.7 72.1
Polyphase LBNL #3N, 1 hp, 4-pole, ODP
Grade A+ Grade B+ M47
P.U. Cost 1.0 1.04 1.20
Input (Watts) 699 682 658
Output (Watts) 534 534 534
Loss (Watts) 165 148 124
Efficiency 76.4% 78.3% 81.2%Note: Grade B yields same efficiency as Grade A+
Polyphase Motors: Stack Change Options
The efficiency gain from stack change is less than for steel grade options. For the “plus stack”option, the LBNL and NEMA analyses agree reasonably well.
Polyphase LBNL #3N, 1/2 hp, 4-pole, ODP
Base Plus stack Plus 2 stack Plus 3 stack
P.U. Cost 1.00 1.10 1.17 1.23
Input (Watts) 361 359 354 355
Output (Watts) 267 268 266 268
Loss (Watts) 94 91 88 87
Efficiency 74.0% 74.7% 75.1% 75.5%

25
Polyphase LBNL #2N, 1/2 hp, 4-pole, ODP
Base Plus stack Plus 2 stack Plus 3 stack
P.U. Cost 1.00 1.08 1.23 1.37
Input (Watts) 363 358 347 340
Output (Watts) 267 267 266 266
Loss (Watts) 96 91 88 87
Efficiency 73.5% 74.6% 76.6% 78.2%
Polyphase NEMA, 1/2 hp, 4-pole, ODP
Base Plus stack Plus 2 stack Plus 3 stack
P.U. Cost 1.00 1.08 1.16 1.24
Input (Watts) 361 357 353 352
Efficiency 72.2% 73.1% 73.9% 74.1%
Polyphase LBNL #3N, 1 hp, 4-pole, ODP
Base Plus stack Plus 2 stack Plus 3 stack
P.U. Cost 1.00 1.06 1.1 1.24
Input (Watts) 699 692 677 674
Output (Watts) 534 534 534 534
Loss (Watts) 165 158 143 140
Efficiency 76.4% 77.2% 78.9% 79.2%
4.3 Issues to Consider
Changing to a lower-loss grade of steel may involve a change in thickness. The majordisadvantage of altering the thickness is that it usually requires new lamination punching dies,since these are usually optimized for a finite thickness. Standardizing on one die can causeexcessive burr and slugs to stick in the dies. Most manufacturers only use one gage of steel for aparticular diameter of stator.

26
Changing the stack length could cause the active material of the motor to exceed the mechanicalpackage that houses the stator and rotor, hence affecting the motor interchangeability for someapplications. If the motor frame is longer due to the increase in stack length, the motor may notfit on the application. If the stack is too long for a given frame, it might restrict the ventilationthrough the motor.
27
5. LIFE-CYCLE COST ANALYSIS OF DESIGN OPTIONS TOIMPROVE EFFICIENCY OF SMALL MOTORS
5.1 Method and Data
To assess the life-cycle cost to end users of designs that improve motor efficiency, we conductedan analysis that compares the additional up-front cost to the value of electricity savings. The life-cycle cost analysis compares the cost to the discounted value of electricity savings over the lifeof the motor. The simple payback analysis calculates the amount of time required for theelectricity savings to match the incremental cost.
The analysis requires several inputs:
1. Typical utilization in terms of hours and loading2. Typical price for the base motors (allows us to express the percentage change in per unit
cost in dollar terms)3. Typical motor lifetime;4. Discount rate (to express the present value of future money savings)
We discuss these variables below.
Motor Utilization
The estimates of average annual hours of use, loading, and shipments for each applicationcategory (see Chapter 3) yield weighted-average values as follows:
Annual hours of use: 2500 (for both capacitor start and polyphase)Average loading (% of rating): 70%
Price for the Base Motors
We calculated average purchase prices for the prototype motors using the followingassumptions:

4 Personal communication from John Platz, FASCO Motors, Dec. 13, 2001.
28
Channel Distributionof sales
Purchase price(% of list)
Motor Manufacturers OEMs 40% 38
Motor Mfrs Distributors OEMs 25% 47Motor Mfrs Distributors End Users 35% 70
The resulting weighted average price is 51% of list. We applied this value for each motoranalyzed. For the motors analyzed by LBNL, we took the list price from the 2001/02 Graingercatalog. For the data submitted by the NEMA/SMMA working group, we estimated list pricesbased on data in the Grainger catalog.
We assume that the full incremental cost of higher-efficiency motors is passed on to equipmentbuyers by the OEMs without additional markup.
Motor Lifetime
The typical lifetime of small motors in the field is not well determined. Studies at onemanufacturer show that small motors have an “L10” life (defined as the point where 10% of testpopulation has failed) under typical operating conditions of around 25,000 hours ("typical"assumes no start/stop or excessive vibration, 75° C bearing temperatures, normal mineral oilbased bearing lubricants, and regular sized lubricant reservoirs).4 For an average utilization of2500 hours per year, that would yield a 10-year L10 life.
The life of a motor depends on a variety of factors in the service conditions of the application.These include environment (largely temperature), loading of the motor, and speed of rotation.The studies cited above have shown that bearing failure is by far the most critical factor in motorfailure. In turn, the main reason for bearing failure is failure of the lubricant, mainly due to heatgeneration.
The three-phase integral motor in mostly three digit sizes has an average life of 11 or 12 years.While these motors have grease fittings on the bearings (per industry standards), all two-digitmotors have permanently sealed bearings. This means the life of the two-digit motor is no longerthan the breakdown point of the lubricant, and as a result the life of the two-digit will likely beless than the three-digit. Motor industry experts consulted suggest that the average life for two-digit motors is at most 10 years, depending of course on the usage and physical environment.
We received some input on motor lifetime from OEMs. A complicating factor is that in somecases the potential lifetime of the motor may be greater than that of the equipment. Thus, theactual motor lifetime is limited by the lifetime of the equipment. Similarly, replacement motors,

29
which account for about one third of the market for the considered motors, may have a shorteraverage lifetime than motors installed in original equipment if the equipment fails sooner thananticipated.
The NEMA/SMMA small motor efficiency task force agreed with an estimated average life of 5to 10 years for fractional motors, with the average being closer to 10 years for three-phase and to5 years for single-phase motors. The studies mentioned earlier did not find a major differencebetween small single and three-phase motors, however.
Based on the above considerations, we elected to use a mean lifetime of seven years for capacitorstart motors and nine years for polyphase motors.
Electricity Price
Based on expert judgement, we estimate that approximately three-fourths of capacitor startmotors are used by utility customers on a commercial tariff, while most users of small polyphasemotors are on an industrial tariff. We based commercial and industrial electricity prices on theaverage of the 2010 and 2020 forecasts from EIA’s Annual Energy Outlook 2001. For capacitorstart motors, we derived an average price giving a 0.75 weighting to the commercial price. Forpolyphase motors, we increased the industrial price slightly to reflect our belief that use of thesemotors is weighted toward smaller facilities, which would pay a higher tariff than large industrialcustomers.
Motor Type Price used in the analysis(cents/kWh)
Capacitor start 5.6Polyphase 4.0
Discount Rate
Economists recommend that the discount rate applied to relatively broad categories ofinvestment should be set equal to the opportunity cost of the capital used to finance investmentsof equivalent risk. In some cases, the opportunity cost of capital is the expected return to acompany stock. However, many firms use the company cost of capital as a general discount rate. The company cost of capital is a weighted average of the expected return on the company’s stockand the interest rate that it pays for debt.
This approach is correct as long as the capital investment in question is typical for the companyas a whole. It can be misleading, however, if the capital investment has more or much less non-diversifiable risk than the company as a whole. In general, the appropriate discount rate toevaluate low risk investments should be lower than the discount rate used to evaluate higher riskinvestments. In particular, the discount rate used to evaluate electricity efficiency investments,
30
which have low risk, may be quite a bit lower than the rate used to evaluate other investments bythe firm.
We assume that the ultimate investors in motor efficiency improvement are the end users of theequipment. For the small motors considered herein, the end users are broadly distributed acrossmanufacturing and commercial sectors of the economy.
A list of companies was chosen to represent buyers of small motors (see Appendix C for details).The cost of debt, cost of equity, debt share, equity share and beta (market risk) value for thesecompanies was obtained from the Damodaran financial data base. These data were then used tocalculate the weighted average cost of capital for each company.
The weighted average cost of capital for the representative companies, after deducting forexpected inflation, ranges from 4% to 11%. The average cost of capital for the companies is6.0%. The standard deviation of the cost of capital is 1.4%.
Based on the above, we used a discount rate of 6% for assessing efficiency improvement as atypical investment.
5.2 Results for Capacitor Start-Induction Run Motor Options
Key results of the financial analysis are presented in the tables and figures below. We onlypresent results for the most typical motors. Note that the base motors are different in the LBNLand NEMA/SMMA cases. This difference is not of much importance, however, since it is therelative change for each motor that is of most interest.
In the LBNL analysis, the steel grade options all have lower LCC than the base motor. Resultsusing the NEMA average data show an increase in LCC, however.
The LBNL analysis shows the stack length options increasing the LCC. The NEMA results showa slight decrease for the first option, but then increase.
The difference in results for the two design options reflects the varying situation of differentmanufacturers. Some are able to improve efficiency at lower cost using change of steel grade,while others can do so better using stack change.

31
Capacitor Start 1/2 HP -- LBNL Data
$370
$380
$390
$400
$410
$420
$430
61% 62% 63% 64% 65% 66% 67% 68% 69% 70%
Efficiency
Life
Cyc
le C
ost
Stack Change
Steel Grade
Table 5.1 Impacts of Efficiency Improvement on Typical End User, Capacitor Start1/2 hp, LBNL Data
Steel Grade Stack Change
Grade A(Base) Grade B Grade B+ M47
PlusStack
Plus 2Stack
Plus 3Stack
Motor Price–Buyer $91 $94 $100 $114 $97 $105 $111
Annual Operating Cost $58 $55 $54 $52 $57 $56 $56
Life-Cycle Cost (7% DR) $414 $403 $403 $407 $416 $418 $422
Change in LCC (WRT Base) -$11.21 -$11.02 -$7.43 $1.73 $4.37 $7.65
Percent Change in LCC -2.7% -2.7% -1.8% 0.4% 1.1% $1.8%
Payback Period (years) 1.1 2.5 4.2 7.7 8.2 9.0

32
Capacitor Start 1/2 HP -- NEMA Data
$390
$400
$410
$420
$430
$440
$450
61% 62% 63% 64% 65% 66% 67% 68% 69% 70%
Efficiency
Life
Cyc
le C
ost
Steel Grade
Stack Change
Table 5.2 Impacts of Efficiency Improvement on Typical End User, Capacitor Start1/2 hp, NEMA Data
Steel Grade* Stack Change**
Grade 1(Base)
Grade 2 Grade 3 Base PlusStack
Plus 2Stack
Plus 3Stack
Motor Price—Buyer*** $103 $113 $125 $103 $113 $123 $134
Annual Operating Cost $60 $59 $58 $58 $56 $55 $54
Life cycle Cost (7% DR) $440 $441 $446 $429 $428 $432 $437
Change in LCC (WRT Base) $0.80 $5.93 -$1.42 $2.67 $8.32
Percent Change in LCC 0.2% 1.3% -0.3% 0.6% 1.9%
Payback Period (years) 6.1 7.7 4.9 6.5* Data are average of four manufacturers** Data reflect typical costs and performance*** Estimated by LBNL

33
P o ly p h a s e 1 H P -- L B N L D a ta
$ 5 4 0
$ 5 5 0
$ 5 6 0
$ 5 7 0
$ 5 8 0
$ 5 9 0
$ 6 0 0
7 6 % 7 7 % 7 8 % 7 9 % 8 0 % 8 1 % 8 2 %
E ffic ie n c y
Life
Cyc
le C
ost
S ta c k C h a n g e
S te e l G ra d e
5.3 Results for Polyphase Motor Options
Key results of the financial analysis for the most typical motors are presented in the tablesbelow. We only present results for the most typical motors. Note that the base motors aredifferent in the LBNL and NEMA/SMMA analyses.
In the LBNL analysis, the steel grade options all have lower LCC than the base motor. TheNEMA average results show an increase in LCC, however. In both analyses, the stack lengthoptions increase the LCC relative to the base motors.
Table 5.3 Impacts of Efficiency Improvement on Typical End User, Polyphase 1 hp,LBNL Data
Steel Grade Stack Change
Grade A+(Base)
Grade B+ M47 PlusStack
Plus 2Stack
Plus 3Stack
Motor Price–Buyer $105 $109 $126 $111 $124 $130
Annual Operating Cost $71 $69 $66 $70 $68 $68
Life cycle Cost (7% DR) $585 $578 $578 $587 $589 $593
Change in LCC (WRT Base) -$7.49 -$7.19 $1.49 $3.77 $8.01
Percent Change in LCC -1.3% -1.2% 0.3% 0.6% 1.4%
Payback Period (years) 2.4 5.1 8.9 8.5

34
Polyphase 1/2 HP, NEMA Data
$340
$350
$360
$370
$380
$390
$400
$410
$420
$430
$440
67% 68% 69% 70% 71% 72% 73% 74% 75%
Efficiency
Life
Cyc
le C
ost
Steel Grade
Stack Change
Table 5.4 Impacts of Efficiency Improvement on Typical End User, Polyphase 1/2 hp,NEMA Data
Steel Grade* Stack Change**
Grade 1(Base)
Grade 2 Grade 3 Base PlusStack
Plus 2Stack
Plus 3Stack
Motor Price—Buyer*** 110.6 121.7 132.7 111.0 119.9 128.8 137.6
Annual Operating Cost $38.7 $37.3 $36.6 $36.5 $36.1 $35.7 $35.6
Life cycle Cost (7% DR) $396 $396 $402 $380 $385 $391 $399
Change in LCC (WRT Base) $0.65 $6.32 $5.90 $11.81 $19.95
Percent Change in LCC 0.2% 1.6% 1.6% 3.1% 5.3%
Payback Period (years) 7.8 10.3 22.0 22.0* Data are average of four manufacturers** Data reflect typical costs and performance*** Estimated by LBNL
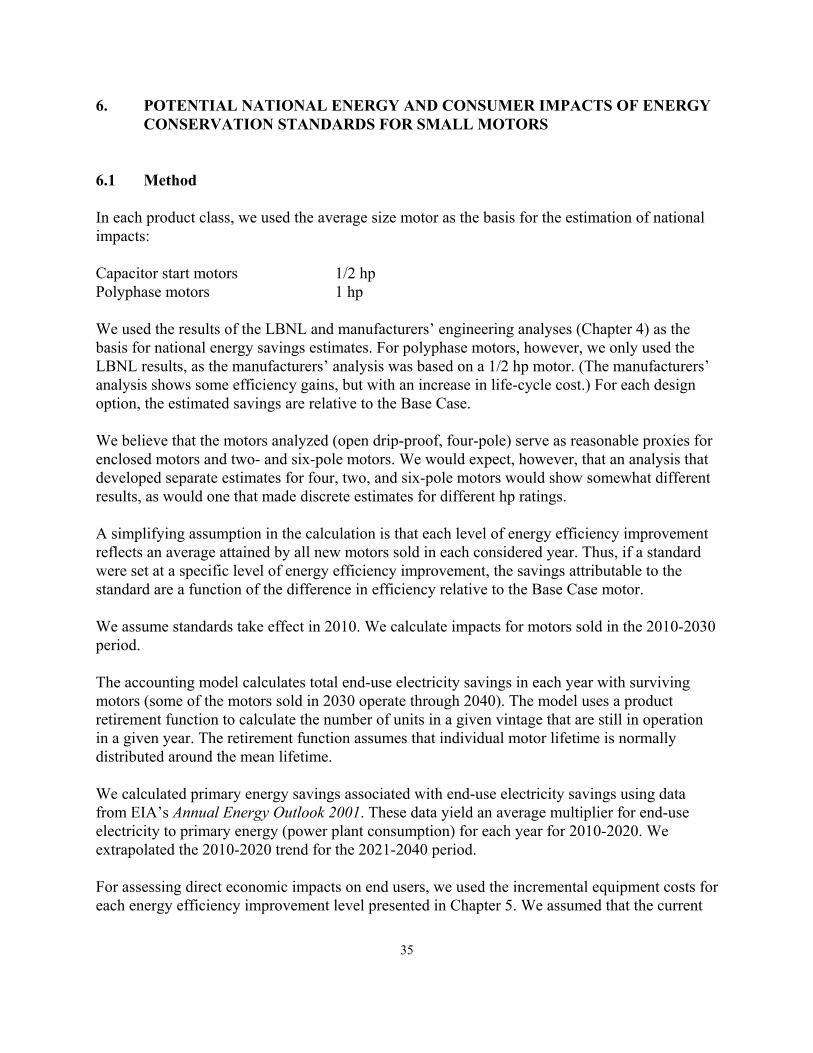
35
6. POTENTIAL NATIONAL ENERGY AND CONSUMER IMPACTS OF ENERGYCONSERVATION STANDARDS FOR SMALL MOTORS
6.1 Method
In each product class, we used the average size motor as the basis for the estimation of nationalimpacts:
Capacitor start motors 1/2 hpPolyphase motors 1 hp
We used the results of the LBNL and manufacturers’ engineering analyses (Chapter 4) as thebasis for national energy savings estimates. For polyphase motors, however, we only used theLBNL results, as the manufacturers’ analysis was based on a 1/2 hp motor. (The manufacturers’analysis shows some efficiency gains, but with an increase in life-cycle cost.) For each designoption, the estimated savings are relative to the Base Case.
We believe that the motors analyzed (open drip-proof, four-pole) serve as reasonable proxies forenclosed motors and two- and six-pole motors. We would expect, however, that an analysis thatdeveloped separate estimates for four, two, and six-pole motors would show somewhat differentresults, as would one that made discrete estimates for different hp ratings.
A simplifying assumption in the calculation is that each level of energy efficiency improvementreflects an average attained by all new motors sold in each considered year. Thus, if a standardwere set at a specific level of energy efficiency improvement, the savings attributable to thestandard are a function of the difference in efficiency relative to the Base Case motor.
We assume standards take effect in 2010. We calculate impacts for motors sold in the 2010-2030period.
The accounting model calculates total end-use electricity savings in each year with survivingmotors (some of the motors sold in 2030 operate through 2040). The model uses a productretirement function to calculate the number of units in a given vintage that are still in operationin a given year. The retirement function assumes that individual motor lifetime is normallydistributed around the mean lifetime.
We calculated primary energy savings associated with end-use electricity savings using datafrom EIA’s Annual Energy Outlook 2001. These data yield an average multiplier for end-useelectricity to primary energy (power plant consumption) for each year for 2010-2020. Weextrapolated the 2010-2020 trend for the 2021-2040 period.
For assessing direct economic impacts on end users, we used the incremental equipment costs foreach energy efficiency improvement level presented in Chapter 5. We assumed that the current
36
estimated incremental costs remain the same in the 2010-2030 period of motor sales. In addition,we assume that electricity prices remain at the projected 2010-2020 average through 2040.
We discounted future costs and benefits using a rate of 7%, in keeping with “Guidelines andDiscount Rates for Benefit-Cost Analysis of Federal Programs” issued by the Office ofManagement and Budget in 1992 (Circular No. A-94, Revised). This rate approximates themarginal pretax rate of return on an average investment in the private sector in recent years.
Projection of Future Shipments
As discussed in Chapter 3, the past growth in annual shipments of the considered motors(including imported motors) is not known, but NEMA did provide confidential data on two-digitframe size fractional horsepower motor sales to domestic customers by NEMA manufacturers,covering the period from 1971 to 2001. After smoothing the data, the average annual growth rateis 1.5%. Although the motors being analyzed make up only around 20% of the motors coveredby these data, as an approximation it may be reasonable to assume that growth in sales of theconsidered motors was similar to that of all fractional motors.
Several factors suggest that the growth in future sales may be slower than in the past. At a basiclevel, U.S. economic growth is expected to be slightly slower than that in the 1970-2000 period.Second, continuation of the current trend toward greater use of definite-purpose small motorswould mean that sales of the general-purpose motors considered in this analysis would increasemore slowly. Finally, foreign manufacturers of end-use equipment incorporating consideredsmall motors may have lower production costs sufficient to gain market share at the expense ofU.S.-based manufacturers, which would reduce U.S. domestic demand for small motors.
Based on the above considerations, we estimated impacts for two scenarios of average annualgrowth in shipments in the 2010-2030 period: one with 1% and the other with 1.5%.
Base Case Efficiencies
Judging what might occur to small motor efficiency in the future in the absence of any standardsis perhaps the most difficult element of our analysis. Apart from the usual problem of estimatingfuture market behavior, we have only limited knowledge regarding the past trend in efficiency.The perspective of the NEMA/SMMA working group and other motor industry experts weconsulted is that the past 20-30 years have seen “very little to moderate” improvement inefficiency. Some gains occurred in the 1970s as electricity prices rose, and there has also beensome spillover into small motors from efficiency improvement in integral horsepower motors. Anumber of manufacturers have introduced “premium efficiency” small polyphase motors. In thecase of capacitor-start motors, there has been some growth in use of more efficient capacitor-runmodels, which to some extent had lessened the need to improve the more common induction-runmodels.

37
Current expectations for future commercial and industrial electricity prices show a slightdeclining trend in the long run. While customer interest in efficiency of small motors maycontinue to be limited, manufacturers may use performance (which includes efficiency) as aselling point to gain advantage in a competitive market. In sum, it seems reasonable that a lowerbound case for future efficiency would envision very little improvement, while an upper boundcase would envision moderate gains.
We expressed the above qualitative cases into actual numbers as follows. In the Low EfficiencyImprovement base case, the average efficiency of motors sold in the 2010-2030 period is ¼ pointbetter than the current base case motors (e.g., 62.25% compared to 62%). In the ModerateEfficiency Improvement base case, the average efficiency is 1 point better than the current basecase motors. In both cases, we assume that there would be gradual change over the period.
6.2 Estimates of Potential Energy and Consumer Impacts
Capacitor Start Motors
For options with positive NPV, the cumulative energy savings, based on the LBNL analysis ofsteel grade change, range from a low of 0.6 quad to a high of 1 quad (Figure 6-1). Thecorresponding cumulative NPV range is $0.6 billion to just over $1 billion. None of the stackchange options have positive NPV.
Using the NEMA average data, we see positive NPV only in a few instances (Figure 6-2). In themost favorable case (Low Efficiency Improvement base case, High Shipments Growth), there aresavings of 0.6 quad with an NPV of just under $0.1 billion (plus 2 stack option).
Polyphase Motors
The LBNL analysis shows cumulative energy savings from steel grade change ranging from alow of 0.15 quad to a high of 0.21 quad (Figure 6-3). The corresponding cumulative NPV rangeis $0.09 billion to $0.27 billion. The stack change options generally do not show positive NPV.
Use of the NEMA average data for 1/2 hp motors would show lower savings than the above.

38
-1.00
-0.50
0.00
0.50
1.00
1.50
GradeB
GradeB+
M47 PlusStack
Plus 2Stack
Plus 3Stack
Low Eff. Improvement Base Case - High Shipments Growth
Primary EnergySavings (Quads)NPV ($Billions)
-1.00
-0.50
0.00
0.50
1.00
1.50
Grade B GradeB+
M47 PlusStack
Plus 2Stack
Plus 3Stack
Moderate Eff. Improvement Base Case - Low Shipments Growth
Primary EnergySavings (Quads)NPV ($Billions)
Figure 6-1 Capacitor Start Motors, National Energy and Consumer Impacts, LBNL Analysis
-1.00
-0.50
0.00
0.50
1.00
1.50
Grade B GradeB+
M47 PlusStack
Plus 2Stack
Plus 3Stack
Moderate Eff. Improvement Base Case - High Shipments Growth
Primary EnergySavings (Quads)NPV ($Billions)
-1.00
-0.50
0.00
0.50
1.00
1.50
Grade B GradeB+
M47 PlusStack
Plus 2Stack
Plus 3Stack
Low Eff. Improvement Base Case - Low Annual Shipments Growth
Primary EnergySavings (Quads)NPV ($Billions)

39
-0.80
-0.60
-0.40
-0.20
0.00
0.20
0.40
0.60
0.80
Grade 2 Grade 3 PlusStack
Plus 2Stack
Plus 3Stack
Moderate Eff. Improvement Base Case - High Shipments Growth
Primary EnergySavings (Quads)NPV ($Billions)
-0.80
-0.60
-0.40
-0.20
0.00
0.20
0.40
0.60
0.80
Grade 2 Grade 3 PlusStack
Plus 2Stack
Plus 3Stack
Moderate Eff. Improvement Base Case - Low Shipments Growth
Primary EnergySavings (Quads)NPV ($Billions)
Figure 6-2 Capacitor Start Motors, National Energy and Consumer Impacts, NEMA Data
-0.80
-0.60
-0.40
-0.20
0.00
0.20
0.40
0.60
0.80
Grade 2 Grade 3 PlusStack
Plus 2Stack
Plus 3Stack
Low Eff. Improvement Base Case - High Shipments Growth
Primary EnergySavings (Quads)NPV ($Billions)
-0.80
-0.60
-0.40
-0.20
0.00
0.20
0.40
0.60
0.80
Grade 2 Grade 3 PlusStack
Plus 2Stack
Plus 3Stack
Low Eff. Improvement Base Case - Low Shipments Growth
Primary EnergySavings (Quads)NPV ($Billions)
40
-0.30
-0.20
-0.10
0.00
0.10
0.20
0.30
0.40
GradeB+
M47 PlusStack
Plus 2Stack
Plus 3Stack
Moderate Eff. Improvement Base Case - High Shipments Growth
Primary EnergySavings (Quads)NPV ($Billions)
-0.30
-0.20
-0.10
0.00
0.10
0.20
0.30
0.40
GradeB+
M47 PlusStack
Plus 2Stack
Plus 3Stack
Low Eff. Improvement Base Case - Low Shipments Growth
Primary EnergySavings (Quads)NPV ($Billions)
-0.30
-0.20
-0.10
0.00
0.10
0.20
0.30
0.40
GradeB+
M47 PlusStack
Plus 2Stack
Plus 3Stack
Moderate Eff. Improvement Base Case - Low Shipments Growth
Primary EnergySavings (Quads)NPV ($Billions)
Figure 6-3 Polyphase Motors, National Energy and Consumer Impacts, LBNL Analysis
-0.30
-0.20
-0.10
0.00
0.10
0.20
0.30
0.40
GradeB+
M47 PlusStack
Plus 2Stack
Plus 3Stack
Low Eff. Improvement Base Case - High Shipments Growth
Primary EnergySavings (Quads)
NPV ($Billions)

41
7. CONCLUSION
The objective of this study was to determine whether energy conservation standards for smallelectric motors would be technically feasible, be economically justified, and have the potentialfor significant energy savings.
Standards established at levels that correspond with the efficiency-enhancing design optionsconsidered in this study would be technically feasible. Because of differences between LBNLand motor manufacturers with respect to estimates of the efficiency and cost increase associatedwith the options, it is difficult to accurately determine whether or not standards would beeconomically justified, and have the potential for significant energy savings.
The best case for positive economic impact and significant energy savings can be made forcapacitor start-induction run motors. The analysis of design options conducted by LBNL showspotential cumulative energy savings from steel grade change ranging from from 0.6 to 1 quad.The corresponding cumulative NPV range is $0.6 billion to just over $1 billion. However, theaverage data provided by the NEMA/SMMA working group indicate lower potential energysavings and positive economic impacts. The best cost-effective case shows energy savings of 0.6quads, while in the worst case the options are not cost-effective.
The LBNL and NEMA/SMMA data are in reasonably close agreement with respect to the stackchange design option. Projected impacts with the NEMA/SMMA data are actually morefavorable than with the LBNL data, though the cumulative savings are low.
For steel grade change, however, the data are not in good agreement. We were not able toanalyze the reasons for the differences between the LBNL and NEMA/SMMA data, as theNEMA/SMMA working group did not wish to share details of the calculations performed by thefour companies that submitted data. At the request of the group, we used the average values forthe four companies, though we have concerns that some of the data may not be representative oftypical motors on the market. The NEMA/SMMA working group felt, however, that it would beinappropriate to exclude any of the submissions.
Based on the limited information available, we believe that the best estimate of potential impactswould lie somewhere between the LBNL and NEMA/SMMA results. Better resolution of theuncertainty would require both more information from the NEMA/SMMA group and goodestimates of the market shares of the major manufacturers for the considered motors. The formerwould help us evaluate the individual data submissions by the companies, while the latter wouldallow us to better weight the data according to the market share of each manufacturer.

42
APPENDIX A INFORMATION COLLECTION PROCESS ON USE OF SMALLMOTORS
Small motors are used in a variety of equipment. Easton Consultants identified 14 NAICAcategories (industries) and over 45 categories of equipment that use small motors as defined. These include such diverse types of equipment as farm milking machines, industrial pumps,packaging machines, and machine tools.
The information collected for each category included the following three types:
Type 1 – Usage information
• Horsepower range• Average horsepower• Average hours of use• Qualitative information on specific applications (e.g. ambient conditions)• Estimate of typical motor loading• Other application specific information.
Type 2 – Motor selection information
• Information on motor purchasing practices and procedures by OEMs who use consideredmotors in their products.
• The degree to which changes in motor size related to improved efficiency may beincompatible with equipment designs used by OEMs.
• The degree to which motor efficiency is a significant consideration for OEMs• Other selection related information.
Type 3 – Quantitative (shipments) information
• Annual shipments of each considered motor type (cap-start and polyphase) for eachNAICA category.
We used an information collection process that followed a sequence of steps moving fromgeneral sources to specific as needed. We proceeded step-by-step for each of the 14 categories asfollows:
• Step 1 –In-house expertise. We started with our expertise on each of the categoriesfrom past projects. We assembled this information as the starting point.
• Step 2 --Industry associations. We contacted the association or associations servicingeach of the categories for general information on the industry, important players, industrycharacteristics and trends, and motor use.
• Step 3 --Industry literature search. We conducted a review of the relevant trademagazines and reports available publicly for relevant motor-related information on motorselection and use.
43
• Step 4 --Company information review. We explored the information available on oneor two leading motor-using company web sites (particularly product specifications),requesting specs from the sales department where not available on the web.
• Step 5 --Expert assistance. We worked with a former director of market research of amotor manufacturer who has extensive industry background to extend our expertise. Hisinputs and review were added to our information.
• Step 6 --Direct motor-using company informal discussion. After the above sourceshad been fully utilized we conducted a series of informal phone conversations withequipment designers and engineers in each of the sectors. These were informal, weredesigned to collect the specific information needed, and varied for each NAICA categorydepending on the specifics of what was needed for that category. In these interviews we discussed:• Types of motors used in the particular equipment to identify the approximate
proportion of all motors that are considered motors• Sizes of motors used• Typical hours of operation of the motors• Motor loading against its rated horsepower• Role of energy efficiency in the decision and the rationale• Health of the industry• Technical changes expected that would affect motor use • Typical life of the motor in this equipment’s service• Other related subjects

44
APPENDIX B METHOD FOR ESTIMATING CONSIDERED SMALL MOTORSSHIPMENTS BY INDUSTRY SECTOR
As part of the effort to support the LBNL project, “Development of Application Information forGeneral Purpose Small Electric Motors Considered for Efficiency Standards”, EastonConsultants conducted an analysis to estimate the shipments of considered small motors to eachof 14 industry segments.
There is no single source that provides a measurement of the shipments of considered motors inthe principal industries of use. As a result we had to rely on a variety of sources of information,each one of which provided only a piece of the puzzle. By integrating all of those available andthen applying judgment, we have developed a reliable “first cut” estimate. The cornerstone tothe estimates was first hand research with a number of manufacturers of small motor-usingequipment.
The data sources used included the following:
1. Discussion with four to ten equipment OEMs (product designers, engineers) in each ofthe small-motor using equipment industries.
2. Survey of the small motors manufacturers conducted by NEMA to measure the totalshipments of considered motors.
3. The Census of Manufacturers (1997), which measures equipment shipments and certaincomponent usage by each of the principal small motor using industries
4. Industry associations that cover the principal small motor using industries.5. Catalogs of equipment using small motors.6. Expert counsel from an individual who was formerly a market research manager with a
leading motor manufacturer.7. Past Easton projects on small motor use, particularly the 1995 project conducted for
LBNL.
In the chart below we have defined the role of each source of information in making theestimates.

45
InformationSource
Description Principal Value Limitations Importanceof Source
OEM Interviews Discussions withmanufacturers ofsmall motorusing equipment
First hand inputs fromengineers and designerswho make the motorselection decisions inthe user industries
The sample of OEMs wasnecessarily a small sampleof the many companiesusing small motors.
Very High
NEMA Survey Survey ofprincipal smallmotorsmanufacturers
Provided a reliablemeasure of the totalnumber of consideredsmall motor shipmentsby size and type
Did not provide anyinformation on theequipment in which themotors are used
High
Census ofManufacturers(1997)
Survey of U.S.Manufacturers
(1) Shipments of motorusing equipment
Difficult in most cases tomatch equipment definitionswith motor type
Low
(2) Shipments of smallmotors to each industry
Data given for all shipments;considered motors notbroken out.
High
IndustryAssociations
Organizationssupportingindustrial sectors
Information on sectorstructure (e.g. majorcompanies), trends,economic health,
Most information could notbe tied directly to motor use
Low
Equipmentcatalogs
Equipmentdescriptions forsales purposes
Often explicit as to thetype and size of motorsused
Most catalogs do notprovide motor useinformation; only a fewwere useful
Low
Expert counsel Review by anexperiencedmarket researchhead formerlywith a motormanufacturer
“Reality check” onestimates
Motor manufacturers do nothave good information onwhere small motors are used
Medium
Past EastonReports
Easton files onsmall motor usefrom pastprojects
A variety ofinformation, esp. fromthe 1995 report onsmall motors
Information generally dated Medium

1 Aswath Damodaran web site. This site is hosted at New York University Stern Business School. The site includesa data base with financial information covering over 7,000 companies representing different economic sectors of theeconomy. http://www.stern.nyu.edu/~adamodar/New_Home_Page/data.html
46
APPENDIX C. SMALL MOTORS DISCOUNT RATE CALCULATIONS
A list of companies was chosen to represent buyers of considered small motors. The cost of debt, cost ofequity, debt share, equity share and beta (market risk) value for these companies was obtained from theDamodaran web site financial data base (Table C-1).1 These data were then used to calculate theweighted average cost of capital for each company. The weighted average cost of capital of companies isa common measure of the discount rate appropriate for evaluating typical company investments.
The weighted average cost of capital for the list of representative companies ranges from 4% to 11%(Figure 1). The average cost of capital, after deducting for expected inflation, is 6.0%. The standarddeviation of the cost of capital is 1.4%.
The sample of companies included for this analysis included heavy manufacturing (43%), largecommercial (retail, grocery and real estate) (40%) and water agency and agricultural companies (17%).

47
Company Name Industry NameCompany Beta
(1)Cost Equity
(2) We (3)Cost Debt
(4) Wd (5) WACC (6)WACC-no
inflation (7)
Manufacturing FirmsIvanhoe Energy Inc Petroleum (Producing) 0.7 9.35% 100% 9.00% 0.22% 9.35% 6.9%Caledonia Mining Corpor Metals & Mining (Div.) 0.35 7.43% 100% 9.00% 0.00% 7.43% 5.0%Kaiser Alum. Metals & Mining (Div.) 0.95 10.73% 11% 8.00% 88.52% 8.31% 5.9%Coeur d'Alene Mines Gold/Silver Mining 0.50 8.25% 15% 9.00% 84.76% 8.89% 6.4%Hecla Mining Gold/Silver Mining 0.40 7.70% 51% 9.00% 49.01% 8.34% 5.9%Brigham Exploration Co Petroleum (Producing) 1.00 11.00% 36% 9.00% 63.76% 9.72% 7.3%Enbridge Inc. Petroleum (Producing) 0.55 8.53% 52% 6.00% 48.13% 7.31% 4.9%Exploration Co Petroleum (Producing) 0.80 9.90% 97% 9.00% 3.18% 9.87% 7.4%Intrawest Corporation Homebuilding 0.75 9.63% 53% 5.72% 46.61% 7.81% 5.4%ConAgra Foods Food Processing 0.70 9.35% 65% 4.02% 34.73% 7.50% 5.1%Kellogg Food Processing 0.60 8.80% 86% 4.44% 14.50% 8.17% 5.7%Boise Cascade Paper & Forest Product 1.20 12.10% 50% 3.55% 49.92% 7.83% 5.4%Louisiana-Pacific Paper & Forest Product 1.00 11.00% 41% 4.89% 59.26% 7.38% 5.0%Dow Chemical Chemical (Basic) 1.00 11.00% 83% 4.27% 17.47% 9.82% 7.4%ChemFirst Inc. Chemical (Diversified) 0.80 9.90% 87% 3.91% 12.83% 9.13% 6.7%Goodyear Tire Tire & Rubber 1.15 11.83% 52% 5.33% 48.31% 8.69% 6.2%Bayou Steel Steel (General) 0.75 9.63% 4% 7.00% 96.28% 7.10% 4.7%Thomas & Betts Electrical Equipment 1.10 11.55% 64% 7.00% 35.54% 9.93% 7.5%Overseas Shipholding Maritime 0.80 9.90% 48% 4.53% 51.95% 7.11% 4.7%Northwest Airlines 'A' Air Transport 1.35 12.93% 26% 4.71% 74.14% 6.83% 4.4%
Commercial FirmsCostco Wholesale Retail Store 1.30 12.65% 95% 4.20% 5.03% 12.22% 9.7%Kmart Corp. Retail Store 1.15 11.83% 46% 5.35% 54.47% 8.30% 5.9%Neiman Marcus Retail Store 1.25 12.38% 86% 4.34% 14.47% 11.21% 8.7%Penney (J.C.) Retail Store 1.10 11.55% 55% 5.47% 45.28% 8.80% 6.4%Target Corp. Retail Store 1.30 12.65% 84% 4.00% 15.75% 11.29% 8.8%Wal-Mart Stores Retail Store 1.15 11.83% 92% 4.13% 7.93% 11.21% 8.7%Toys 'R' Us Retail (Special Lines) 1.20 12.10% 71% 5.70% 29.29% 10.23% 7.7%Safeway Inc. Grocery 0.75 9.63% 76% 3.80% 23.68% 8.25% 5.8%Smart & Final Grocery 0.80 9.90% 69% 4.00% 31.21% 8.06% 5.6%Village Super Market 'A' Grocery 0.55 8.53% 61% 4.01% 38.84% 6.77% 4.4%Whole Foods Market Grocery 1.10 11.55% 89% 4.43% 11.40% 10.74% 8.2%Winn-Dixie Stores Grocery 0.75 9.63% 73% 4.92% 26.82% 8.36% 5.9%Security Cap Group Inc R.E.I.T. 0.50 8.25% 99% 4.72% 0.98% 8.22% 5.8%Rouse Co. R.E.I.T. 0.65 9.08% 39% 5.96% 60.94% 7.18% 4.8%Bedford Ppty Invs R.E.I.T. 0.55 8.53% 56% 5.75% 44.19% 7.30% 4.9%HMG Courtland Prop R.E.I.T. 0.40 7.70% 44% 8.00% 56.21% 7.87% 5.4%Health Care Property R.E.I.T. 0.55 8.53% 61% 5.75% 38.89% 7.45% 5.0%Bedford Ppty Invs R.E.I.T. 0.55 8.53% 56% 5.75% 44.19% 7.30% 4.9%Catellus Development R.E.I.T. 0.90 10.45% 62% 3.58% 38.40% 7.81% 5.4%
Agricultural FirmsML Macadamia Orchards LPFood Processing 0.6 8.80% 82% 6.25% 17.59% 8.35% 5.9%Sylvan Inc. Food Processing 0.5 8.25% 61% 5.04% 39.05% 7.00% 4.6%Tejon Ranch Co. Food Processing 0.8 9.90% 89% 6.50% 11.33% 9.51% 7.1%Chiquita Brands Int'l Food Processing 0.4 7.70% 3% 9.00% 96.66% 8.96% 6.5%
Water UtilitiesAmer. W ater W orks W ater Utility 0.5 8.25% 60% 3.93% 40.49% 6.50% 4.1%California W ater W ater Utility 0.6 8.80% 66% 3.61% 34.43% 7.01% 4.6%Middlesex W ater W ater Utility 0.45 7.98% 66% 4.18% 33.51% 6.70% 4.3%Southwest W ater W ater Utility 0.45 7.98% 72% 4.09% 28.20% 6.88% 4.5%
Group Averages 0.79 9.9% 62.4% 5.6% 37.6% 8.4% 6.0%
Source:1. Damodaran data base. Covariance between company return and stock market return.2. Risk free bond rate (5.5%) plus company beta times the expected return on common stocks minus the risk free bond rate (5.5%).3. Damodaran data base. Proportion of equity in company financial position.4. Damodaran data base. After tax interest paid on debt.5. Damodaran data base. Proportion of debt in company financial position.6. W ACC. Cost of equity times the proportion of equity (W e) plus the cost of debt times the proportion of debt (W d).7. Inflation rate is 2.3%.
Table C-1. Cost of Capital of Representative Firms Purchasing Small Motors