Determinants of role stress based on employee segmentation
30
1 DETERMINANTS OF ROLE STRESS BASED ON EMPLOYEE SEGMENTATION: A MULTINOMIAL LOGIT ANALYSIS Supran Kumar Sharma * Jyoti Sharma ** Arti Devi *** Received: 25. 5. 2012 Original scientific paper Accepted: 9. 11. 2012 UDC: 658.3 Organizations face many challenges and managing role stress has assumed great importance due to its debilitating effects on employees and organizations. The aim of this paper is to identify the determinants of clusters of employees segmented on the basis of role stress experienced at the workplace using empirical data collected from 550 frontline employees of commercial banks of Jammu and Kashmir State (India). Multinomial Logit Regression is used to investigate the impact of organizational, demographic, personality and performance determinants on the clusters of employees using E-Views 6.1and SPSS 14. 1. INTRODUCTION The integration of an individual within an organization takes place through a system of roles which constitutes key aspects of an employee’s job-related functions. Roles include expectations that the employees have of each other and expectations they have of the jobs they perform within the organization (Pareek, 1993). Stress, originating from the concept of the role of a person (Jena and Pradhan, 2011; Fernandes et al., 2009; Dasgupta and Kumar, 2009) and its interface with the role occupant (Aziz, 2004), has been acknowledged as an important concern in organizational settings (Cox and Griffiths, 2010). Of the * Supran Kumar Sharma, PhD, Shri Mata Vaishno Devi University, Katra, India, Phone:+9419165690, E-mail: [email protected] ** Jyoti Sharma, PhD, Shri Mata Vaishno Devi University, Katra, India, E-mail: [email protected] *** Arti Devi, Shri Mata Vaishno Devi University, Katra, India
-
Upload
nguyenngoc -
Category
Documents
-
view
216 -
download
2
Transcript of Determinants of role stress based on employee segmentation
1
DETERMINANTS OF ROLE STRESS BASED ON EMPLOYEE SEGMENTATION:
A MULTINOMIAL LOGIT ANALYSIS
Supran Kumar Sharma* Jyoti Sharma**
Arti Devi*** Received: 25. 5. 2012 Original scientific paper Accepted: 9. 11. 2012 UDC: 658.3
Organizations face many challenges and managing role stress has assumed great importance due to its debilitating effects on employees and organizations. The aim of this paper is to identify the determinants of clusters of employees segmented on the basis of role stress experienced at the workplace using empirical data collected from 550 frontline employees of commercial banks of Jammu and Kashmir State (India). Multinomial Logit Regression is used to investigate the impact of organizational, demographic, personality and performance determinants on the clusters of employees using E-Views 6.1and SPSS 14.
1. INTRODUCTION The integration of an individual within an organization takes place through
a system of roles which constitutes key aspects of an employee’s job-related functions. Roles include expectations that the employees have of each other and expectations they have of the jobs they perform within the organization (Pareek, 1993). Stress, originating from the concept of the role of a person (Jena and Pradhan, 2011; Fernandes et al., 2009; Dasgupta and Kumar, 2009) and its interface with the role occupant (Aziz, 2004), has been acknowledged as an important concern in organizational settings (Cox and Griffiths, 2010). Of the
* Supran Kumar Sharma, PhD, Shri Mata Vaishno Devi University, Katra, India,
Phone:+9419165690, E-mail: [email protected] ** Jyoti Sharma, PhD, Shri Mata Vaishno Devi University, Katra, India, E-mail:
[email protected] *** Arti Devi, Shri Mata Vaishno Devi University, Katra, India

Management, Vol. 17, 2012, 2, pp. 1-30 S. K. Sharma, J. Sharma, A. Devi: Role stress based on Employee Segmentation
2
many challenges organizations face, managing role stress has assumed great importance due to its debilitating effects on employees and organizations. However, the multifaceted phenomenon of role stress requires dissecting the phenomenon of role stress, from its various facets and dimensions, which amounts to an important research objective needed to make an informed decision on various interventions for managing it. An investigation into the interface between the individuals and the role environment they experience may present specific cues to manage the phenomenon of organizational role stress. In view of that, this study aims to ascertain the influence of various determinants of role stress on role stress based employee segments. The next section reviews the literature followed by a detailed discussion on the methodology adopted. The ensuing sections discuss the results followed by the conclusion and implications emanating from the study.
2. LITERATURE REVIEW The demands placed by the roles, assigned to an individual at work, may
put one in a great deal of stress that arises from a perceived imbalance between the demands and the capabilities to cope with them (Cox, 1993). A number of aspects of role have been linked to stress, such as role ambiguity, and role conflict (Glazer and Beehr, 2005; Bettencourt and Brown, 2003; Brown and Peterson, 1993; Burke, 1988; Nelson and Burke, 2000; Kahn et al., 1964), the absence of clarity and predictability in the role (Beehr et al. 1976), resource inadequacy (Aziz, 2003), role overload, etc. (Narayanan et al. 1999; Glazer and Beehr, 2005; Margolis et al. 1974). Role stress caused by such type of hurdles and demands has been dealt with broadly and has been found to impact employee performance, attitude, job satisfaction, organizational commitment, etc. (Shahu and Gole, 2008; Knight et al. 2007; Choo, 1986; Anderson, 1976; Schlenkar and Gutek, 1987; Pestonjee and Singh, 1982; Dubinsky and Yammarino, 1984; Pestonjee and Singh, 1983; Kemery et al. 1985). Role conflict and role ambiguity negatively influence job satisfaction (Montgomery, 2012) and the latter may also affect the intention to quit one’s job (Calisir and Gumussoy, 2011). Role stress also leads to psychological strain which occurs when organizational stress leads to ineffective cognitive functioning (Beehr and Glazer, 2005; Beehr, 1995; Jackson and Schuler, 1985).
However, previous studies suggest that role stress may result from a
complicated interaction between individual personal factors and the work environment (Beehr and Newman, 1978; Payne, 1988; Swanson et al. 1998; Tankha, 2006; Masood, 2011). The personal attributes are a part of what an individual brings to the workplace. The heterogeneity is manifested in age,

Management, Vol. 17, 2012, 2, pp. 1-30 S. K. Sharma, J. Sharma, A. Devi: Role stress based on Employee Segmentation
3
marital status, salary, education, etc. making the role stress phenomenon more complex and multifaceted. It should be noted that previous studies in this direction have yielded varied results as far as relationship between personal variables and role stress is concerned. Clayson and Frost (1984) and Chandriah et al. (2003) established a relationship between age and stress while Saravanan and Lawrence (2007) found no causal relationship between stress and age or marital status of employees but identified its relationship with a number of dependents on the person in the family and the amount of salary an individual receives. Moreover, the sector which the organization belongs to can also be one of the determinants of role stress for employees (Sankpal et al. 2010; Malik, 2011).
Some studies also noted that the factors inherent in the personality of an
individual can exert a significant impact on the perceived role stress experienced by the individual (Eysenck, 1983; Ivancevich et al. 1982; Wofford, 2002; Srivastava, 2009; Judge et al. 2003, Martin et al. 2005). Other studies also indicated that anxious people might be more stressed at work and dissatisfied when things do not go as planned (Cooper and Roden, 1985; Spector et al. 1988). It was reported that employees, who perceive themselves more in control, experience fewer role stressors than their colleagues who perceive themselves less in control (Ganster and Fusilier, 1989). Tidd and Friedman (2002) suggested that individuals may be able to reduce the negative individual impact of role conflict in their environment by adopting positive behavioral styles. Similarly, performance can be another contextual variable in the dynamic whirlpool of role stress. Fried et al. (2008) indicated that role stress is related to job performance both directly and indirectly through job satisfaction and propensity to leave. Anton (2009) identified role ambiguity as the critical predictor of workers’ performance and job satisfaction. Shahu and Gole (2008) found that higher stress level was related to lower performance, while Gmelch and Chan (1994) noted that insufficient stress leads to boredom, a lack of concentration, and a lack of motivation to put in the best possible effort. Finally, an inverted U-shaped relationship between stress and performance was supported by Choo (1986).
A review of the existing literature suggests that a variety of organizational
and personal factors are linked to role stress. There is a dearth of comprehensive studies which assess the experience of role stress, not only its aspects but also its various determinants, particularly in Third World countries like India. A noteworthy limitation of the literature on role stress is that most of the studies consider the whole population as a homogeneous set of individuals suffering from the same stressors. If, for example, role overload emerges as a dominant

Management, Vol. 17, 2012, 2, pp. 1-30 S. K. Sharma, J. Sharma, A. Devi: Role stress based on Employee Segmentation
4
stressor in a sample, then it is assumed that everyone is inflicted with the same stressor. However, the role stress factors may not be consistently related to the role stress experiences of all employees, and the predictors of role stress may differ across groups of employees. Furthermore, although one-to-one employee handling might not be practically feasible “distinct employees” segmentation and its association with various organizational, personal and other related factors may nonetheless provide a channel for focusing one’s stress-busting efforts towards the narrower base of employees. With this backdrop in mind, the present study has been undertaken to analyze the impact of various organizational, demographic, performance and personality-related variables on distinct role stress based groups of employees. The null hypothesis for the present study has been framed as:
H0: There is no significant difference between the different groups of employees segmented on the basis of their experience of role stress at work with respect to their personal and organizational factors.
3. METHODS 3.1. Database and Sample One of the major challenges the banks face in present dynamic era is
meeting the ever increasing customer expectations (FICCI, 2010), which is forcing the employees to routinely engage in highly demanding interactions with customers. The experience of conflicting feelings in attempting to fulfill the requirements of the job (Boles et al. 1997) leads to role stress (Wetzels et al. 2000), which makes it pertinent to identify the prevalence of role stress in the banking sector. Further, the nature of the work of frontline employees makes them experience more problems, pressures and even encumbrance from external customers, apart from the pressure of the demands imposed by the internal people which makes their role more vulnerable to stress as compared to other employees. Although research into the role stress of frontline employees of commercial banks of India and particularly the states like Jammu and Kashmir is scant (Ahmad and Shah, 2007; Shah, 2003), it has reinforced our decision to confine the study to the frontline employees only. Moreover, the banking sector can play an important role in rescuing the country from economic setback that it has been suffering, which reinforces the decision of confining the study to this part of India only. Accordingly, a structured questionnaire was distributed to 600 full-time front-line employees of both public as well as private sector commercial banks, who were contacted at their workplace during the period

Management, Vol. 17, 2012, 2, pp. 1-30 S. K. Sharma, J. Sharma, A. Devi: Role stress based on Employee Segmentation
5
from January to May, 2010. The sample profile of the respondents is shown in Table 1.
Table 1. Sample profile of respondents
Category Frequency %
Type of bank Public 252 50.2 Private 249 49.8
Age (years)
Less than or equal to 20 3 0.6 21-30 192 38.3 31-40 134 26.7 41-50 102 20.4 50 above 70 14
Work experience (in years)
Mean 12.56 Mode 3 Std. Deviation 10.63 Range 3-40
Monthly salary (Rupees)
Rs.10, 000 or less 63 12.6 10,001 to 20,000 160 31.9 20,001 to 30,000 169 33.7 30,001 to 40,000 85 17 Above 40,000 24 4.8
Category Frequency %
Increments
Mean 1.60 Mode 0 Std. Deviation 1.37 Range 0-6
Promotion
Nil 271 54.1 One 185 36.9 Two 34 6.8 More than Two 11 2.2
Rewards
Nil 281 56.1 One 117 23.4 Two 56 11.2 More Than Two 47 9.4
Appreciation (No. of times)
Nil 98 19.6 Once 104 20.8 Twice 113 22.6 Thrice 47 9.4 More than thrice 139 27.7
Additional Work
Nil 268 53.5 One 127 25.3 Two 57 11.4 More than two 49 9.8
Management, Vol. 17, 2012, 2, pp. 1-30 S. K. Sharma, J. Sharma, A. Devi: Role stress based on Employee Segmentation
6
The main offices of a total of nine public sector and all of the three private sector banks were covered. Particular attention was devoted at the time of data collection that the sample was representative of the front line employees having different job roles within the banking organization. The survey yielded 550 responses (response rate 91 percent). Applying list-wise case deletion method, the cases with values more than 3 standard deviations below or above the mean (Shaufeli et al. 2009) on each scale were considered as outliers and based on this, 49 responses were eliminated resulting in 501 usable bank employees’ responses. Therefore, the final responses of 501 employees were used for the analysis.
In case of present usable sample of 501 employees, it is to be highlighted
that the majority of the employees (38 percent) belong to the age bracket of 21-30 years and a maximum (34 percent) earns a salary between Rs. 21,000 and Rs. 30,000 per month. Of all, the maximum number of respondents is married and the majority of the sample has a graduation degree. Public and private sector commercial banks are equally represented in the sample and the work experience of the employees ranges from 3 to 40 years, with a mean experience of 12.5 years.
3.2. Measures The study uses a structured questionnaire measuring a number of
psychological concepts that have been well-publicized in the stress literature. The survey included measures of role stress, organizational, demographic, performance and personality factors of the employees. The role stress experienced by bank employees has been measured using a well-designed pre-tested scale. The research instrument for the present empirical work was developed using measurement scales, namely, Organizational Role Stress (ORS) scale by Pareek (1983) and the role stress measure by Rizzo et al. (1970). Taking into consideration the requirements of employees of commercial banks at the regional level of Jammu and Kashmir State in India, a 30-item scale was designed to tap the role stress (e.g. “I am not able to give time to my family because of work”, “I am able to satisfy the conflicting demands of various people above me”, ”I am not clear on the scope and responsibilities of my role”, etc.) of individuals in the organizations.
The modifications for the same were made after interviewing a total of 100
employees, before the final design of the questionnaire. The responses on the scale was given using a five-point Likert-type scale ranging from "Never" to "Always". The codes 1, 2, 3, 4, 5 were assigned to all the positive statements

Management, Vol. 17, 2012, 2, pp. 1-30 S. K. Sharma, J. Sharma, A. Devi: Role stress based on Employee Segmentation
7
which indicate the reasons for role stress whereas the negative statements were coded reversely. Similarly, the coping style (Seek professional help, Delegate responsibility instead of assuming it, etc.) was determined by presenting the respondents with an inventory of 20 coping strategies of approach and avoidance designed by referring to the studies of Hariharan and Rath (2008), Sharma and Sharma (2008), Holahan and Moos (1987), Koeske et al. (1993), Lang and Markowitz (1986), Billings and Moos (1981).
The responses on the scale were measured using the five-point scale
ranging from ‘highly used’ to ‘never used’. The total score on coping style ranges from 20 to 100 – thus, providing an array of coping styles from approach to avoidance. Further, the organizational climate was used to identify the features of the work environment and the same was measured in the present study after taking cues from the existing work of Pelz and Andrews (1976); Sen (1981); Abbey and Dickson (1983).
Accordingly, the climate of the organization was assessed through
presence/absence of work-group contact, task orientation, rewards and recognition of individual merit precursors. Besides, peer stress was considered to ascertain employee narration of the role stress experienced by colleagues on a five-item scale. The items like “My colleagues do not know how to understand the unclear aspects of their jobs” were included in the scale in order to make the respondents share their experiences at work by giving an account of the peer stress. Further, the individual propensity to stress was determined on account of propensity for time deadlines, supervision, quantity of work, difficulty, predictability and stability which have been identified as stress propensity indicators by Caplan (1985). The behavioral strain (Angry, Relaxed, etc.) was measured using indicators like angry, worry, depressed, relaxed, exhausted, etc. reported in the works of Akinnusi (1994), Blanc et al. (2008), Wofford (2002), Cooper (1981), Vaez and Laflamme (2008).
All the above designed scales were subjected to further review by inviting
comments from renowned academicians/researchers in the area of stress management. On the basis of suggestions given by these experts, the scale items were rephrased and few vague and ambiguous items deleted. Further, the viewpoints of experts in the field and the employees of banking sector regarding the modified scales were also taken into account which ensured its face validity. An assessment of the reliability of the scale on a sample of 100 employees, using inter-item Cronbach Alpha, resulted into the retention of 22 statements assessing the role stress. Whereas, in the case of other scales, no items were deleted. The measured value of Cronbach Alpha of the above final scales on a

Management, Vol. 17, 2012, 2, pp. 1-30 S. K. Sharma, J. Sharma, A. Devi: Role stress based on Employee Segmentation
8
sample of 100 employees, ranges from 0.805 to 0.811 which is far above the desired prescribed limit of 0.60 as suggested by Nunnally and Bernstein (1994) and Donio et al. (2006) and establishes the reliability of the modified scale. Furthermore, the construct validity measures the extent to which items in a single scale measure the same construct (Flynn et al. 1991) and in order to ensure the same, factor analysis was used (Sabharwal et. al. 2010) on the 501 responses in which all the statements of a single scale were loaded on a single factor, ensuring unidimensionality of each construct. All the constructs have an average variance extracted of more than 0.40 (Hair et al. 2006) and thus all the items were retained.
Locus of Control (LOC) is an important variable describing individual
differences and predicting behavior in organizational settings (Spector, 1982). It was assessed using the standardized inventory of Rotter (1966) which has been widely used to explain employee behavior (Renn & Vandenberg, 1991; Ferrando et al. 2011) and considered as a relatively stable trait that once formed, can be difficult to change (Lawrence & Winschell, 1975). This inventory using a forced choice format measures individual differences in their tendency to believe that environmental events are within one’s control (categorized as ‘Internals’) as opposed to being outside one’s control (categorized as ‘Externals’).
However, the original Rotter’s (1966) LOC inventory was truncated after
retaining only those items which are more of a personal rather than of a general characteristic. The reliability of adapted version of LOC inventory was estimated using parallel forms method on a sample of 100 employees and was found to be reliable.
Furthermore, the demographic variables such as age, monthly salary and
work experience were used to check their impact on role stress experience of employees. Apart from these, employee belongingness to the type of bank, either public or private, was also explored. Four variables were introduced as performance indicators, namely, number of promotions, rewards, appreciation and increments received for good performance. The amount of additional work carried out by the employee was also sought as an organizational variable.
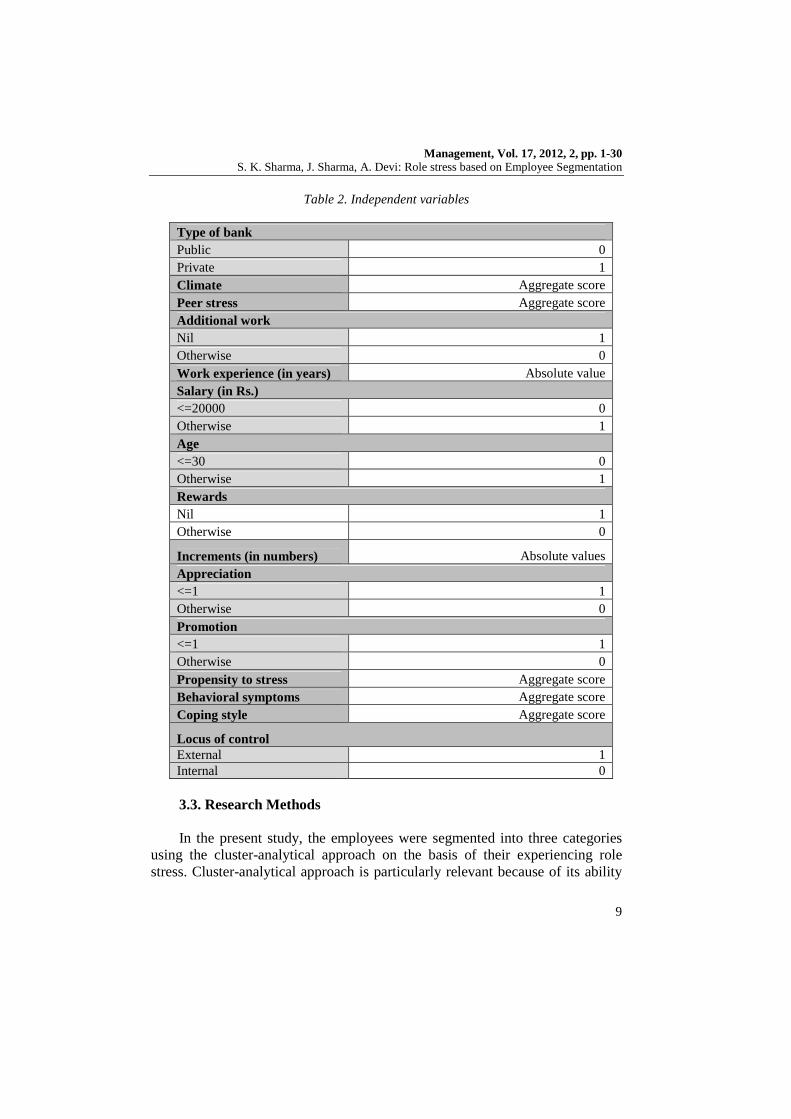
Table 2. gives information on various independent variables used in the
study. The final instrument so developed was then used for the survey. The estimation of the model was carried out using E-Views 6.1 and SPSS 14.0.
Management, Vol. 17, 2012, 2, pp. 1-30 S. K. Sharma, J. Sharma, A. Devi: Role stress based on Employee Segmentation
9
Table 2. Independent variables
Type of bank Public 0 Private 1 Climate Aggregate score Peer stress Aggregate score Additional work Nil 1 Otherwise 0 Work experience (in years) Absolute value Salary (in Rs.) <=20000 0 Otherwise 1 Age <=30 0 Otherwise 1 Rewards Nil 1 Otherwise 0
Increments (in numbers) Absolute values Appreciation <=1 1 Otherwise 0 Promotion <=1 1 Otherwise 0 Propensity to stress Aggregate score Behavioral symptoms Aggregate score Coping style Aggregate score
Locus of control External 1 Internal 0 3.3. Research Methods In the present study, the employees were segmented into three categories
using the cluster-analytical approach on the basis of their experiencing role stress. Cluster-analytical approach is particularly relevant because of its ability

Management, Vol. 17, 2012, 2, pp. 1-30 S. K. Sharma, J. Sharma, A. Devi: Role stress based on Employee Segmentation
10
to minimize within-group variance and maximize the between-group variance resulting in heterogeneous groups with homogenous contents (Satish and Bharadhwaj, 2010). A hierarchical method in conjunction with non-hierarchical clustering methods were used in the present case as initially the hierarchical method could be used to determine the number of cluster solutions and then the non-hierarchical clustering method to refine each of the solutions (Sharma and Kumar, 2006).
The application of cluster analysis using the Ward’s Hierarchical method,
with squared Euclidean measure of distance to cluster the respondents, resulted into the amalgamation of two clusters, at each step, that resulted in the smallest increase in the overall sum of the squared within-cluster distances. The overall score for each construct identified after applying factor analysis was calculated by adding the scores for each included item and dividing this by the number of items in that component (Fünfgeld and Wang, 2000) as the factor scores are often less interpretable and generalizable than using simpler approaches such as summing or averaging the items that load on the factors (Gorsuch, 1988). That way the employees were segmented (see Appendix I).
The agglomeration coefficient results obtained using the Ward’s
Hierarchical method to cluster the respondents indicated an increase in the case of five to four clusters of 5.0 percent; four to three clusters of 8 percent, three to two clusters of 12.67 percent; and two to one cluster of 10.49 percent. Since the highest percentage increase occurred when going from three to two clusters, it seemed that a three-cluster solution would be the optimal choice. A visual inspection of the dendrogram also indicated a three-cluster solution to be a valid choice. Moreover, the use of other methods of cluster analysis and the comparison of resulting solutions for interpretation of the clusters was also suggested (Sharma and Kumar, 2006), the application of which further substantiates the idea that employees can be best divided in 3 clusters. The results obtained through K-means, a non-hierarchical cluster analysis approach also supplemented the 3-cluster solution. The choice of the three-cluster solution was also supported when one-way analysis of variance was performed taking the cluster membership as a factor variable and role stress constructs as dependent variables. On all the constructs of role stress, the clusters were significantly different at 1 percent and 10 percent level of significance and respondents were also evenly divided into three clusters.
Considering all these issues, the sample of employees is considered to be
better segmented in three clusters. The stability of cluster should be endorsed by the cross-validation procedure (Breckenridge, 2000) and the same was carried

Management, Vol. 17, 2012, 2, pp. 1-30 S. K. Sharma, J. Sharma, A. Devi: Role stress based on Employee Segmentation
11
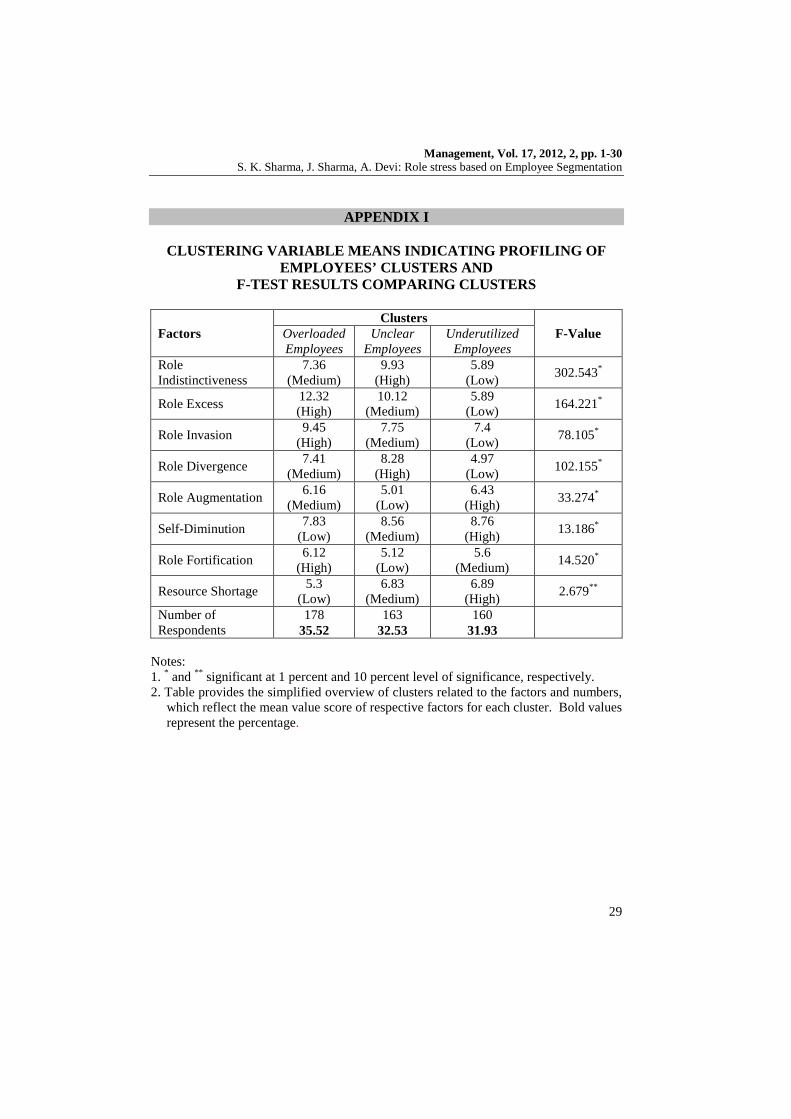
out to ensure the validity of this three-cluster solution. The naming of the clusters was determined by the distinguishing characteristics prevalent in the three segments of the respondents revealed through mean values scored on each of the constructs of role stress. The three clusters were named ‘Overloaded‘ (‘OL’, N=178), ‘Unclear‘ (‘UC’, N=163), and ‘Underutilized‘ (‘UU’, N=160). The ‘overloaded’ cluster of employees was found to be weighed down with excess amount of work. The ‘unclear’ cluster, on the other hand, is the one the most bothered by the ambiguity at workplace which is evident in the unclear duties, responsibilities, expectations and directions in their roles. Lastly, the ‘underutilized’ cluster consists of that set of employees who feel that their potential is not fully used at work. Cluster groups and their association with demographic and performance related variables was assessed and found to be significant (see Appendix I).
In order to assess the relationship of various organizational, demographic
and personality related variables with role stress experiences of employees who have been so grouped, the multinomial logit (MNL) analysis was used. As the explained or dependent variable, i.e. clusters of employees, is a qualitative/categorical variable in nature comprising three categories, namely, OL, UC, UU, the polychotomous or MNL with nominal scale has been preferred over the ordinary least square model to measure the relationship. The application of MNL encompassed situations involving more than two choices in a criterion variable (Lee et al. 2005). With three outcomes, multinomial logit is better instead of running three binary logits comparing outcomes 1 to 2, 1 to 3, and 2 to 3 (Long, 1997). The MNL analysis estimates the log-odds ratio, marginal effects and the related indicators which facilitates the comparison of levels of the criterion variable.
In this study, the overloaded cluster (OL) was used as the base (reference
category), enabling a direct comparison of the unclear cluster (UC) and the underutilized cluster (UU) with the OL cluster. OL was documented as the major source of stress irrespective of the organization and status (Janice, 1995) and pointed out as most obvious case of stress at work (Statt, 1994). In addition, overloaded employees are more likely to make mistakes, feel anger or resentment toward their employers, co-workers, experience poorer health and work-family balance and seek employment elsewhere (Galinsky et al., 2001; Kalleberg, 2008). Given such potential repercussions, OL was used as the reference category in the present study. In the MNL analysis based on the cumulative logistic distribution function, two log-odds ratios were estimated:
ln (PUC/POL), and ln (PUU/POL) (1),
Management, Vol. 17, 2012, 2, pp. 1-30 S. K. Sharma, J. Sharma, A. Devi: Role stress based on Employee Segmentation
12
where: • PUC = probability that an individual belongs to the unclear cluster, • PUU = probability that an individual belongs to the underutilized cluster, • POL = probability that an individual belongs to the overloaded cluster.
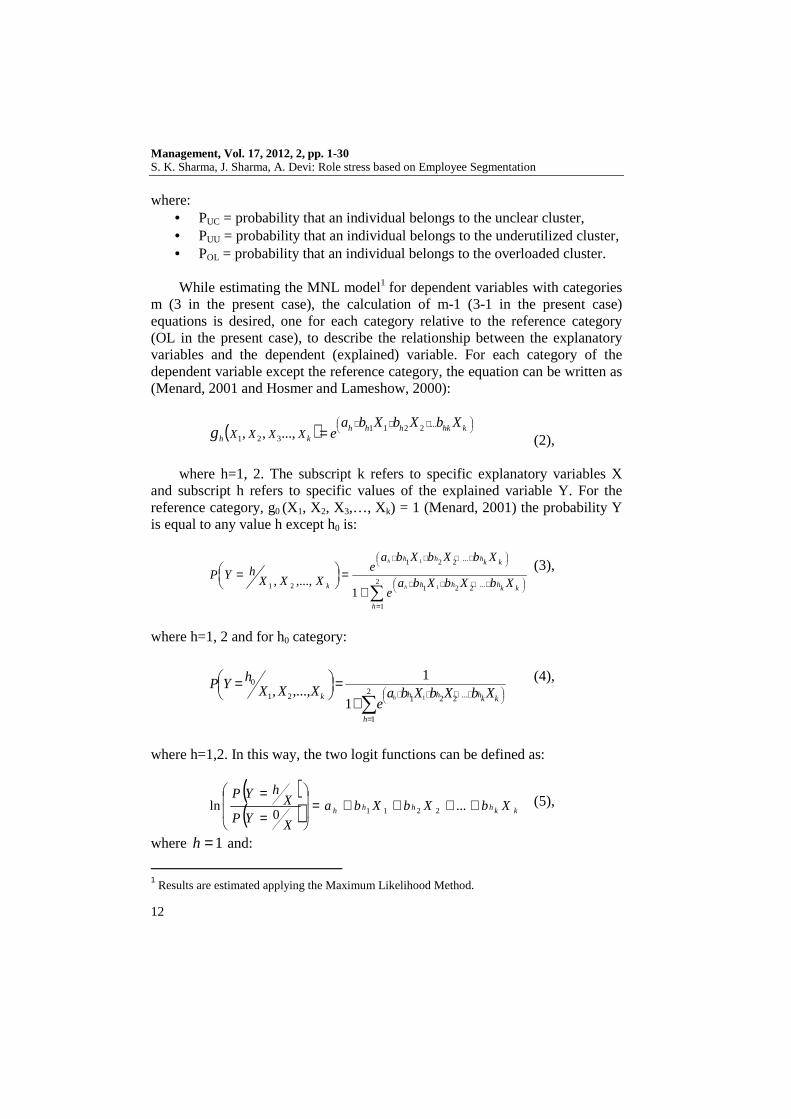
While estimating the MNL model1 for dependent variables with categories
m (3 in the present case), the calculation of m-1 (3-1 in the present case) equations is desired, one for each category relative to the reference category (OL in the present case), to describe the relationship between the explanatory variables and the dependent (explained) variable. For each category of the dependent variable except the reference category, the equation can be written as (Menard, 2001 and Hosmer and Lameshow, 2000):
( )
+++
= khkhhhkh
XbXbXbaeXXXXg
...2211321 ...,,, (2),
where h=1, 2. The subscript k refers to specific explanatory variables X
and subscript h refers to specific values of the explained variable Y. For the reference category, g0 (X1, X2, X3,…, Xk) = 1 (Menard, 2001) the probability Y is equal to any value h except h0 is:
∑=
++++
++++
+=
=
2
1
...221
...221
21 1
1
1,...,,
h
kkhhh
kkhhh
k XbXbXbae
XbXbXbae
XXXhYP
h
h (3),
where h=1, 2 and for h0 category:
∑=
++++
+=
=
2
1
...22121
0
1
1
1,...,,
h
kkhhhk XbXbXbae
XXXhYP
h
(4),
where h=1,2. In this way, the two logit functions can be defined as:
( )( ) kkhhhh XbXbXba
XYPX
hYP++++=
=
=...
0ln 2211
(5),
where 1=h and:
1 Results are estimated applying the Maximum Likelihood Method.
Management, Vol. 17, 2012, 2, pp. 1-30 S. K. Sharma, J. Sharma, A. Devi: Role stress based on Employee Segmentation
13
( )( ) kkhhhh XbXbXba
XYPX
hYP++++=
=
=...
0ln 2211
(6),
where h = 2.
Further, the marginal effects2, which are the probability that an employee, with certain characteristics, is in a specific cluster category i.e. OL, UC and UU, were also estimated.
Here, it is pertinent to note that in the case of odds ratio, the estimated
values are relative to a particular cluster category while in the case of marginal effects, the results are interpreted across the three cluster categories. The odds are equal to the exponential of the coefficients with all other independent factors held constant.
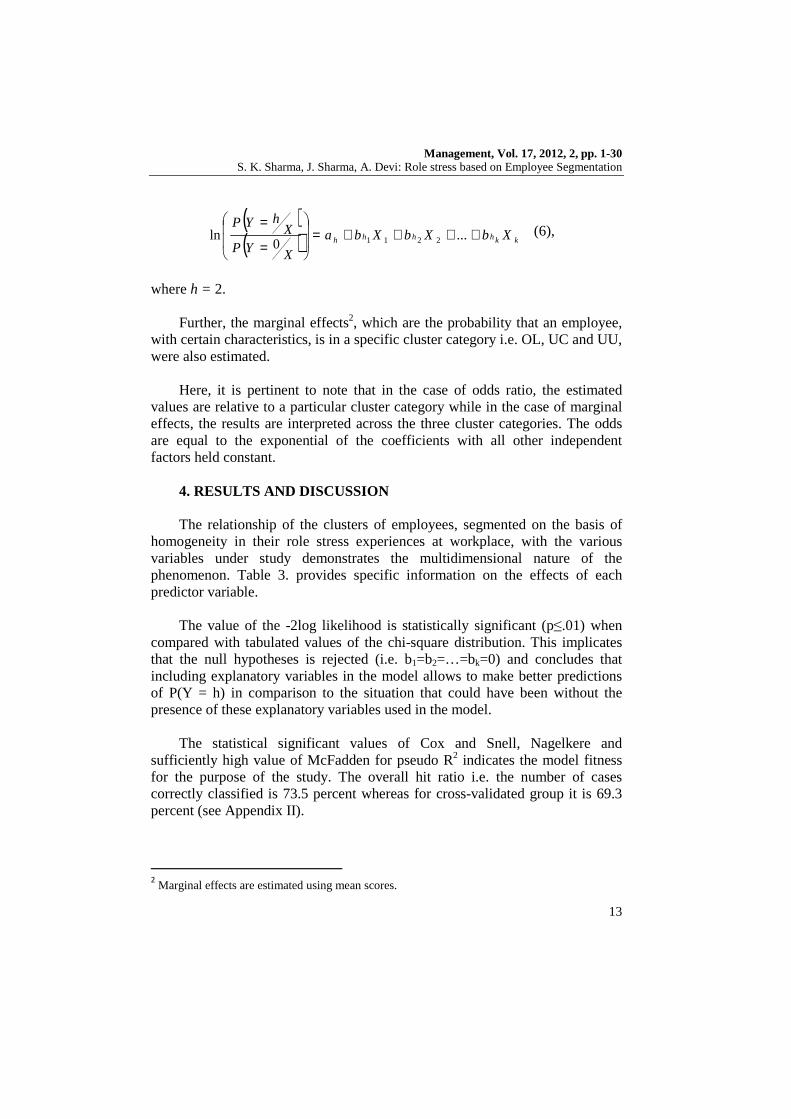
4. RESULTS AND DISCUSSION The relationship of the clusters of employees, segmented on the basis of
homogeneity in their role stress experiences at workplace, with the various variables under study demonstrates the multidimensional nature of the phenomenon. Table 3. provides specific information on the effects of each predictor variable.
The value of the -2log likelihood is statistically significant (p≤.01) when
compared with tabulated values of the chi-square distribution. This implicates that the null hypotheses is rejected (i.e. b1=b2=…=bk=0) and concludes that including explanatory variables in the model allows to make better predictions of P(Y = h) in comparison to the situation that could have been without the presence of these explanatory variables used in the model.
The statistical significant values of Cox and Snell, Nagelkere and
sufficiently high value of McFadden for pseudo R2 indicates the model fitness for the purpose of the study. The overall hit ratio i.e. the number of cases correctly classified is 73.5 percent whereas for cross-validated group it is 69.3 percent (see Appendix II).
2 Marginal effects are estimated using mean scores.
Management, Vol. 17, 2012, 2, pp. 1-30 S. K. Sharma, J. Sharma, A. Devi: Role stress based on Employee Segmentation
14
Table 3. Results of Multinomial Logit Analysis: Parameter Estimates
Model I - ln(PUC/POL)# Model II - ln(P UU/POL)##
Β Standard
Error Odds Ratio
Β Standard
Error Odds Ratio
Intercept 21.555* 3.054 45.578* 4.062 Organizational Variables Type of bank 1.006* 0.328 2.734 1.136* 0.423 3.114 Climate -0.263* .057 0.769 -0.470* 0.075 0.625 Peer stress -0.410* 0.073 0.664 -0.521* 0.089 0.594 Additional work 0.728** 0.315 2.072 0.222 0.410 1.248 Demographic Variables Work experience -0.043** .021 0.958 -0.060** 0.028 0.942 Salary 0.845** 0.351 2.329 0.391 0.454 1.478 Age 0.410 0.424 1.507 1.356** 0.539 3.881 Performance Variables Rewards 0.937* 0.335 2.552 0.773*** 0.424 2.165 Increments -0.112 0.121 0.894 0.026 0.155 1.027 Appreciation 0.191 0.303 1.211 -0.411 0.398 0.663 Promotion -0.048 0.320 0.953 0.096 0.433 1.101 Personality Variables Propensity to stress
-0.538* 0.080 0.584 -0.970* 0.103 0.379
Behavioral symptoms
-0.166* 0.042 0.847 -0.427* 0.057 0.652
Coping style 0.067* 0.024 1.070 -0.007 0.034 0.993 Locus of control -0.228 0.321 0.796 -0.872** 0.412 0.418 Cox and Snell R2 0.642 Nagelkerke R2 0.723 Mcfadden R2 0.468 Likelihood ratio -292.37 -2log likelihood 514.95* Chi-square 508.93*
Notes: # ln(PUC/POL) - probability of being in unclear cluster over overloaded cluster; ## ln(PUU/POL) - probability of being in underutilized cluster over overloaded cluster; * statistically significant at 1 percent level of significance, ** statistically significant at 5 percent level of significance, *** statistically significant at 10 percent level of significance.

Management, Vol. 17, 2012, 2, pp. 1-30 S. K. Sharma, J. Sharma, A. Devi: Role stress based on Employee Segmentation
15
4.1. Role Stress Based Clusters and Organizational Variables The odds ratio estimated in the MNL regression model describes the ratio
of the odds of an event occurring in one group to the odds of it occurring in another group. A look at the odds ratios (see Table 3.) demonstrates that employees of private sector banks are more likely to be segmented in the UC and UU clusters in comparison to the OL cluster.
It is found that there are 2.734 and 3.114 odds in favor of the UC and UU
clusters respectively for private sector banks. It implies that employees, in private sector banks, perceive the lack of properly using their capabilities and the non-clarity in role expectations to be the relatively greater cause of their role stress.
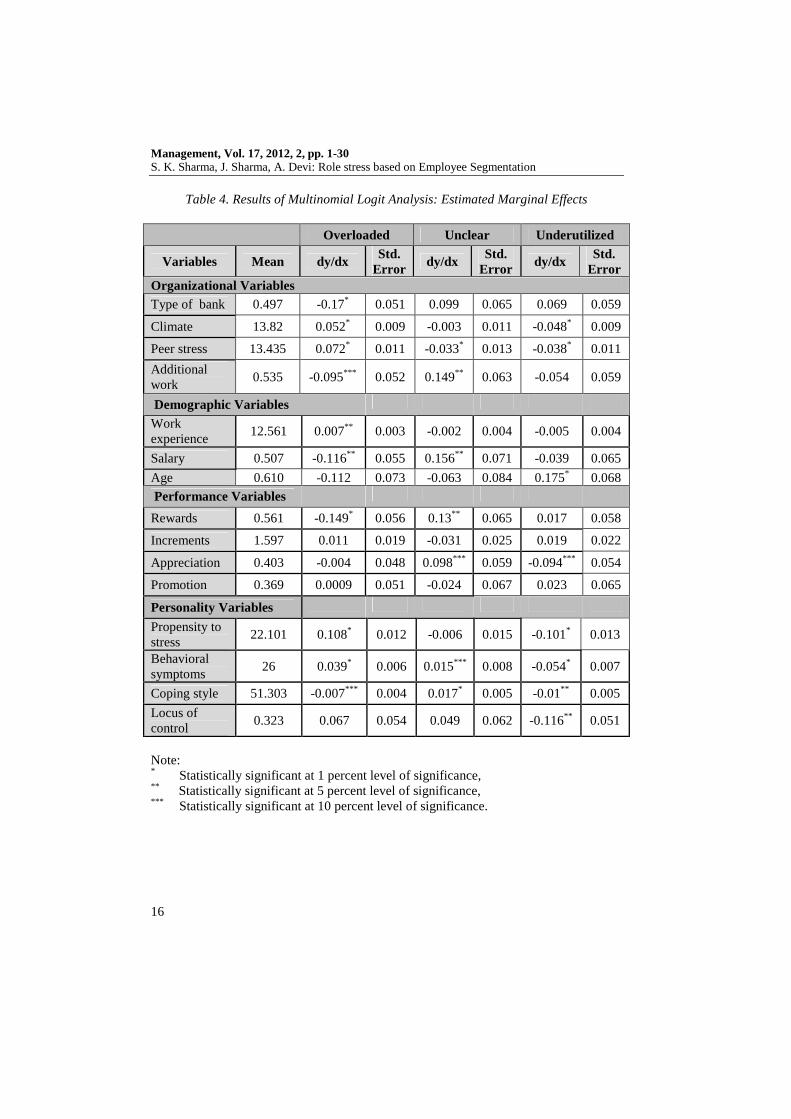
Further, the marginal effects (presented in Table 4.), which depict the
probability that an employee with a certain characteristic is in a specific cluster, specifies that there are 17 percent less chances that an employee from private sector bank would fall in the OL cluster.
Besides, the results indicate that the perceived unfavorableness of climate leads to an increase in odds for the OL cluster. A similar kind of evidence has been provided by marginal effects, which also signify that the unfavorableness of organizational climate results makes it more likely for employees to be a part of the OL cluster (5.2 percent) and less likely to be a part of the UU cluster (4.8 percent).
In addition, when employees perceive higher peer stress, the chances of
their segmentation in the OL cluster also increases as odds are in favor of the OL cluster and marginal effects also show a resultant increase in the employee membership chances in the OL cluster by 7.2 percent.
Further, employees having no additional work are more likely to be
segmented in the UC cluster as compared to the OL cluster. Though the interpretation of the estimated coefficients for a continuous variable is similar to that of nominal scale variables the primary difference is that a meaningful interpretation must be addressed for the continuous variable (Hosmer and Lameshow, 2000).
Management, Vol. 17, 2012, 2, pp. 1-30 S. K. Sharma, J. Sharma, A. Devi: Role stress based on Employee Segmentation
16
Table 4. Results of Multinomial Logit Analysis: Estimated Marginal Effects
Overloaded Unclear Underutilized
Variables Mean dy/dx Std.
Error dy/dx
Std. Error
dy/dx Std.
Error Organizational Variables Type of bank 0.497 -0.17* 0.051 0.099 0.065 0.069 0.059
Climate 13.82 0.052* 0.009 -0.003 0.011 -0.048* 0.009
Peer stress 13.435 0.072* 0.011 -0.033* 0.013 -0.038* 0.011
Additional work
0.535 -0.095*** 0.052 0.149** 0.063 -0.054 0.059
Demographic Variables
Work experience
12.561 0.007** 0.003 -0.002 0.004 -0.005 0.004
Salary 0.507 -0.116** 0.055 0.156** 0.071 -0.039 0.065
Age 0.610 -0.112 0.073 -0.063 0.084 0.175* 0.068
Performance Variables
Rewards 0.561 -0.149* 0.056 0.13** 0.065 0.017 0.058
Increments 1.597 0.011 0.019 -0.031 0.025 0.019 0.022
Appreciation 0.403 -0.004 0.048 0.098*** 0.059 -0.094*** 0.054
Promotion 0.369 0.0009 0.051 -0.024 0.067 0.023 0.065
Personality Variables
Propensity to stress
22.101 0.108* 0.012 -0.006 0.015 -0.101* 0.013
Behavioral symptoms
26 0.039* 0.006 0.015*** 0.008 -0.054* 0.007
Coping style 51.303 -0.007*** 0.004 0.017* 0.005 -0.01** 0.005
Locus of control
0.323 0.067 0.054 0.049 0.062 -0.116** 0.051
Note: * Statistically significant at 1 percent level of significance, ** Statistically significant at 5 percent level of significance, *** Statistically significant at 10 percent level of significance.

Management, Vol. 17, 2012, 2, pp. 1-30 S. K. Sharma, J. Sharma, A. Devi: Role stress based on Employee Segmentation
17
4.2. Role Stress Based Clusters and Demographic Variables On the demographic variables front, an employee with more work
experience is less likely to be segmented in the UC and UU clusters. It seems that the experience gained by the employee aids in clearing the ambiguity at work and in satisfying the urge for proper utilization of capabilities, however, it may also lead to work overload. On the other hand, contradictory results have been reported for age variable where increasing age increases the chances of an employee grouping in the UU cluster. Rani (2001) also corroborated the relationship between age and role stress and emphasized that role stagnation, depicted by perception of underutilization, is experienced more by older employees as compared to younger ones. In addition, with an increase in salary, the odds are in favor of employee segmentation in the UC cluster. The results of marginal effect also point out that there are 11.6 percent less chances that an employee with a salary of more than Rs. 20,000 would fall into the category of OL whereas there are 15.6 percent more chances that such an employee would fall in the UC cluster.
4.3. Role Stress Based Clusters and Performance-Related Variables
Amongst the performance related predictors, it was revealed that an
employee is more likely to be clustered in the UC and UU segments when he did not receive a reward for his performance. It indicates that administration of no rewards to the employees is associated with non-clarity and perception of underutilization at work. This is being reinforced by marginal effects which confirm that an employee with no rewards is found to have 13 percent chances of falling in the UC cluster. Although the odds ratio of other performance related variables, namely, promotion, increments and appreciation did not show statistically significant results on cluster membership, the marginal effects of appreciation were nonetheless found to be statistically significant at 10 percent level of significance for the UC and UU clusters. It was revealed that the chances of employees coming together in the UC cluster rise by 9.8 percent and fall for the UU cluster by 9.4 percent when employees receive at most one appreciation.
4.4. Role Stress Based Clusters and Personality Related Variables Higher stress propensity and behavioral strain increases the probability of
employee segmentation in the OL cluster. This is also corroborated by the results of marginal effects which put in view that the chances of falling in the OL cluster rise by 10.8 percent and 3.9 percent for employees with higher

Management, Vol. 17, 2012, 2, pp. 1-30 S. K. Sharma, J. Sharma, A. Devi: Role stress based on Employee Segmentation
18
propensity and behavioral symptoms respectively. Similar relationships were found for the association between role overload, role ambiguity and outcomes like fatigue, tension, anxiety and anger-irritation (Beehr et al. 1976; Harrison, 1978). A positive relationship between behavioral symptom and role overload was also been reported by Keenan and McBain (1979). Furthermore, the avoidance coping style predicts employee membership in the UC cluster over the OL cluster. In this direction, Havlovic and Keenan (1991) also suggested that ambiguity may restrain an employee from using direct action. The results point out the role played by personality in determining the role stress based segments where stress propensity and behavioral strain may add to the employees’ perception of being overloaded and avoidance coping style may reinforce non-clarity. Moreover, Latack (1986) and Havlovic and Keenan (1991), also suggested that the less frequent use of direct action may be likely in the face of ambiguity in roles. Similarly, external locus of control increases the probability of employee segmentation in the OL cluster in comparison to its counterparts. While exploring the relationship between locus of control and role stress, Malik and Sabharwal (1999) also found that one of the areas in which individuals with external locus of control received more stress is role overload. The reliance of ‘externals’ on chance and other individuals may limit their capacity to take active steps towards shedding off that extra workload which consequently, leads to even greater work overload.
5. CONCLUSION AND IMPLICATIONS The foregoing analysis has added to the comprehension of the
heterogeneity in the predictors of role stressed workforce of commercial banks implying that substantial differences exist in the three segments of the role stressed employees. The role stress based employee segments, namely overloaded, unclear and underutilized are, therefore, qualitatively distinct segments and must not be lumped together.
In terms of policy suggestions, it may be argued that public sector
commercial banks must institute mechanism to rationalize work amongst its workforce as the OL cluster is found to be more prevalent there as compared to other clusters. The private sector commercial banks, on the other hand, must initiate the development of platforms to intensify communication throughout the workplace which would not only reduce ambiguity at work but also help employees to prioritize the tasks for better management of work. Employee perception of underutilization is also of prime concern to the private sector banks as the odds of the UU cluster have been found to be more in comparison to the OL cluster.
Management, Vol. 17, 2012, 2, pp. 1-30 S. K. Sharma, J. Sharma, A. Devi: Role stress based on Employee Segmentation
19
The commercial banks are also required to wake up to the fact that role stress has multifaceted relationship with performance-related benefits. Where performance benefits can lower the perception of underutilization at workplace, it may also increase the workload of employees. Nevertheless, an organization aiming at reducing the role stress at work faces an uphill task in optimizing utilization of the capabilities of its workforce and at the same time not increasing the workload of employees beyond a functional level. The demographic variables also provide important information for the role stress management as, for example, the commercial banks must make sure that, with increasing work experience, the employees are not bombarded with work overload. It has been revealed in the study that the rise in work experience has been associated with a probability for an employee to fall in the OL cluster. Therefore, proper mechanisms should be instituted for employee assistance in the role. Moreover, increasing age raises the chances of employee grouping in the UU cluster which indicates the need for a well-knit human resource function emphasizing the development, utilization and maintenance of employees.
The results also imply the contribution of personality factors in
determining the dynamics of role stress at workplace. The high propensity and behavioral symptoms demonstrated by the overloaded cluster of employees point out one of the important determinants of work overload of employees which may lie hidden in their personality. The role stress based clusters of employees are associated to their coping style and locus of control. Emphasizing the role of personality in relation to role stress in the workplace could lead to perceiving role stress as a personal weakness. The relation of personality variables with role stress based clusters of the bank employees implies the usefulness of employee training in managing the personality attributes like propensity, locus of control, work behavior, etc. for the role stress management. Management development programs, workshops and activities can also be used to create awareness of the nature of role stress and assist employees to cope effectively. Behavioral modification and psychological therapy methods may be structured so as to focus on the personality constructs.
The study adds to the literature on role stress and the impact of various
factors on role stress of employees. Not only is it theoretically meaningful to understand the heterogeneity in the experience of role-stress but also the analysis of clustered employees has important implications for role stress based employee segmentation and targeted role stress management interventions. Careful and well-planned implementation strategies conducive to the requirements of each cluster can provide fruitful results to the employees and organization.
Management, Vol. 17, 2012, 2, pp. 1-30 S. K. Sharma, J. Sharma, A. Devi: Role stress based on Employee Segmentation
20
6. LIMITATIONS AND DIRECTIONS FOR FUTURE RESEARCH The study has contributed to the comprehension of a number of
determinants of role stress based segments of employees. However, while drawing conclusions, it is important to keep in mind the limitations of the self-reporting nature of survey responses. Although the fact that self-report questionnaires increase the chances of common method variance effects (Fairbrother and Warn, 2003), the use of Harman’s one-factor method test to identify the problem of common method variance with the application of factor analysis (Padsakoff et al. 2003) in the present composition reveals that neither a single factor nor a general factor account for the majority of the variance. Moreover, the findings derived from the study are only limited to the front-line employees working in commercial banking organizations. This limits the findings from other population working in back-end operations in the banking sector and employees working in organizations other than the banking sector. Future research can also incorporate examination of change in cluster membership of the respondents on account of the and the interventions adopted by organization and employees. Some elements of longitudinal data could be an enormous help in making a stronger contribution to the field of role stress. Furthermore, the type of role stressors experienced by an employee and their segmentation on that basis can be further validated by studying the responses from their peers, family members, friends, etc. Finally, future research can be planned to validate the robustness of the model through the lens of qualitative research methods which can also provide more authenticity to it. REFERENCES
1. Abbey, A.; Dickson, J. W. (1983). R and D work climate and innovation in semi-conductors. Academy of Management Journal, 26: 362-368.
2. Ahmad, S. F.; Shah, F. A. (2007). Role stress of officers and clerks: An empirical study in banking industry. Business Review, 12 (2): 1-9.
3. Akinnusi, D. M. (1994). Relationship between personal attributes, stressors, stress reactions and coping styles. Management and Labour Studies, 19 (4): 211-218.
4. Anderson, C. R. (1976). Coping behaviors as intervening mechanisms in the inverted-U stress-performance relationship. Journal of Applied Psychology, 61(1): 30-34.
5. Anton, C. (2009). The impact of role stress on workers’ behaviour through job satisfaction and organizational commitment. International Journal of Psychology, 44(3): 187-194.
Management, Vol. 17, 2012, 2, pp. 1-30 S. K. Sharma, J. Sharma, A. Devi: Role stress based on Employee Segmentation
21
6. Aziz, M. (2003). Organizational role stress among Indian information technology professionals. Asian-Pacific Newsletter on Occupational Health and Safety, 10(2): 31-39.
7. Aziz, M. (2004). Role stress among women in the Indian information technology sector. Women in Management Review, 19(7): 356-363.
8. Beehr, T. A. (1995). Psychological Stress in the Workplace. London: Routledge.
9. Beehr, T. A.; Glazer, S. (2005). Organizational role stress. In Barling, J., Kelloway, E. K.; Frone, M. R. (Eds), Handbook of Work Stress (pp. 7-33). CA: Sage, Thousand Oaks.
10. Beehr, T. A.; Newman, J. E. (1978). Job stress, employee health and organizational effectiveness: A facet analysis, model and literature review. Personnel Psychology, 31: 665-699.
11. Beehr, T. A.; Walsh, J. T.; Taber, T. D. (1976). Relationship of stress to individually and organizationally valued states: Higher order needs as a moderator. Journal of Applied Psychology, 61(1): 41-47.
12. Bettencourt, L. A.; Brown, S. W. (2003). Role stressors and customer-oriented boundary-spanning behaviors in service organizations. Journal of the Academy of Marketing Science, 31 (4): 394-408.
13. Billings, A. G.; Moos, R. H. (1981). The role of coping responses and social resources in attenuating the stress of life events. Journal of Behavioral Medicine, 4: 139–157.
14. Blanc, P. L.; Jonge, J. De, Schaufeli, W. (2008). Job stress and occupational health. In Nikchmiel (Ed.), An introduction to work and organizational psychology A European perspective. Blackwell.
15. Boles, J. S.; Johnston, M. W.; Hair, J. F. (1997). Role stress, work-family conflict and emotional exhaustion: Interrelationships and effects on some work-related consequences. Journal of Personal Selling and Sales Management, 17(1): 17-28.
16. Breckenridge, J. N. (2000). Validating cluster analysis: Consistent replication and symmetry. Multivariate Behavioural Research, 35: 261-265.
17. Brown, S. P.; Peterson, R. A. (1993). Antecedents and consequences of salesperson job satisfaction: Meta-analysis and assessment of causal effects. Journal of Marketing Research, 30, 63-77.
18. Burke, R. J. (1988). Sources of managerial and professional stress in large organization. In Cooper C. L. Payne, R. (Eds.), Causes, coping and consequences of stress at work (pp. 77-112). Chicester: John Wiley and Sons.
19. Calisir, F.; Gumussoy, C. A. (2011). Factors affecting intention to quit among IT professionals in Turkey. Personnel Review, 40 (4), 514-33.
Management, Vol. 17, 2012, 2, pp. 1-30 S. K. Sharma, J. Sharma, A. Devi: Role stress based on Employee Segmentation
22
20. Caplan, R. D. (1985). Psychosocial stress in work. Management and Labour Studies, 10(2): 63-76.
21. Chandriah, K.; Agrawal, M.; Manoharan, N. (2003). Occupational stress and job satisfaction among managers. Indian Journal of Occupational and Environmental Medicine, 7(2): 6-11.
22. Choo,F. (1986). Job stress, job performance, and auditor personality characteristics. Auditing: A Journal of Practice and Theory, 5(2):17-32.
23. Clayson, D. E.; Frost, T. F. (1984). Impact of stress and locus of control on the concept of self. Psychological Reports, 55: 919-926.
24. Cooper, C. L.; Roden, J. (1985). Mental health and satisfaction among tax officers. Social Science and Medicine, 21: 747-751.
25. Cooper, C. L. (1981). Executive families under stress. Englewood Cliffs: Prentice Hall.
26. Cox, T. (1993). Stress research and stress management: Putting theory at work. HSE Contract Research Report, 25, London: HMSO.
27. Cox, T.; Griffiths, A. (2010). Work related stress: A theoretical perspective. In Occupational Health Psychology edited by Stavroula Leka and Jonathan Houdmont, Wiley, Blackwell.
28. Dasgupta, H.; Kumar, S. (2009). Role stress among doctors working in a government hospital in Shimla (India). European Journal of Social Sciences, 9 (3): 356-370.
29. Donio, J.; Massari, P.; Passinate, G. (2006). Customer satisfaction and loyalty in a digital environment: An empirical test. Journal of Consumer Marketing, 23(7): 445-57.
30. Dubinsky, A. J.; Yammarino, F. J. (1984). Differential impact of role conflict and ambiguity on selected correlates: A two sample test. Psychological Reports, 55: 699-707.
31. Elango, B. (2011). Does market context impact payoffs to internationalization? European Business Review, 23(5): 434-453.
32. Eysenck, H. J (1983). Stress, disease, and personality: The ‘inoculation effect’. In Cooper, C. L. (Ed.), Stress Research (pp. 121-126). New York: John Wiley and Sons, Ltd.
33. Fairbrother, K.; Warn, J. (2003). Workplace Dimensions, Stress and Job Satisfaction, Journal of Managerial Psychology, 18(1): 8-21.
34. Fernandes, C. F. V.; Kumar, S.; Mekoth, N. (2009). Gender differences in stress among bank officers of private and public sectors. The ICFAI University Journal of Organizational Behavior, VIII (2): 63-69.
35. Ferrando, P. J.; Anguiano-Carrasco, C.; Chico, E. (2011). The impact of acquiescence on forced choice responses: A model based analysis. Psicologica, 32: 87-105.
Management, Vol. 17, 2012, 2, pp. 1-30 S. K. Sharma, J. Sharma, A. Devi: Role stress based on Employee Segmentation
23
36. FICCI, Federation of Indian Chambers of Commerce and Industry (2010). Indian Banking System: The Current State and Road Ahead, Annual Survey, New Delhi.
37. Flynn, B. B.; Schroeder, R. G.; Sadao, S. (1991). Reliability and validity analysis of a proposed quality management measurement instrument. Academy of Management Proceedings.
38. Fried, Y.; Arie, S.; Gilboa, S.; Cooper, C. L. (2008). The mediating effects of job satisfaction and propensity to leave on role stress-job performance relationships: Combining meta-analysis and structural equation modeling. International Journal of Stress Management, 15(4): 305-328.
39. Fünfgeld, B.; Wang, M. (2009), Attitudes and Behaviour in Everyday Finance: Evidence from Switzerland, International Journal of Bank Marketing, 27(2):108-128.
40. Galinsky, E.; Kim, S. S. Bond, J. T. (2001), Feeling overworked: when work becomes too much, available at: www.imageplus.com/FEELING_ OVERWORKED_FINAL.pdf
41. Ganster, D.; Fusilier, M. (1989). Control in the workplace. In Cooper, C. L.; Robertson, I. T. (Eds.), International review of industrial and organizational psychology,Wiley.
42. Glazer, S.; Beehr, T. A. (2005). Consistency of implications of three role stressors across four countries. Journal of Organizational Behaviour, 26 (5): 467-487.
43. Gmelch, W. H.; Chan, W. (1994). Thriving on stress for success. Thousand Oaks, CA: Corwin Press.
44. Gorsuch, R. L. (1988). Exploratory Factor Analysis in Nesserlroade, J. R.; Cattell, R. B. Handbook of Multivariate Experimental Psychology (Second Ed.,) Plenum Press, New York.
45. Hair, Joseph F. Anderson, Rolph E., Tatham, Ronald L., Black, William C. (2006). Multivariate data analysis. New Delhi: Pearson Education.
46. Hariharan, Meena, and Rath, Radhanath (2008). Coping with life stress The Indian experience. New Delhi: Sage Publications.
47. Harrison, R.V. (1978). Personal environment fit and job stress. In C.L. Cooper and R. Payne (Eds.), Stress at Work. New York: Wiley.
48. Havlovic S. J. and Keenan J. P. (1991). Coping with work stress: The influence of individual differences. Journal of Social Behavior and Personality, 6 (7): 199-212.
49. Holahan, Charles J. and Moos, Rudolf H. (1987). Personal and contextual determinants of coping strategies. Journal of Personality and Social Psychology, 52(5): 946-55.

Management, Vol. 17, 2012, 2, pp. 1-30 S. K. Sharma, J. Sharma, A. Devi: Role stress based on Employee Segmentation
24
50. Hosmer, D.W. and Lameshow, S. (2000). Applied logistic regression. New York: John Wiley and Sons Inc.
51. http://articles.economictimes.indiatimes.com/2012-02-20/news/31079762_1_priority-sector-j-k-bank-banking-sector accessed on 20th feb., 2012.
52. Ivancevich, John M., M.T. Matteson, and C. Preston (1982). Occupational stress, type A behaviour, and physical well-being. Academy of Management Journal, 25(2): 373-91.
53. Jackson, S. and Schuler, R. (1985). A meta-analysis and conceptual critique of research on role ambiguity and role conflict in work setting. Organizational Behavior and Human Decision Processes, 36: 16-78.
54. Janice T.S. Ho, (1995). The Singapore executive: stress, personality and wellbeing. Journal of Management Development , 14 (4): 47 – 55.
55. Jena, P.; Pradhan, S. (2011). Impact of organizational role stress among library professionals of Odisha: A study. PEARL-A Journal of Library and Information Science, 5 (3): 1-8.
56. Judge, T. A.; Erez, A.; Bono, J. E.; Thoreson, C. J. (2003). The core-self evaluations scale: development of a measure. Personnel Psychology, 56: 303-333.
57. Kahn, R. L.; Wolfe, D.M.; Quinn, R. P.; Snoeck, J. D; Rosenthal, R. A. (1964). Organizational stress: Studies in role conflict and ambiguity. New York: Wiley.
58. Kalleberg, A. L. (2008). The mismatched worker: when people don’t fit their jobs. Academy of Management Perspectives, 22(1): 24-40.
59. Keenan, A.; McBain, G. D. M. (1979). Effects of type a behavior, intolerance of ambiguity and locus of control on the relationship between role stress and work related outcomes. Journal of Occupational Psychology, 52: 277-285.
60. Kemery, E. R.; Bedeian, A. G.; Mossholder, K. W.; Touliatos, J. (1985). Outcomes of role stress: A multi-sample constructive replication. Academy of Management Journal, 28(2): 363-375.
61. Knight, D. K.; Kim, H.-J.; Crutsinger, C. (2007). Examining the effects of role stress on customer orientation and job performance of retail salespeople. International Journal of Retail and Distribution Management, 35(5): 381-391.
62. Koeske, G.; Kirk, F.; Stuart A.; Koeske, R. D. (1993). Coping with job stress: Which strategies work best? Journal of Occupational and Organizational Psychology, 66: 319-335.
63. Lang, D.; Markowitz, M. (1986). Coping, individual differences, and strain: A longitudinal study of short-term role overload. Journal of Occupational Behaviour, 7: 195-206.

Management, Vol. 17, 2012, 2, pp. 1-30 S. K. Sharma, J. Sharma, A. Devi: Role stress based on Employee Segmentation
25
64. Latack, J. C. (1986). Coping with job stress: Measures and future directions for scale development. Journal of Applied Psychology, 71: 377-385.
65. Lawrence, E. A.; Winschel, J. F. (1975). Locus of control: Implications for special education. Exceptional Children, 41: 483-490.
66. Lee, E-J.; Kwon, K-N.; Schumann, D. W. (2005). Segmenting the non-adopter category in the diffusion of internet banking. International Journal of Bank Marketing, 23(5): 414-437.
67. Long, S. J. (1997). Regression models for categorical and limited dependent variables. Sage Publications,
68. Malik, A. K.; Sabharwal, M. (1999). Locus of control as a determinant of organizational role stress. Journal of the Indian Academy of Applied Psychology, 25: 61-64.
69. Malik, N. (2011). A study on occupational stress experienced by private and public bank employees in Quetta city. African Journal of Business Management, 5 (8): 3063-3070.
70. Margolis, B. L.; Kroes, W. H.; Quinn, R. P. (1974). Job stress: An unlisted occupational hazard. Journal of Occupational Medicine, 16: 654-661.
71. Martin, R.; Thomas, G.; Charles, K.; Epitropaki, O.; McNamara, R. (2005). The role of leader-member exchanges in mediating the relationship between locus of control and work reactions. Journal of Occupation and Organizational Psychology, 78(1):141-147.
72. Masood, R. Z. (2011). Stress management: A key to employee retention. Management Insight, 7(1): 100-111.
73. Menard, S. (2001). Applied Logistic Regression Analysis. A Sage University paper, California: Sage Publications.
74. Montgomery, M. R. (2012). Does an absence of managerial communication negatively influence job satisfaction? A quantitative examination of the correlation between job satisfaction and role conflict and role ambiguity among high-tech employees, CAPELLA University, Pub No. 3461658.
75. Narayanan L.; Menon, S.; Spector, P. E. (1999). Stress in the workplace: A comparison of gender and occupation. Journal of Organizational Behavior, 20: 63-73.
76. Nelson, D. L.; Burke, R. J. (2000). Women executives: Health, stress and success. Academy of Management Executive, 14(2): 107-121.
77. Nunnally, J. C.; Berstein, I. H. (1994). Psychometric Theory, New York: McGraw- Hill, Inc.
78. Padsakoff, P. M.; MacKenzie, S. B.; Lee, J. Y.; Padsokoff, N. P. (2003). Common Method Biases in Behavioural Research: A Critical

Management, Vol. 17, 2012, 2, pp. 1-30 S. K. Sharma, J. Sharma, A. Devi: Role stress based on Employee Segmentation
26
Review of the Literature and Recommended Remedies, Journal of Applied Psychology, 88 (5): 879-903.
79. Pareek, U. (1983). Role stress scale: ORS scale booklet, answer sheet and manual. Ahmedabad: Navin Publications.
80. Pareek, U. (1993). Making organizational roles effective. New Delhi: Tata McGraw Hill.
81. Payne, R. (1988). Individual differences in the study of occupational stress. In Cooper CL, Payne R, (Eds.), Causes, coping, and consequences of stress at work. Chichester, England: John Wiley and Sons.
82. Pelz, D. C. and Andrews, F. M. (1976). Scientists in organizations: Productive for research and development. University of Mishigan: Ann Arbor.
83. Pestonjee, D. M.; Singh, U. B. (1982). Job satisfaction as a function of role stress, locus of control, participation and organizational climate in an electric supply company. Manuscript, Ahmedabad: Indian Institute of Management.
84. Pestonjee, D. M.; Singh, U. B. (1983). EDP managers: An organizational behaviour study. Manuscript, Ahmedabad: Indian Institute of Management.
85. Rajeshwari, T. R. (1992). Employee stress: A study with reference to bank employees. Indian Journal of Industrial Relations, 27(4): 419-427.
86. Rani, L. (2001). Occupational stress among working women in emergency services. Management and Labour Studies, 26(1): 25-36.
87. Renn, R. W.; Vandenberg, R. J. (1991). Differences in employee attitudes and behaviors based on rotter's (1966) internal-external locus of control: Are they all valid?. Human Relations, 44: 1161-1178.
88. Rizzo, J.; House, R.; Robert, J.; Lirtzman, S. (1970). Role conflict and ambiguity in complex organizations. Administrative Science Quarterly, 15, 150-163.
89. Rotter, J. B. (1966). Generalized expectancies for internal vs external control of reinforcement. Psychological Monographs, 80(1): 609.
90. Sabharwal, N.; Soch, H.; Kaur, H. (2010). Are we satisfied with incompetent services? A scale development approach for service recovery. Journal of Services Research, 10(1): 125-142.
91. Sankpal, S.; Negi, P.; Vashishtha, J. (2010). Organisational role stress of employees: public vs. private banks. Indian Journal of Management, 3(1): 4-16.

Management, Vol. 17, 2012, 2, pp. 1-30 S. K. Sharma, J. Sharma, A. Devi: Role stress based on Employee Segmentation
27
92. Saravanan, P.; Lawrence, M. A. (2007). Occupational stress among the librarians of arts and science colleges. Library Progress (International), 27 (1): 51 – 57.
93. Satish, S. M.; Bharadhwaj, S. (2010). Information search behaviour among new car buyers: A two-step cluster analysis. IIMB Management Review, 22: 5-15
94. Schlenkar, J. A.; Gutek, B. A. (1987). Effects of role loss on work related attitudes. Journal of Applied Psychology, 72: 287-293.
95. Sen, P. C. (1981). A study of personal and organizational correlates of role stress and coping strategies in some public sector banks, Unpublished Ph.D. thesis, Gujarat University, Gujarat (India).
96. Shah, F. A. (2003). Role stress in the Indian industry: A study of banking organizations. Indian Journal of Industrial Relations, 38 (3): 281-96.
97. Shahu, R. and Gole, S.V. (2008). Effect of job stress and job satisfaction on performance: An empirical study. AIMS International Journal of Management, 2(3): 237-246.
98. Sharma, S. and Kumar, A. (2006). Cluster analysis and Factor analysis. http://www.terry.uga.edu/~rgrover/chapter_18.pdf, 1-65.
99. Sharma, S.; Sharma, J. (2008). A study of stress and cope-up strategies of service sector employees. Indian Management Studies Journal, 12: 19-35.
100. Sisson, K. and Marginson, P. (2000). The impact of economic and monetary union on industrial relations: A sectoral and company view. European Foundation for the Improvement of Living and Working Conditions, Dublin.
101. Spector, P. E. (1982). Behavior in organizations as a function of employee's locus of control. Psychological Bulletin, 91: 482-497.
102. Spector, P. E. Dwyer, D. J.; Jex, S. M. (1988). Relation of job stressors to affective, health, and performance outcomes: A comparison of multiple data sources. Journal of Applied Psychology, 73: 11-19.
103. Srivastava, Shalini (2009). Locus of control as a moderator for relationship between organizational role stress and managerial effectiveness. Vision-The Journal of Business Perspective, 13(4): 49-61.
104. Swanson, V.; Power, K. G. (1998). Occupational stress and family: A comparison of male and female doctors. Journal of Occupational and Organizational Psychology, 71(3), 237-260.
105. Tankha, G. (2006). A comparative study of role stress in government and private hospital nurses. Journal of Health Management, 8 (1): 11-22.

Management, Vol. 17, 2012, 2, pp. 1-30 S. K. Sharma, J. Sharma, A. Devi: Role stress based on Employee Segmentation
28
106. Tidd, S. T.; Friedman, R. A. (2002). Conflict style and coping with role conflict: An extension of the uncertainty model of work stress. International Journal of Conflict Management, 13(3): 236 – 257.
107. Vaez, M.; Laflamme, L. (2008). Experienced stress, psychological symptoms, self-rated health and academic achievement: A longitudinal study of Swedish university students. Social Behaviour and Personality, 36(2): 183-196.
108. Valadkhani, A.; Worthington, A. (2006). Ranking and clustering Australian university research performance, 1998-2002. Journal of Higher Education Policy and Management, 28 (2): 189-210.
109. Wetzels, M.; de Ruyter, K.; Bloemer, J. (2000). Antecedents and consequences of role stress of retail sales persons. Journal of Retailing and Consumer Services, 7: 65-75.
110. Wofford, J. C. (2002). Meta-analysis of relations of stress propensity with subjective stress and strain. Psychological Reports, 91: 1133-1136.
ODREDNICE STRESA ZASNOVANOG NA SEGMENTACIJI ZAPOSLENIKA: MULTINOMNA LOGISTI ČKA ANALIZA
Sažetak
Organizacije se suočavaju s brojnim izazovima, pri čemu je upravljanje stresom dobilo na značaju, s obzirom na njegove izrazito negativno učinke na zaposlenike i organizaciju u cjelini. Cilj je ovog rada utvrditi odrednice stvaranja klastera zaposlenika, zasnovanih na temelju stresa, doživljenog na radnom mjestu. Pritom su empirijski podaci prikupljeni za 550 operativnih zaposlenika komercijalnih banaka u saveznim državama Jammu i Kašmir (Indija). Uz pomoć multinomne logističke regresije analizirane su odrednice klastera zaposlenika, koje se odnose na organizaciju, demografiju, osobnost i performanse, pri čemu se korišteni softverski paketi E-Views 6.1 i SPSS 14.
Management, Vol. 17, 2012, 2, pp. 1-30 S. K. Sharma, J. Sharma, A. Devi: Role stress based on Employee Segmentation
29
APPENDIX I
CLUSTERING VARIABLE MEANS INDICATING PROFILING OF
EMPLOYEES’ CLUSTERS AND F-TEST RESULTS COMPARING CLUSTERS
Factors Clusters
F-Value Overloaded Employees
Unclear Employees
Underutilized Employees
Role Indistinctiveness
7.36 (Medium)
9.93 (High)
5.89 (Low)
302.543*
Role Excess 12.32 (High)
10.12 (Medium)
5.89 (Low)
164.221*
Role Invasion 9.45
(High) 7.75
(Medium) 7.4
(Low) 78.105*
Role Divergence 7.41
(Medium) 8.28
(High) 4.97
(Low) 102.155*
Role Augmentation 6.16
(Medium) 5.01
(Low) 6.43
(High) 33.274*
Self-Diminution 7.83
(Low) 8.56
(Medium) 8.76
(High) 13.186*
Role Fortification 6.12
(High) 5.12
(Low) 5.6
(Medium) 14.520*
Resource Shortage 5.3
(Low) 6.83
(Medium) 6.89
(High) 2.679**
Number of Respondents
178 35.52
163 32.53
160 31.93
Notes: 1. * and ** significant at 1 percent and 10 percent level of significance, respectively. 2. Table provides the simplified overview of clusters related to the factors and numbers,
which reflect the mean value score of respective factors for each cluster. Bold values represent the percentage.

Management, Vol. 17, 2012, 2, pp. 1-30 S. K. Sharma, J. Sharma, A. Devi: Role stress based on Employee Segmentation
30
APPENDIX II
CLASSIFICATION RESULTS
Cluster
Predicted Group Membership Total Overloaded
Cluster Unclear Cluster
Underutilized Cluster
Original
Overloaded Cluster
144 80.9
29 16.3
5 2.8
178
Unclear Cluster
37 22.7
104 63.8
22 13.5
163
Underutilized Cluster
9 5.6
31 19.4
120 75.0
160
Cross-validate*
Overloaded Cluster
135 75.8
37 20.8
6 3.4
178
Unclear Cluster
42 25.8
96 58.9
25 15.3 163
Underutilized Cluster
11 6.9
33 20.6
116 72.5
160
* Note: Leave one out method has been used for cross-validation purpose. a. 73.5% of original grouped cases correctly classified; 69.3% of cross-validated grouped cases correctly classified.


![Determinants of Employee Satisfaction in POWERGRID[1]](https://static.fdocuments.us/doc/165x107/54689b64af795988338b5bd3/determinants-of-employee-satisfaction-in-powergrid1.jpg)