Determinants of Innovation and the Economic Growth of ... · ESPOO 2005 VTT WORKING PAPERS 25...
35
ESPOO 2005 VTT WORKING PAPERS 25 Determinants of Innovation and the Economic Growth of Innovators Tracing the evolution of innovative firms over time Olavi Lehtoranta Statistics Finland & VTT Technology Studies
-
Upload
nguyenlien -
Category
Documents
-
view
214 -
download
0
Transcript of Determinants of Innovation and the Economic Growth of ... · ESPOO 2005 VTT WORKING PAPERS 25...
ESPOO 2005 VTT WORKING PAPERS 25
Determinants of Innovation and the Economic Growth of
Innovators
Tracing the evolution of innovative firms over time
Olavi Lehtoranta Statistics Finland & VTT Technology Studies

ISBN 951�38�6575�4 (URL: http://www.vtt.fi/inf/pdf/) ISSN 1459�7683 (URL: http://www.vtt.fi/inf/pdf/) Copyright © VTT 2005
JULKAISIJA � UTGIVARE � PUBLISHER
VTT, Vuorimiehentie 5, PL 2000, 02044 VTT puh. vaihde 020 722 111, faksi 020 722 4374
VTT, Bergsmansvägen 5, PB 2000, 02044 VTT tel. växel 020 722 111, fax 020 722 4374
VTT Technical Research Centre of Finland, Vuorimiehentie 5, P.O.Box 2000, FI�02044 VTT, Finland Tel.: +358 20 722 111, fax: +358 20 722 4374
VTT Teknologian tutkimus, Kemistintie 3, PL 1002, 02044 VTT puh. vaihde 020 722 111, faksi 020 722 7007
VTT Teknologistudier, Kemistvägen 3, PB 1002, 02044 VTT tel. växel 020 722 111, fax 020 722 7007
VTT Technology Studies, Kemistintie 3, P.O.Box 1002, FIN�02044 VTT, Finland phone internat. +358 20 722 111, fax +358 20 722 7007
Technical editing Marja Kettunen
3
Published by
Series title, number and report code of publication
VTT Working Papers 25 VTT�WORK�25
Author(s) Lehtoranta, Olavi Title Determinants of Innovation and the Economic Growth of Innovators Tracing the evolution of innovative firms over time
Abstract The idea of the project Dynamic Patterns of Innovative Activities among Finnish Firms was that looking at firms� history and development over time can reveal information about the innovative activities and the innovation potential of these firms. The project wanted to answer the question: How does history influence innovative activities and how does it point to successful innovation? This paper analyses the question: How does history point towards successful innovation? We focus on those firm-level determinants of innovation and economic growth that can be followed over years, i.e. innovative efforts described by firm-level R&D capital, R&D collaboration, patenting, business acquisitions and restructuring, and recruitment of highly-educated personnel. One of the targets of the project was to get more in-depth knowledge of what kinds of data sources the Database of Finnish Innovations (Sfinno Database) and the Community Innovation Surveys (CIS) conducted in Finland are when compared with each other. It follows from this target that the focus of this paper is on innovative firms that have launched one or more product innovations onto the market. Product innovations are covered more extensively than process innovations in the Sfinno Database. Keywords comparison, CIS data, Sfinno, R&D, patenting, business acquisitions, highly educated personnel
Activity unit VTT Technology Studies, Kemistintie 3, P.O.Box 1002, FIN�02044 VTT, Finland
ISBN Project number 951�38�6575�4 (URL: http://www.vtt.fi/inf/pdf/) P2SU00143
Date Language Pages February 2005 English 34 p.
Name of project Commissioned by Dynamic Patterns of Innovative Activities among Finnish Firms
National Technology Agency of Finland Tekes, Ministry of Trade and Industry KTM
Series title and ISSN Publisher VTT Working Papers 1459�7683 (URL: http://www.vtt.fi/inf/pdf/)
VTT Information Service P.O. Box 2000, FI�02044 VTT, Finland Tel.: +358 20 722 4404 Fax: +358 20 722 4374

4
Contents
1. Introduction..................................................................................................................5
2. Motivation for the analysis ..........................................................................................7
3. Innovative activities and the used data ........................................................................9
4. Multivariate analysis of the determinants of innovation............................................12 4.1 Product innovators in the Sfinno Database ......................................................13 4.2 Product innovators in the innovation surveys ..................................................15
5. Multivariate analysis of the determinants of economic growth.................................20
6. Conclusions................................................................................................................29
References .......................................................................................................................30
Other literature.................................................................................................................31

5
1. Introduction
It is well known that research, entrepreneurship, new start-ups, consolidation of businesses, interaction with other companies and financial markets create an environment that is conclusive to innovations. Furthermore, it is known that new patterns of innovative activities are affected by new technologies, changes in the knowledge base, and in consumer needs and trends.
An innovation can be based on a new technology, the application of existing technologies, or the utilisation of new knowledge acquired by the company. The idea of the project Dynamic Patterns of Innovative Activities among Finnish Firms is that looking at firms� history and development over time can reveal information about the innovative activities and the innovation potential of these firms. The project wanted to answer the question: How does history influence innovative activities and how does it point to successful innovation?
In this paper we concentrate on the latter part of the question only, i.e. how does history point towards successful innovation. Actually, a relatively small number of studies have been conducted on the successful commercialisation and exploitation of Finnish innovations. Among the first ones in this field were the studies conducted by Niininen & Saarinen (2000) and Palmberg (2002). The first one focused on the relationships between the sources of innovations and the profitability of innovators. The second study defined the successful commercialisation of an innovation as the time period from its development to its commercialisation or break-even point resulting in first mover advantages.
Even though we do not aim to follow the old linear model of innovation that sees innovation as a one-way flow from science to technology and from business to market, we can speak of the determinants of innovation. The first determinant of innovation is the innovative effort, measured by R&D expenditure, the number of researchers and their machinery endowments (tangible and intangible investments), for example. Interaction with users and implicit knowledge in marketing departments often play a crucial role in innovation. Education, learning and social rules are key determinants in both the innovation and the diffusion phase. More generally, a conducive environment for innovation is created by large and diversified human capital and entrepreneurial spirit both in the business and academic worlds, wide consumption and a pluralistic, multi-polar open society.
(see http://www.economicswebinstitute.org/glossary/innovate.htm).
6
Here we concentrate on those firm-level determinants of innovation that can be followed over years, i.e. on innovative efforts described by firm-level R&D capital, R&D collaboration, patenting, business acquisitions and restructuring, and recruitment of highly-educated personnel. The focus of the study is on innovative firms that have launched one or more product innovations onto the market and the research question concerning them is what has happened to these firms before and after the commercialisation of an innovation.
Then, growth dynamics of these firms are analysed by comparing the growth rates of the firms before and after the commercialisation. We once again go to analyse which factors are decisive for the growth differences over time among the factors that can be followed over years. The characteristics of product innovations as well as the characteristics of the innovators belong to these factors.
It follows from the objectives described above that the focus of the analysis lies on the evolutionary micro-determinants of the innovation and growth of the innovators. By dividing the time periods to pre and post-innovation periods, we can shed some light on the causalities of factors like R&D collaboration and mergers and acquisitions (acquiring knowledge) in explaining the economic growth of the innovators. However, the micro-determinants of launching a product innovation and micro-based technical change are not sufficient so that the realised innovations and growth rates could be understood. Therefore, business cycles and technological opportunities are also taken into account as macro-foundations for innovation by using dummy variables describing years and industrial branches.

7
2. Motivation for the analysis
The economics of innovation and technological change consider innovation processes within and outside firms and analyse the relations between firms and their environment. Our analysis of the innovation propensities and growth rate differences of innovators and of their micro and macro determinants belong to this field of research. The systematic differences across firms have been analysed among all business firms by e.g. Davis, Haltiwanger and Schuh (1996a) or among all manufacturing plants by Baily, Hulten and Campbell (1992), but here we are interested in innovative firms only. So far, very few analogous, evolutionarily inspired innovation studies exist in this field.
In evolutionary theorising the endogenous growth process is typically seen as an historical, irreversible and cumulative process that considers economic dynamics as a bottom-up process and analyses the co-evolution of macro-dynamics, enterprise dynamics and technical changes. In a similar vein, our analysis considers the characteristics of innovations and innovators, the inflow of highly educated employees, and mergers and acquisitions as factors contributing to the success of innovators.
Studies of dynamic approaches take into account the active part played by actors, whether individuals or organisations, in determining the pace and direction of technological progress. The principal contributions from these approaches come from evolutionary economics and the work of evolutionary historians. The development of new industrial economics and the social constructivism within sociology also permit certain dynamic angles on the process of technological innovation. Ultimately, it has been stated that more dynamic views should be used. We should turn in new directions that take into account changing forms of organisations, changing clusters and networks. More dynamic views could give new perspectives into firms� innovation behaviour. We have noticed that many innovations are commercialised by an organisation other than the original inventor, and that the majority of firms are embedded in inter-firm relationships and networks. Furthermore, we have noticed that there is a lot of restructuring activities in single businesses, possibly reflecting changes in their internal behaviour. In order to understand what causes the failure or success of an innovating firm, the relationships between technological and organisational discontinuities and business strategies should be analysed in more detail.
In this project we are moving into these new directions. The idea of the project is to produce a certain first-step view of what can be known about innovating firms on the basis of their enterprise demography, for example. As mentioned by Palmberg et al. (1999), the possibility of linking data is especially relevant from the perspective of industrial renewal since it makes it possible to trace the demography of innovating firms over time from the perspective of commercialisation of individual innovations, in terms of entry and exit, firm size and growth. The questions touched upon in the project are,
8
for example, how new entrants, restructuring of incumbent firms and business acquisitions are engaged in successful innovations. At a more general level, after this first step we can study the relationship between the innovation capability and the creative and restructuring capability of firms, or we can consider the role of acquisition entries or spin-offs in introducing innovations, for example.
In the analysis of this paper we can trace the mobility flows of highly educated people from studying, universities, research institutes and other companies to innovative companies. The expectations, based on several earlier studies, are that the relative proportion of highly educated people in firms matters. The second main issue we are focusing on in this study is R&D collaboration between firms, and between firms and universities, and the importance of this collaboration to the innovation potential or innovation success of the inter-related firms, as taken together. We expect co-operation activities to have a positive effect on the growth performance of the innovative firms.
Innovation activities as a response to certain other activities have been studied in a few papers. Bertschek (1995) analysed the hypothesis that imports and inward foreign direct investments (FDI) have positive effects on the innovative activity of domestic firms because competition on the domestic market is thereby increased. She measured innovation activities by innovation counts like we do in Section 4. However, she used Chamberlain�s random effect probit approach to take into account the heterogeneity dependent on exogenous variables. We report only the results based on a cross-sectional logit model here, even though fixed and random effect panel data models were also used.
The hypothesis concerning products that are new to the market postulates that they have a positive impact on the growth performance of the innovators. However, what are of interest, too, are the effects business cycles together with some technological cycles may have on the growth performance of the innovators. It is plausible that the burst of the technological boom around the millennium would have had its own effect on the growth performance of innovative firms, but we do not know exactly whether this effect dominated over the micro-determinants of the growth. (For the relationship between business cycles and the patterns of innovative activity, see e.g. Geroski & Walters 1995.)
Theory implies that firms grow at a rate proportionate to size and as a random walk (e.g. Gibrat�s Law). A large number of empirical studies has, however, shown that the firms� growth process is not completely stochastic and that there is a statistically significant relationship between firm growth and a number of other variables. The growth in size is a path dependent process, since the size of a firm at any given time is the sum of the entire history of the shocks the firm has experienced. According to Nelson & Winter (1982), firm growth rates are related to their ability to innovate. Therefore, we would expect firm growth rates to be serially correlated. Nelson & Winter proposed that the average growth rates of firms would first increase and then flatten out or decrease with firm size.
9
3. Innovative activities and the used data
Innovation is a complex development of discoveries and inventions (e.g. new machinery) brought into the business and social environment (e.g. introduced on the market) that hopefully leads to diffusion (adoption by new users). During the diffusion path, improvements to both the idea and implementation often require further innovation. Successful innovations are often imitated by other players in the same industry or applied in other industries (http://www.economicswebinstitute.org/ glossary/innovate.htm).
Out of several cases, innovation can basically be:
1. Product innovation (e.g. new goods or services put on sale);
2. Process innovation, which changes the way a given good is produced within the firm or across a supply chain;
3. Behavioural innovation, when an organisational routine is replaced with a new one.
Quite often, the innovation turns out to be a mix of all three categories, as in the case of introduction of a new product that requires new productive competencies and changes in the organisation. Furthermore, what to a supplier is a product innovation can be a process innovation to a user, as in the case of a new machine that revolutionises the process of manufacturing. In this case, investment is the means by which innovation is spread over the economy (op. cit).
Although technology is often at the heart of an innovation, marketing and financing organisations can also be sources and multipliers of innovation. In an enlarged meaning, innovation embraces the introduction of known things to new markets or different industries. The environment in which something is said to be an innovation is also relevant. Thus, we can have an innovation simply relative to past achievements of the innovator or to the (local) market or to the world frontier. In the first two cases, it is possible to achieve the innovation just by imitating world-class practices (op. cit).
A useful distinction can be made between radical innovation and incremental innovation. Radical innovations comprise entirely new products, often undertaken by new entrants with a diversified knowledge base, for example. Minor improvements in existing products and processes constitute incremental innovations, often undertaken by incumbent firms with a specific knowledge base.
The following broad definition of innovative activities is used here: innovative activities refer to all those activities the target of which is to develop and launch an innovation onto the market. Examples of these activities include acquisition of R&D, and acquisition of external knowledge and financing. These activities are measured by R&D
10
performing, recruitment of highly qualified personnel and participation in an R&D collaboration project subsidised by the National Technology Agency of Finland (Tekes), for example. These activities also comprise the acquisition of other businesses, measured e.g. by the number of acquired business units.
The main data sets used here are the VTT�s Database of Finnish Innovations (Sfinno Database) and the Finnish Innovation Surveys (CIS2, CIS2.5, CIS3). These data sets primarily comprise information on innovative firms only. Therefore, we will mainly focus on firms known to have undertaken innovative activities (R&D activities, patenting, etc.) in the second half of the 1990s.
To get annual information on these firms we used several administrative registers, statistical data sets and other smaller data sets and linked them to the Sfinno and CIS data sets. The event histories of the firms under examination cover their entries, mergers and acquisitions, commercialisations of innovations and possible exits. The innovative activities of these firms are based on their R&D and patenting activities: the annual numbers of domestic and EPO patent applications as well as patents granted in the US. In addition, the firms� annual recruitment, as well as the levels and fields of education of the recruited personnel are derived from the Regional Employment Register. Annual figures on the times a firm has been a target or an acquirer in mergers and acquisitions is also used here.
The amount of a firm�s innovation expenditure or the annual number of product innovations a firm has launched can be used as indicators describing its innovation intensities. Annual numbers of started R&D projects per firm, for example, can be counted from the R&D collaboration data provided by Tekes.
The basic firm characteristics include the amount of sales turnover, number of employees, number of highly educated employees, age, industry, region, foreign or domestic ownership, group relationships, R&D activity, etc. Information on the starting year of a firm can be derived from the Business Register, and from the Employment Register we can conclude whether it was a (potential) academic or corporate spin-off, a green field or an incumbent firm at the time when it launched its first innovation, for example. Both the CIS and Sfinno data set provide some information on the innovation characteristics (types, novelties, complexities) and specifications (exact descriptions).
11
All register-based data and data on firm acquisitions as well as data on collaborating firms subsidised by Tekes are treated as total data. The Sfinno, CIS and R&D data sets are samples.1 Firm level R&D stock is also compiled basing on the extrapolation of a firm's in-house R&D expenditure extracted from the union of all R&D samples over the 1985�2000 time period.
In short, the data sets used in this study are as follows: Database of Finnish Innovations (Sfinno) from VTT Technology Studies, 1985�1998,
Several R&D Surveys and Finnish Innovation Surveys:
(CIS1: 1989�1991, CIS2: 1994-1996, CIS2.5: 1996�1998 and CIS3: 1998�2000),
Business Register data from Statistics Finland, 1982�2000, Register-based data on groups of firms, 1995�2000 excluding 1996, Register-based data on mergers of firms,
Regional Employment Register data from Statistics Finland, 1988�1999, Register-based data on the education and work experience of employees, 1987�1999, Register-derived data on the mobility of highly educated employees, 1988�1999, Register-derived data on start-ups and spin-offs, 1990�2000,
Data on the Foreign Ownership of firms (FATS Database) from Statistics Finland, 1994�2000,
Patent Register data from the National Board of Patents and Registration, 1985�1999, All patent applications filed in Finland and with the European Patent Office (EPO), All patents granted in the US,
Firm level R&D collaboration data from the National Technology Agency of Finland (Tekes), 1993�2000,
Data on Mergers and Acquisitions (M&A) from the Magazine Talouselämä, 1993�1999.
1 In the R&D and Innovation Surveys conducted in Finland, the sample of firms consists of firms selected on the basis of a stratified random sample and of firms belonging to a panel of small firms known to have undertaken innovative activities. These last mentioned firms are e.g. ones that have been subsidised by Tekes. The panel properties of a combined sample are, however, quite modest.
12
4. Multivariate analysis of the determinants of innovation
In the analysis that follows, only firms that have introduced product innovations in some years are considered. They can, therefore, be regarded as innovative firms. The reason for this setup is that the Sfinno Database includes only innovations that are introduced to the market as product innovations and the preliminary target here is to compare results based on the Sfinno Database (object approach) and those based on the CIS data (subject approach). Innovators and non-innovators2 are defined annually (periodically) according to whether they have introduced at least one product innovation that year (period) or not. They may have undertaken process innovations that year, too, but no distinction is made here between innovators with product innovations and those with combined product and process innovations (concerning the CIS data). The Sfinno and CIS data are used here as if they were total data, including all relevant innovations over years.
As mentioned above, only those factors are included in the analysis on which consistent annual data exist since the first year of the analysis. In most of the multivariate models the first year of the analysis is 1993 (Sfinno) or 1995 (CIS 3).
Annual data exist on the following variables: Dummy, firm has launched one or more product innovations Level of turnover, log Number of employees, log Commercialisation year Dummy, firm has conducted R&D activities Dummy, domestic patents Dummy, EPO patents Dummy, US patents Dummy, target in acquisitions Dummy, Tekes subsidised R&D collaboration project starts Dummy, being acquirer in acquisitions Dummy, recruitment of highly educated personnel Number of acquired business units in acquisitions Number of recruited highly educated personnel
2 The term �innovator� or �innovating firm� refers here to firms that have commercialised an innovation during the year or period under consideration. The term �innovative firm� is used here in a different meaning: many non-innovators are, in fact, innovative, i.e. they have innovative activities during a short or long time period, depending on the angle of view. We consider the whole life history of these firms here, and firms that are (known to have been) innovative once in their life are defined as innovative. 3 Time periods of the innovation surveys have been reduced to the middle years of the periods.
13
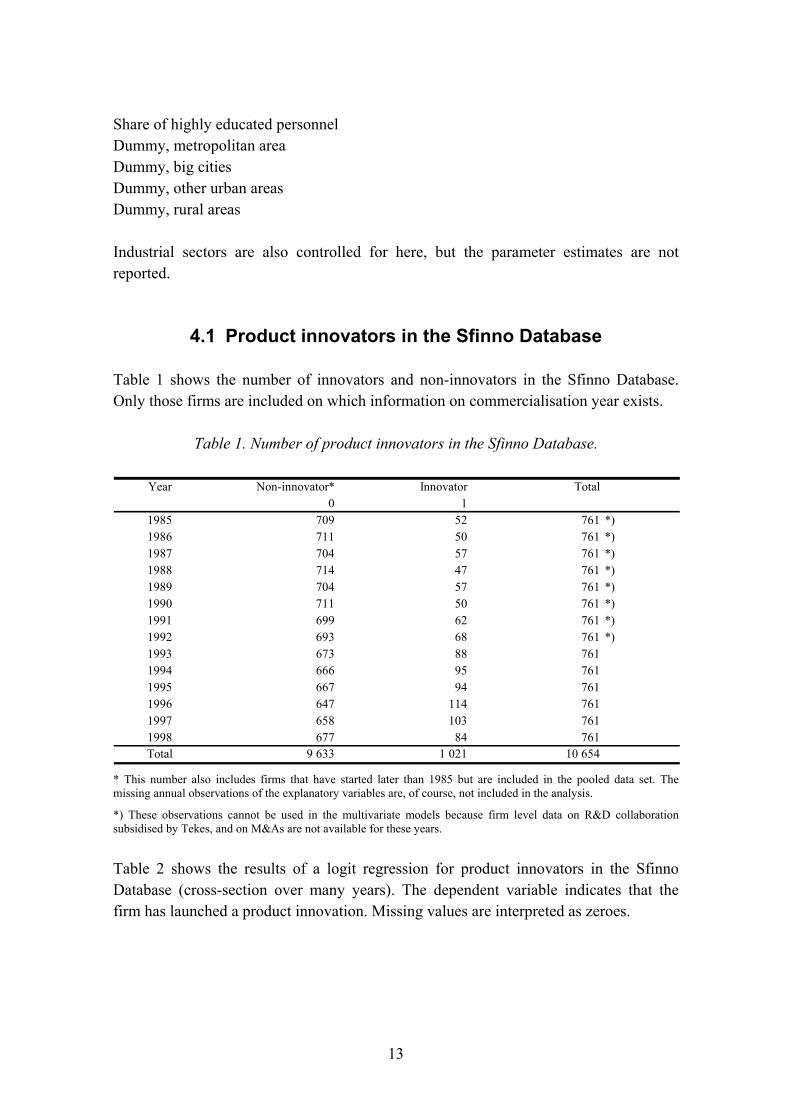
Share of highly educated personnel Dummy, metropolitan area Dummy, big cities Dummy, other urban areas Dummy, rural areas Industrial sectors are also controlled for here, but the parameter estimates are not reported.
4.1 Product innovators in the Sfinno Database
Table 1 shows the number of innovators and non-innovators in the Sfinno Database. Only those firms are included on which information on commercialisation year exists.
Table 1. Number of product innovators in the Sfinno Database.
Year Non-innovator* Innovator Total0 1
1985 709 52 761 *)1986 711 50 761 *)1987 704 57 761 *)1988 714 47 761 *)1989 704 57 761 *)1990 711 50 761 *)1991 699 62 761 *)1992 693 68 761 *)1993 673 88 7611994 666 95 7611995 667 94 7611996 647 114 7611997 658 103 7611998 677 84 761Total 9 633 1 021 10 654
* This number also includes firms that have started later than 1985 but are included in the pooled data set. The missing annual observations of the explanatory variables are, of course, not included in the analysis.
*) These observations cannot be used in the multivariate models because firm level data on R&D collaboration subsidised by Tekes, and on M&As are not available for these years.
Table 2 shows the results of a logit regression for product innovators in the Sfinno Database (cross-section over many years). The dependent variable indicates that the firm has launched a product innovation. Missing values are interpreted as zeroes.
14
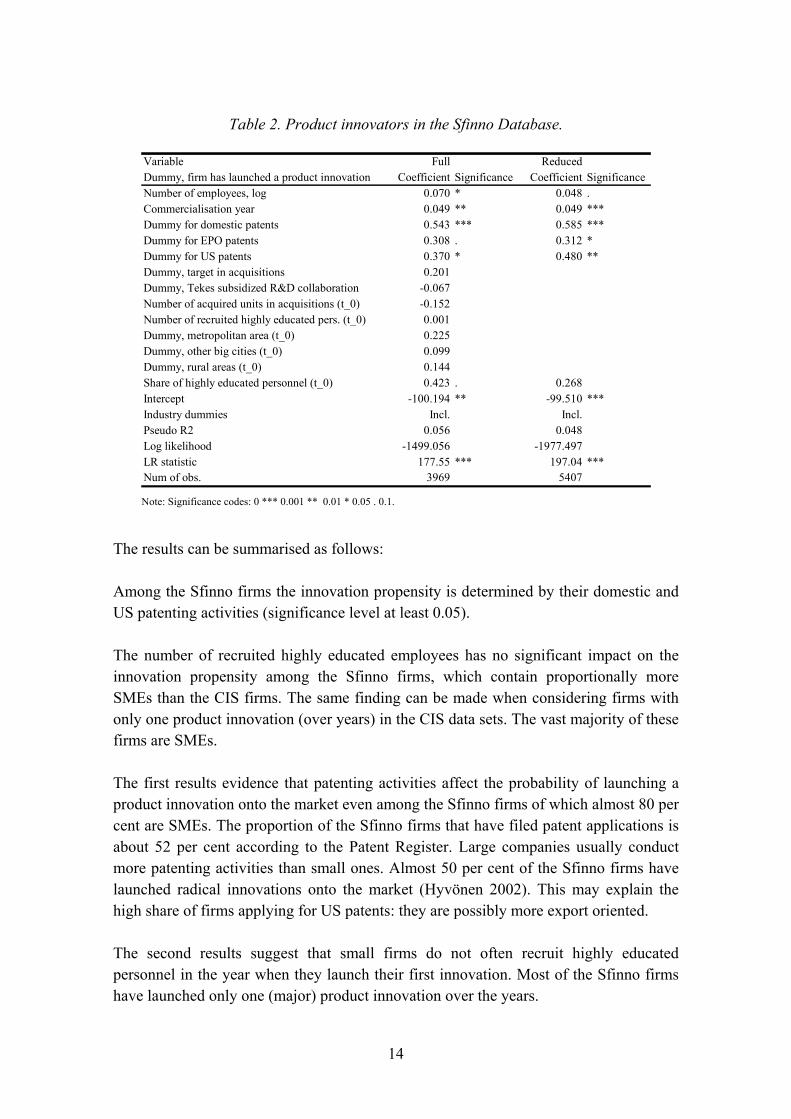
Table 2. Product innovators in the Sfinno Database.
Variable Full ReducedDummy, firm has launched a product innovation Coefficient Significance Coefficient SignificanceNumber of employees, log 0.070 * 0.048 .Commercialisation year 0.049 ** 0.049 ***Dummy for domestic patents 0.543 *** 0.585 ***Dummy for EPO patents 0.308 . 0.312 *Dummy for US patents 0.370 * 0.480 **Dummy, target in acquisitions 0.201Dummy, Tekes subsidized R&D collaboration -0.067Number of acquired units in acquisitions (t_0) -0.152Number of recruited highly educated pers. (t_0) 0.001Dummy, metropolitan area (t_0) 0.225Dummy, other big cities (t_0) 0.099Dummy, rural areas (t_0) 0.144Share of highly educated personnel (t_0) 0.423 . 0.268Intercept -100.194 ** -99.510 ***Industry dummies Incl. Incl.Pseudo R2 0.056 0.048Log likelihood -1499.056 -1977.497LR statistic 177.55 *** 197.04 ***Num of obs. 3969 5407 Note: Significance codes: 0 *** 0.001 ** 0.01 * 0.05 . 0.1.
The results can be summarised as follows:
Among the Sfinno firms the innovation propensity is determined by their domestic and US patenting activities (significance level at least 0.05).
The number of recruited highly educated employees has no significant impact on the innovation propensity among the Sfinno firms, which contain proportionally more SMEs than the CIS firms. The same finding can be made when considering firms with only one product innovation (over years) in the CIS data sets. The vast majority of these firms are SMEs.
The first results evidence that patenting activities affect the probability of launching a product innovation onto the market even among the Sfinno firms of which almost 80 per cent are SMEs. The proportion of the Sfinno firms that have filed patent applications is about 52 per cent according to the Patent Register. Large companies usually conduct more patenting activities than small ones. Almost 50 per cent of the Sfinno firms have launched radical innovations onto the market (Hyvönen 2002). This may explain the high share of firms applying for US patents: they are possibly more export oriented.
The second results suggest that small firms do not often recruit highly educated personnel in the year when they launch their first innovation. Most of the Sfinno firms have launched only one (major) product innovation over the years.
15
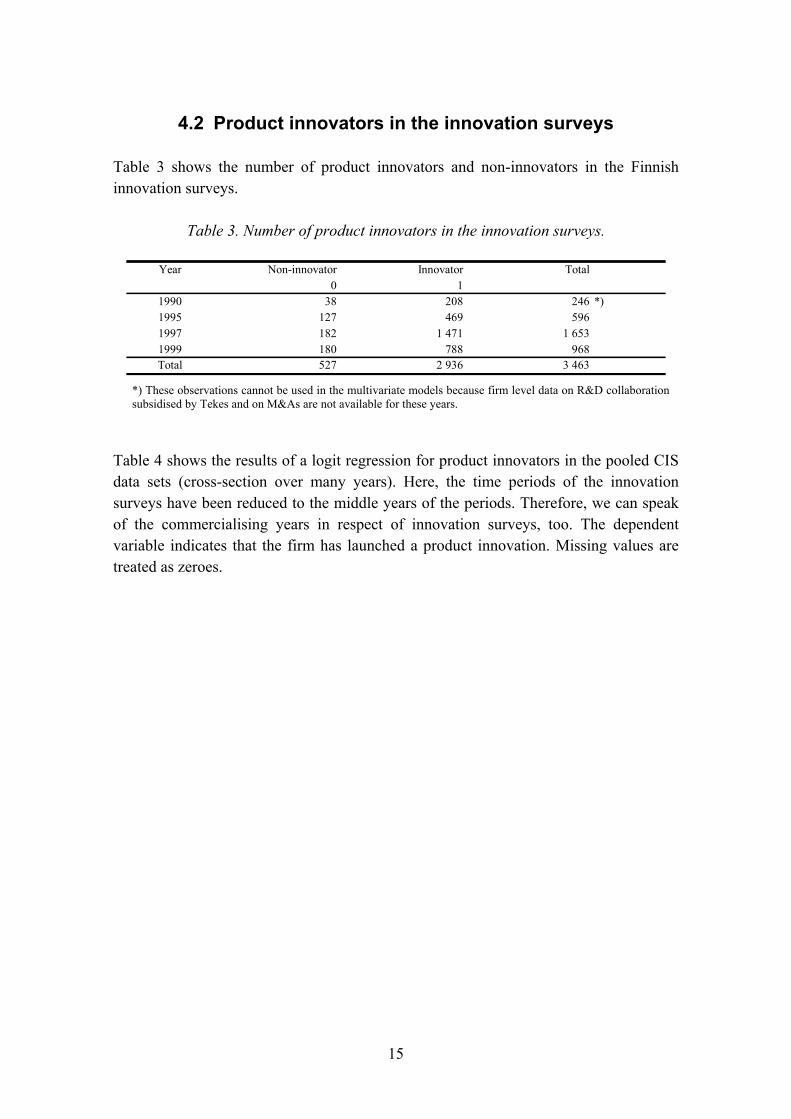
4.2 Product innovators in the innovation surveys
Table 3 shows the number of product innovators and non-innovators in the Finnish innovation surveys.
Table 3. Number of product innovators in the innovation surveys.
Year Non-innovator Innovator Total0 1
1990 38 208 246 *)1995 127 469 5961997 182 1 471 1 6531999 180 788 968Total 527 2 936 3 463
*) These observations cannot be used in the multivariate models because firm level data on R&D collaboration subsidised by Tekes and on M&As are not available for these years.
Table 4 shows the results of a logit regression for product innovators in the pooled CIS data sets (cross-section over many years). Here, the time periods of the innovation surveys have been reduced to the middle years of the periods. Therefore, we can speak of the commercialising years in respect of innovation surveys, too. The dependent variable indicates that the firm has launched a product innovation. Missing values are treated as zeroes.
16
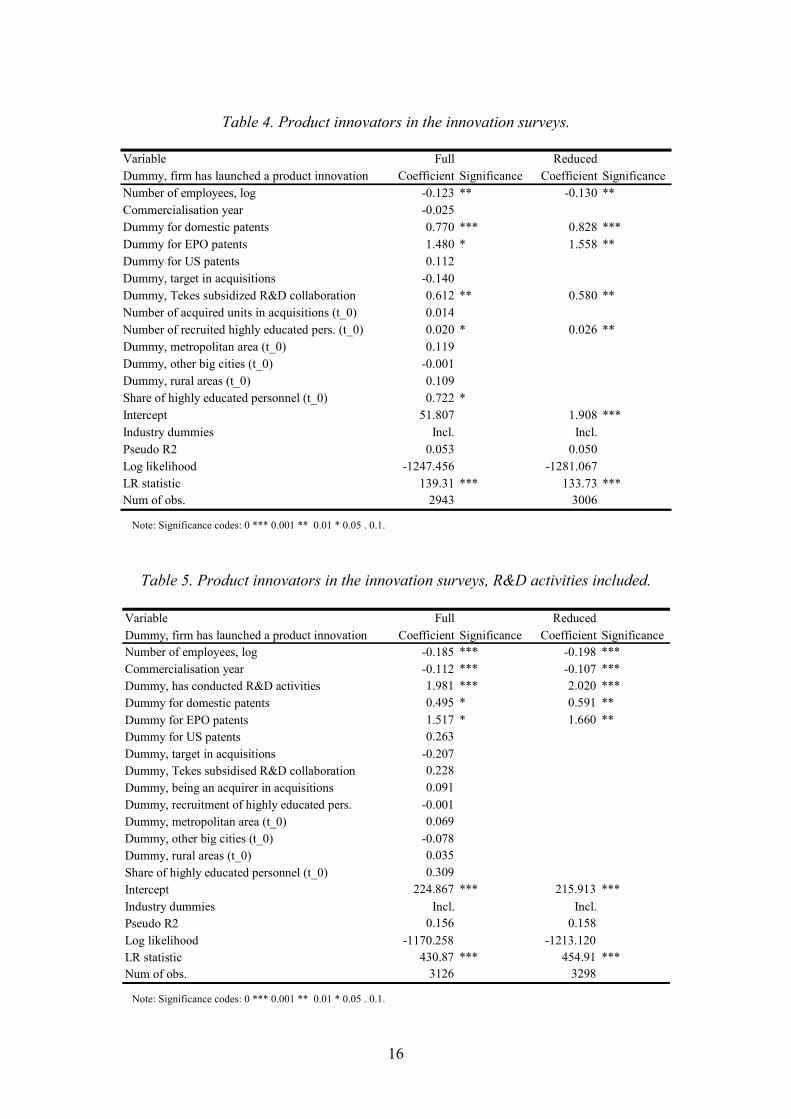
Table 4. Product innovators in the innovation surveys.
Variable Full ReducedDummy, firm has launched a product innovation Coefficient Significance Coefficient SignificanceNumber of employees, log -0.123 ** -0.130 **Commercialisation year -0.025Dummy for domestic patents 0.770 *** 0.828 ***Dummy for EPO patents 1.480 * 1.558 **Dummy for US patents 0.112Dummy, target in acquisitions -0.140Dummy, Tekes subsidized R&D collaboration 0.612 ** 0.580 **Number of acquired units in acquisitions (t_0) 0.014Number of recruited highly educated pers. (t_0) 0.020 * 0.026 **Dummy, metropolitan area (t_0) 0.119Dummy, other big cities (t_0) -0.001Dummy, rural areas (t_0) 0.109Share of highly educated personnel (t_0) 0.722 *Intercept 51.807 1.908 ***Industry dummies Incl. Incl.Pseudo R2 0.053 0.050Log likelihood -1247.456 -1281.067LR statistic 139.31 *** 133.73 ***Num of obs. 2943 3006
Note: Significance codes: 0 *** 0.001 ** 0.01 * 0.05 . 0.1.
Table 5. Product innovators in the innovation surveys, R&D activities included.
Variable Full Reduced Dummy, firm has launched a product innovation Coefficient Significance Coefficient SignificanceNumber of employees, log -0.185 *** -0.198 *** Commercialisation year -0.112 *** -0.107 *** Dummy, has conducted R&D activities 1.981 *** 2.020 *** Dummy for domestic patents 0.495 * 0.591 ** Dummy for EPO patents 1.517 * 1.660 ** Dummy for US patents 0.263Dummy, target in acquisitions -0.207Dummy, Tekes subsidised R&D collaboration 0.228Dummy, being an acquirer in acquisitions 0.091Dummy, recruitment of highly educated pers. -0.001Dummy, metropolitan area (t_0) 0.069Dummy, other big cities (t_0) -0.078Dummy, rural areas (t_0) 0.035Share of highly educated personnel (t_0) 0.309Intercept 224.867 *** 215.913 *** Industry dummies Incl. Incl. Pseudo R2 0.156 0.158 Log likelihood -1170.258 -1213.120 LR statistic 430.87 *** 454.91 *** Num of obs. 3126 3298
Note: Significance codes: 0 *** 0.001 ** 0.01 * 0.05 . 0.1.
17
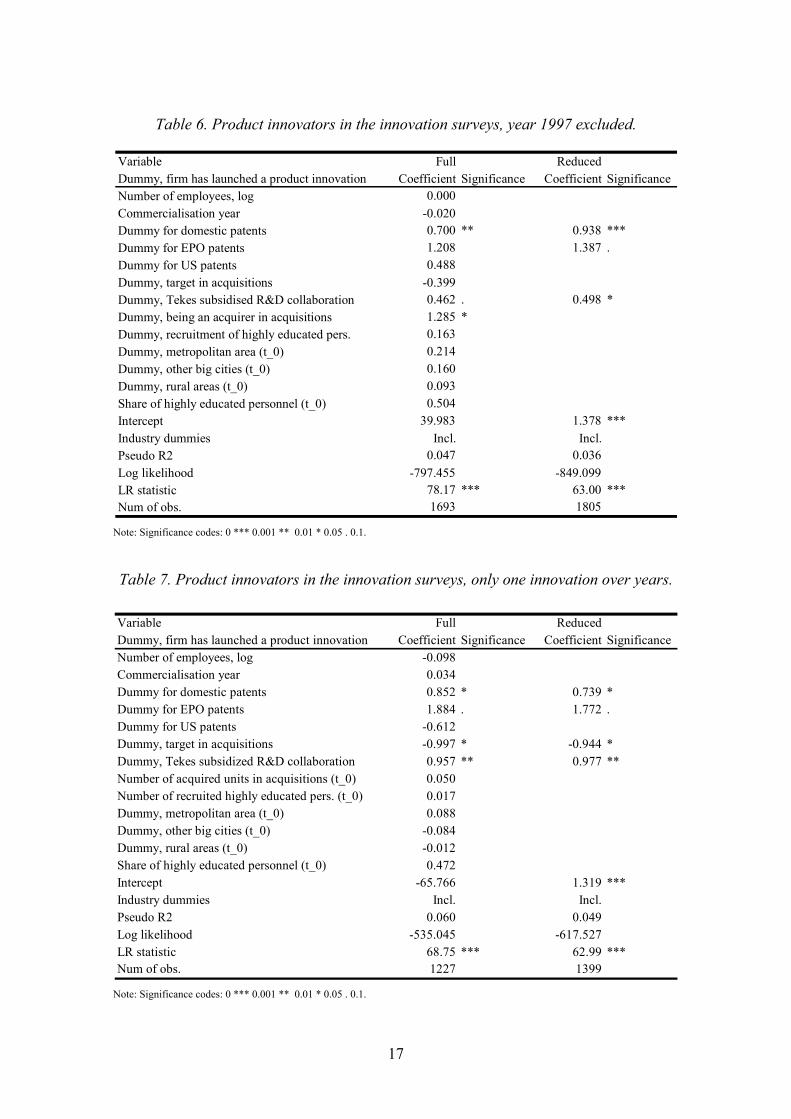
Table 6. Product innovators in the innovation surveys, year 1997 excluded.
Variable Full Reduced Dummy, firm has launched a product innovation Coefficient Significance Coefficient SignificanceNumber of employees, log 0.000Commercialisation year -0.020Dummy for domestic patents 0.700 ** 0.938 *** Dummy for EPO patents 1.208 1.387 . Dummy for US patents 0.488Dummy, target in acquisitions -0.399Dummy, Tekes subsidised R&D collaboration 0.462 . 0.498 * Dummy, being an acquirer in acquisitions 1.285 *Dummy, recruitment of highly educated pers. 0.163Dummy, metropolitan area (t_0) 0.214Dummy, other big cities (t_0) 0.160Dummy, rural areas (t_0) 0.093Share of highly educated personnel (t_0) 0.504Intercept 39.983 1.378 *** Industry dummies Incl. Incl. Pseudo R2 0.047 0.036 Log likelihood -797.455 -849.099 LR statistic 78.17 *** 63.00 *** Num of obs. 1693 1805
Note: Significance codes: 0 *** 0.001 ** 0.01 * 0.05 . 0.1.
Table 7. Product innovators in the innovation surveys, only one innovation over years.
Variable Full ReducedDummy, firm has launched a product innovation Coefficient Significance Coefficient SignificanceNumber of employees, log -0.098Commercialisation year 0.034Dummy for domestic patents 0.852 * 0.739 *Dummy for EPO patents 1.884 . 1.772 .Dummy for US patents -0.612Dummy, target in acquisitions -0.997 * -0.944 *Dummy, Tekes subsidized R&D collaboration 0.957 ** 0.977 **Number of acquired units in acquisitions (t_0) 0.050Number of recruited highly educated pers. (t_0) 0.017Dummy, metropolitan area (t_0) 0.088Dummy, other big cities (t_0) -0.084Dummy, rural areas (t_0) -0.012Share of highly educated personnel (t_0) 0.472Intercept -65.766 1.319 ***Industry dummies Incl. Incl.Pseudo R2 0.060 0.049Log likelihood -535.045 -617.527LR statistic 68.75 *** 62.99 ***Num of obs. 1227 1399
Note: Significance codes: 0 *** 0.001 ** 0.01 * 0.05 . 0.1.
18
The results can be summarised as follows:
When analysing the CIS firms, the probability that a firm will launch a product innovation in a certain year (period) is positively affected by a firm's domestic and EPO patenting activities, share of highly educated employees and start of R&D collaboration that year. These effects are statistically significant (Table 4).
If we add a dummy variable describing a firm's R&D activities into the model, it will absorb the main positive impact but still leave the effects of domestic and EPO patenting activities significant (Table 5).
If we drop out the CIS2.5 (meaning year 1997 in the analysis) which also includes small firms, apart from domestic patenting activities, acquisition activities (a dummy variable describing that a firm has been an acquirer in business acquisitions) also have a significant positive effect on the propensity to launch a product innovation that year (Table 6).
When the annual number of recruited highly educated personnel is considered rather than a dummy variable describing the competence inflow into the firm, we can see that it has a significant effect on innovation propensity together with the other determinants mentioned above (Table 4).
These effects remain significant at the significance level 0.05 even if a dummy describing the firm�s R&D activities is included in the model (not shown in the Tables). It is clear, however, that the inflow of highly educated personnel is correlated with the R&D activities as well as with the publicly funded R&D collaboration activities.
When concentrating on those CIS firms that have had only one (known) product innovation over the years in the innovation surveys (CIS2, CIS2.5 and CIS3), we can notice that domestic patenting and publicly subsidised R&D collaboration have a statistically significant positive effect on the propensity to innovate, and that being a target in acquisitions has a significant negative impact on this propensity (Table 7).
In contrast to the findings based on the Sfinno firms, the share of highly educated employees and the number of recruited highly educated personnel affect significantly the probability that a firm will launch a product innovation that year (Tables 2 and 4). It seems obvious that these results come from large firms. Innovation surveys include large firms more often than the Sfinno data do.
As regards the result concerning the effect of R&D collaboration, we cannot interpret it so that an R&D collaboration project subsidised by Tekes would contribute to the
19
launching of an innovation instantly in the same year when the project starts. Although co-operation may evidently accelerate the commercialisation of new technologies, this result seems to characterise the innovation surveys CIS2.5 and CIS3 in which small Tekes subsidised firms are included as a panel. The timing of new R&D collaboration projects in relation to the commercialisation of innovations is examined more in Lehtoranta (2005a). There we found that the majority of the R&D collaboration projects do not start during the commercialisation year but a year or two after it.
The third result can be interpreted so that some firms, perhaps acquisition entries or spin-offs, will acquire innovative business units and are, therefore, commercialisers for inventions first developed in some other firms.4 On the other hand, result 6 suggests that if an innovative firm is a target in acquisitions, the probability that it will launch a product innovation that year declines.
In the first two models (Tables 4 and 5) the highly significant negative sign of the size variable (number of employees) results from the small companies known to have introduced product innovations and to have been included in the selective sample. If the CIS2.5 is excluded from the analysis the size of the firm is not significant anymore. The same concerns the significance of the commercialisation year.
4 It was admitted in Palmberg et al. (1999) that "�accounting for organisational changes within the firm, including acquisitions and mergers, was also problematic. The problem caused by frequent acquisitions and mergers was partly remedied by the fact that units and firms often move from one large firm to another, in which case the same innovation would sometimes appear in a different year in another firm included in the study. These innovations were cross-checked at the firm level, and related to the most recent firm." For the purpose of this analysis, these relations have here been resolved and innovations have not been related to the most recent firms but to the firms (the IDs) that were existing in the year of introduction of the innovation. This was done because only IDs can be used effectively when linking different data sets.
20
5. Multivariate analysis of the determinants of economic growth
As in the previous Section, only firms that have introduced product innovations to the market in some year are considered here. These firms can be called innovative firms. This Section considers the growth dynamics of innovative firms between the pre- and post-innovation periods. The pre-innovation period consists of up to 4 years before the commercialisation of an innovation. The post-innovation period extends to up to 3 years after the launching of the innovation. If a firm has introduced product innovations in several years, only the first year is taken into the analysis as a commercialising year. In the Sfinno data there are only 21 firms that have introduced (major) product innovations in several years during the 1993-1998 period. The number of the CIS firms having introduced product innovations in several (non-overlapping) periods is 1,290.
The annual sales turnovers of the firms are used as the basis for their growth rates, and missing annual values of turnovers are allowed. The analysis is first conducted by counting the firm-level average annual growth rates (log%) in both of these periods and then by using the differences in the growth rates of these two periods as dependent variables in econometric models. Levels (mean turnover in log in periods 1 and 2, i.e. in pre- and post-innovation periods) are also used as dependent variables in order to get an idea of what kinds of firms are included in the data sets. In the second phase, annual levels (cross-section over many years) and differences in levels (dynamic panel data estimation) of turnover are used as dependent variables.
To gain an insight into the kinds of firms that are included in the data sets, the period- related model in log levels is first estimated, including the two periods simultaneously. The variables used in this analysis are as follows:
Level of turnover, average of the period, log Number of employees, average of the period, log Level of R&D capital, average of the period, log Age of the firm at the time of its first (known) innovation Dummy, domestic patents Dummy, EPO patens Dummy, US patents Dummy, being target in acquisitions Dummy, Tekes subsidised R&D collaboration project starts Dummy, being acquirer in acquisitions Dummy, has launched a product innovation (according to the Sfinno data) Dummy, has launched a product innovation (according to the CIS data) Dummy, recruitment of highly educated personnel
21
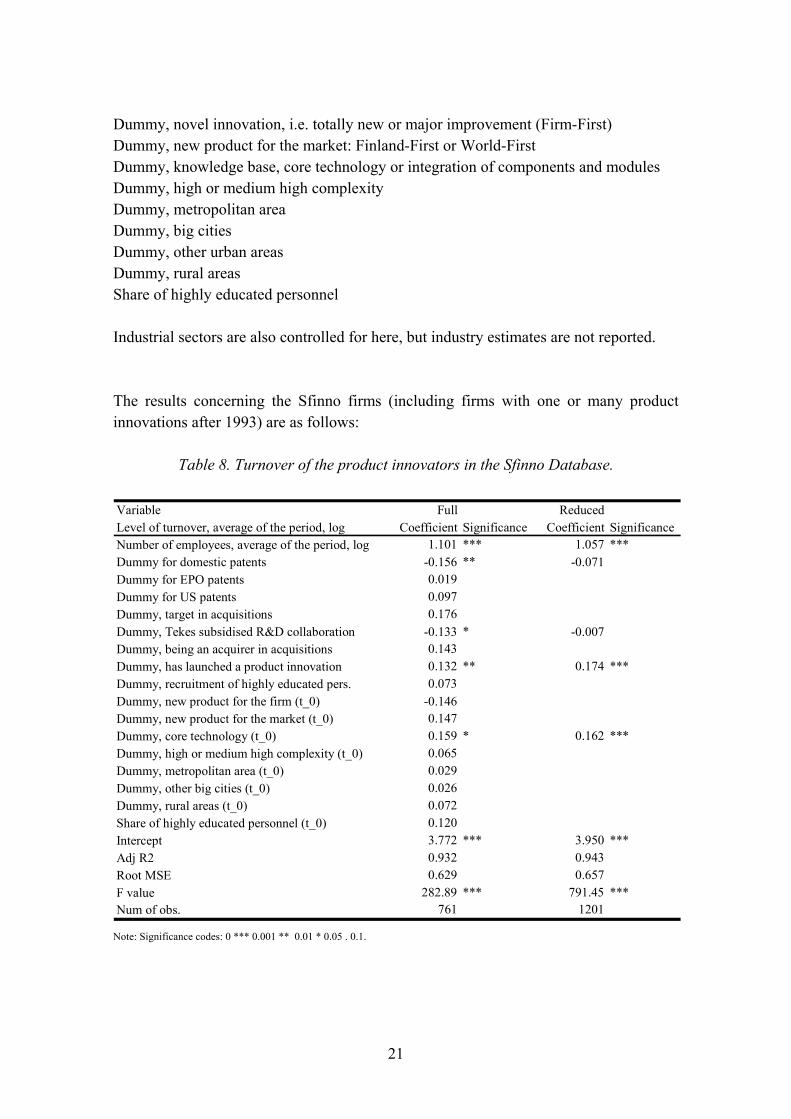
Dummy, novel innovation, i.e. totally new or major improvement (Firm-First) Dummy, new product for the market: Finland-First or World-First Dummy, knowledge base, core technology or integration of components and modules Dummy, high or medium high complexity Dummy, metropolitan area Dummy, big cities Dummy, other urban areas Dummy, rural areas Share of highly educated personnel Industrial sectors are also controlled for here, but industry estimates are not reported.
The results concerning the Sfinno firms (including firms with one or many product innovations after 1993) are as follows:
Table 8. Turnover of the product innovators in the Sfinno Database.
Variable Full Reduced Level of turnover, average of the period, log Coefficient Significance Coefficient SignificanceNumber of employees, average of the period, log 1.101 *** 1.057 *** Dummy for domestic patents -0.156 ** -0.071 Dummy for EPO patents 0.019Dummy for US patents 0.097Dummy, target in acquisitions 0.176Dummy, Tekes subsidised R&D collaboration -0.133 * -0.007 Dummy, being an acquirer in acquisitions 0.143Dummy, has launched a product innovation 0.132 ** 0.174 *** Dummy, recruitment of highly educated pers. 0.073Dummy, new product for the firm (t_0) -0.146Dummy, new product for the market (t_0) 0.147Dummy, core technology (t_0) 0.159 * 0.162 *** Dummy, high or medium high complexity (t_0) 0.065Dummy, metropolitan area (t_0) 0.029Dummy, other big cities (t_0) 0.026Dummy, rural areas (t_0) 0.072Share of highly educated personnel (t_0) 0.120Intercept 3.772 *** 3.950 *** Adj R2 0.932 0.943 Root MSE 0.629 0.657 F value 282.89 *** 791.45 *** Num of obs. 761 1201
Note: Significance codes: 0 *** 0.001 ** 0.01 * 0.05 . 0.1.
22
The results can be summarised as follows:
The level of turnover is positively correlated with the number of employees, launching of an innovation during the period and with a complex knowledge base (core technology or integration of components and modules). It should be noted that not all firms are growing in terms of turnover from period 1 to period 2.
The level of turnover is negatively correlated with domestic patenting and with engagement in R&D collaboration.
The last result tells us nothing more than the fact that firms that have applied for domestic patents or have started R&D projects subsidised by Tekes are, on the average, smaller in terms of turnover than those that have not.
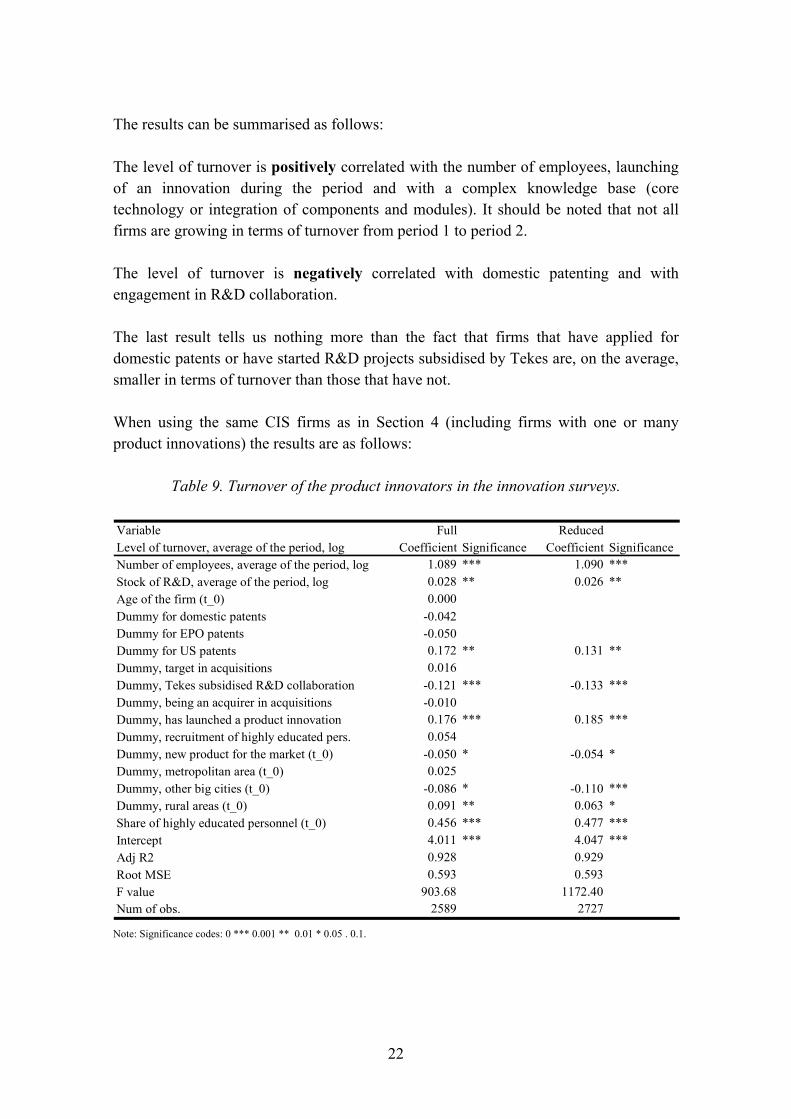
When using the same CIS firms as in Section 4 (including firms with one or many product innovations) the results are as follows:
Table 9. Turnover of the product innovators in the innovation surveys.
Variable Full Reduced Level of turnover, average of the period, log Coefficient Significance Coefficient SignificanceNumber of employees, average of the period, log 1.089 *** 1.090 *** Stock of R&D, average of the period, log 0.028 ** 0.026 ** Age of the firm (t_0) 0.000Dummy for domestic patents -0.042Dummy for EPO patents -0.050Dummy for US patents 0.172 ** 0.131 ** Dummy, target in acquisitions 0.016Dummy, Tekes subsidised R&D collaboration -0.121 *** -0.133 *** Dummy, being an acquirer in acquisitions -0.010Dummy, has launched a product innovation 0.176 *** 0.185 *** Dummy, recruitment of highly educated pers. 0.054Dummy, new product for the market (t_0) -0.050 * -0.054 * Dummy, metropolitan area (t_0) 0.025Dummy, other big cities (t_0) -0.086 * -0.110 *** Dummy, rural areas (t_0) 0.091 ** 0.063 * Share of highly educated personnel (t_0) 0.456 *** 0.477 *** Intercept 4.011 *** 4.047 *** Adj R2 0.928 0.929 Root MSE 0.593 0.593 F value 903.68 1172.40 Num of obs. 2589 2727
Note: Significance codes: 0 *** 0.001 ** 0.01 * 0.05 . 0.1.

23
The results can be summarised as follows:
The factors that correlate positively with the level of turnover (log) are number of employees (log), amount of R&D capital (log), patenting activities in the US, launching of an innovation during the period, and share of highly educated employees.
The factors that correlate negatively with the level of turnover (log) are engagement in R&D collaboration and introduction of new products to the market.
The last result once again tells us no more than the fact that the firms that have engaged in R&D co-operation or have introduced totally new products to the market (i.e. radical innovations) tend to be smaller in terms of turnover than those that have not. This finding supports the hypothesis given in Section 3 that radical innovations are often undertaken by new entrants, i.e. small firms.
The models in levels tell us, however, very little about the effects of launching an innovation onto the market. Therefore, we now go on to consider how the period-related factors correlate with the differences in the average annual growth rates between the periods before and after the commercialisation.5
The variables used in this analysis are as follows:
Differences in the average annual growth rates (period 2 minus period 1), log% Period 1 = (t-4,..,t-1), period 2 = (t+0,..,t+3), t+0= commercialising year Number of employees, year t+0, log Level of R&D stock, year t+0, log Age of the firm at the time of its first (known) innovation, year t+0 Dummy, domestic patents, period 1 Dummy, domestic patents, period 2 Dummy, EPO patens, period 1 Dummy, EPO patens, period 2 Dummy, US patents, period 1 Dummy, US patents, period 2 Dummy, target in acquisitions, period 1 Dummy, target in acquisitions, period 2 Dummy, Tekes subsidised R&D collaboration, period 1 Dummy, Tekes subsidised R&D collaboration, period 2 Dummy, inflow of highly educated personnel, period 1 Dummy, inflow of highly educated personnel, period 2 5 Unexplained exceptionally high annual growth rates (exceeding 600 per cent) have been treated here as outliers and been left out of the analysis. The term �unexplained� here refers to cases in which no information on the reasons for this increase can be found in Business or Trade Registers.
24
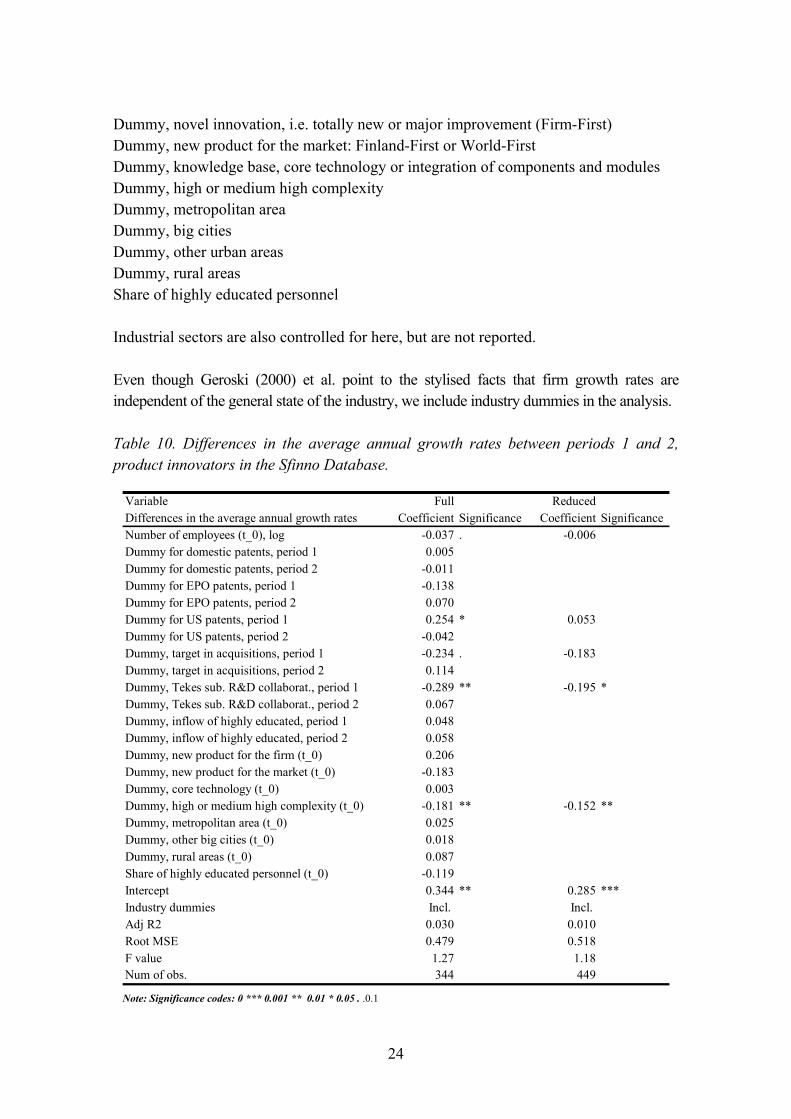
Dummy, novel innovation, i.e. totally new or major improvement (Firm-First) Dummy, new product for the market: Finland-First or World-First Dummy, knowledge base, core technology or integration of components and modules Dummy, high or medium high complexity Dummy, metropolitan area Dummy, big cities Dummy, other urban areas Dummy, rural areas Share of highly educated personnel Industrial sectors are also controlled for here, but are not reported.
Even though Geroski (2000) et al. point to the stylised facts that firm growth rates are independent of the general state of the industry, we include industry dummies in the analysis.
Table 10. Differences in the average annual growth rates between periods 1 and 2, product innovators in the Sfinno Database.
Variable Full ReducedDifferences in the average annual growth rates Coefficient Significance Coefficient SignificanceNumber of employees (t_0), log -0.037 . -0.006Dummy for domestic patents, period 1 0.005Dummy for domestic patents, period 2 -0.011Dummy for EPO patents, period 1 -0.138Dummy for EPO patents, period 2 0.070Dummy for US patents, period 1 0.254 * 0.053Dummy for US patents, period 2 -0.042Dummy, target in acquisitions, period 1 -0.234 . -0.183Dummy, target in acquisitions, period 2 0.114Dummy, Tekes sub. R&D collaborat., period 1 -0.289 ** -0.195 *Dummy, Tekes sub. R&D collaborat., period 2 0.067Dummy, inflow of highly educated, period 1 0.048Dummy, inflow of highly educated, period 2 0.058Dummy, new product for the firm (t_0) 0.206Dummy, new product for the market (t_0) -0.183Dummy, core technology (t_0) 0.003Dummy, high or medium high complexity (t_0) -0.181 ** -0.152 **Dummy, metropolitan area (t_0) 0.025Dummy, other big cities (t_0) 0.018Dummy, rural areas (t_0) 0.087Share of highly educated personnel (t_0) -0.119Intercept 0.344 ** 0.285 ***Industry dummies Incl. Incl. Adj R2 0.030 0.010Root MSE 0.479 0.518F value 1.27 1.18Num of obs. 344 449
Note: Significance codes: 0 *** 0.001 ** 0.01 * 0.05 . .0.1
25
The results can be summarised as follows:
The growth differences of the Sfinno firms between the pre- and post-innovation periods are negatively affected by the size of the firm, new R&D projects before commercialisation and the complexity of the innovation.
US patenting before the commercialisation, however, correlates positively with the increased growth.
On average, new products for the markets have no significant impact on these firm-level growth differences. Novelty (a totally new innovation for the firm) has a positive impact on the growth differences at the 10 per cent level, if the study is concentrated on firms that have only one known innovation over years (not shown in the Table 10).
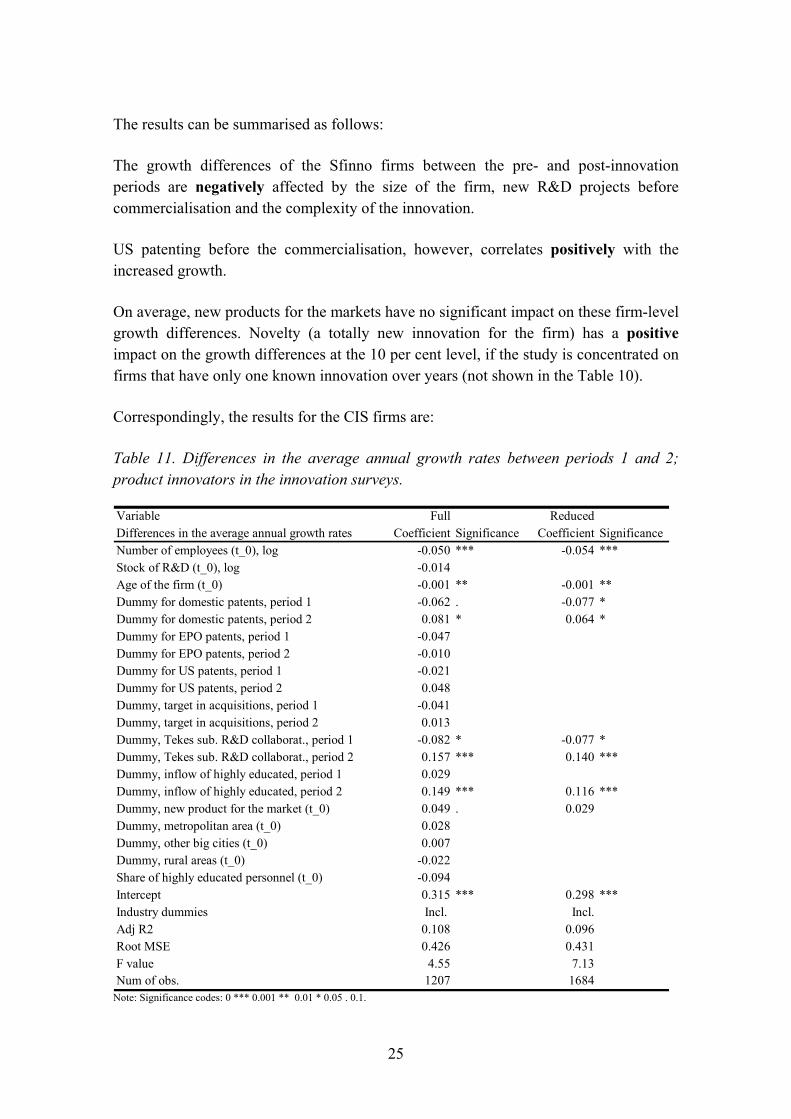
Correspondingly, the results for the CIS firms are:
Table 11. Differences in the average annual growth rates between periods 1 and 2; product innovators in the innovation surveys.
Variable Full ReducedDifferences in the average annual growth rates Coefficient Significance Coefficient SignificanceNumber of employees (t_0), log -0.050 *** -0.054 ***Stock of R&D (t_0), log -0.014Age of the firm (t_0) -0.001 ** -0.001 **Dummy for domestic patents, period 1 -0.062 . -0.077 *Dummy for domestic patents, period 2 0.081 * 0.064 *Dummy for EPO patents, period 1 -0.047Dummy for EPO patents, period 2 -0.010Dummy for US patents, period 1 -0.021Dummy for US patents, period 2 0.048Dummy, target in acquisitions, period 1 -0.041Dummy, target in acquisitions, period 2 0.013Dummy, Tekes sub. R&D collaborat., period 1 -0.082 * -0.077 *Dummy, Tekes sub. R&D collaborat., period 2 0.157 *** 0.140 ***Dummy, inflow of highly educated, period 1 0.029Dummy, inflow of highly educated, period 2 0.149 *** 0.116 ***Dummy, new product for the market (t_0) 0.049 . 0.029Dummy, metropolitan area (t_0) 0.028Dummy, other big cities (t_0) 0.007Dummy, rural areas (t_0) -0.022Share of highly educated personnel (t_0) -0.094Intercept 0.315 *** 0.298 ***Industry dummies Incl. Incl.Adj R2 0.108 0.096Root MSE 0.426 0.431F value 4.55 7.13Num of obs. 1207 1684
Note: Significance codes: 0 *** 0.001 ** 0.01 * 0.05 . 0.1.
26
The results can be summarised as follows:
The differences in growth rates between the pre- and post-innovation periods are significantly negatively affected by the size of the firm (the smaller the firm the higher its growth rate), age (the younger the firm the higher its growth rate) and R&D projects started before the commercialisation (large firms have started these projects before the commercialisation more often than small firms), and almost significantly by domestic patenting before commercialisation (correlates probably with the size of the firm).
Domestic patenting, new R&D collaboration projects, and the recruitment of highly qualified personnel during and after the commercialisation year have a significant positive impact on the growth differences. Products new to the markets also have an almost significant (level 0.1) positive impact on the increased growth.
The first result can be interpreted so that the smaller or younger the firm the higher its growth rate. Furthermore, firms that have applied for domestic patents or are engaged in R&D collaboration before commercialisation are probably larger firms, in consequence patenting and R&D collaboration before the launching of an innovation affects negatively the increase in the growth rates. Among the Sfinno firms, the complexity of an innovation has a negative impact on the increase in the growth rates. This fits well with the hypothesis that large firms undertake complex innovations more often than small firms do.
Both the Sfinno and the CIS firms give evidence that the novelty of an innovation has a positive impact on the realised growth rates, even when the basic characteristics of the innovators, innovative activities and industrial sectors are controlled for. It should be noted that here we looked at up to three years after the innovation only, because of the availability of the data and due to the reason that many of the innovative entrants are merged with other companies when more years have passed from the commercialisation. In addition, we tried to consider here firms� organic growth rather than growth through acquisitions.
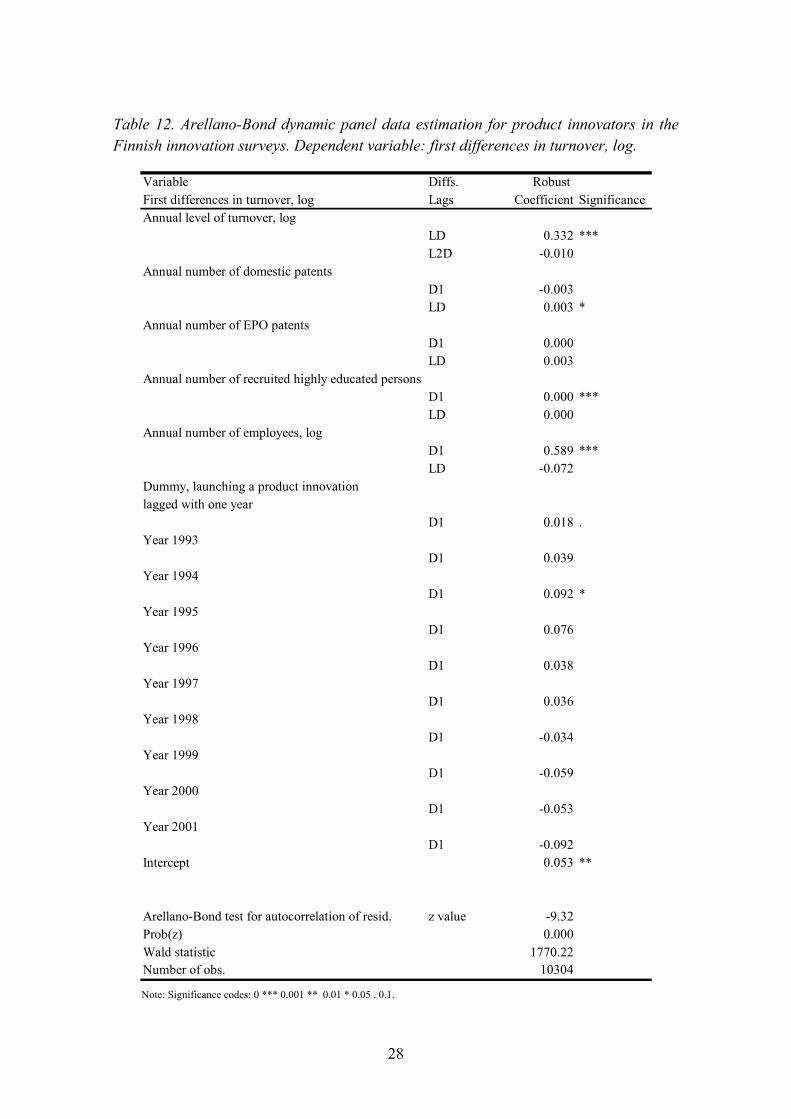
In the following, annual differences in the levels of turnover are analysed by using dynamic panel data estimation (GMM estimation) for the CIS firms with one or more product innovations. We use here a robust estimation model where the first differences in turnover are explained by their earlier differences, differences in the numbers of employees, numbers of highly educated employees, and numbers of patent applications and their lags. The numbers of patent applications were treated as predetermined variables. In this model we added a lagged dummy variable to describe the firms� annual (in fact, period-related) commercialisation activities, and dummies to describe the years under consideration (from 1989 to 2001). Missing innovation observations were treated as zeroes.
27
The estimation results show that most of these variables have a significant positive impact on the sales turnover. For domestic patent applications this effect comes out with a lag of a year. The same holds for the innovation dummy. The commercialisation of a product innovation seems to affect the increase in turnover with a one-year lag among the innovative firms, but not with more lags. It is quite possible, however, that this result comes out mainly through the largest firms in these data sets.6 It is also sensitive to the used data set.
The variables used in this analysis are as follows:
Annual level of turnover, log Annual number of employees, log Annual number of domestic patents Annual number of EPO patents Annual number of US patents Annual number of being as a target in acquisitions Annual number of acquired business units in acquisitions Annual number of recruited highly educated personnel Dummy describing the commercialisation of a product innovation, lagged with one year
6 This issue has been examined more in Lehtoranta (2005a).
28
Table 12. Arellano-Bond dynamic panel data estimation for product innovators in the Finnish innovation surveys. Dependent variable: first differences in turnover, log.
Variable Diffs. Robust First differences in turnover, log Lags Coefficient SignificanceAnnual level of turnover, log
LD 0.332 ***L2D -0.010
Annual number of domestic patentsD1 -0.003LD 0.003 *
Annual number of EPO patentsD1 0.000LD 0.003
Annual number of recruited highly educated personsD1 0.000 ***LD 0.000
Annual number of employees, logD1 0.589 ***LD -0.072
Dummy, launching a product innovationlagged with one year
D1 0.018 .Year 1993
D1 0.039Year 1994
D1 0.092 *Year 1995
D1 0.076Year 1996
D1 0.038Year 1997
D1 0.036Year 1998
D1 -0.034Year 1999
D1 -0.059Year 2000
D1 -0.053Year 2001
D1 -0.092Intercept 0.053 **
Arellano-Bond test for autocorrelation of resid. z value -9.32Prob(z) 0.000Wald statistic 1770.22Number of obs. 10304 Note: Significance codes: 0 *** 0.001 ** 0.01 * 0.05 . 0.1.
29
6. Conclusions The results attained here support the findings in the report of Lehtoranta (2005a). There are certain differences in the realised product innovations between the CIS Surveys and the Sfinno Database. However, the data sets linked with the CIS Surveys and the Sfinno Database give quite a coherent picture of what has happened to these firms after launching their first (known) product innovation.
The analysis supports the view that innovation activities and innovation commercialisations are not pure random events. We found evidence that they are affected by R&D activities, patenting activities, share and inflow of highly qualified personnel (in large companies) and acquisition activities. The acquisition of innovative business units or start-ups increases the innovativeness of incumbent firms and reduces the probability that the (innovative) target firm will launch a product innovation onto the market.
The analysis also found evidence that firm growth is not a pure random process. Firm growth is affected by many innovative activities, such as R&D collaboration, recruitment of highly educated personnel and introduction of totally new products onto the market (radical innovations). On average, acquisition activities do not seem to increase the short-term growth of the firms.
30
References Baily, M.N., Hulten, C., Campbell, D. (1992), Productivity Dynamics in U.S. Manufacturing Plants, Brooking Papers on Economic Activity, Microeconomics, Washington D.C.
Bertscheck, I. (1995), Product and Process Innovation as Response to Increasing Imports and Foreign Direct Investment, Paper presented at EARIE Conference 1995.
Davis, S., Haltiwanger, J., Schuh, S. (1996a), Gross Job Flows in U.S. Manufacturing, U.S. Department of Commerce, Bureau of the Census, Center for Economic Studies, The MIT Press.
Geroski, P., (2000), The Growth of Firms in Theory and Practice, In: Foss, N., Mahnke, V., (eds.), Competences, Governance and Entrepreneurship, Oxford University Press, Oxford.
Geroski, P., Walters, C. (1995), Innovative activity over the business cycle, The Economic Journal 105.
Hyvönen, J. (2002), Significant Innovations in Finland, Mimeo, VTT Group for Technology Studies, Espoo.
Lehtoranta, O. (2005a), A Comparative Micro-Level Analysis of Innovative Firms in the CIS and in the VTT�s Sfinno Database, VTT Working Papers 24, VTT Technology Studies, Espoo.
Nelson, R., Winter, S. (1982), An Evolutionary Theory of Economic Change, Cambridge, MA, Harvard University Press.
Niininen, P., Saarinen, J. (2000), Innovations and the Success of Firms, Working Papers No. 53/00, VTT Group for Technology Studies, Espoo.
Palmberg, C., Leppälahti, A., Lemola T., Toivanen, H. (1999), Towards a better understanding of innovation and industrial renewal in Finland � a new perspective, Working Papers 41/99, VTT Group for Technology Studies, Espoo.
Palmberg, C. (2002a), Successful innovation, The determinants of commercialisation and break-even times of innovations, VTT Publications 486, VTT Technology Studies, Espoo.
Palmberg, C. (2002b), The Origin, Nature and Success of Finnish Innovations � Summarising the Findings of the Sfinno Project, Mimeo, VTT Group for Technology Studies, Espoo.

31
Other literature Abernathy, W., Utterback, J. (1978), Patterns of industrial innovation, Technology Review 2.
Acs, Z., Audretsch, D. (1988), Innovation in large and small firms: an empirical analysis, American Economic Review 78(4).
Acs, Z., Audretsch, D.B. (1990), Innovation and Small Firms, The MIT Press, Cambridge, Massachusetts.
Brouwer, E., Kleinknecht, A. (1996), Determinants of Innovation: A Microeconomic Analysis of Three Alternative Innovation Output Indicators. In Kleinknecht, A. (ed.), Determinants of Innovation, MacMillan Press.
Brouwer, E., Kleinknecht, A., Reijnen, J. (1993), Employment Growth and Innovation at the Firm Level. An Empirical Study, Journal of Evolutionary Economics 3.
Burton, J. (1999), Innovation, entrepreneurship and the firm: a post-Schumpeterian approach, International Journal of Technology Management, Vol. 17 Nos. 1�2.
Davis, S., Haltiwanger, J., Schuh, S. (1996b), Small Business and Job Creation: Dissecting the Myth and Reassessing the Facts, Small Business Economics.
Dosi, G. (1982), Technological paradigms and technological trajectories: A suggested interpretation of the determinants and directions of technological change, Research Policy 11.
Dosi, G. (1988), Sources, procedures, and micro-economic effects of innovation, Journal of Economic Literature 36.
Dosi, G., Nelson, R. (1994), An introduction to evolutionary theories in economics, Journal of Evolutionary Economics 4.
Ebersberger, B., Hyvönen, J., Lehtoranta, O. (2002), Dynamic Patterns of Innovative Activities among Finnish Firms, Interim Report, Mimeo, VTT Technology Studies
Freeman, C., Soete, L. (1997), The Economics of Industrial Innovation, 3. Edition, London.
Grupp, H. (1998), Foundations of Economics of Innovation � Theory, Measurement and Practice, Cheltenham, Edward Elgar.

32
Hollenstein, H. (2001), Innovation Modes in Swiss Service Sector, In OECD (2001b): Innovative Networks: Co-operation in National Innovation Systems, Paris.
Kleinknecht, A. (ed.), (1996), Determinants of Innovation. MacMillan Press.
Kleinknecht, A., van Montfort, K., Brouwer, E., (2002), The Non-trivial Choice between Innovation Indicators, Economics of Innovation and New Technology, Vol. 11(2).
Leppälahti, A. (2000), Comparisons of Finnish Innovation Surveys, Science, Technology and Research 2001:1, Helsinki.
Lööf, H., Heshmati, A., Asplund, R., Nås, S.-O. (2001), Innovation and Performance in Manufacturing Industries: a Comparison of the Nordic Countries, SSE/EFI Working Paper Series in Economics and Finance No. 457.
McGuckin, R.H., Nguyen, S.V. (1998), Exploring the Role of Acquisition in the Performance of Firms: Is the �Firm� the Right Unit of Analysis? In: Biffignandi, S. (ed.), Micro and Macrodata of Firms, Statistical Analysis and International Comparison, Contributions to Statistics, Physica-Verlag.
Malerba, F., Orsenigo, L. (1993), Technological regimes and firm behaviour, Industrial and Corporate Change, Vol. 2, No. 1.
Malerba, F., Orsenigo, L., (1996), The dynamics and evolution of industries, Industrial and Corporate Change, No. 1.
Malerba, F., Orsenigo, L. (1997); Technological regimes and sectoral patterns of innovative activities, Industrial and Corporate Change, Vol. 6, No. 1.
Nely, A., Hii, J. (1998), Innovation and Business Performance: A Literature Review, Centre for Business Performance, The Judge Institute of Management Studies, University of Cambridge.
Nelson, R., Winter, S. (1977), Towards a theory of innovation, Research Policy 6.
OECD (1992), Oslo Manual � Proposed Guidelines for Collecting and Interpreting Technological Innovation Data, First Edition, OECD/DG (92)26, Paris.
OECD (1997), Proposed Guidelines for Collecting and Interpreting Technological Innovation Data: The Oslo Manual, 2nd Edition, OECD, Paris.

33
OECD (2001a), Innovative Clusters: Drivers of National Innovation Systems, OECD Proceedings, OECD, Paris.
OECD (2001b), Innovative Networks: Co-operation in National Innovation Systems, OECD Proceedings, OECD, Paris.
Palmberg, C., Niininen P., Toivanen, H., Wahlberg, T. (2000), Industrial Innovation in Finland, First Results of the Sfinno Project, Working Papers 47/00, VTT Group for Technology Studies, Espoo.
Palmberg, C. (2001), Sectoral Patterns of Innovations and Competence Requirements � A Closer Look at Low-tech Industries, Sitra Reports Series 8, Sitra, Helsinki.
Pavitt, K. (1984), Sectoral Patterns of Technical Change: Towards a Taxonomy and Theory, Research Policy, Vol. 13 (6).
Peters, B. (2004), Employment Effects of Different Innovation Activities: Microeconometric Evidence, Discussion Paper No. 04-73, ZEW, Centre for European Economic Research.
Sahal, D. (1981), Patterns of technological innovation, Addison Wesley Publishing Company, London.
Sandven, T. (2000), Innovation and economic performance at the enterprise level, STEP report 10. STEP, Oslo.
Schmookler, J. (1966), Invention and economic growth, Cambridge, MA, Harvard University Press.
Schumpeter, J.A. (1934), The Theory of Economic Development, Cambridge, MA, Harvard University Press.
Sheikh, S., Oberholzner, T. (2001), Innovative small and medium sized enterprises and the creation of employment, European Commission.
Smolny, W. (1998), Innovations, Prices and Employment: A Theoretical Model and an Empirical Application for West German Manufacturing Firms, Journal of Industrial Economics 46(3).
Storey, D. J. (1994), Understanding the Small Business Sector, Routledge, London.

34
Tanayama, T. (2002), Empirical analysis of processes underlying various technological innovations, VTT Publications 463, VTT Technology Studies, Espoo.
Tether, B.S. (1997), Growth diversity amongst innovative and technology-based new and small firms: an interpretation, New Technology, Work and Employment 12:2, Blackwell Publishers Ltd.
Tether, B.S. (1998), Small and large firms: sources of unequal innovations? Research Policy 27 (1998).
Tether, B.S., Smith, I.J., Thwaites, A.T. (1997), Smaller enterprises and innovation in the UK: the SPRU Innovation Database revisited, Research Policy 2.
Tether, B.S. (2001), Identifying Innovation, Innovators and Innovative Behaviours: A Critical Assessment of the Community Innovation Survey (CIS), CRIC Discussion Paper No 48, The University of Manchester.
Toivanen, H. (2000), Software Innovation in Finland, Working Papers No. 52/00, VTT Group for Technology Studies, Espoo.
Van Reenen, J. (1997), Employment and technological innovation: Evidence from the UK manufacturing firms, Journal of Labour Economics 15.
ISBN 951�38�6575�4 (URL: http://www.vtt.fi/inf/pdf/) ISSN 1459�7683 (URL: http://www.vtt.fi/inf/pdf/)
VTT WORKING PAPERS VTT TEKNOLOGIAN TUTKIMUS � VTT TEKNOLOGISTUDIER � VTT TECHNOLOGY STUDIES
3 Kivisaari, Sirkku, Saranummi, Niilo & Parvinen, Petri. Vanhusten palvelut Espoossa. Kehittämisen lähtökohdat juurruttamalla. 2004. 59 s. + liitt. 2 s.
8 Ebersberger, Bernd. The Use and Appreciation of Knowledge-Intensive Service Activities in Traditional Industries. 2004. 31 p.
9 Ebersberger, Bernd. Labor Demand Effect of Public R&D Funding. 2004. 26 p.
17 Lähteenmäki-Smith, Kaisa, Hyytinen, Kirsi & Konttinen, Jari. Vaikuttavuutta metsäosaamiseen. Tapauksena metsäkeskusten ja Metsätalouden kehittämiskeskus Tapion palvelusopimus. 2005. 47 s. + liitt. 12 s.
24 Lehtoranta, Olavi. A comparative micro-level analysis of innovative firms in the CIS Surveys and in the VTT's Sfinno Database. 2005. 59 p. + app. 14 p.
25 Lehtoranta, Olavi. Determinants of Innovation and the Economic Growth of Innovators. Tracing the evolution of innovative firms over time. 2005. 34 p.