
Determinants of Financial Performance: The Case of … Review of Business Research Papers Vol. 9....
20
International Review of Business Research Papers Vol. 9. No. 6. November 2013 Issue. Pp. 111 – 130 Determinants of Financial Performance: The Case of General Takaful and Insurance Companies in Malaysia Muhaizam Ismail* Preserving financial stability is integral in developing financial institutions that are robust, resilient and competitive. This paper investigates the determinants of financial performance of general Islamic and conventional insurance companies in Malaysia using panel data over the period of 2004 to 2007, using investment yield as the performance measure. This measure is related to a number of economic and firm specific variables, which are the profit/interest rate levels, equity returns, size of company, retakaful/reinsurance dependence, solvency margin, liquidity, and contribution/premium growth, chosen based on relevant theory and literature. Three models of panel data estimation are employed for this study. Based on the empirical results, this study finds that size of company, retakaful dependence and solvency margin are statistically significant determinants of the investment performance of the general Islamic insurance companies in Malaysia. For conventional insurance, all factors are statistically significant determinants of investment performance, except for equity returns. JEL Codes: G22 1. Introduction The Islamic insurance, also known as takaful, is a Shariah-compliant mutual risks arrangement based on the concepts of taawun’ (mutual protection) and shared responsibility. In a takaful arrangement, a group of participants mutually agree to jointly guarantee among themselves against a defined risk or catastrophe befalling one’s life, property or any form of valuable things (Mohd. Ma’sum Billah 2007). The participants agree to relinquish a sum of contribution as tabarru' (donation) into a pool of fund to fulfil their obligation of mutual help and joint guarantee should any of the participants suffer a defined loss. i In contrast, insurance is a risk transfer mechanism whereby an individual or business enterprise known as the insured, transfer risks for a premium (price) to another party known as the insurer (Bickelhaupt 1974). Both takaful and insurance have a common primary objective of reducing the burden of financial loss to individuals or firms. The operational activities undertaken by both sectors are similar but in the case of takaful company it has to further ensure that the operational activities are Shariah compliant. The aim of this study is to examine the determinants of financial performance of the general takaful and insurance companies ii in Malaysia. The study utilises the economics paradigm in analysing performance and not behavioural paradigm. The study of the financial performance of the takaful and insurance companies is particularly significant in view of the current financial landscape that is becoming increasingly challenging. The growing number of insurance companies’ failures in recent years has caused further concerns on the financial stability of the takaful and insurance industries to stakeholders. The study is also particularly relevant in view that the general takaful sector in Malaysia has yet to make a significant impact as compared to its counterpart, the insurance sector. In terms of financial performance, *Dr. Muhaizam Ismail, International Islamic University, Malaysia. Email: [email protected]
Transcript of Determinants of Financial Performance: The Case of … Review of Business Research Papers Vol. 9....

International Review of Business Research Papers
Vol. 9. No. 6. November 2013 Issue. Pp. 111 – 130
Determinants of Financial Performance: The Case of General Takaful and Insurance Companies in Malaysia
Muhaizam Ismail*
Preserving financial stability is integral in developing financial institutions that are robust, resilient and competitive. This paper investigates the determinants of financial performance of general Islamic and conventional insurance companies in Malaysia using panel data over the period of 2004 to 2007, using investment yield as the performance measure. This measure is related to a number of economic and firm specific variables, which are the profit/interest rate levels, equity returns, size of company, retakaful/reinsurance dependence, solvency margin, liquidity, and contribution/premium growth, chosen based on relevant theory and literature. Three models of panel data estimation are employed for this study. Based on the empirical results, this study finds that size of company, retakaful dependence and solvency margin are statistically significant determinants of the investment performance of the general Islamic insurance companies in Malaysia. For conventional insurance, all factors are statistically significant determinants of investment performance, except for equity returns.
JEL Codes: G22
1. Introduction The Islamic insurance, also known as takaful, is a Shariah-compliant mutual risks arrangement based on the concepts of taawun’ (mutual protection) and shared responsibility. In a takaful arrangement, a group of participants mutually agree to jointly guarantee among themselves against a defined risk or catastrophe befalling one’s life, property or any form of valuable things (Mohd. Ma’sum Billah 2007). The participants agree to relinquish a sum of contribution as tabarru' (donation) into a pool of fund to fulfil their obligation of mutual help and joint guarantee should any of the participants suffer a defined loss.i In contrast, insurance is a risk transfer mechanism whereby an individual or business enterprise known as the insured, transfer risks for a premium (price) to another party known as the insurer (Bickelhaupt 1974). Both takaful and insurance have a common primary objective of reducing the burden of financial loss to individuals or firms. The operational activities undertaken by both sectors are similar but in the case of takaful company it has to further ensure that the operational activities are Shariah compliant. The aim of this study is to examine the determinants of financial performance of the general takaful and insurance companiesii in Malaysia. The study utilises the economics paradigm in analysing performance and not behavioural paradigm. The study of the financial performance of the takaful and insurance companies is particularly significant in view of the current financial landscape that is becoming increasingly challenging. The growing number of insurance companies’ failures in recent years has caused further concerns on the financial stability of the takaful and insurance industries to stakeholders. The study is also particularly relevant in view that the general takaful sector in Malaysia has yet to make a significant impact as compared to its counterpart, the insurance sector. In terms of financial performance,
*Dr. Muhaizam Ismail, International Islamic University, Malaysia. Email: [email protected]

Ismail
112
the general takaful business constitutes only a smaller segment of the total insurance business in Malaysia, representing 8.2% (2008)iii of the combined gross contributions of the insurance industry. The study is also significant in view of Malaysian dual financial system, whereby takaful companies operate in parallel with insurers. As such, understanding the differences in the determinants of financial performance of the two industries is one of the ways which could assist the regulators in implementing the most suitable policies for the two industries. The findings from this study are consistent with previous studies except for the relationship between investment yield and profit/interest rate levels. This paper extends prior research and contributes to the literature on the determinants of performance in a number of ways. First, this study extends the study on the determinants of performance to another form of insurance which is takaful. The previous studies such as Adams (1996), Adams and Buckle (2003) and Shiu (2004) focus mainly on the performance of the insurance business. Second, the study provides a comparative analysis of the determinants of financial performance for two different insurance systems in Malaysia which are the Islamic and conventional insurance. Third, the study provides insight into factors affecting the financial performance of the general takaful and insurance companies in Malaysia which will be of interest to regulatory authorities, industry and participants/policyholders. The remainder of this paper is organised as follows. Section 2 reviews the relevant literature and formulates hypotheses. Section 3 discusses on the methodology and model building. Section 4 presents the empirical findings and the final section summarises and concludes the paper.
2. Literature Review This section reviews literature on the possible relationship between general takaful and insurance performance and its determinants, and formulates hypotheses that match the underlying theory based upon the literature reviewed. 2.1 Profit or Interest Rate Levels A rise in profit/interest rates produces greater returns on investment assets and this will increase the total company’s returns, provided the returns are not counteract by lower underwriting gains. According to D’ Arcy (1979), high interest rates will give rise to high investment earnings and consequently this would enhance the investment performance of insurance companies. Bonds and fixed deposits are examples of investment portfolios which depend mostly on the levels of interest rates for returns on investment. According to Browne and Hoyt (1995), as interest earnings are a significant source of revenue for insurers, companies are more likely to perform well and remain solvent when interest earnings are high. Therefore, it is expected that performance is positively related to profit/interest rate levels. 2.2 Equity Returns Investment in equity portfolio will provide takaful and insurance companies with a stream of dividend income. According to Browne, Carson and Hoyt (1999), as equity
Ismail
113
returns increase, returns on insurer’s investment portfolio may also increase and this will improve the performance of the insurer. Booth, Cooper, Haberman and James (1999) are of the view that equities have the benefit of providing inflation hedge and over the long term, the investment would be expected to give higher real returns than fixed interest investments. However, a higher proportion of investment in equities could lead to a higher risk of insolvency if the values of the assets dropped. Thus, we expect a positive relationship between performance and equity returns. 2.3 Company Size Hardwick (1997) argues that there is a positive relationship between performance and size due to operating cost efficiencies through increasing output and economising on unit of cost. Large corporate size also enables insurers to effectively diversify their assumed risks and respond more quickly to changes in market conditions. Industrial organisation economists such as Bain (1968) and Scherer (1980) have argued that large firms possess monopoly power which allows them to set prices above the economic costs involved in the production of the products resulting in additional profit for the larger firms. In terms of investment performance, Adams (1996) believes that large companies are able to diversify their investment portfolios and this could reduce their business risks. Grace and Timme (1992) suggest that large companies generally outperform smaller ones because they manage to utilise economies of scale and have the resources to attract and retain managerial talent. Therefore, it is expected that performance is positively related with size of company. 2.4 Retakaful or Reinsurance Dependence Insurance and takaful companies undertake reinsurance and retakaful, respectively with the aims of improving their financial performance and security. According to Fiegenbaum and Thomas (1990), the proper selection of reinsurance may therefore improve underwriting performance, mainly in relation to the spreading of risks. However, Shiu (2004) has a contradictory view with regard to reinsurance as he believes though reinsurance increases operational stability, greater dependence on reinsurance will reduce the company’s retention level which will cause lower potential profitability for the insurer. Furthermore, even if the insurer may gain in the short-run due to reinsurance protection during poor underwriting year, insurer profitability is reduced with reinsurance in the long run, as otherwise there would be no profitable reinsurers. Booth et al. (1999) are of the view that reinsurance is one of the financial dynamics of the insurance operation that can lead to substantial variability in the overall financial results. Therefore, consideration must be given to the type of reinsurance to buy and the way it matches the exposures and resulting claims. Based on the above, there is no prior expectation on the direction of the relationship between performance and retakaful/reinsurance dependence. 2.5 Solvency Margin Solvency margin is the amount of capital which acts as a cushion to absorb the risk of conducting insurance or takaful. The capital or surplus is measured as the excess of assets over obligations. Consequently, insurance companies with higher solvency margin are considered to be more financially sound as it has more surpluses to cater

Ismail
114
for any unexpected losses. In theory, prospective policyholders would prefer to buy policies from financially sound insurance companies. According to Butsic (1994), many policyholders especially business customers would normally research for the information on the financial soundness of their insurers. Shiu (2004) believes that insurance performance may improve through a higher solvency margin as better risks are attracted to the more stable insurers and this will contribute towards higher premium revenues. Therefore, we expect that the relationship between performance and retakaful/reinsurance dependence would be positive. 2.6 Stability of Underwriting Operation An increase in premium growth could improve the financial performance of insurance companies as it provides inflows of income to the company. However, the National Association of Insurance Commissioners (2001) in the United States denotes that a remarkable increase in premium volume could indicate favourable business expansion and thus improve earnings, provided it is accompanied by adequate reserves, profitable operation and stable product mix. According to Shiu (2004), a dramatic change in underwriting performance could signal that the insurance company is facing financial difficulty as general insurers will sometimes engage in “cash-flow underwriting” as a means to survive financial difficulties. Through this arrangement, the price of the insurance product will be discounted below its true value and the premiums generated from the sales will be invested in financial instruments that earn higher investment returns. Shiu (2004) is also of the view that an underwriting cycle can have impact on the stability of the underwriting operation of insurance companies. Accordingly, there is no prior expectation on the direction of the relationship between performance and stability of the underwriting operation.
2.7 Liquidity According to Shiu (2004), companies with more liquid assets are likely to perform better as they are able to realise cash at any point of time to meet its obligation and are less exposed to liquidity risks. By not having sufficient cash or liquid assets, insurance companies may be forced to sell investment securities at a substantial loss in order to settle claims promptly. However, there are contrasting views with regard to performance and liquidity in relation to the agency theory. According to Pottier (1998), high liquidity could increase agency costs for owners by providing managers with incentives to misuse excess cash-flows by investing in projects with negative net present values and engaging in excessive perquisite consumption. According to Adam and Buckle (2003), liquidity measures the ability of managers in insurance and reinsurance companies to fulfil their immediate commitments to policyholders and other creditors without having to increase profit from underwriting and investment activities and/or liquidate financial assets. Therefore, having high liquidity obviates the need for the management of the insurance companies to improve their financial performance. Consequently, there is no prior expectation on the direction of the relationship between performance and liquidity. The above determinants have been empirically studied in the insurance sector. However, none of the factors identified above have been explored in the area of takaful. Empirical evidence on the subject of takaful is very limited and in most cases is conceptual in nature such as studies by Kamaruddin Shariff (2004), Mohd Ma’sum

Ismail
115
Billah (2007), Mohammad Daud Bakar (2009) and Mazlan Mohamad Hussain (2009). Due to the limited literature and empirical evidence on this topic, it is believed that related studies on insurance companies would be able to provide useful insight and information on factors affecting the financial performance of the takaful companies in Malaysia. The limitations of the previous studies among others are related to data constraints in terms of unavailability of certain data (Adams 1996) and lack of convenient sources for data (Browne, Carson and Hoyt 2001). Study by Adams and Buckle (2003) also indicates limitations due to concentration on one segment that is relatively small, highly concentrated and largely unregulated. It is also observed that the previous studies focus mainly on insurers operating in the United States, United Kingdom and other developed countries.
3. The Methodology and Model 3.1 Dependent Variable and its Measurement Investment yield is chose as the dependent variable as it reflects one of the major activities of the general takaful and insurance businesses. Investment is an integral function of the takaful and insurance companies as their key role is to mobilise the contribution/premium received from the participants/insured in prudent investment activities to ensure that the fund is sufficient to compensate future claims of the participants/insured. Investment yield is measured as the net investment income divided by the average invested assets. 3.2 Explanatory Variables and their Measurements The choice of explanatory variables is based on their theoretical relationship with the dependent variable. This paper takes into account both economic and firm specific variables affecting the performance of Malaysian general takaful and insurance companies. The economic variables reflect the market structure in which the industries compete whilst the firm-specific variables refer to the operating or corporate characteristics of the takaful and insurance companies. These explanatory variables and their measurements are as follows: a) Profit / Interest rate levels
For takaful, the variable for profit rate level (PRL) is measured by the 5-year Government Investment Issue yields. For insurance, the variable for interest rate level (IRL) is measured by the 5-year Malaysian Government Securities yields.
b) Equity returns For takaful, the variable for equity returns (SI) is measured by the Kuala Lumpur Shariah Index. For insurance, the variable for equity returns (CI) is measured by the Kuala Lumpur Composite Index.
c) Company size For takaful and insurance, the variable for company size (LOGTA) is measured by the natural log of total assets.
d) Retakaful / reinsurance dependence

Ismail
116
For takaful, the variable for retakaful dependence (RTCTA) is measured by the amount of retakaful ceded to total assets. For insurance, the variable for reinsurance dependence (RICTA) is measured by the amount of reinsurance ceded to total assets.
e) Solvency margin For takaful, the variable for solvency margin (NANCW) is measured by net assets to net contributions written. For insurance, the variable for solvency margin (NANPW) is measured by net assets to net premiums written.
f) Stability of underwriting operation For takaful, the variable for stability of underwriting operation (CGCW) is measured by the change in the gross contributions written of current year as compared to previous year. For insurance, the variable for stability of underwriting operation (CGPW) is measured by the change in the gross premiums written of current year as compared to previous year.
g) Liquidity For takaful and insurance the variable for liquidity (TLLA) is measured by total liability to liquid assets.
3.3 Estimation Method and Model In determining the factors that affect the financial performance of the general takaful and insurance companies, the general estimation model is developed based on the characteristics of the data used in this study which is the combination of cross-sectional observations and time series. Three models of estimation were employed, namely generalized least squares with non-effects, generalized least squares with fixed effects and generalized least squares with random effects. The equation models of non-effects are as follows:
i) Model for Takaful TIYit = α0 + ß1 PRLit + ß2SI it + ß3LOGTAit + ß4RTCTAit + ß5NANCWit +
ß6CGCWit + ß7TLLAit + εit
ii) Model for Insurance CIYit = α0 + ß1 IRLit + ß2CIit + ß3LOGTAit + ß4RICTAit + ß5NANPWit +
ß6CGPWit + ß7TLLAit + εit
The fixed effects and random effects models are the two types of models frequently used by researchers for panel data analysis. The equations of fixed effects model are as follows:
i) Model for Takaful TIYit = α0 + α1D1i + α2D2i + α3D3i + α4D4i + ……+ αnDni + ß1 PRLit + ß2SI it +
ß3LOGTAit + ß4RTCTAit + ß5NANCWit + ß6CGCWit + ß7TLLAit + εit ii) Model for Insurance
CIYit = α0 + α1D1i + α2D2i + α3D3i + α4D4i + ……+ αnDni + ß1 IRLit + ß2CIit +
ß3LOGTAit + ß4RICTAit + ß5NANPWit + ß6CGPWit + ß7TLLAit + εit
The equations of random effects model are as follows:
i) Model for Takaful

Ismail
117
TIYit = α0i + ß1 PRLit + ß2SI it + ß3LOGTAit + ß4RTCTAit + ß5NANCWit + ß6CGCWit + ß7TLLAit + εit+µit
ii) Model for Insurance
CIYit = α0i + ß1 IRLit + ß2CI it + ß3LOGTAit + ß4RICTAit + ß5NANPWit + ß6CGPWit + ß7TLLAit + εit + µit
where, D1i, D2i….Dni are values for each unit of the cross-section; ε = error term; i =i
th firm; t = tth period. The model specification tests used in this study to decide on the most appropriate and best estimation model are the Breusch Pagan Lagrange multiplier test, likelihood ratio test and Hausman test. The diagnostic tests carried out for this study to ensure valid conclusions are drawn based on the pooled and panel data regression results are the normality test, multicollinearity test, heteroscedasticity test and autocorrelation test. This paper has improved the previous studies in terms of providing empirical evidence on the determinants of financial performance of the general takaful company as well as comparative analysis of the determinants of financial performance for two different insurance systems which are the Islamic and conventional insurance. In terms of model, this study is the first attempt to utilise monthly financial data to conduct the analyses of the determinants of financial performance of the takaful and insurance companies. Previous empirical studies of the financial performance of insurance companies were based on yearly or quarterly financial data. 3.4 Data The performance model for this study is constructed based on the financial data from the statutory returns filed by the Malaysian takaful and insurance sectors to the regulator which is the Central Bank of Malaysia. One of the constraints faced in this study is the lack of data for the Malaysian takaful industry. This is because takaful is still considered as a new industry compared to the insurance business. Furthermore, takaful companies in Malaysia are established at different points in time and the time lag is quite far apart from one company to another. The first takaful company was incorporated in 1984, and this is followed by the second takaful company nine years later. The third and fourth takaful companies were given licenses in the year 2001 and 2003, respectively, which is eight years after the second takaful company was formed. Four more licenses were given in 2006 and the ninth license was given in 2007. The data for this study is taken from the period of January 2004 to October 2007. The period of study commences in January 2004, which marks the first monthly submission of data by the takaful companies. There are four takaful companies that are included in the study. One of the reasons for including these companies in the sample data is because they constitute more than 80% of the general takaful business in Malaysia. Five other takaful companies are not included in the sample study. These are new takaful companies which commenced business in 2006 or 2007. These companies are not included in the sample data as they tend to concentrate more on the family takaful business instead of the general takaful business during their initial stage of operation. Furthermore, as these are new

Ismail
118
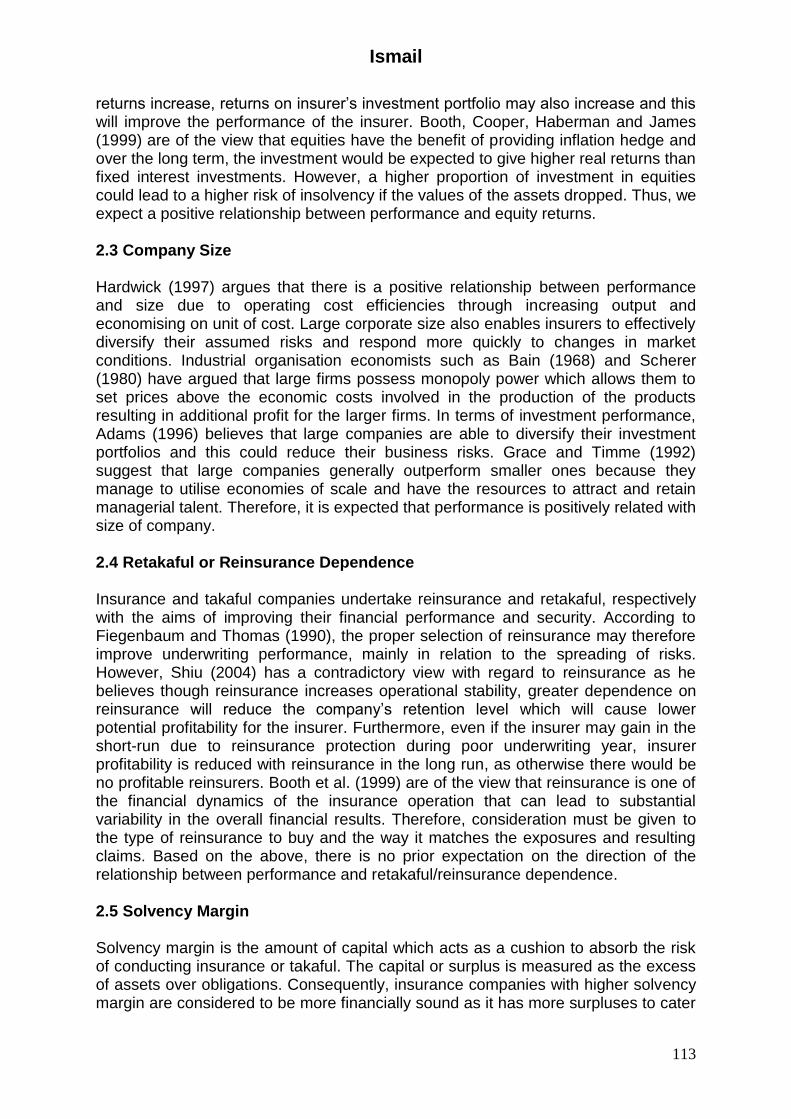
companies, there are many general takaful data which are insufficient for the purpose of this study. Based on a monthly time series, the final total number of observations for the general takaful business for the period of January 2004 until October 2007 is 184. For insurance, as of 2004, there were twenty-six general insurance companies and nine composite insurance companies in Malaysia. The number of general insurance companies that are included in the study is twenty-two. Insurance companies having composite license and general insurance companies with incomplete data are excluded from the sample study. This is consistent with the approach taken by Shiu (2004) who focuses on insurance companies that conduct exclusively general insurance business. The final total number of observations for the general insurance companies based on monthly time series for the period of January 2004 until October 2007 is 1,012. Tables 1 and 2 present the descriptive statistics of the variables for the determinants of financial performance of takaful and insurance, respectively. The tables illustrate the results of the mean, standard deviation, skewness, kurtosis and Jarque-Bera. Based on Tables 1 and 2, the assessment of the sample data for takaful and insurance indicates that the values of the mean and median for each variable are dissimilar. Furthermore, the values of skewness and kurtosis for all variables are unequal to zero and three, respectively. In terms of Jarque-Bera, the values for all variables are significant at the one percent level and hence it rejects the hypothesis that the data is normally distributed. Based on this analysis, it can be concluded that the sample data for takaful and insurance is not normally distributed. Thus, the preliminary statistical analyses show that the estimation on the determinants of financial performance for takaful and insurance could not produce better results using the ordinary least squares estimation method. Hence, generalized least squares estimation method is more appropriate and expected to yield better results.
Ismail
119
Table 1 Descriptive Statistics - Takaful
Variables Mean Median Std. Dev. Skewness Kurtosis Jarque-Bera
IY 0.0113 0.00985 0.0079 0.7615 2.8649 17.9249*
PRL 3.8334 3.7400 0.3121 0.8083 2.6185 21.1524*
SI 145.8 133.47 26.98722 1.38667 3.38720 60.1173*
LOGTA 18.4977 18.971 1.4395 -0.4957 1.880 17.1521*
RTCTA 0.0767 0.0568 0.0716 1.5039 4.9772 99.3295*
NANCW 6.2303 2.9950 9.5738 4.3849 25.4314 4447.251*
CGCW 0.2779 0.1823 0.2763 2.8960 14.9568 1353.253*
TLLA 1.0637 1.0804 0.1642 -1.4989 7.8483 249.1055*
Table 2 Descriptive Statistics – Insurance
Variables Mean Median Std. Dev. Skewness Kurtosis Jarque-Bera
IY 0.0178 0.0169 0.0108 0.4568 2.5907 42.2577*
IRL 3.8124 3.7225 0.3347 0.5940 2.2641 82.358*
CI 993.835 916.730 176.277 1.1906 2.9483 239.209*
LOGTA 19.8619 19.8856 0.4947 0.9736 4.5955 267.226*
RICTA 0.1057 0.0814 0.0834 1.0317 3.3576 184.928*
NANPW 3.7029 2.1523 4.4050 3.0401 15.5622 8213.1*
CGPW 0.2634 0.1535 0.3380 6.3721 69.0178 190625.5*
TLLA 0.8375 0.8171 0.1845 0.7645 3.4474 107.023*
Notes: *Significant at 1% level
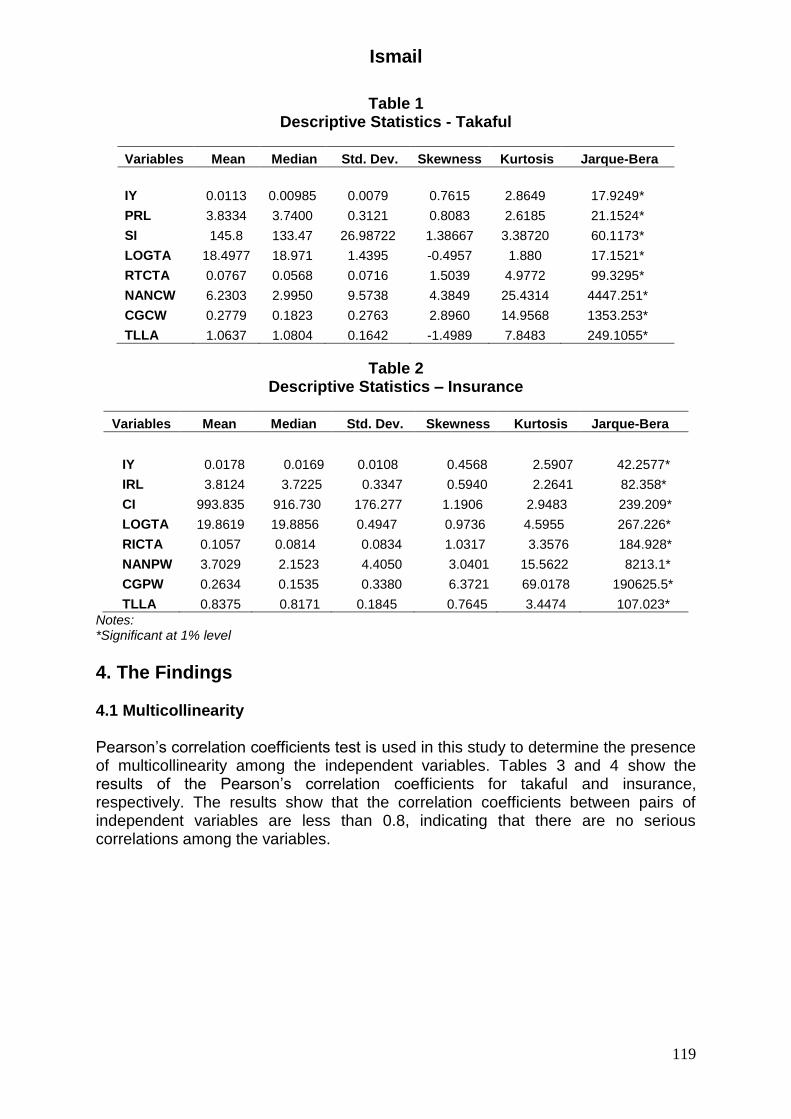
4. The Findings 4.1 Multicollinearity Pearson’s correlation coefficients test is used in this study to determine the presence of multicollinearity among the independent variables. Tables 3 and 4 show the results of the Pearson’s correlation coefficients for takaful and insurance, respectively. The results show that the correlation coefficients between pairs of independent variables are less than 0.8, indicating that there are no serious correlations among the variables.
Ismail
120
Table 3 Correlation Matrix of Independent Variables - Takaful
PRL SI LOGTA RTCTA NANCW CGCW TLLA
PRL 1 SI -0.475 1
LOGTA -0.125 0.227 1 RTCTA 0.007 -0.059 0.539 1
NANCW 0.062 -0.164 -0.459 -0.375 1 CGCW 0.094 -0.103 -0.161 -0.350 0.239 1
TLLA -0.254 0.168 0.336 0.146 -0.428 -0.200 1
Table 4 Correlation Matrix of Independent Variables - Insurance
IRL CI LOGTA RICTA NANPW CGPW TLLA
IRL 1 CI -0.495 1
LOGTA -0.061 0.141 1 RICTA -0.021 -0.031 -0.282 1
NANPW 0.016 -0.104 -0.273 -0.326 1 CGPW 0.053 -0.043 -0.002 -0.232 0.153 1
TLLA 0.032 -0.041 0.403 -0.158 -0.248 0.080 1
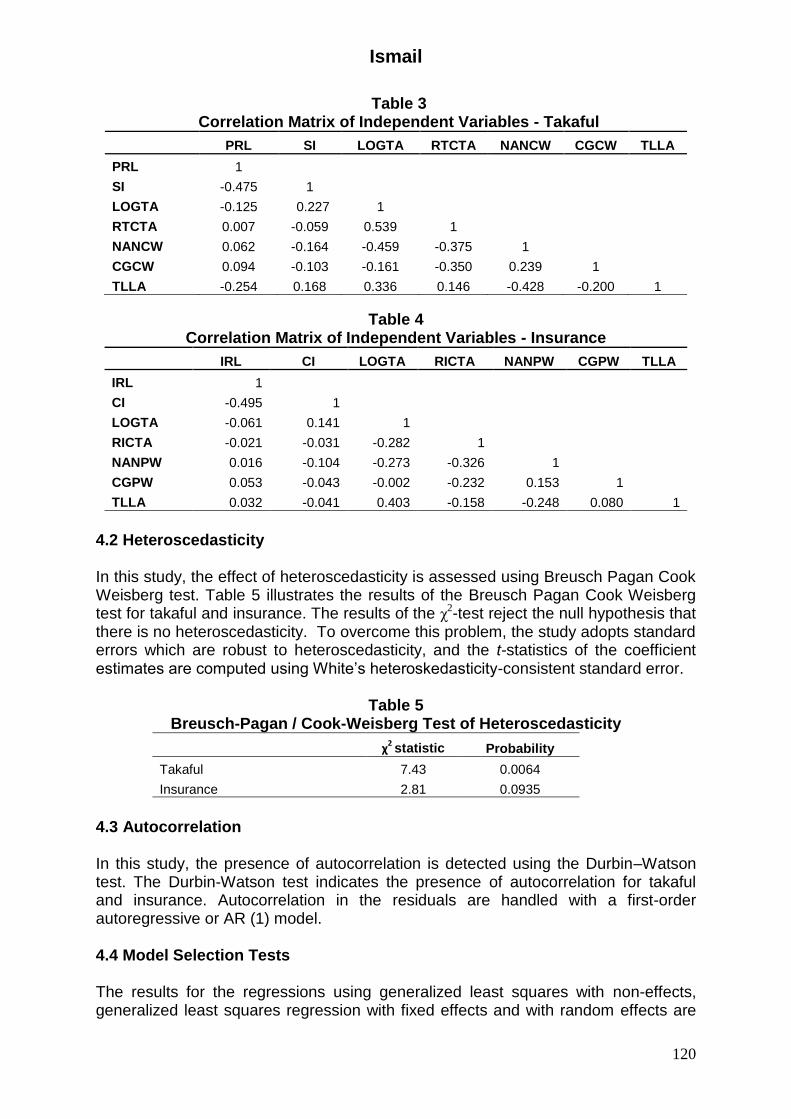
4.2 Heteroscedasticity In this study, the effect of heteroscedasticity is assessed using Breusch Pagan Cook Weisberg test. Table 5 illustrates the results of the Breusch Pagan Cook Weisberg test for takaful and insurance. The results of the χ2-test reject the null hypothesis that there is no heteroscedasticity. To overcome this problem, the study adopts standard errors which are robust to heteroscedasticity, and the t-statistics of the coefficient estimates are computed using White’s heteroskedasticity-consistent standard error.
Table 5 Breusch-Pagan / Cook-Weisberg Test of Heteroscedasticity
χ2 statistic Probability
Takaful 7.43 0.0064
Insurance 2.81 0.0935
4.3 Autocorrelation In this study, the presence of autocorrelation is detected using the Durbin–Watson test. The Durbin-Watson test indicates the presence of autocorrelation for takaful and insurance. Autocorrelation in the residuals are handled with a first-order autoregressive or AR (1) model. 4.4 Model Selection Tests
The results for the regressions using generalized least squares with non-effects, generalized least squares regression with fixed effects and with random effects are

Ismail
121
shown in Appendix. The most appropriate estimation model of the three alternative regression specifications is chosen based on the results of the Lagrange Multiplier, Likelihood Ratio and Hausman tests as shown in Table 6 below. In analysing the results, the Lagrange Multiplier and Likelihood Ratio tests show that the χ2 values for takaful and insurance are significant at the 1 percent level, indicating that fixed effects model is better than pooled model. The Hausman test for random effects versus fixed effects for takaful and insurance also shows that the χ2 values are significant at the 1 percent level. This suggests that the fixed effects model is the most appropriate model for takaful and insurance. Based on the results of the Lagrange Multiplier, Likelihood Ratio and Hausman tests, it can be concluded that of the three alternative regression specifications, the fixed effects model is the most appropriate model for the takaful and insurance sectors.
The findings support the argument by Baltagi (1995) who affirms that random effects model would not be appropriate when the sample is not randomly taken from a large population. This is the case for takaful as the sample data is selected from the first four takaful companies established in Malaysia. Takaful companies that were given license in 2005 onwards are excluded from the sample study. The basis for excluding these companies is mentioned in the previous section. In the case of insurance, the sample data is selected from companies which are licensed to conduct solely general insurance business. Insurance companies with composite license and general insurance companies with incomplete data are excluded from the sample study. In addition, the fixed effects model gives the highest R2 value among the three regression models for the takaful and insurance.
Table 6 Panel Specification Test
Test
Statistics
Takaful Insurance
Statistics Value
p-value Statistics Value
p-value
Breusch and Pagan Lagrangian multiplier test for pooled versus fixed effects model
χ2
29.17
0.0000
1923.27
0.0000
Likelihood ratio test for pooled versus random effects model
χ2 22.14 0.0001 492.58 0.0000
Hausman test for random effects versus fixed effects model
χ2
39.25
0.0000
31.19
0.0001
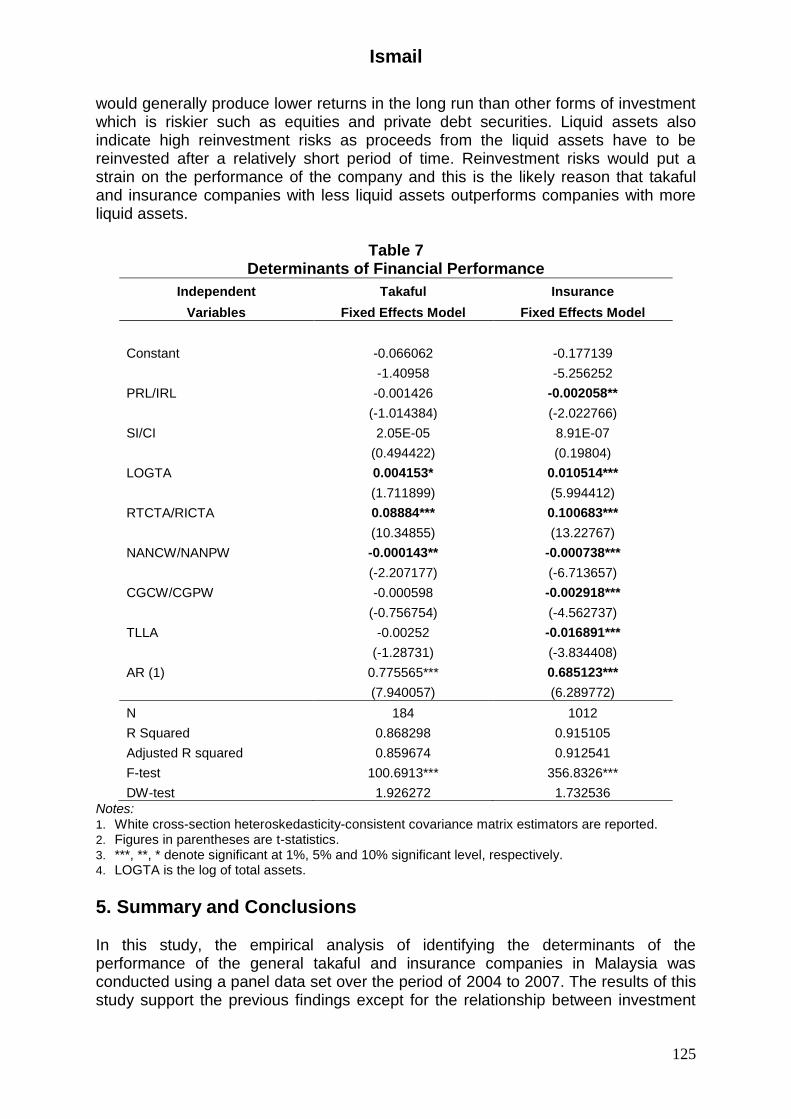
4.5 Regression Results Based on the Best Estimation Model The findings for this study is based on the best selected model which is the fixed effects model for takaful and insurance as shown in Table 7.
4.5.1 Profit or Interest Rate Levels Based on the findings for the takaful and insurance sectors, the profit and interest rate levels are found to be negatively related to investment yield. The findings differ from previous studies such as studies by Browne and Hoyt (2001) and Adams and Buckle (2003) where interest rates are positively related to investment yields. There could be several reasons for this finding. First, this could be due to the profit and

Ismail
122
interest rate levels which are relatively low with means of 3.81 and 3.83 for takaful and insurance, respectively. The volatility of these rates is also low as reflected by standard deviations of 0.31 and 0.33 for takaful and insurance, respectively. As such, these rates may not appear to generate a large cumulative effect on the financial performance of the takaful and insurance companies. Second, the negative relationship could arise if the returns from investment are not sufficient to offset the investment expenses as well as losses from the underwriting performance. Another reason for the findings could be related to the views by Browne and Hoyt (1995) who believe that although companies are more likely to remain solvent when interest earnings are high, the effects will be reduced if the interest earnings are credited back to the insured through lower rates. Booth et al. (1999) also maintain that in a competitive market condition, greater profits from investments may make it possible to keep premiums lower than that of other competitors. The findings for the takaful sector indicate that the relationships between investment yield and profit rate levels are statistically insignificant. The likely reason for this could be due to the minimal percentage of assets invested in Government Investment Issues. For the period of 2004 to 2007, Government Investment Issues constitute only 10.6% to 13.7% of the total assets of the takaful industry. 4.5.2 Equity Returns The findings indicate that equity returns are positively related to the investment performance for both general takaful and insurance companies in Malaysia. The results are consistent with the hypothesis that increases in returns on equity enhance the financial performance of the takaful or insurance companies as they provide the companies with a stream of dividend income. However, the coefficient for equity returns is found to be statistically insignificant for both the takaful and insurance sectors. This is probably due to the smaller allocation of assets that are invested in equity portfolios. In 2007, the composition of assets in equities for takaful and insurance is 6.6% and 8.1%, respectively. The probable reason for investing a smaller proportion of the assets in equities could be due to the greater market risks involved in liquidating the equities. It is particularly important for general takaful and insurance companies to invest in liquid assets as the claims are short term in nature and have to be settled promptly. 4.5.3 Size of Company Consistent with the hypothesis, size of takaful company is observed to be positively related to investment yield and statistically significant at the 10 percent level. A similar relationship is observed for insurance but the coefficient for size of company is statistically significant at the 1 percent level. The finding is also consistent with the studies by Shiu (2004), Chen and Wong (2004) and Browne, Carson and Hoyt (2001) who find positive relationship between size and financial performance of companies. The result supports the basis for economies of scale, whereby larger companies are more likely to perform better as they can achieve operating cost efficiency through increasing output and economising on the unit cost of production and process development.

Ismail
123
The findings also indicate that size of company has different effects on the investment performance of the takaful and insurance companies where the effect is smaller and less significant for takaful as compared to insurance. The possible reason for this could be attributed to the size of takaful assets which is relatively small as compared to that of the insurance companies. In 2007, the general insurance assets for the largest insurance company in Malaysia is RM2.016 billion as compared with a mere RM519 million for the largest takaful company. The industry performance for the year 2007 shows only two out of eight takaful companies having general takaful assets exceeding RM300 million as compared to 25 out of 40 insurance companies with general insurance assets exceeding RM300 million. 4.5.4 Retakaful or Reinsurance Dependence The study shows that the coefficient for retakaful dependence is positively related to investment yield and statistically significant at the 1 percent level. The finding is consistent with that of insurance sector. The results indicate that an increase in retakaful and reinsurance dependence will improve the financial performance of the general takaful and insurance companies, respectively. The study by Browne, Carson and Hoyt (2001) also shows a positive relationship between return on assets and reinsurance dependence but is statistically insignificant. In this study, the possible reason for this finding could be due to cheaper retakaful and reinsurance rates obtained by the Malaysian takaful and insurance companies, respectively. There are a few factors that may contribute towards cheaper retakaful or reinsurance rates and one of these could be due to the Malaysian risks profile which is less exposed to catastrophic losses. The other likely explanation for the cheaper retakaful or reinsurance protection could be due to the low claim experience for certain classes of general takaful and insurance businesses in Malaysia. Takaful fire and marine classes have always been the lines of business which have the lowest retention rate, with lowest reported claim experience as compared with the other classes of business. The low risks profiles indicate the profitability of the respective business and this could give rise to lower retakaful rates. 4.5.5 Solvency Margin The findings for both takaful and insurance sectors indicate that solvency margin is inversely related to investment yield. This is contrary to the hypothesis which predicts that companies with higher solvency margin are able to attract prospective policyholders and thus perform better than companies with lower solvency margin. The finding is consistent with the study by Shiu (2004) for the life insurance business in the United Kingdom. In the case of takaful, the possible explanation for the conflicting findings could be associated to the level of awareness and knowledge of the Malaysian consumers. In general, prospective participants rarely use solvency margin as a decision to acquire takaful coverage. They would normally decide to participate in takaful because of its Islamic values and choose to acquire takaful from companies that are able to offer better returns in terms of profit sharing and efficient claim settlement practices. Similarly, for insurance, individual buyers of general insurance products would normally purchase insurance without giving much consideration to the insurers’ possibility of insolvency. The solvency factor is usually of more concern to buyers of life insurance product which is long term in nature.

Ismail
124
Another plausible reason for the contrary finding is that high solvency margin indicates excess capital which is not invested efficiently that could otherwise give better investment returns to the takaful and insurance companies. The findings also show that solvency margin is an important determinant of the takaful and insurance financial performance as both sectors indicate that solvency margin is statistically significant at the 1 percent level and 5 percent level for insurance and takaful, respectively. 4.5.6 Stability of Underwriting Operation The results for takaful indicate that contribution growth is negatively related to investment yield but not statistically significant. A similar relationship is reflected for insurance but the coefficient for investment yield is statistically significant at the 1 percent level. This finding indicates that an increase in contribution and premium growth will weaken the financial performance of takaful and insurance companies, respectively. The finding is consistent with the study by Chen and Wong (2004) and Kim, Anderson, Amburgey and Hickman (1995). The study by Shiu (2004) also shows insignificant and negative relationships between investment yield and premium growth of general insurance business in the United Kingdom. The negative relationship between investment yield and contribution growth could be attributed to high concentration in non-profitable class of business, which is the motor sector. The motor sector dominates the portfolio of the general takaful business with 37.6% share of total gross contributions in 2004.iv The percentage of this share continues to escalate to 48.4% in 2007.v The takaful motor business experienced high claims ratio which exceeded 100% for the years 2005 to 2007. The factors which contribute to the high claim ratio are largely due to increases in the frequency of vehicle thefts and road accidents as well as increasing claim costs especially for third party bodily injury claims. Similarly, with insurance, the distribution of its gross premiums is also highly concentrated in the motor business which constitutes 44.3% to 47.2% of the total gross premiums for the year 2004 to 2007vi, with a combined loss ratio of 177% in 2002 to 292.4% in 2009. In this study, premium growth is found to be a significant determinant of performance for insurance, but not in the case of takaful. This is probably because the percentage of motor gross premiums for insurance is higher than takaful during most years of the study. Furthermore, the insurance reported higher motor loss ratio as compared to the takaful sector for the period of 2004 to 2007. 4.5.7 Liquidity The results for takaful denote that the coefficient for liquidity is inversely related to investment yield and statistically insignificant. In terms of insurance, a similar relationship is reported but the coefficient for liquidity is statistically significant at the 1 percent level. In this regard, a drop in the level of liquidity will improve the financial performance of takaful or insurance companies. The finding is consistent with the study by Browne, Carson and Hoyt (1999) of the life insurance business in the United States and that by Adam and Buckle (2003) of the general insurance business in the Bermuda. Both studies prove that companies with less liquid assets outperform those with more liquid assets. Companies with low liquidity will have better financial performance as they can lower the agency cost and provide incentives for managers to improve their performance. Furthermore, liquid assets
Ismail
125
would generally produce lower returns in the long run than other forms of investment which is riskier such as equities and private debt securities. Liquid assets also indicate high reinvestment risks as proceeds from the liquid assets have to be reinvested after a relatively short period of time. Reinvestment risks would put a strain on the performance of the company and this is the likely reason that takaful and insurance companies with less liquid assets outperforms companies with more liquid assets.
Table 7 Determinants of Financial Performance
Independent Takaful Insurance
Variables Fixed Effects Model Fixed Effects Model
Constant -0.066062 -0.177139
-1.40958 -5.256252
PRL/IRL -0.001426 -0.002058**
(-1.014384) (-2.022766)
SI/CI 2.05E-05 8.91E-07
(0.494422) (0.19804)
LOGTA 0.004153* 0.010514***
(1.711899) (5.994412)
RTCTA/RICTA 0.08884*** 0.100683***
(10.34855) (13.22767)
NANCW/NANPW -0.000143** -0.000738***
(-2.207177) (-6.713657)
CGCW/CGPW -0.000598 -0.002918***
(-0.756754) (-4.562737)
TLLA -0.00252 -0.016891***
(-1.28731) (-3.834408)
AR (1) 0.775565*** 0.685123***
(7.940057) (6.289772)
N 184 1012
R Squared 0.868298 0.915105
Adjusted R squared 0.859674 0.912541
F-test 100.6913*** 356.8326***
DW-test 1.926272 1.732536
Notes: 1. White cross-section heteroskedasticity-consistent covariance matrix estimators are reported. 2. Figures in parentheses are t-statistics. 3. ***, **, * denote significant at 1%, 5% and 10% significant level, respectively. 4. LOGTA is the log of total assets.
5. Summary and Conclusions In this study, the empirical analysis of identifying the determinants of the performance of the general takaful and insurance companies in Malaysia was conducted using a panel data set over the period of 2004 to 2007. The results of this study support the previous findings except for the relationship between investment
Ismail
126
yield and profit/interest rate level. The likely reasons for these are explained in paragraph 4.5.1. The findings indicate that company’s size, retakaful dependence and solvency margin are statistically significant determinants of the financial performance of the general takaful companies in Malaysia. For Malaysian general insurers, all factors are statistically significant determinants of financial performance, except for equity returns. As these factors are important in determining the Malaysian general takaful and insurance companies’ financial performance, it should be capitalised to further improve and sustain their financial performance. These findings have a number of implications to the general takaful and insurance industries. First, as size plays an important factor in the financial performance of the general takaful and insurance companies, the industry should embark on the expansion of their businesses locally and abroad through the offering of diversity and innovative products to meet the wider needs of the consumers. Large size takaful and insurance companies will be in a better position to build a strong supporting infrastructure such as enhancing information management systems, upgrading risk management practices and improving their level of technical and management expertise. These are key factors that could further sustain the development and competitive positions of the general takaful and insurance companies in Malaysia. The second implication is that general takaful and insurance companies need to consider various factors in designing their retakaful or reinsurance programmes such as the types of protection required and the way it matches the exposures and resulting claims, the expected business volume, availability of covers and the cost of retakaful or reinsurance. These factors vary with companies depending on their size, corporate structure, financial strength, type of business written, and even regulatory environment. Takaful and insurance companies can further improve their retakaful or reinsurance operation by developing dynamic financial models to examine the behaviour of the portfolios of business and to analyse the possible future experience of the businesses. There is also a need to put in place effective and robust data management system to facilitate the monitoring of the retained and ceded risk exposures as the industry has to identify the potential accumulation of exposure from a particular source. Takaful and insurance companies must also take appropriate steps to adequately assess the soundness of the reinsurers and retakaful companies in terms of its capacity and financial strength as there are credit risks involved. The selection of the retakaful companies or reinsurers should be based on information relevant in ascertaining their reliability and security. As a best practice, retakaful or reinsurance protection should be well spread among a number of retakaful companies or reinsurers to avoid exposure to excessive credit risks concentration. Third, as solvency margin plays an important role in the financial performance of the general takaful and insurance companies in Malaysia, it is imperative for the industry to ensure that there is a balance between the risks of deficiency of the fund and the benefits of higher returns from investments. Maintaining solvency of the fund is more crucial for takaful than for the insurance companies as any deficiency in the takaful fund is borne by the participants. Takaful companies will only be liable for the losses if the participants are able to prove negligence on the part of the takaful companies. In case of the deficiencies of the fund, takaful companies have a few options to exercise such as limiting the claim amounts payable to the participants or increasing the amount of contributions of existing and future participants. To safeguard the

Ismail
127
participants’ interest, the Malaysian regulator requires shareholders to provide interest-free loans as a measure to rectify the deficits in the takaful fund. Another prudent measure that can be implemented by the takaful company is to build up reserves from the underwriting surplus to absorb the deficits that may arise in future. The industry can also capitalise on the solvency models developed by the actuary to further improve the assessment of the solvency position of the companies. This includes deterministic models such as the dynamic solvency testing and stochastic models. The limitation of the study is the lack of takaful data in view that the industry is relatively new as compared to insurance. Further, as mentioned in paragraph 3.4 above, the number of takaful companies in Malaysia is smaller than the insurance companies. As such, the small number of cross-sectional data for takaful may have limited the empirical results to some extent. In spite of the data limitation, the evidence reported in the study provides useful insight into the determinants of performance for the takaful companies in Malaysia. In summary, the determinants of the financial performance of the general takaful companies approximate closely to the determinants of the general insurance companies although takaful and insurance are two different types of insurance system. There are a few possible explanations for the large similarities in the determinants of the financial performance of the takaful and insurance companies in Malaysia. First, this could be due to the same nature of products that are being offered by the two sectors. The second reason could be due to the similar operational functions performed by the two sectors. Third, both sectors are regulated by the Central Bank of Malaysia and therefore most of the rules and regulations imposed on both sectors are very much similar.
Endnotes
i Bank Negara Malaysia 2005, Takaful Annual Report 2004, 20 Years of Takaful In Malaysia, Bank Negara Malaysia, Kuala Lumpur.
ii The terms general takaful and conventional insurance companies use in this study is also referring
to the general takaful and conventional insurance funds.
iii Central Bank of Malaysia 2000, Annual Takaful Statistics, Central Bank of Malaysia, viewed 30 November
2009, <http://www.bnm.gov.my>.
iv Central Bank of Malaysia, viewed 5 June 2009, <http//: www.bnm.gov>.
v Central Bank of Malaysia, viewed 5 June 2009, <http//: www.bnm.gov>.
vi Central Bank of Malaysia, viewed 5 June 2009, <http//: www.bnm.gov>.
References Adams, M 1996, ‘Investment earnings and the characteristics of the life insurance
firms: New Zealand evidence’, Australian Journal of Management, vol. 21, pp.41 - 55.

Ismail
128
Adams, M & Buckle, M 2003, ‘The determinants of corporate financial performance in the Bermuda insurance market’, Applied Financial Economics, vol 13, pp. 133 - 143.
Bain, JS 1968, Industrial organization, John Wiley, New York. Bickelhaupt, DL 1974, General insurance, Richard D. Irwin, Inc., Ontario. Booth, P, Chadburn, R, Cooper, D, Haberman, S & James, D, 1999, Modern
actuarial theory and practice, Chapman and Hall, U.K. Browne, MJ & Hoyt, RE 1995, ‘Economic and market predictors of insolvencies in
the property-liability insurance industry’, The Journal of Risk and Insurance, vol. 62, no. 2, pp. 309 - 327.
Browne, MJ, Carson, JM & Hoyt, RE 1999, ‘Economic and market predictors of insolvencies in the life-health insurance industry’, The Journal of Risk and Insurance, vol. 66, no. 4, pp. 643 - 659.
Browne, MJ, Carson, JM & Hoyt, RE 2001, ‘Dynamic financial models of life insurers’, North American Actuarial Journal, vol. 5, no. 2, pp. 11 - 26.
Bustic, RP 1994, ‘Solvency measurement for property liability risk-based capital applications’, Journal of Risk and Insurance, vol 61, pp. 1 - 6.
Chen, R & Wong, KA 2004, ‘The determinants of financial health of Asian insurance companies’, The Journal of Risk and Insurance, vol. 71, no. 3, pp. 469 - 499.
D'Arcy, SP 1979, ‘An illustration of the impact of inflation on insurance company operation’, Casualty Actuarial Society Discussion Paper Program Casualty Actuarial Society, pp.96 - 109.
Eugene W, Lambert, Jr. & Hofflander AE 1966, ‘Impact of new multiple line underwriting on investment portfolios of property-liability insurers’, The Journal of Risk and Insurance, vol. 33, pp. 209 - 223.
Fiegenbaum, A & Thomas, H 1990, ‘Strategic goups and performance: The U.S. Insurance Industry, 1970 - 84’, Strategic Management Journal, vol. 11, pp. 197 - 215.
Grace, MF & Timme, SG 1992, ‘An examination of cost economies in the United States life insurance industry’, The Journal of Risk and Insurance, vol. 59, no. 1, pp. 72 - 103.
Hardwick, P 1997, ‘Measuring cost inefficiency in the UK life insurance industry’, Applied Financial Economics, vol. 7, pp. 37 - 44.
Kamaruddin Sharif 2004, ‘Takaful – Development and challenges over 20 years of its existence in Malaysia’, Jurnal Pengurusan, vol. 23, pp. 3 - 13.
Kim, YD, Anderson, DR, Amburgey, TL & Hickman, JC 1995, ‘The use of event history analysis to examine insurer insolvencies’, Journal of Risk and Insurance, vol. 62, pp. 94 - 110.
Madzlan Mohamad Hussain, 2009, Legal issues in takaful. Takaful Islamic insurance concepts and regulatory issues. In Archer, S, Rifaat Ahmed Abdel Karim & Nienhaus, V, Takaful Islamic insurance concepts and regulatory issues, John Wiley and Sons (Asia), Singapore.
Mohd. Daud Bakar, 2009, Shariah principles governing takaful model. In Archer, S, Rifaat Ahmed Abdel Karim & Nienhaus, V, Takaful Islamic insurance concepts and regulatory issues, John Wiley and Sons (Asia), Singapore.
Mohd. Ma’asum Billah, 2007, Applied takaful and modern insurance law and practice (3rd edition), Sweet and Maxwell Asia, Malaysia.

Ismail
129
Pottier, SW 1998, ‘Life insurer financial distress, Best’s ratings and financial ratios’, The Journal of Risk and Insurance, vol. 68, no. 2, pp. 275 - 288.
Scherer, FM 1980, Industrial market structure and economic performance, Rand-McNally, Chicago.
Shiu, YM 2004, ‘Determinants of United Kingdom general insurance company performance’, British Actuarial Journal, vol. 10, pp. 1079 - 1110.

Ismail
130
Appendix
Empirical Results based on Generalized Least Square (GLS) Non Effects Model, Fixed Effects Models (FEM) and Random Effects Models (REM)
Independent Variables
Takaful Insurance
GLS Non Effects
FEM REM GLS Non Effects
FEM REM
Constant -0.003119 -0.066062 -0.007282 -0.01359 -0.177139 -0.09786
(-0.432749) -1.40958 (-0.008245) (-1.48918) -5.256252 (-4.08405)
PRL/IRL -0.000294 -0.001426 0.00036 -0.00227*** -0.002058** -0.00184***
(-0.274429) (-1.014384) (0.28840) (-3.62091) (-2.022766) (-3.1197)
SI/CI 0.000073*** 2.05E-05 0.000078*** 0.000000425 8.91E-07 1.46E-06
(5.62775) (0.494422) (5.46886) (0.35163) (0.19804) (1.17463)
LOGTA 0.000576* 0.004153* 0.00072** 0.00233*** 0.010514*** 0.00608***
(1.951304) (1.711899) (2.35889) (5.25694) (5.994412) (4.95204)
RTCTA/RICTA 0.063677*** 0.08884*** 0.05975*** 0.05765*** 0.100683*** 0.09367***
(10.05875) (10.34855) (-9.84353) (22.7017) (13.22767) (25.3214)
NANCW/ NANPW -0.000137***
-0.000143**
-0.00017*** -0.0009***
-0.000738***
-0.00065
(-4.306064) (-2.207177) (-3.93764) (-19.1684) (-6.713657) (-11.4156)
CGCW/ CGPW -0.00497***
-0.000598
-0.00535*** -0.00794***
-0.002918***
-0.0059***
(-4.287043) (-0.756754) (-4.07384) (-12.428) (-4.562737) (-10.8853)
TLLA -0.008132*** -0.00252 -0.009246*** -0.00974*** -0.016891*** -0.00651***
(-4.639359) (-1.28731) (-3.93117) (-8.3796) (-3.834408) (-2.703333)
AR (1) - 0.775565*** - - 0.685123*** -
- (7.940057) - - (6.289772) -
N 184 184 184 1012 1012 1012
R Squared 0.707353 0.868298 0.69274
0.678974 0.915105 0.71695
Adjusted R squared 0.695714
0.859674
0.680521 0.676736
0.912541
0.71498
F-test 60.77251*** 100.6913*** 56.68669*** 303.354*** 356.8326*** 363.297***
DW-test 0.747945 1.926272 0.740236 0.636372 1.732536 0.79461