Heterogeneous preferences for integrated soil fertility management ...

DETERMINANTS OF FERTILITY PREFERENCES AMONG CURRENTLY
MARRIED WOMEN IN KENYA
LAURA LUSIKE LUNANI
REG NO Q50/79942/2012
A RESEARCH PROJECT SUBMITTED IN PARTIAL FULFILMENT OF THE
REQUIREMENT FOR THE DEGREE OF MASTER OF ARTS (POPULATION
STUDIES) AT POPULATION STUDIES AND RESEARCH INSTITUTE
UNIVERSITY OF NAIROBI
NOVEMBER, 2014

ii
ABSTRACT
Fertility preference is defined as desired family size, ideal number of children, and desire for
additional children or fertility intentions. The measurements have been used to describe
and/or estimate the number of children that people actually want to have. Fertility
preferences are the indicators of general attitudes and possible future course of fertility. Also
family planning approval is strongly dependent on fertility preferences. Measuring fertility
intentions, and determining the extent to which they predict fertility behavior, is important
for population policy and the implementation of family planning programs. Despite the
various strategies and policies, Kenya’s total fertility rate still remains high at 4.6 while
contraceptive prevalence rate is limited at 46 percent. The main objective of this study is to
determine factors associated with fertility preference in Kenya. The dependent variable of
this study is preferred waiting time to the next birth. The study utilized secondary data from
the Kenya demographic health survey 2008-09 with a study population of 4236 currently
married women of child bearing age (15-49). Descriptive statistics indicated that majority of
the married women, preferred short birth intervals. Cross tabulation analysis found that
preferred waiting time to the next birth is significantly associated with educational
attainment, current working status, region, religion, current use of any contraceptive method,
age group, number of living children and sex composition. Logistic regression results
indicated that education, ethnicity, current use of any contraceptive method, age group and
number of living children predict preferred birth interval. In conclusion this study found that
education, ethnicity, current use of any contraceptive method, age group and number of
living children have a significant impact on fertility intentions. From the study results it is
evident that majority of the women prefer short birth intervals which highly contributes to
large family sizes resulting to high fertility in Kenya. It is therefore recommended that
concerted efforts be employed with regard to family planning programs targeting ethnic
groups such as Kalenjins, Maasai and Somalis. Campaigns emphasizing on longer birth
intervals should be popularized in Kenya. Further qualitative and quantitative research should
be conducted to explore the social cultural and religious beliefs norms and attitudes of
currently married women in Kenya with regard to family planning and preferred birth
intervals. Additionally men’s status and approval of family planning and preferred birth
intervals should also be researched further.

iii
DECLARATION
I hereby declare that this is my original work and has not been presented in any other
university.
Laura Lusike Lunani Date
Q50/79942/2012
M.A Population Studies
University of Nairobi
This Research Project has been submitted for examination with the approval of my
University supervisors.
Professor Alfred Agwanda Date
Population Studies and Research Institute
University of Nairobi
Dr. Samuel Wakibi Date
Population Studies and Research Institute
University of Nairobi

iv
DEDICATION
I wish to dedicate this work to Rose Nakhanu Lunani, my late mother and my entire family
and to all population scientists in our Nation who carry out their work dutifully with
dedication, to ensure that Kenya is a better place.

v
ACKNOWLEDGEMENTS
Thanks to God the almighty for giving me the grace and mercies to carry out this study.
My most sincere appreciation goes to the Institute of population studies and research, College
of Humanities, University of Nairobi for allowing me this opportunity to study, tapping on
the knowledge and wisdom of its senior lecturers; for the guidance and mentoring provided
through my dedicated supervisors, Prof. Alfred Agwanda and Dr. Samuel Wakibi. Gratitude
is extended to all lecturers and staff of PSRI.
I would like to thank MEASURE DHS for allowing and providing me with the Kenya
Demographic Health Survey Data. To Thaddeus Egondi, thank you for sparing time to help
transform my data into valuable information.
Very special thanks to all the staff of KAVI-ICR, especially IT/DATA for their never ending
support, and more specifically to Moses Muriuki for stepping in for me when I was not
available all through the study period.
My heartfelt appreciation goes to my family especially my sisters Caroline Khalai and
Joanita Sindra, for the support and motivation they accorded me throughout the study period.
My classmates Hilbert, Godwin, Moses, Hilda, Grace, friends and many other people who
contributed in one way or another in making this study a success thank you. I will forever be
indebted to you all.

vi
LIST OF TABLES
Table 3.1: Definition of key analysis variables ...................................................................... 20
Table 4.1: Socio economic, cultural and demographic, characteristics of currently married
women in Kenya ..................................................................................................... 24
Table 4.2: Cross Tabulation between preferred waiting time and its covariates for currently
married women in Kenya ....................................................................................... 29
Table 4.3: Logistic regression coefficients, significance and odds ratio for currently married
women preference to preferred waiting time to their next birth ............................. 33

vii
LIST OF FIGURES
Figure 2.1: Conceptual framework ......................................................................................... 15
Figure 2.2: Operational Framework ........................................................................................ 16
Figure 4.1: Preferred waiting time to next birth ..................................................................... 23

viii
ABBREVIATIONS
CEB-Children ever born
CPR-Contraceptive Prevalence Rate
DHS-Demographic Health Survey
GOK-Government of Kenya
KPSA-Kenya Population Situation Analysis
KDHS-Kenya Demographic Health Survey
KNBS-Kenya National Bureau of Statistics
OBSI-Optimal Birth spacing Initiative
PSRI-Population Studies Research Institute
TFR-Total Fertility Rate

ix
TABLE OF CONTENTS
ABSTRACT .............................................................................................................................. ii
DECLARATION ..................................................................................................................... iii
DEDICATION ......................................................................................................................... iv
ACKNOWLEDGEMENTS ...................................................................................................... v
LIST OF TABLES ................................................................................................................... vi
LIST OF FIGURES ................................................................................................................ vii
ABBREVIATIONS ............................................................................................................... viii
CHAPTER ONE: INTRODUCTION ................................................................................... 1
1.1 Background to the study ..................................................................................................... 1
1.2 Problem statement ............................................................................................................... 2
1.3 Main objective .................................................................................................................... 3
1.4 Justification ......................................................................................................................... 3
1.5 Scope and limitation ........................................................................................................... 4
CHAPTER TWO: LITERATURE REVIEW ...................................................................... 5
2.1 Introduction ......................................................................................................................... 5
2.2 Value of children theory ..................................................................................................... 5
2.3 Spacing component of reproductive intentions................................................................... 6
2.4 Social economic factors ...................................................................................................... 7
2.5 Socio- cultural factors ....................................................................................................... 11
2.6 Inter spousal communication ............................................................................................ 13
2.7 Conceptual framework and operational framework ......................................................... 14
CHAPTER THREE: METHODOLOGY .......................................................................... 17
3.1 Introduction ....................................................................................................................... 17
3.2 Data source........................................................................................................................ 17
3.3 The dependent and independent variables ........................................................................ 17
3.4 Method of Analysis ........................................................................................................... 20

x
CHAPTER FOUR: FACTORS AFFECTING PREFERRED BIRTH INTERVALS ... 22
4.1 Introduction ....................................................................................................................... 22
4.2 Socio economic, cultural and demographic characteristics of currently married women in
Kenya ................................................................................................................................ 22
4.3 Socio economic, cultural and demographic characteristics against preferred waiting time
to next birth ....................................................................................................................... 26
4.4 Factors influencing long term waiting period to the next birth ........................................ 31
4.5 Discussion ......................................................................................................................... 35
CHAPTER FIVE: SUMMARY, CONCLUSION AND RECOMMENDATIONS ........ 38
5.1 Introduction ....................................................................................................................... 38
5.2 Summary of findings......................................................................................................... 38
5.3 Conclusions ....................................................................................................................... 39
5.4 Recommendations ............................................................................................................. 40
References .............................................................................................................................. 42

1
CHAPTER ONE: INTRODUCTION
1.1 Background to the study
Fertility preference studies define people’s fertility preferences differently. These
measurements could be termed as desired family size, ideal number of children, desire for
additional children, fertility intentions and so on. They have been used to describe and/or
estimate the number of children that people actually want to have. Fertility preferences are
the indicators of general attitudes and possible future course of fertility. Also family planning
approval is strongly dependent on fertility preferences. Measuring fertility intentions, and
determining the extent to which they predict fertility behavior, is important for population
policy and the implementation of family planning programs.
The demographic pattern of developing countries is characterized by the co-existence of high
fertility, and high infant and child mortality. In a number of countries, studies indicate that
wherever fertility is high, maternal, infant and child mortality are equally high (Fitaw et al,
2004). Kenya is in the stage of demographic transition characterized by substantial decline in
mortality and persistent relatively high fertility. Currently women in Kenya have on average
(TFR) 4.6 children (KDHS 2008/09) and a contraceptive prevalence (CPR) of 46%. The high
TFR combined with low CPR, low death rate (14.02 deaths per 1000 women), high birth rate
(39.7 births per 1000 population) and low infant mortality (estimated at 59.26 per 1000 live
births) could be contributing towards high population growth in Kenya (Republic of Kenya
2009).
Between 1977 and 1993 the rate of decline in fertility increased, but by 1998 the rate of
decline had begun to slow down, and by 2003 the decline in fertility had stalled as shown by
the following trend in TFR: 1977 of 8.1, 1984-7.7, 1989-6.7, 1993-5.4, 1998-4.7, 2003-4.9.
The rapid fertility decline between 1979 and 1999 is attributed to the national family
planning program which received real support from government in the 1980s and 1990s
(Muhoza et al, 2014). Evidence in the decline in national and international support for the
family planning program was noted from mid to late 1990s, which explains the stall in
fertility decline (Population Council). The mean ideal family size among currently married

2
women has declined from 4.3 to 4.0 (KDHS 2008-2009). This statistic together with low
contraceptive prevalence rate (45.5%) depicts a country that still favors large families
(Muhoza et al 2014). As such this study seeks to find the socio economic factors and cultural
factors associated with fertility preferences among currently married women in Kenya as this
will help to better understand determinants of fertility preferences. This study will use
preferred waiting time to the next birth as opposed to ideal family size or desire for additional
children (Tarun K, 2008) which have widely been used to assess fertility preference and have
also been reported to have many drawbacks. For instance it is often difficult to obtain
objective responses when collecting information on ideal family size (Tarun K, 2008).
1.2 Problem statement
There still exists wide variations and slow pace of decline in fertility levels, in spite of the
decline of fertility throughout the world over the years (Munshi and Myaux, 2006). The
causes of these variations and slow pace of decline in fertility levels, however, are issues to
be debated. The high desired family size that prevails in most of Sub Saharan Africa, Kenya
included, hinders fertility decline as desire for large families’ leads to high fertility. Ideal
family size has been exhaustively used in many studies as a measure of fertility preference.
This study will use preferred waiting time to the next birth as a measure of fertility
preference as only few studies have examined the spacing component of reproductive
intentions to assess fertility (Ramrao Saumya et al, 2006).
As much as National and global initiatives have been put in place to ameliorate rapid
population growth and its adversities (GOK, KPSA 2013) total fertility rate (TFR) in Kenya
still remains high at 4.6, while Contraceptive Prevalence rate (CPR) for all methods is limited
at 46% (Okech et al, 2011). Of worthy to note is that by 1998 the rate of fertility decline had
begun to slow down, and by 2003 the decline in fertility had stalled. Desired family size was
3.8 in 2010 and actual 4.6 (KDHS). In relation to fertility desires it has been noted that for
various reasons the desired family size cannot exactly be accomplished and actual fertility
level exceeds the desired which is the typical nature of a developing country.
This raises the questions: What are the factors associated with fertility preference in Kenya?
Can fertility preferences be influenced and if so how? Not much is known about the factors
3
associated with fertility preference. This study seeks to find out these factors that determine
fertility preference in currently married women in Kenya. Responses to these questions
should provide a better understanding of associated social, cultural, economic, political, and
other factors that influence fertility dynamics in Kenya.
1.3 Main objective
The main objective of the study is to determine factors associated with fertility preference
among currently married women in Kenya.
Specific objectives
(i) To establish fertility preference differentials among currently married women in
Kenya;
(ii) To establish the socio economic factors that determines fertility preference among
currently married women in Kenya; and
(iii)To establish the socio cultural factors that determines fertility preference among
currently married women in Kenya.
1.4 Justification
Fertility preferences are important measures for estimating levels of unwanted or mistimed
fertility, forecasting fertility, and assessing unmet need for contraceptives. They inform and
advice population policy and family planning programs and also contribute to existing
literature on fertility studies.
Kenya has been experiencing a slow pace in fertility decline and variations in fertility levels
in the different regions of Kenya and as such it is important to determine the drivers of these
fertility preference differentials in the country as they tend to mask the national averages.
Desired and actual fertility levels are rather high in Kenya with the actual fertility levels
exceeding the desired. The measure of fertility intentions among women has been a question
of concern among social scientists as to whether the stated intentions eventually translate into
behavior and whether they can be used as an effective means of projecting future fertility
behavior.

4
The National population policy for sustainable development has set targets for key
demographic indicators such as; the total fertility rate in Kenya to reduce from 4.6 in 2009 to
2.6 by 2030 and a further reduction to 2.1 by 2050. Similarly, the natural population growth
rate to be reduced from 2.5% per annum in 2009 to 1.5% per annum by 2030. With a growth
rate of 2.9% percent per annum, the population is expected to double to about 77 million by
2030 (NCPD, 2012). This trend poses serious challenges for overall national development
including future economic growth.
A comprehensive analysis therefore, of levels, and differentials in fertility preference and
behavior as well as how and the extent to which individuals are able to actualize their fertility
preferences will add to the body of knowledge on fertility and reproductive health issues in
Kenya. It will also be a pointer on the role and extend to which the government and family
planning programs have played in helping individuals realize their fertility preferences.
Findings from this study will help the government and family planning programs to design
appropriate programs, or enrich programs that already exist to improve the levels at which
people attain their fertility preferences which will in turn ensure that the country meets its set
developmental goals.
1.5 Scope and limitation
This study will use secondary data from 2008/2000 Kenya Demographic Health Survey, a
national-level probability sample survey. It will focus on the responses of currently married
women of child bearing age (15-49 years) as administered from the woman questionnaire.
Fertility preferences depend highly on a process of negotiation between both partners.
However, this study will only focus on currently married women’s responses on questions
about fertility preferences. Depending exclusively on data collected from women may project
a biased image of the joint preference function of the couple.
5
CHAPTER TWO: LITERATURE REVIEW
2.1 Introduction
In a qualitative study on attainment of fertility desires in Nigeria, Ibisomi (2007) discovered
that economic factors, migration/living apart, marital disruption, infertility, ill-health
(including rhesus incompatibility), occultic influence (in relation to magical power) and child
mortality are some of the factors that hinder the realization of desired family size. Early/late
marriage, polygamy, sex preference, societal and other third-party influences, improvement
in economic conditions, lack of effective knowledge on contraception, mismatch in couples’
desires (including abusive/drunkard husbands) and multiple births are some of the other
important factors that make it difficult to achieve desired family size.
This chapter will discuss the theoretic framework, the birth spacing component of
reproductive intentions, socio economic and social cultural factors that may influence
individual fertility preferences and also provide the conceptual frameworks that will guide
this study.
2.2 Value of children theory
Hoffman and Hoffman (1973) reviewed four reasons for studying the value of children: to
motivate fertility regulation, to anticipate compensations which might be necessary to
achieve small family size, to predict fertility motivations and population trends, and to
consider the value of children in the parent-child relationship. In less developed countries
children have economic value, both in the present and as support in old age. In developed
countries, however, children are an economic liability. Hoffman and Hoffman conceptualize
the value of children in terms of psychological satisfaction such that children also provide
primary group ties, stimulation, fun, and a feeling of creativity. For some parents they
provide a feeling of power and a means of social comparison or competition. Their
theoretical scheme helps to determine changes which would result in a decreased desire for
children. It consists of 5 classes of variables: 1) the value of children, 2) alternative sources
of the value, 3) costs, 4) barriers, and 5) facilitators.
6
Female employment as an alternative to childrearing is explored using this model. It is
concluded that child-care centers would not decrease fertility because it would make it easier
for women at all economic levels to have children and work. Since the educated woman is
more likely to find satisfying employment, her fertility is likely to decrease but uneducated
woman in a manual routine job could continue to seek fulfillment in her children. Also, the
drop in children will mean a drop in the employment opportunities in fields related to
children. This will make it difficult for the society to find employment for all its women. In
countries where the extended family makes surrogate mothers, available employment is an
adjunct to reproduction and the employment-fertility relationship may be depressed or
nonexistent.
2.3 Spacing component of reproductive intentions
Birth intervals are affected by a wide range of factors, some of which are rooted in social and
cultural norms, others in the reproductive histories and behaviors of individual women,
utilization of reproductive health services and other background factors (Ramarao et al,
2006).
This reproductive preference for spacing instead of limiting is peculiar to sub-Saharan
Africa. Few studies have examined the spacing component of reproductive intentions.
Bankole and Westoff, (1995) in their study, childbearing attitudes and intentions carried out
in Sub-Saharan Africa, revealed the widespread desire of women to have longer birth
intervals than they are currently having in the region. Between a quarter and a third of
women reported that they had recently experienced a birth sooner than they wanted.
Questions have been raised if family planning program efforts, which have focused on birth
spacing rather than on birth limiting in this region, have the potential for changing the
dynamics of the region’s population? Positive hypothetical answers to this question are given
for two main reasons. First, if people prefer to avoid short birth intervals, and if these
aspirations are realized, mortality and morbidity will eventually reach lower levels given the
well-documented detrimental effects of short birth intervals on the lives of women and
children (e.g., National Research Council, 1989). Second, the desire to lengthen birth
intervals could fuel the fertility transition, initially because delaying births would lower the
birth rate. The rate of population growth would be reduced as the length of the generation is

7
increased. The demographic mechanism is similar to increasing the age at marriage, which
would normally increase the age at first birth. Moreover, some of the postponed births would
never occur (Measure DHS, 2001).For years, family planning programs have promoted two
year intervals between births for infant and child health and survival. There are several
benefits that contribute to these outcomes including: a longer time period between births
allows a mother more time to recover from pregnancy and delivery; the next pregnancy and
birth are more likely to be at full gestation and growth; there is less competition between
existing children for breastfeeding, nutrition, mother’s time, and other resources (National
Research Council, 1989). More recently, there has been a renewed interest in the effects of
spacing and the optimal duration between births because new evidence suggests that three to
five years may offer greater health benefits (Ramarao Saumya et al 2006). The Optimal Birth
Spacing Initiative (OBSI) was created under the auspices of USAID to place optimal birth
spacing on the global leadership priority agenda. The goal of Optimal Birth Spacing Initiative
is to institute an optimal birth spacing recommendation of Three to Five Years at the policy,
programmatic and behavioral levels. A range of professional and technical groups
participated in this initiative including the CATALYST Consortium and Advance Africa
with CATALYST acting as the secretariat for OBSI.
2.4 Social economic factors
2.4.1 Education
Highly educated women have a tendency to replace child numbers with child quality (Becker
and Lewis 1973). Since childbearing and child caring are time-intensive, an increase in wage
rates induces a negative substitution effect on the demand for children (Becker 1965). A
woman’s income is, therefore, negatively associated with childbearing, as having a higher
income level implies there is higher opportunity costs associated with having children. A
study in China showed that the preference for a small family was associated with younger
age, urban residence, and higher level of education (Ding and Hesketh, 2006) and according
to recent reports; white women had fewer number of children and a higher mean age at first
birth than Hispanic and black women (NSF 2006).Another recent report indicated that men
and women with low levels of education were likely to have high mean numbers of children
(NSF 2006).
8
Dommaraju and Agadjanian (2009) explained that changes in fertility regime in Bangladesh
in most cases are not due to changes in women’s status, but due to changes in the
reproductive behavior of illiterate women. In most of the studies, which considered the
relationship between female education and fertility in Bangladesh, a significant, linear and
inverse relationship was found (Akmam 2002). He mentions a study conducted by
Chaudhury (1977) as showing a curvilinear relationship (meaning that with a modest level of
education, fertility is likely to rise and with a higher level of education fertility tends to
decline). Additionally, in 1997, Hoque and Murdock observed statistically significant and
substantial differences in use of contraceptives between women with different levels of
education, even after controlling for other related variables. Women with degrees from
colleges/universities had three times more likelihood of using contraception than those
without any education.
In Nepal, literate women have only half the numbers of children ever born (CEB) than do
illiterate women (1.9 vs. 3.7 for all; 3.6 vs. 5.2 for women aged 40-49). Furthermore, Muslim
women, women who had never been exposed to mass media, and poor/poorest women had
significantly higher (CEB) than their comparison group. Similarly, those women who had
less knowledge about family planning methods had significantly more CEB than those who
had a higher level of knowledge about family planning (Adhikari 2010).
Bongaarts (2010) in his study among 30 sub-Saharan countries to analyze the causes of
educational differences in fertility found out that women with secondary or higher education
have on average lower fertility than women with no education (3.4 vs. 6.3 births per woman),
which is also the case in desired family size (3.7 vs. 5.6 births per woman). Additionally,
there are differences by level of education in the relationships between reproductive
indicators. As education rises, fertility is lower at a given level of contraceptive use,
contraceptive use is higher at a given level of demand and demand is higher at a given level
of desired family size. The most plausible explanations for these shifting relationships are
that better-educated women marry later and less often, use contraception more effectively,
have more knowledge about and access to contraception, have greater autonomy in
reproductive decision making, and are more motivated to implement demand because of the
higher opportunity costs of unintended childbearing.

9
Cochrane (1978) notes in a study of fertility in Nigeria, that only 10 per cent of the women
with education beyond the primary stage believed fertility to be determined by God', whereas
50 per cent of the totally uneducated women held that belief. In most research studies it has
been found that desired family size becomes smaller with the increase in women's
educational levels. Reference can be made to researches conducted by Jejeebhoy (1995);
Cleland and Jejeebboy (1996) and many others. From literature the general expectation is
that the desire for more children should be lower for the educated women in comparison to
the not educated women. Converse to this expectation, according to a study conducted by
Wachira (2001) in Kenya, women with secondary education and above had a higher level of
desire for more children (42.8%) compared to women with primary (41.1%) and no
education (29.3%).
2.4.2 Occupation and place of residence
Sennott and Yeatman (2012) in their study conducted in Malawi discovered that events that
change one's economic circumstances might alter plans for future childbearing. For instance,
job loss could lead to postponement of pregnancy to allow time for a household to regain
financial balance before adding another member. On the contrary, a spouse beginning a new
job could hasten a woman's childbearing plans. Frequent changes in fertility preferences may
also reflect the economic uncertainty that is common in developing societies (Johnson-Hanks
2005, 2007; Agadjanian, 2005) such as Malawi, where employment may be sporadic or
scarce.
A significant relationship between occupation and desired fertility and fertility-related
behavior is evident in several studies. A study done on the Yoruba of Nigeria reveals that
desired fertility is lower for women married to husbands employed outside agriculture,
compared with those in the agricultural sector (Bankole et al., 1995). Urban people prefer
smaller families. Family size preference also varies regionally with variations of place of
residence (Knodel et al., 1996; Singh and Casterline1985; Mahmud and Ringheim, 1997; Ali,
2000). Regional variation exists in regard to fertility intention because of different socio-
cultural pattern and practices. An analysis of survey data from 17 Arab states suggested that
the fertility transition in most countries is being led by urban and literate women (Farid,
1996).

10
Sidze et al (ND) in their study carried out among women in both rural and urban Senegal
arrived at the finding that; age at first marriage occurs early in Senegal. In urban areas, over
49 percent of women aged 40-49 years were married before age 20 and 53 percent among
urban women aged 15-29 years. On the other hand, 71 percent of rural women aged 40-49
years and 82 percent of rural women aged 15-29 were married before age 20. Early ages at
first marriage expose Senegalese women to a long duration of pregnancy risk and high odds
to give birth to numerous children. Ayehu (1998) in his study among the Meru of Kenya
discovered that women married to husbands with higher occupation status were more likely
to desire to stop childbearing than those married to husbands with lower or middle status
occupation hence an inverse relationship between the desire for more children and
occupation.
2.4.3 Woman’s status
According to a Bangladeshi study based on (DHS 1999-2000) on the impact of woman’s
status on fertility and contraceptive use in Bangladesh it revealed that three selected variables
of woman’s status namely education, occupation and discussion of family planning with
partner were strongly associated with number of living children, ever use of contraception
and current use of contraception. As per the findings, higher education, skilled job and
discussions about family planning with partner were related with having significantly fewer
numbers of children. Thailand was a frequently cited example, in places where women's
status was high and fertility was lower than might be expected on the basis of developmental
indicators alone (Freedman, 1979).
The degree to which women enjoy any decision-making is powerfully shaped by social
institutions (Mason, 1984). The patriarchal, hierarchical and polygynous organization of
many African households tends to perpetuate the low status of women in African societies. In
such households, most women cannot exert much, if any, control over their lives in the
families within which they live. Early marriage, patrilocal residence after marriage and
polygynous unions are institutions that perpetuate women’s subordinate position and make
them rather voiceless and powerless in matters affecting their reproduction. At marriage a
woman assumes a low status relative to all members of her husband’s extended family which
11
is elevated usually by attainment of high fertility, and can be elevated by high educational
attainment and ownership and control of substantial resources (Makinwa-Adebusoye and
Ebigbola, 1992). Women are similarly disadvantaged in matters of inheritance and
succession, and also suffer considerable disadvantages with respect to education and access
to resources in general. In fact, the bottom line is that women and their children are legal
property of the husband (Aguda, 1992).
2.5 Socio- cultural factors
John Caldwell and Pat Caldwell (1987) identified the main factors precluding fertility decline
in the sub Saharan Africa to be rooted in the cultural background, which is centered on the
traditional religious belief system that upholds to lineage continuation and the succession of
generations. Alex Ezeh et al (2009) identified high fertility to be the by-product or residue of
cultural, economic and social factors. Sociocultural factors or circumstances have been
pinpointed to play pivotal role for the relatively high fertility rates prevailing in the region.
This ranged from high infant and child mortality, early and universal marriage, low
contraceptive use and the high value placed on child rearing. Thomas Merrick (2002:41)
highlighted that sub- Saharan Africa has the lowest level of contraceptive use in the world. In
this circumstance of subordinate position, fertility is seen by women as a medium of attaining
higher status within the family. As a result women generally indulge in giving birth to many
children, whereby the number of children a woman gives birth to, is viewed as a determinant
factor that helps to ascertain and increase her status in the family.
Cheihk Mbacke (1994) explained that sub Saharan Africa societies have set up an efficient
system that strives to promote high fertility that encompass practices like early marriages,
polygamy, rapid remarriage of widows. The prevalence of high child and infant mortality has
contributed to the practice of high fertility rates in sub Saharan African countries as well. In
the face of high infant mortality rates, high fertility rate is viewed as a medium of increasing
the chances of precluding lineage extinction as well as a means of raising the survival rate of
the lineage (Makinwa - adebusoye 2001). The importance attached to lineage continuation
from John Caldwell and Pat Caldwell (1987) comprehension is the main reason behind the
high fertility levels in the region and also for the reluctance that surrounds fertility decline.
In essence, Caldwell and Caldwell (1987) mentioned that African societies are built in a
12
manner wherein high fertility and large families are often economically as well as socially
rewarding.
2.5.1 Religion and ethnicity
Cultural factors, defined as language, religion, customs and values have been shown to have
an impact on fertility behaviors. The fertility patterns are similar in culturally homogenous
groups suggesting the importance of diffusion across such groups (Cleland and Wilson
1987).The National Health Statistics Reports in the United States revealed that the fertility
intention of men and women differed across races and religions. With regard to religion,
Catholic women tended to have fewer children than Protestant women; however, fertility
intention was high among Mormons and Hispanics, regardless of their religion, and was
lowest among Jewish women and those with no religion.
Munshi and Myaux (2006) found that local changes in reproductive behavior occur within
religious groups; and assumed that social interactions among the women cannot be
substituted with other interventions. Entwisle et al, (1996) and Rogers and Kincaid (1981)
showed homogeneity of choices in villages in the contraceptive preferences. It must be as a
result of the diffusion of contraceptive information through interpersonal networks (Rogers et
al, 1999). Since individuals locate within the social networks, their child bearing attitudes,
preferences, decisions, and behavior may arise from the social learning and influence with
the interactions of kin, relatives, peers (Bernardi et al, 2007).
A case study of Kenya indicated that Muslims had the highest level of desire for more
children (56.6%) whereas Catholics and Protestants were 42% and 43.4% respectively
(Wachira, 2001) In terms of ethnicity Luos, Luhyas, Kisii had the highest desire for more
children followed by the Kalenjin community and last but not least the Kamba, Kikuyu,
Embu and Meru with the following percentages respectively (46%), (44.4%), and (38.1%).
2.5.2 Sex composition
Pramila et al (2014) in their study conducted in Tharu, Rural of Nepal discovered high sex
ratio at last birth and shorter birth spacing following female children. Plan for next birth was

13
strongly affected by sex composition; women having only female children in family were
more likely to want another birth compared to others. Age and education of the women,
number of current living children were significantly associated with current contraceptive
practices. This high sex ratio at last birth for those who decided to stop child bearing or used
permanent contraceptives suggests the childbirth-stopping behavior was driven by son
preference and can be inferred that the son preference behavior exists in Tharu community.
Higher sex ratio indicating son preference behavior has also been found in analysis of data
from Nepal demographic and health survey 1996, 2001, 2006, and 2011.
In Kenya majority of women who reported having more daughters than sons (47.2%) had
more desire to have more children compared to women who had more sons or those who had
an equal number of sons and daughters (Wachira, 2001).
2.5.3 Child mortality
According to Easterlin (1975) infant mortality play a major impact on fertility decline via the
impact on the supply of children and ultimately on the motivation for fertility control.
Evidence indicated that African countries follow a classic pattern of demographic transition
in which fertility decline is correlated with fall in infant mortality, which is linked to
modernization (socioeconomic development and improved health facilities). On the evidence
of earlier literatures, a decrease in infant mortality is expected to decrease demand for more
children increases the expected return of investment in child quality, which may lead to
further decline in fertility. In Kenya Wachira (2001) found high desire for more children
among women who have experienced child loss (43.6%) in comparison to women who have
not had a child loss experience (35.1 %),therefore desire for more children being
significantly related to child loss.
2.6 Inter spousal communication
Studies conclude that communication between husband and wives is the first step in a
rational process of fertility decision-making, and precursor of lower desired family size
(Becker, 1996; Mason et al., 1987; Mahmud and Ringheim 1997; Mai, 1996). Couples’
agreement, conjugal closeness or spousal communication is a strong predictor of intended
fertility (Bankole et al., 1998). Another study (Coombs and Fernandez, 1978) suggests that

14
communication is associated with lower fertility preference of couples. From the review of
the literature on selected interventions in Africa, Toure (1996), found that low level of
contraceptive use was due to lack of communication between spouses regarding family size.
Karen et al, (1987) found that communication factors affect husband's attitude towards
family size. Uche and Isiugo (1994) found inter spousal discussion of family size and current
use of contraceptives are expected to have an inverse effect on family size. Mahmud and
Ringheim's study (1997) conducted in Pakistan detected ‘inter spousal communication’ as a
significant covariate of the desire to have no more children, although their findings did not
undermine the influence of other socio-economic, religious and health factors, which produce
a mutual set of interest even in the absence of overt communication.
2.7 Conceptual framework and operational framework
According to literature reviewed socio-economic, social cultural and demographic factors as
well as programmatic factors such as contraceptive use and inter spousal communication may
be conceptualized as factors that shape fertility preferences of Kenyan women. It is
anticipated that socio-economic and demographic factors like education, residence,
occupation and age have influence on human attitudes and behavior; cultural factors like
religion and sex composition also can predict the fertility preference and factors like inter
spousal communication can influence the attitude towards family size. Similarly mass media
exposure can predict the variation of attitudes in regard to fertility preference. Below are a
conceptual framework and an operational framework adapted for this study.

15
Figure 2.1: Conceptual framework
Source: Pullum (1980).
Socio-Economic factors
Socio-cultural factors
Inter spousal
communication
Demographic factors
Fertility Preference

16
Figure 2.2: Operational Framework
Independent
Variables- (IV)
…….. .. ..……………
Source: Adapted from Pullum (1980).
Socio-Economic variable (IV)
Education
Occupation
Place of residence
Region
Socio-Cultural variables (IV)
Religion
Ethnicity
Demographic variables (IV)
Age
Number of living
children
Sex composition
Intervening
Variable
Contraceptive use
Dependent Variable
Fertility Preference
Preferred
birth interval Inter-spousal Communication (IV)

17
CHAPTER THREE: METHODOLOGY
3.1 Introduction
This chapter discusses the source of data and methods of data analysis. Variables used in the
analysis are also presented together with their respective definitions.
3.2 Data source
The study will use secondary data from the 2008-09 Kenya Demographic and Health Survey
(KDHS). KDHS is a national survey conducted by the Kenya National Bureau of Statistics
(KNBS) in partnership with other government agencies. KDHS uses several questionnaires to
collect data such as the household questionnaire, the woman’s questionnaire, and man’s
questionnaire. The main objective of the survey is to provide up to date demographic and
health information including fertility preference. The information is meant to assist policy
makers and administrators in evaluating and designing programmes and strategies for
improving health and family planning services in Kenya.
This study will use data from the woman questionnaire.
Sample size - In this study responses from a total of 4236 currently married women of
reproductive age (15-49) will be analyzed to establish the factors influencing their fertility
preference. Marital status will be recorded such that the categories married and living
together will be combined into one category to represent current married women. Sterilized
and in fecund women were not considered for analysis.
3.3 The dependent and independent variables
This study used preferred waiting time for the next birth as the dependent variable to measure
fertility preference. Most studies have concentrated on ideal family size as a measure for
fertility preference as much as it has its flaws. Collecting information on ideal family size as
a measure of fertility preference can be relatively complex. Often it is difficult to get
objective responses as questions on ideal family size are hypothetical in nature. Respondents,
especially those illiterate or with little education may find it difficult to understand these
questions. This study uses preferred waiting time for the next birth as it is direct, and focuses

18
on the topic of interest. In addition, few studies have examined the spacing component of
reproductive intentions.
The independent variables of the study are Socio economic factors, socio cultural factors,
demographic factors, contraceptive use and inter spousal communication.
3.3.1 Dependent variable
Fertility preference will be measured by preferred waiting time for the next birth.
Respondents who are not pregnant or unsure were asked how long they would like to wait
from now before the birth of another child. Pregnant respondents were asked after the birth of
the child they are expecting now, how long would they like to wait before the birth of another
child? Given that sterilized women and women who state that they are in fecund (declared in
fecund) have no impact on future fertility because their potential contribution to fertility has
been curtailed they have not been considered for analysis in this study.
A dichotomous variable will be created and coded as Short term waiting (less than3years) =0
Long term waiting (3 years and above) =1. According to literature, for a long time family
planning programs promoted two year intervals between births for infant and child health and
survival (National Research Council, 1989). However, evidence suggests that three to five
years may offer greater health benefits (Ramarao Saumya et al 2006). The Optimal Birth
Spacing Initiative (OBSI) was created under the auspices of USAID to place optimal birth
spacing on the global leadership priority agenda. The goal of OBSI is to institute an optimal
birth spacing recommendation of Three to Five Years at the policy, programmatic and
behavioral levels. World Health Organization, recommendation for birth spacing after a live
birth is at least 24 months before attempting the next pregnancy in order to reduce the risk of
adverse maternal, peri natal and infant outcomes (WHO Report, 2007).
3.3.2 Independent variables
Education
This variable is a measure of the highest level of school that the respondent has attended. The
variable will be categorized into four groups namely: No education Primary incomplete,
Primary complete, Secondary and Higher Education.

19
Type of place of residence:
This is a dichotomous variable categorized as rural and urban.
Region of residence
Regional refers to part of the country the respondent's reside. Formerly known as provinces.
Religion
This variable identifies the respondent’s religious affiliation. It is grouped into Catholics,
Protestants and Muslim.
Gender distribution of living children-
This variable seeks to measure the distribution of sons and daughters alive and further find
out the effect gender distribution has on preferred waiting time.
Age
This variable measures respondent’s age in complete years and it will be recorded into 3
categories. The variable seeks to measure the effect age has on preferred waiting time for
next birth.
Contraceptive use
The variable will measure if the respondent is currently using or not using a method of
contraceptive. This is to find out how contraceptive use affects preferred waiting time for
next birth.
Inter spousal communication
This variable measures respondent's level of communication with their spouses regarding
family planning.
Work status
This variable measures the respondent’s current working status in relation to preferred
waiting time for next birth.
20
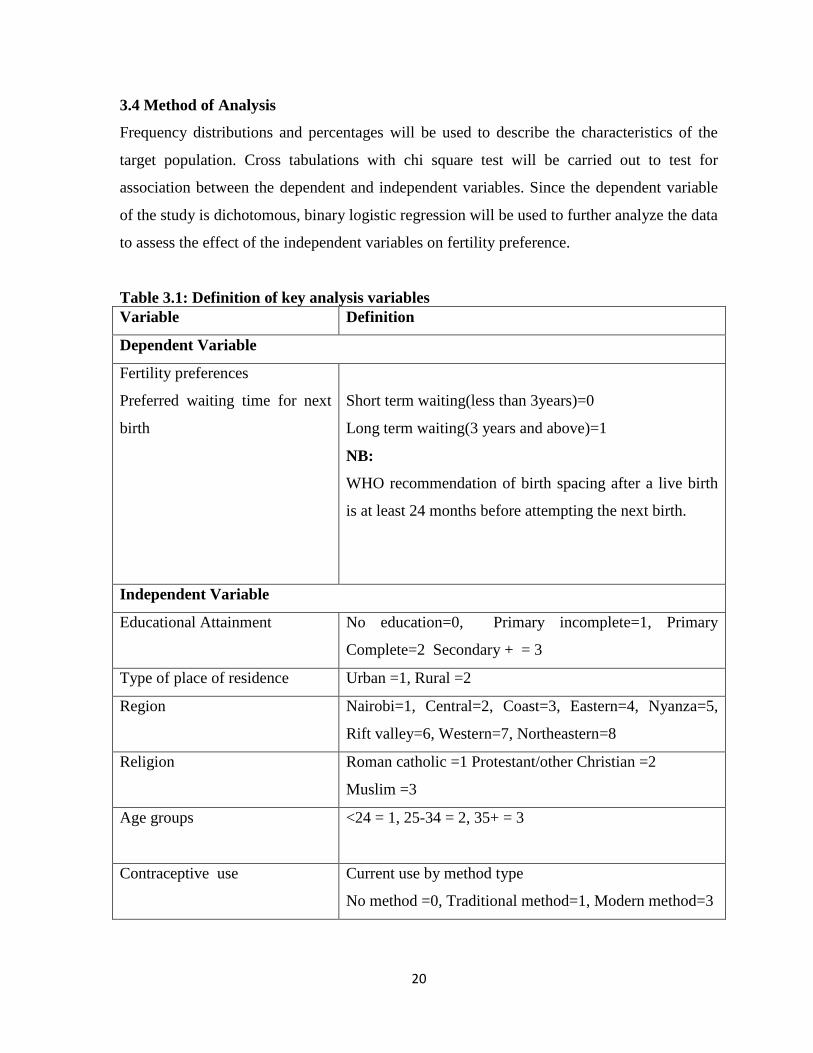
3.4 Method of Analysis
Frequency distributions and percentages will be used to describe the characteristics of the
target population. Cross tabulations with chi square test will be carried out to test for
association between the dependent and independent variables. Since the dependent variable
of the study is dichotomous, binary logistic regression will be used to further analyze the data
to assess the effect of the independent variables on fertility preference.
Table 3.1: Definition of key analysis variables
Variable Definition
Dependent Variable
Fertility preferences
Preferred waiting time for next
birth
Short term waiting(less than 3years)=0
Long term waiting(3 years and above)=1
NB:
WHO recommendation of birth spacing after a live birth
is at least 24 months before attempting the next birth.
Independent Variable
Educational Attainment No education=0, Primary incomplete=1, Primary
Complete=2 Secondary + = 3
Type of place of residence Urban =1, Rural =2
Region Nairobi=1, Central=2, Coast=3, Eastern=4, Nyanza=5,
Rift valley=6, Western=7, Northeastern=8
Religion Roman catholic =1 Protestant/other Christian =2
Muslim =3
Age groups <24 = 1, 25-34 = 2, 35+ = 3
Contraceptive use Current use by method type
No method =0, Traditional method=1, Modern method=3

21
Variable Definition
Inter spousal communication How often have you talked to your husband/partner about
family planning in the past year?
Never Discussed=1, Discussed once or twice=2, Discuss
more often=3
Number of living children 0 = 1, 1-2 = 2, 3-4 = 3, 5+ = 4
Work status No=1, Yes=2
Ethnicity Embu, Kamba, Kikuyu, Meru =1,
Luhya, Luo,Kisii =2,
Kalenjin, Maasai =3
Mijikenda/Swahili/Taita-taveta=4
Somalis =5,
Others =6
Ethnic groups were combined based on the region they
come from.
Sex Composition Boys=Girls=1
Boys<Girls=2
Boys>Girls=3
22
CHAPTER FOUR: FACTORS AFFECTING PREFERRED BIRTH INTERVALS
4.1 Introduction
As earlier noted wide variations and slow pace of fertility decline has persisted in Kenya. As
much as National and Global initiatives have been put in place to curb rapid population
growth and its adversities, TFR in Kenya still remains high at 4.6 while CPR for all methods
is at 46%. In addition fertility decline has stalled since the year 2003. Further, actual fertility
levels exceed the desired for various reasons. As such this study examined selected socio
economic, cultural and demographic variables including inter spousal communication and
contraceptive use and how they influence fertility preference among currently married
women in Kenya.
The objective of this study was firstly to establish fertility preference differentials among
currently married women in Kenya. Secondly, to establish the socio economic factors that
determine fertility preference among currently married women in Kenya; and lastly to
establish the socio cultural factors that determines fertility preference among currently
married women in Kenya.
This chapter discusses results of the study showing how selected socio economic, cultural
and demographic variables including inter spousal communication and contraceptive use
affect fertility preference among currently married women in Kenya.
4.2 Socio economic, cultural and demographic characteristics of currently married
women in Kenya
Preferred waiting time to the next birth
Out of the 4236 married women who were surveyed, only 2076 of the married women
responded to the question on preferred waiting time to the next birth. As shown in the Figure
4.1 below out of 2076 married women who participated in the 2008/2009 KDHS survey, 69
percent preferred to wait for a short period of time to their next birth(< than 3 years) while 31
percent preferred to wait for a long period of time. Generally most women in Kenya prefer
short birth intervals.

23
Figure 4.1: Preferred waiting time to next birth
Socio economic characteristics of the respondents
In respect to educational attainment women with incomplete primary education were 28.0
percent while 25.5 percent had completed primary level of education. Women with
secondary education and above were 28.9 percent and 17.7 percent had no education (Table
4.1).
This study found that close to half, (41.5%) of the women was not working, while those
working were 58.5 percent.
Majority, (70.8%) of the respondents were from rural areas while regionally, Nyanza had the
highest number of respondents followed by Rift Valley with a percentage of 16.3 and 15.5
respectively. The least number of respondents were from North Eastern at 7.7 percent.
Socio cultural characteristics of the respondents
Most, (60%) of the women in this study were Protestants/other Christians, followed by
Muslims and Roman Catholics who were 20.7 percent and 18.2 percent respectively.
As far as ethnicity is concerned women from Luhya, Luo and Kisii combined were the
majority, (33.1%) followed by Kikuyu, Kamba, Embu and Meru, (31.9%). Kalenjins and
Maasai were 10.7 percent, Mijikenda/Swahili and Taita-Taveta were 10.6 percent and
Somalis were 8.7 percent. All other tribes combined were 7.3 percent.

24
Socio demographic characteristics of the respondent
With regard to age group most (43.1%) of the married women were in the age bracket 25-34
years. Married women with less than 24 years and more than 35 years were 28.9 percent and
28 percent respectively.
Looking at number of living children most (38.9%) of the women had 1-2 living children
followed by 3-4 living children at 30.5 percent. Women with 5 and above living children
were 23.5 percent and women with no living children were 7 percent.
Women with number of boys more than girls were 37.3 percent followed by women with
number of boys less than girls at 34.1percent and lastly, women with number of boys equal to
girls were 28.6percent.
Other characteristics of respondents
Majority (63.1%) of the women had ever used any method of contraception, while 31.9
percent had not used. Women using any traditional method were only 5 percent.
With regard to how often partners talked about family planning, only 40 percent of the
women responded to this question. Married women who discussed family planning more
often were 19 percent, 15.1 percent said that they discussed once or twice while 5.9 percent
said they never discussed family planning.
Table 4.1: Socio economic, cultural and demographic, characteristics of currently
married women in Kenya
Variable Frequency Percent
1 Educational Attainment Frequency Percent
No education 749 17.7
Primary incomplete 1184 28.0
Primary complete 1079 25.5
Secondary + 1224 28.9
Total 4236 100.0
2 Currently working Frequency Percent
No 1757 41.5
Yes 2467 58.2
Missing 12 .3
Total 4236 100.0

25
Variable Frequency Percent
3 Type of place of residence Frequency Percent
Urban 1235 29.2
Rural 3001 70.8
Total 4236 100.0
4 Region Frequency Percent
Nairobi 412 9.7
Central 459 10.8
Coast 616 14.5
Eastern 582 13.7
Nyanza 689 16.3
Rift Valley 656 15.5
Western 494 11.7
Northeastern 328 7.7
Total 4236 100.0
5 Religion Frequency Percent
Roman Catholic 771 18.2
Protestant/other Christians 2543 60.0
Muslims 877 20.7
Missing 45 1.1
Total 4236 100.0
6 Ethnicity Frequency Percent
Kikuyu, Kamba, Embu, Meru 1255 29.6
Luhya, Luo, Kisii 1402 33.1
Kalenjin, Maasai 453 10.7
Mijikenda/Swahili, Taita-Taveta 447 10.6
Somali 370 8.7
Others 309 7.3
Total 4236 100.0
7 Current use of any method Frequency Percent
No method 1351 31.9
Modern method 2673 63.1
Traditional method 212 5.0
8 Discussed FP Frequency Percent
Never 252 5.9
Once or twice 640 15.1
26
Variable Frequency Percent
More often 803 19.0
Missing 2541 60.0
Total 4236 100.0
9 Age group Frequency Percent
<24 years 1224 28.9
25-34 years 1826 43.1
35 above 1186 28.0
Total 4236 100.0
10 Number of living children Frequency Percent
0 297 7.0
1-2 1649 38.9
3-4 1294 30.5
5 above 996 23.5
Total 4236 100.0
11 Sex composition Frequency Percent
Boys=Girls 1211 28.6
Boys<Girls 1446 34.1
Boys>Girls 1579 37.3
Total 4236 100.0
12 Preferred waiting time Frequency Percent
Short term waiting <3yrs 1442 34.0
Long term waiting ≥ 3yrs 634 15.0
Missing 2160 51.0
Total 4236 100.0
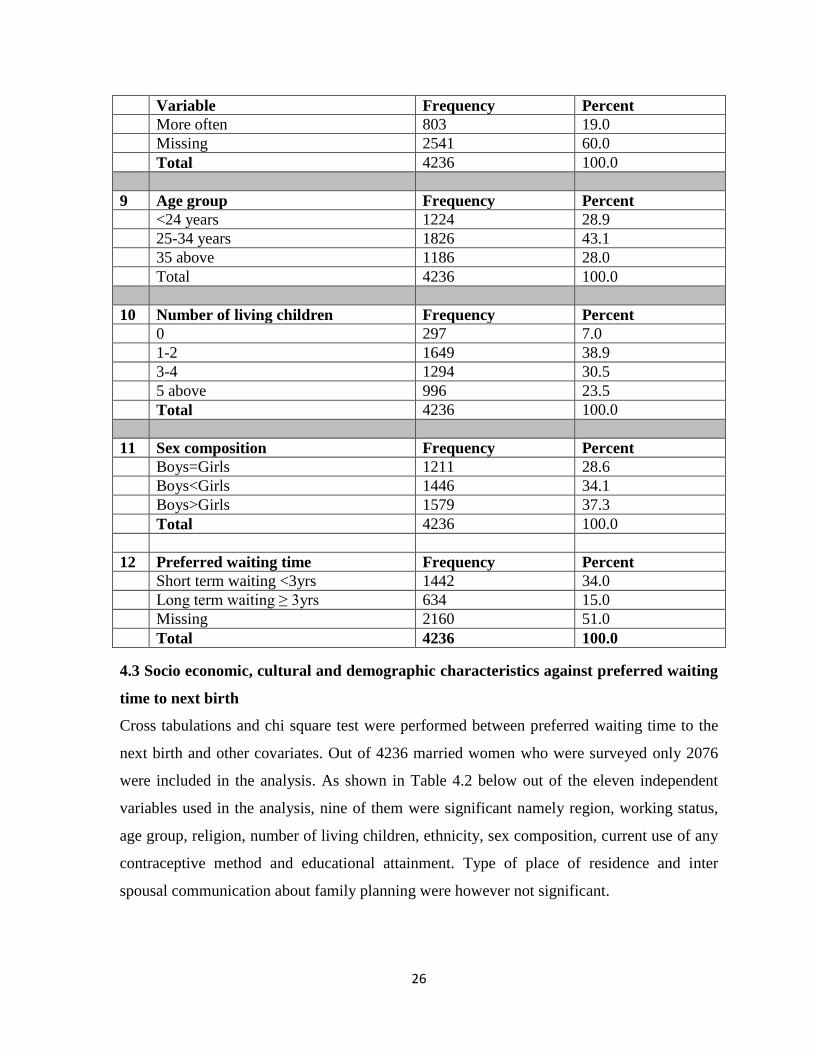
4.3 Socio economic, cultural and demographic characteristics against preferred waiting
time to next birth
Cross tabulations and chi square test were performed between preferred waiting time to the
next birth and other covariates. Out of 4236 married women who were surveyed only 2076
were included in the analysis. As shown in Table 4.2 below out of the eleven independent
variables used in the analysis, nine of them were significant namely region, working status,
age group, religion, number of living children, ethnicity, sex composition, current use of any
contraceptive method and educational attainment. Type of place of residence and inter
spousal communication about family planning were however not significant.
27
The study found that educational attainment was a significant factor influencing preferred
birth interval (x2= 121.109, p<0.01). Approximately 89 percent of married women with no
education preferred to wait for a short period of time to their next birth while those with
incomplete primary education were 64.9 percent. Married women with secondary education
and above were 64.5 percent and lastly married women with completed primary education
were 60.2 percent.
The analysis indicates that current working status of the women was a significant factor
affecting preferred waiting to the next birth (x2=17.801, p<0.01).Out of 2076 women that
were surveyed, 73.8 percent of the married women not currently working preferred to wait a
shorter period of time for their next birth while 65.3 percent of currently working women
preferred to wait for a short period of time to their next birth.
Type of place of residence was an insignificant factor to preferred waiting time (x2= 2.071,
p=0.150). Majority, (70.5%) of the women from the rural preferred short birth intervals while
67.3 percent of women from urban preferred short birth intervals. Region on the other hand
emerged as significant factor influencing preferred waiting time (x2=117.807, p<0.01). North
eastern had 98.0 percent of the married women preferring short birth intervals followed by
Rift valley region at 70.1 percent. Western had the least percentage at 62.1.
Religion was another significant factor affecting preferred birth intervals (x2=69.540,
p<0.01).Most (82.3%) of Muslim women prefer short birth intervals. Protestants/other
Christians and Roman Catholics followed with 64.3 percent and 62.3 percent respectively.
Preferred birth interval was significantly influenced by ethnicity (x2=151.501, p<0.01). As
such, 97.8 percent of married Somali women and 77.8 percent of married women from the
Kalenjin and Maasai communities preferred short birth intervals. Mijikenda/Swahili and
Taita-Taveta were 61.5 percent while 61.4 percent were Luhya, Luo and Kisii followed.
Kikuyu, Kamba, Embu and Meru were 60.7 percent.
Current use of any method was also a significant factor influencing preferred birth interval
(x2=123.401, p<0.01).The results of the cross-tabulation between preferred waiting time and
current use of any contraceptive method indicate that among those who preferred to wait for

28
a short period of time to their next birth, 82.3 percent we’re not using any method of
contraception while 59.3 percent were using a modern method.
The analysis shows that inter spousal communication was not a significant factor influencing
preferred birth interval (x2=0.287, P=0.866).
Age group was a significant factor to preferred birth interval (x2=36.670, P<0.01).Eighty six
point one percent (86.1%) of married women in the age group 35> preferred short birth
intervals while 68.8 percent were in the age group 25-34. Married women in the age group
≤24 were 65.9 percent who preferred short birth intervals.
Number of living children is another significant factor influencing preferred waiting time
(x2=54.172, p<0.01). As such, 84.6 percent of women with no living children and 80.5
percent of women with more than 5 living children preferred short birth intervals while 66.2
percent of women with 3-4 living children preferred short birth intervals and 65.1 percent of
women with 1-2 living children preferred short birth interval.
Sex composition was also a significant factor influencing preferred birth intervals (x2=8.434,
P=0.015). Married women with the number of boys equal to girls were 73.8 percent who
preferred short birth intervals while 68.2 percent of married women with number of boys less
than girls preferred short birth intervals and lastly 66.9 percent of women with the number of
boys more than girls preferred short birth intervals.

29
Table 4.2: Cross Tabulation between preferred waiting time and its covariates for
currently married women in Kenya
Variables
Preferred waiting time
< 3 yrs-short
term
N (%)
≥3 yrs-long
term
N (%)
X2 N
Educational attainment
No education
Primary incomplete
Primary complete
Secondary +
447(88.9)
335(64.9)
301(60.2)
359(64.5)
56(11.1)
181(35.1)
199(39.8)
198(35.5)
121.109**
2076
Currently working
No
Yes
751(73.8)
689(65.3)
266(26.2)
366(34.7)
17.801**
2072
Type of place of residence
Urban
Rural
443(67.3)
999(70.5)
215(32.7)
419(29.5)
2.071
2076
Region
Nairobi
Central
Coast
Eastern
Nyanza
Rift Valley
Western
North Eastern
132(68.8)
104(62.3)
227(63.2)
163(68.5)
225(64.1)
206(70.1)
139(62.1)
246(98.0)
60(31.2)
63(37.7)
132(36.8)
75(31.5)
12(35.9)
88(29.9)
85(37.9)
5(2.0)
117.807**
2076
Ethnicity
Kikuyu, Kamba, Embu and Meru
Luhya, Luo and Kisii
Kalenjin and Maasai
286(60.7)
418(61.4)
147(77.8)
185(39.3)
263(38.6)
42(22.2)
171.350**
2076

30
Variables
Preferred waiting time
< 3 yrs-short
term
N (%)
≥3 yrs-long
term
N (%)
X2 N
Ethnicity continued
Mijikenda/Swahili and Taita-
Taveta
Somalis
Others
168(61.5)
271(97.8)
152(82.2)
105(38.5)
6(2.2)
33(17.8)
Current use of any method
No method
Modern method
Traditional method
738(82.3)
647(59.3)
57(64.8)
159(17.7)
444(40.7)
31(35.2)
123.401**
2076
Discussed FP
Never discussed
Discussed once or twice
Discussed more often
49(57.6)
154(54.4)
167(54.8)
36(42.4)
129(45.6)
138(45.2)
0.287
673
Age group
≤24yrs
25-34
35>
616(65.9)
622(68.8)
204(86.1)
319(34.1)
282(31.2)
33(13.9)
36.670**
2076
Number of living children
0
1-2
3-4
5 and above
226(84.6)
730(65.1)
309(66.2)
177(80.5)
41(15.4)
392(34.9)
158(33.8)
43(19.5)
54.172**
2076

31
Variables
Preferred waiting time
< 3 yrs-short
term
N (%)
≥3 yrs-long
term
N (%)
X2 N
Sex composition
Boys=Girls
Boys<Girls
Boys>Girls
475(73.8)
489(68.2)
478(66.9)
169(26.2)
228(31.8)
237(33.1)
8.434*
2076
*p-value<0.05; **p-value<0.01
4.4 Factors influencing long term waiting period to the next birth
Given that the dependent variable, preferred waiting time to the next birth was dichotomous
binary logistic regression model was used to examine factors found to significantly influence
it. Out of 4236 women surveyed only 2061 were included in the logistic regression analysis.
Table 4.3 below indicates that out of the nine variables entered into the binary logistic
regression model, five variables were significantly associated with preferred waiting time to
the next birth. The factors are educational attainment, ethnicity, current use of any method,
age group and number of living children. Region, current working status, religion and sex
composition were not significant.
Educational attainment was a predictor and had a positive significant relationship with
preferred waiting time to the next birth. Women with primary incomplete education were
1.753 times more likely to wait for a longer period of time to their next birth in comparison
to women with no education. Women with completed primary education and Secondary
education and above were 2.255 and 2.226 times more likely to wait for a longer period of
time to their next birth as compared to women with no education.
Ethnicity was a significant factor determining preferred waiting time. The results indicate
that Somalis had 0.131 odds less likely to wait for a longer period of time to their next birth
while Kalenjin/Maasai had 0.319 odds less likely to wait for a longer period of time to their

32
next birth as compared to the Kikuyu, Kamba, Embu and Meru. Somali (p=0.003 95% CI
0.034-0.510) and Kalenjin/Maasai (p<0.01 95% CI 0.179-0.569) were statistically
significant and had negative association with preferred waiting time.
Another significant factor was current use of any contraceptive method. Findings of this
study indicated that women who currently use modern method of family planning were 1.572
times more likely to wait for a longer period of time to their next birth compared to women
who are currently not using any method. Modern method is highly significant to preferred
waiting time. (P< 0.01, 95% CI 1.209-2.045).
Age group was a highly significant factor to preferred waiting time to the next birth.
According to the analysis, women in the age groups 24-34 and 35> were 0.574 and 0.198
times less likely to wait for a longer period of time to their next birth compared to women in
the age group ≤24. (OR 0.574 and 0.198 respectively, 95% CI 0.447-0.736 and 0.124-0.317
respectively).The age groups 25-34 and 35> are both significant (p< 0.01) and have a
negative association to preferred waiting time to the next birth.
Number of living children was also a predictor (p< 0.01) and had a positive association to
preferred waiting time to the next birth. Women with 1-2 living children have a 3.433 times
higher odds and women with 3-4 living children have a 6.513 times higher odds of waiting
for a longer period of time to their next birth as compared to women with no living
children.(95% CI 2.220-5.279 and 3.890-10.904 respectively).

33
Table 4.3: Logistic regression coefficients, significance and odds ratio for currently
married women preference to preferred waiting time to their next birth
Variables
B S.E.
Exp(B)
(Odds ratio)
95% C.I.for EXP(B)
Lower Upper
Educational attainment
(Reference-No Education)
Primary Incomplete .56** .22 1.75 1.15 2.68
Primary Complete .81** .23 2.26 1.44 3.55
Secondary + .80** .24 2.23 1.39 3.57
Currently Working
(Reference-No)
Yes .02 .11 1.02 .82 1.27
Region
(Reference –Nairobi)
Central .06 .25 1.06 .65 1.73
Coast .10 .29 1.10 .63 1.94
Eastern .21 .24 1.24 .77 1.99
Nyanza -.19 .25 .83 .51 1.34
Rift Valley .35 .26 1.41 .84 2.37
Western -.02 .26 .98 .59 1.62
North Eastern -1.10 .73 .33 .08 1.40
Religion
(Reference-Roman Catholics)
Protestants/Other Christians -.14 .14 .87 .66 1.14
Muslims -.03 .22 .97 .63 1.49
Ethnicity
(Reference-Kikuyu, Kamba, Embu and Meru)
Luhya, Luo and Kisii .01 .21 1.01 .67 1.52
Kalenjin and Maasai -1.14** .30 .31 .18 .57
Mijikenda/Swahili and Taita Taveta -.00 .30 .10 .56 1.79

34
Variables
B S.E.
Exp(B)
(Odds ratio)
95% C.I.for EXP(B)
Lower Upper
Somalis -2.03** .69 .13 .03 .51
Others -.83** .28 .44 .25 .75
Current use of any method
(Reference-No Method)
Modern Method .45** .13 1.57 1.21 2.05
Traditional Method .32 .26 1.38 .83 2.29
Age group
Reference-≤24Yrs
25-34 -.56** .13 .57 .45 .74
35> -1.62** .24 .20 .12 .32
Number of living children
(Reference-0)
1-2 1.23** .22 3.42 2.22 5.28
3-4 1.87** .26 6.51 3.89 10.90
5> 2.23** .34 9.30 4.79 18.07
Sex composition
(Reference-Boys=Girls)
Boys<Girls -.26 .15 .77 .57 1.03
Girls>Boys -.06 .15 .94 .70 1.26
*p-value<0.05; ** p-value<0.01

35
4.5 Discussion
This study found that educational attainment was a predictor of preferred birth interval. The
more education a married woman had the more likely she was to prefer longer birth intervals.
This concurs with studies conducted earlier such as Becker and Lewis (1973) who found out
that highly educated women tend to replace child numbers with child quality. In the same
breadth, Ding and Hesketh (2006) in their study conducted in China found out that
preference for a small family was associated with high level of education. In a study in
Nigeria, Cochrane (1978) found out that only 10 percent of women with education beyond
primary education believed fertility to be determined by God while 50 percent of the totally
uneducated women believed fertility to be determined by God. In the case of Mozambique, at
the national level, women who read easily are the least likely to have short intervals
(Ramarao et al, 2006). Setty-Venugopal, and Upadhyay (2002) in 38 of 51 countries with
DHS data, found out that women with no education were more likely than educated women
to have shorter birth intervals. Contrary to the general expectation Wachira (2001) found out
that women with secondary education and above had a higher level of desire for more
children (42.8%) compared to women with primary (41.1%) and no education (29.3%).This
study however found out that women with no education (88.9%) preferred shorter birth
interval as compared to women with secondary education and above (64.5%), implying that
increased level of education among married women leads to preference of longer birth
intervals. The two measures of fertility preference; desire for more children and preferred
birth interval were rather inconsistent. Bumpass et, al (1986) also reported short second birth
interval for women with higher education in some settings in Korea. Kamal and Khalid
(2012) named the reason for the short birth interval for highly educated women in Korea as
compressing the child bearing.
Ethnicity was a predictor of preferred birth interval. Kalenjin, Maasai and Somalis are less
likely to wait for a longer period of time to their next birth. The results of this study concur
with the findings of a study carried out by Anyara and Hinde (2006) which found out that
increases in fertility levels were more pronounced in Narok/Kajiado and Baringo regions
which are mainly inhabited by Maasai and Kalenjin ethnic groups in the Rift valley region of
Kenya. Early marriages are common in Somali culture. This exposes the young married

36
women to the risk of getting pregnant many times. In a previous study by Wachira (2001)
Luos, Luhyas and Kisii had the highest desire for more children followed by the Kalenjin
community as opposed to this study which found out that Somalis followed by the
Kalenjin/Maasai community were less likely to prefer longer birth intervals. A point to note
is that in Wachiras study North eastern region of Kenya was not included in the survey which
is majorly inhabited by the Somalis.
Current use of any modern method was also a predictor of preferred birth interval. Women
who use modern method of family planning are more likely to prefer longer birth intervals.
Findings in other studies reveal that women are more likely to use contraceptives if both
spouses desire fewer children (Irani et al 2014). If both spouses desire fewer children the
likelihood of a married woman to use contraceptives would be high hence increasing the
uptake of contraceptive use possibly because the spouses would have discussed the use of
contraceptives to avoid unwanted fertility
Age group was also a predictor of preferred birth interval. According to a study by Seannot
and Yeatman (2012) the desire to stop childbearing is rare among younger women which
coincide with the results of this study that younger women are less likely to prefer longer
birth intervals. In addition this finding also corresponds with Ramarao et al (2006) finding in
a Mozambique study, Correlates of Inter-birth Intervals: whereby younger women were
found to be more likely to have a birth interval less than three years than those older.
Number of living children was also a predictor of preferred birth interval. This study found
that women with fewer children were less likely to wait for a longer period of time to their
next birth. This is consistent with findings in Gaza, Nampula and Zambezia of Mozambique
where women who have few currently living children (none or one) or over five children
more likely to have short intervals than those who have between two and four children. In
addition literature has often suggested that those who have suffered a pregnancy or child loss
are more likely to replace that pregnancy/child and hence the interval between births is short.
Wachira (2001) found high desire for more children among women who had experienced
child loss in comparison to those who had not. The prevalence of high child and infant
mortality has contributed to the practice of high fertility rates in Sub Saharan African
37
countries. With high infant mortality rates, high fertility is viewed a medium of increasing
the chances of precluding lineage extinction( Makinwa –Adebusoye,2001) A second
explanation is related to the fecundity factors where women who conceive easily and quickly
are also those who are more likely to have more children. Thirdly, the death of the index
child in infancy or early childhood has also been found to be associated with short
subsequent intervals in settings as separate as Bangladesh and Tanzania (Chakraborty,
Sharmin and Islam, 1996; Mturi, 1997). Sometimes, parents consciously plan a new
pregnancy to replace a lost child. There are unintentional reasons for short spacing too—the
death of a child cuts short nursing durations which results in earlier resumption of menses
and ovulation.
Interestingly enough, current working status, region, religion, sex composition, type of place
of residence and inter spousal communication were not significant in this study. This is
inconsistent with earlier studies such as the impact of woman’s status on fertility and
contraceptive use in Bangladesh, DHS 1999-2000 whose finding was that skilled job and
discussion about family planning with partner were some of the factors found to be related
with having significant fewer numbers of children. Additionally Mahmud and Rhinheims
(1997) detected inter spousal communication as a significant factor to have no more children.
According to Cleland and Wilson (1987) cultural factors such as language religion customs
and values have been shown to have an impact on fertility behaviors. In this study however
religion was found to be insignificant to fertility preference. In terms of sex composition the
findings of this study were inconsistent with earlier studies like the study by Pramila et,al
(2014) conducted in Tharu, rural of Nepal which found out high sex ratio at last birth and
shorter birth spacing following female children. Their plan for next birth was strongly
affected by sex composition unlike this study. Likewise Wachira (2001), found out those
women who reported having more daughters than sons had more desire to have more
children compared to women who had more sons or those who had an equal number of sons
and daughters. Regarding type of place of residence, this study found it not to be significant
to fertility preference; yet earlier studies reveal that urban people prefer smaller families
(Knodel et al., 1996; Singh and Casterline1985; Mahmud and Ringheim, 1997; Ali, 2000).
Similarly the analysis of this study found region to be insignificant. This was inconsistent
with other studies that found regional variations existing with regard to fertility intentions
(Farid 1996).

38
CHAPTER FIVE: SUMMARY, CONCLUSION AND RECOMMENDATIONS
5.1 Introduction
The main objective of this study was to determine factors associated with fertility preference
among currently married women in Kenya. This project attempted to examine the effects of
some selected socio economic, cultural and demographic variables on fertility preference
among currently married women in Kenya. This study provided further knowledge and
revealed important information on the factors influencing preferred birth intervals among
currently married women in Kenya. This section will be presented in three parts namely
summary, conclusion and recommendations.
5.2 Summary of findings
The study found that education was positively associated with preferred birth interval of
currently married women in Kenya. The more education a woman has the more likely she is
to wait for a longer time before the next birth. This could be due to employment status, use of
contraceptives and reproductive health awareness. Inconsistencies with earlier results were
also noted like in the case of highly educated women in Korea having short birth intervals
(Bumpass et, al 1986). The reason for such diversity is uncertain, although Kamal and Khalid
(2012) named it as compressing the child bearing, meaning better educated women wish to
compress child bearing into fewer years so that they can participate in other activities and
hence have shorter spacing.
Ethnicity was another factor influencing preferred birth intervals. This study found out that
Somalis, Kalenjins and Maasai are less likely to prefer longer birth intervals. Family
planning and education policies/programs need to be considered among Somalis, Kalenjins
and Maasai. In a paper by Khasakhala (2011) entitled ethnic fertility differentials and their
proximate determinants in Kenya: the highest level of fertility were experienced among the
Maasai, Somali, Kalenjin and Turkana. This is consistent with the findings of this study.
Kalenjins, Maasai and Somalis need to be targeted and conveyed with optimal birth spacing
messages.
Current use of any Family Planning method was another significant factor on preferred birth
interval among currently married women in Kenya. This study found out that women who

39
use modern method of family planning preferred longer waiting time to their next birth.
Family planning programs have the potential to change the dynamics of fertility in Kenya
and as such fertility regulation programs should continue integrating family health issues
with contraceptive services empowering women’s reproductive decision making capabilities.
Further, in Kenya, there is a need to orient family planning campaign towards specific
communities that are still in a pre-transitional phase of fertility transition. Without a
reduction of desired fertility, family planning programs will not be effective (Muhoza et,al
2014).
Age group was another significant predictor of preferred birth interval. The results conclude
that younger women were less likely to wait for a longer period of time to their next birth.
This makes intuitive sense because younger women are more likely to have children for a
variety of reasons such as higher fecundity and having a few children yet not completed child
bearing.
Preferred waiting time is predicted by the number of living children a woman has. The more
the number of living children a married woman has the more likely she is to prefer longer
birth interval. This makes logical sense because a woman without a child is more eager to get
one compared with a woman who has several children.
5.3 Conclusions
This study intended to find out the influence of selected socioeconomic, cultural,
demographic, factors, inter spousal communication and contraceptive use on currently
married women’s fertility preference in Kenyan. Younger women, women with incomplete
primary or no education, women with fewer numbers of living children, women not using
any method of contraception were significantly more likely to prefer shorter birth intervals.
With majority of Kenyan women preferring short birth intervals, it is clear that fertility levels
in Kenya will still remain high reflecting pronatalistic cultural imperatives in Kenya and if
Kenya’s Fertility transition is to continue and even go lower than where it has currently
stalled, more research and policy work needs to be done to enhance family planning uptake
in Kenya and better understand the benefits that come along with birth spacing.

40
5.4 Recommendations
Recommendations for further research
Further studies, both qualitative, quantitative or mix qualitative and quantitative approaches
need to be carried out to explore the social cultural and religious beliefs norms and attitudes
of currently married women in Kenya with regard to family planning and birth interval as
this could help understand better what needs to be done to improve uptake of family planning
in women across the country and better understand the component of birth interval.
Qualitative analysis may be a basis for more in-depth research especially on traditional
religious systems which operate in a negative way to suppress impulses (Molnos, 1973) that
might lead to a lowering of the overall level of fertility.
Men’s status and approval of family planning and birth interval should also be researched
further as some women tend to make decisions about family planning or even birth spacing
based on what their male partner’s advice.
Recommendations for policy
Family planning program should be more intensified among the Somalis, Kalenjins and
Maasai. Longer birth interval norm should be made more popular among the Somalis,
Kalenjins and Maasai, as a short birth interval causes many health risks for a woman and her
newborn child, and the desire to lengthen birth intervals results to the achievement of small
families.
The importance of education as a weapon to health and socio-economic independence should
also be emphasized. Programs should also be designed to improve women’s economic
independence in general. Strategies should be undertaken to ensure that women with no
education contribute to a significant change in women’s fertility preference. Programs to this
effect should include those that will sensitize the girls to the consequences of early sexual
debut, marriage and childbearing.
Interventions promoting specific birth spacing messages may be successful the closer they
are to women’s own preferences and desires. Additionally, women who are more likely to

41
have shorter birth intervals should be targeted with information on having optimal birth
interval.
For many years, birth spacing has been largely studied and promoted for its demographic,
rather than health, effects because longer spacing can lower birth rates. Projections of the
estimated impact of birth spacing on maternal and child health should be emphasized as well
so that both the demographic and health effects are achieved. Chances are if health benefits
are achieved, demographic targets too will be achieved.

42
References
Adhikari, R. (2010). Demographic Socio economic and cultural factors that affect fertility
differentials in Nepal. BMC Pregnancy and childbirth 10:19
http://www.biomedcentral.com/1471-2393/10/19
Agadjanian, V. (2005). Fraught with ambivalence: Reproductive intentions and contraceptive
choices in a Sub-Saharan fertility transition. Population research and policy review.
24(6):617–645.
Aguda, T. A. (1992). Legal factors affecting fertility and contraceptive use. In federal
republic of Nigeria: Implementing the National policy on population. Sectoral report.
Vol. II Annexes, World Bank, Western Africa Department, Population and Human
Resources Operations Division. Annex C. pp.1-37.
Akmam, W. (2002). Women's education and fertility rates in developing countries, with
special reference to Bangladesh Eubios Journal of Asian and International Bioethics
12, 138-143.
Ali, M. (2000). The effect of selected socio-demographic characteristics on desire of
additional children among couple’s in Bangladesh. Master’s thesis, faculty of
graduate studies, Mahidol University, Thailand.
Anyara, E.L., and Hinde, A. (2006). Fertility transition in Kenya: a regional analysis of the
proximate determinants.
Ayehu, T.Y. (1998). Correlates of fertility preference of Kenyan women: Evidence from
1993 KDHS.
Bankole, A., and Westoff, C.F. (1995). Childbearing attitudes and intentions demographic
surveys comparative studies number 17, Macro international inc, Calverton Maryland
USA.
Bankole, A., and Singh, S. (1998). Couples’ fertility and contraceptive decision - making in
developing countries: Hearing man’s voice. International family planning
perspective, 24(1): 15-24
Becker, G.S., and Lewis, H.G. (1973). On the interaction between the quantity and quality of
children. Journal of political economy, 81(2), 279-288.
Becker, G.S. (1965). A theory of the allocation of time. Economic Journal, 75(299):
493–517. doi: 10.2307/2228949

43
Becker, S. (1996). "Couples and Reproductive Health: A Review of Couple Studies",
Studies in Family Planning 26(4): 233-240.
Bernardi, L., Keim, S. and Lippe, H.V.D. (2007). Social influence on fertility: A comparative
mixed methods study in Eastern and Western Germany’, Journal of Mixed Methods
Research 1(1):23-47.
Blanc, A.K., and Tsui, A.O. (2005). The dilemma of past success: insiders’ views on the
future of the international family planning movement, Studies in Family Planning,
36(4):263–276. http://dx.doi.org/10.1111/j.1728-4465.2005.00069.x
Bongaarts, J. (2010).Poverty, gender and youth: The causes of educational differences in
fertility in sub-Saharan Africa. Population Council.
Bumpass, L. L, Ronald, R. R., and James A. P. (1986). “Determinants of Korean birth
intervals: The confrontation of theory and data.” Population Studies, Vol. 40(3): 403-
423.
Caldwell, J.C., and Caldwell, P. (1987). The cultural context of high fertility in sub-Saharan
Africa. Population and Development Review, vol. 13, No. 3, pp. 409-437.
Chakraborty, N., Sharmin, S., and Ataharul Islam, M. (1996). “Differential pattern of birth
intervals in Bangladesh.” Asia-Pacific Population Journal, Vol. 11(4): 73-86.
Chaudhury, R. H. (1977). Education and fertility in Bangladesh. Bangladesh Development
Studies (Jan.).
Cleland et al., (2006) Family planning: The unfinished agenda, Lancet, 2006,
368(9549):1810–1827. http://dx.doi.org/10.1016/S0140-6736(06)69480-4
Cleland, J., and Wilson, C. (1987). Demand theories of the fertility transition: An
Iconoclastic View. Population Studies 41(1): 5-30
Cleland, J., and Jejeebhoy, S. (1996). Maternal Schooling and Fertility: Evidence from
Censuses and Surveys. In Girl's Schooling, Autonomy and Fertility Change in South
Asia. Roger Jeffery and Alaka M. Basu (eds.). Thousand Oaks, C.A.: Sage
Publications. Pp.72-106.
Cochrane, S. H. (1978). Fertility and Education: What do We Really Know? London;
Baltimore: The John Hopkins University Press (For the World Bank)
Coombs, L. C., and Fernandez, D. (1978). Husband–Wife Agreement about Reproductive
Goals”, Demography, volume 15, number 1

44
Ding, Q.J., Hesketh, T. (2006). Family size, fertility preferences, and sex ratio in China in the
era of the one child family policy: results from national family planning and
reproductive health survey. BMJ 2006, 333(7564):371–373.
Dommaraju, P., and Agadjanian E.V. (2009) India’s North-South divide and theories of
fertility change. Journal of Pop Research (2009) 26: 249-72.
Easterlin, R.A. (1975). An economic framework for fertility analysis. Studies in family
planning. Volume 6, Number 3: 54-63.
Entwisle, B., Rindfuss, R.D. Guilkey, D.K. Chamratrithirong, A. Curran, S.R. and Sawangde,
Y. (1996). ‘Community and contraceptive choice in rural Thailand: A Case Study of
Nang Rong’, Demography 33 (1): 1-11.
Ezeh, C.A., Mberu, U B., Emina, O. J. (2009). Stall in fertility decline in eastern African
countries: Regional analysis of patterns, determinants and implication. Philosophical
transactions. The royal society biological science, vol. 364 no. 1532 2991-3007
Farid, S. (1996). Transition in demographic and health patterns in the Arab Region,
Proceedings of the Arab Regional Conference, Vol. 1 and Cairo: CDC Press, pp435-
467
National survey of family growth, (2006-2010). Fertility of men and women aged 15–44
years in the United States. http://www.cdc.gov/nchs/data/nhsr/nhsr051.pdf.
Fitaw, Y., Berhane, Y., and Worku, A. (2004). Impact of child mortality and fertility
preferences on fertility status in rural Ethiopia. East African medical journal.
Freedman, R. (1979). Theories of fertility decline: A reappraisal," Social Forces 58:1-17.
Hoque, Md. Nazrul, and Murdock S. H. (1997). Socioeconomic development, status of
women, family planning and fertility in Bangladesh. Social Biology. Vol. 44 Nos. 3-4.
Fall- Winter: 179-197.
Hoffman, L.W., and Hoffman M.L. (1973). The value of children to parents. In J.T. Fawcett
(Eds).Psychological perspectives on population. New York Basic Books.
Irani, L. (2014). Relationship characteristics and contraceptive use among couples in urban
Kenya.
Ibisomi, L.D.G. (2007). Analysis of fertility dynamics in Nigeria: Exploration into fertility
preference implementation. PhD Thesis, University of Witwatersrand, Johanessburg,
South Africa.

45
Jejeebhoy, S.J. (1995). Women's education, autonomy, and reproduction behaviour:
experience from developing countries. Oxford: Clarendon Press.
Johnson-Hanks, J. (2007). Natural intentions: Fertility decline in the African demographic
and health surveys. American Journal of Sociology. 112(4):1008–1043.
Johnson-Hanks, J. (2005).When the future decides: uncertainty and intentional action in
contemporary Cameroon. Current Anthropology. 46(3):363–385.
Kabir, M. A. et al. (1999-2000). Impact of woman’s status on fertility and contraceptive use
in Bangladesh:Evidence from Bangladesh Demographic and Health Survey 1999-
2000
Kenya National Bureau of Statistics (KNBS) and ICF Macro.(2010): Kenya Demographic
and Health Survey 2008-09. Calverton, Maryland: KNBS and ICF Macro.
Khasakhala, A., (2011). Ethnic fertility differentials and their proximate determinants in
Kenya: Implications for development.
Kamal, A., and Khalid, M. P. (2012) Determinants of Higher Order Birth Intervals in
Pakistan.
Knodel, J.,Ruffolo, V.P., Ratanalangkarn, P., Wongboonsin, K. (1996). "Reproductive
preferences and Family Trends in Post Transition Thailand”, Studies in Family
Planning, Vol. 27 (6):307-318
Mahmud, N., and Ringheim, K, (1997). Knowledge, approval and communication about
family planning as correlates of desired family among spouses in Pakistan.
International Family Planning Perspective, 23:122-129and 145
Makinwa-Adebusoye P. (2001). Sociocultural Factors Affecting Fertility in Sub-Sahara
Africa.Workshop on Prospects for Fertility Decline in High Fertility Countries.
Population Division, Department of Economic and Social Affairs, United Nations
Secretariat. New York, 9-11 July 2001. UN/POP/PFD/2001/12.
Makinwa-Adebusoye, Paulina, and Joshua Ebigbola (1992). Socio-cultural factors affecting
fertility and family planning in Nigeria. In. Federal Republic of Nigeria:
Implementing the National Policy on Population. Sectoral Report. Vol. II Annexes,
World Bank, Western Africa Department, Population and Human Resources
Operations Division. Annex B. pp.1-33.

46
Maria, R. T. (N.D).Women's fertility intentions and level of education: why are they
positively correlated in Europe?
Mason, K. O. (1984). The Status of Women: A Review of Its Relationships to Fertility and
Mortality. New York: The Rockefeller Foundation
Mason, K and Anju, M. T. (1987). “Differences between women’s and men’s reproductive
goals in developing countries.” Population and Development Review 13(4): 611–638
Matsumoto, Y., and Yamabe, S. (2013) Family size preference and factors affectin fertility in
hyogo, Japan.
Mbacke, C. (1994). Family planning programmes and fertility in sub Saharan, in population
dynamics of sub saharanafrican. Population development review. Vol 1 20 No 1
(publish by population council.
Measure DHS, (2001) Analytical studies 2: Gap between preferred and actual birth intervals
in Sub-Saharan Africa: Implications for fertility and child health
Merrick, T. (2002). Population and poverty: new views on an old controversy.
Molnos, A. (1973).Cultural source materials for population planning in East Africa. Institute
of African studies University of Nairobi.
Mturi, Akim J. (1997). “The determinants of birth intervals among non-contracepting
Tanzanian women.” African Population Studies, Vol. 12(2).
Muhoza, D. N., Broekhuis, A., and Hooimeijer, P. (2014). Variations in desired family size
and excess fertility in East Africa. International journal of population research
Volume 2014 (2014), Article ID 486079, 11
pageshttp://dx.doi.org/10.1155/2014/486079
Munshi, K. and Myaux, J. (2005). Social norms and the fertility transition. Journal of
development economics, 80 (2005) 1-38.
National Council for Population and Development, (2012). Sessional Paper Number 3 on
Population Policy and National Development.
National Survey of family growth, (2006-2010). Fertility of Men and Women Aged 15–44
Years in the United States: http://www.cdc.gov/nchs/data/ nhsr/nhsr051.pdf
National Research Council Committee on Population, (1989). Contraception and
Reproduction: Health Consequences for Women and Children in the Developing
World. Washington, DC: National Academy Press.
47
Okech, T. C., Wawire, N. W., Mburu, T. K. (2011) Contraceptive Use among Women of
Reproductive Age in Kenya’s City Slums.
Population council, (2009). Kenya’s fertility transition: Trends, determinants and
implications for policy and programmes.
Rai, P. et al (2014) Effect of gender preference on fertility:cross-sectional study among
women of Tharu community from rural area of eastern region of Nepal.Raiet al.
Reproductive Health 2014, 11 :15
Ramarao, S., Townsend, J., and Askew, I. (2006). Correlates of inter-birth intervals:
implications of optimal birth spacing strategies in Mozambique. Population Council.
Reza, R. (2001). Factors influencing fertility preference of men in Bangladesh population
and reproductive health research faculty of graduate studies Mahidol University.
Republic of Kenya, (2009), Demographic Health Survey of 2008, Nairobi, Government
Printer.
Republic of Kenya, (2013). Kenya population situation analysis.
Rogers, E.M., and Kincaid, D.L. (1981). Communication networks: Toward a new paradigm
for research’. New York: The free press.
Rogers, E. M., Vaughan, P.W., Swalehe, R.M.A., Rao, N., Svenkeurd, P., and Sood,S. (1999)
.‘Effects of an entertainment-education radio soap opera on family planning behavior
in Tanzania’, Studies in Family Planning 30(3):193-211.
Sennott, C., and Yeatman, S. (2012). Stability and change in fertility preferences among
young women in Malawi.
Sidze et al, (ND). Changing fertility preferences in urban and rural Senegal: patterns and
determinants.
Singh, S., and Casterline, J. (1985). “The Socio-economic determinants of fertility”, In J.
Cleland and J. Hobcraft (eds). Reproductive change in developing countries. Oxford
University press. 199-222.
Tarun, K.R., Sinha, R.K., Koenig, M., Mohanty, S. K., and Patel, S.K. (2008). Consistency
and predictive ability of fertility preference indicators: Longitudinal evidence from
rural India.
48
Toure, L. (1996). Male involvement in family planning. A review of literature and selected
program initiatives in Africa. Washington, DC: Academy for Educational
Development.
Uche, C., and Isiugo-Abanihe (1994). "Reproductive motivation and family size preferences
among Nigerian men”, Studies in family Planning 25,149-161
Setty-Venugopal, V and U.D. Upadhyay. (2002). Birth spacing: Three to five saves lives.
Population reports, Series L, No. 13. Baltimore: Johns Hopkins Bloomberg School of
Public Health, Population Information Program.
Vaughan, P.W., Regis, A., and St. Catherine, E. (2000). ‘Effects of an entertainment-
education radio soap opera on family planning and HIV Prevention in St. Lucia’,
International family Planning Perspectives 26(4):148-57.
Wachira, E.W. (2001). Determinants of fertility preferences in Kenya study based on Kenya
Demographic and Health Survey.
World Health Organization, (2007). Report of a technical consultation on birth spacing
Geneva, Switzerland.