Determinants of COVID-19 vaccination and views of parents ...
31
Determinants of COVID-19 vaccination and views of parents about vaccination of children in Australia: August 2021 i The ANU Centre for Social Research and Methods Determinants of COVID-19 vaccination and views of parents about vaccination of children in Australia: August 2021 ANU Centre for Social Research and Methods Professor Nicholas Biddle 1 , Associate Professor Ben Edwards 1 , Professor Matthew Gray 1 , and Kate Sollis 1 1 ANU Centre for Social Research and Methods Australian National University 10 th September 2021
Transcript of Determinants of COVID-19 vaccination and views of parents ...

Determinants of COVID-19 vaccination and views of parents about vaccination of children in Australia: August 2021
i The ANU Centre for Social Research and Methods
Determinants of COVID-19 vaccination and views of parents about vaccination of
children in Australia: August 2021
ANU Centre for Social Research and Methods
Professor Nicholas Biddle1, Associate Professor Ben Edwards1, Professor Matthew Gray1, and Kate Sollis1
1 ANU Centre for Social Research and Methods
Australian National University
10th September 2021

Determinants of COVID-19 vaccination and views of parents about vaccination of children in Australia: August 2021
ii The ANU Centre for Social Research and Methods
Acknowledgements The authors would like to thank a number of people who were involved in the development of the ANUpoll questionnaires, including Diane Herz, Dr Benjamin Phillips, Dr Paul Myers, Matilda Page, Diana Nguyen, Anna Lethborg and Charles Dove from the Social Research Centre, and Professor Ian McAllister from the ANU. Financial support for the ANU COVID-19 Impact Monitoring Survey Program has been provided by the Australian Institute of Health and Welfare. We would also like to thank Dinith Marasinghe from the ANU for assistance with tables and figures.
The survey data is available for download through the Australian Data Archive (doi:10.80408/H6AQQE).
Abstract This paper provides the first detailed, publicly available analysis of the socioeconomic and attitudinal determinants of COVID-19 vaccination amongst both Australian adults and Australian parents’ views about vaccinating their children in the future. The analysis is based on the August 2021 wave of the ANU Centre for Social Research and Methods’ COVID-19 Impact Monitoring survey program. We find important demographic and socioeconomic predictors of vaccine uptake. Vaccination rates are lower for those who have relatively low levels of education, those who speak a language other than English, those who live outside of New South Wales, and those who have a relatively low household income. Other groups that continue to have low rates of vaccination are those who have a low fear of infection; those experiencing psychological distress; those who have low confidence in state/territory governments; and those who report being very religious. The survey data also shows that the willingness of Australians to get vaccinated has increased since August 2020 and April 2021. Hesitancy has declined for those who haven’t been vaccinated, with 93.9 per cent of Australians either already vaccinated or willing to get vaccinated.
In regards to vaccinating children, 42.5 per cent of parents and carers reported they would definitely vaccinate children in their household, 36.3 per cent would probably get their child vaccinated, 11.4 per cent would probably not get their child vaccinated and 9.8 per cent would definitely not get their child vaccinated. The analysis found that there are key groups who would be less likely to get their child vaccinated. This includes mothers/female carers, those who are Aboriginal and Torres Strait Islander, those who speak a language other than English, those with low education, and those who live in disadvantaged areas. These findings have important implications for the COVID-19 vaccine rollout in Australia.

Determinants of COVID-19 vaccination and views of parents about vaccination of children in Australia: August 2021
iii The ANU Centre for Social Research and Methods
Executive summary • This paper provides the first detailed, publicly available analysis of the socioeconomic and
attitudinal determinants of COVID-19 vaccination amongst Australian adults and children. • The analysis is based on the August 2021 wave of the ANUpoll series of surveys, which
forms part of the ANU Centre for Social Research and Methods’ COVID-19 Impact Monitoring survey.
• We find important demographic and socioeconomic predictors of vaccine uptake. Vaccination rates are lower for: those who have relatively low levels of education, those who speak a language other than English, those who live outside of NSW, and those who have low household income.
• Concerns about side effects remain important. People who were concerned about side effects in April 2021 were less likely to have been vaccinated in August 2021. Furthermore, concerns about side effects remain for those who in August 2021 had not yet been vaccinated. Only 13.1 per cent of Australians were not at all concerned, with 28.5 per cent very concerned.
• There are additional survey-specific predictors of low vaccination, including: those who have a low fear of infection; those experiencing psychological distress; those who have low confidence in state/territory governments; and those who report being very religious.
• Despite these important population groups with relatively low uptake, the survey data shows an overall increased willingness to get vaccinated in Australia. Hesitancy has declined for those who haven’t been vaccinated, and 93.9 per cent of Australians are either now vaccinated, or say that they definitely or probably will get vaccinated once a safe and effective vaccine is available.
• There is a strong correlation between vaccine willingness in April 2021 and vaccination rates in August 2021. However, while vaccine willingness/hesitancy is predictive, it is not deterministic.
o 72.5 per cent of those who said that they would definitely get vaccinated once a safe and effective one was available to them had been vaccinated by August 2021. This declines to 46.0 per cent for those who in April 2021 said they probably would get vaccinated, 19.8 per cent of those who said they probably would not get vaccinated and 16.8 per cent of those who said that they definitely would not get vaccinated.
• The August 2021 ANU COVID impact monitoring survey asked adult respondents, for the first time, about vaccine hesitancy/willingness on behalf of each child in their household. Adult respondents reported that once a vaccine was available to the child that
o 42.5 per cent of parents who would definitely get their child vaccinated, 36.3 per cent would probably get their child vaccinated, 11.4 per cent would probably not get their child vaccinated and 9.8 per cent would definitely not get their child vaccinated.
o There are some key groups who are less likely to get their child vaccinated, according to the survey data. This includes mothers/female carers, those who are Aboriginal and Torres Strait Islander, those who speak a language other than English, those with low education, and those who live in disadvantaged areas.

Determinants of COVID-19 vaccination and views of parents about vaccination of children in Australia: August 2021
4 The ANU Centre for Social Research and Methods
1 COVID-19 infection and vaccination in Australia The recently released book Vaxxers: The Inside Story of the Oxford AstraZeneca Vaccine and the Race Against the Virus by Professor Sarah Gilbert and Dr Catherine Green tells the remarkable story of the development of the Oxford AstraZeneca vaccine, one of a number of vaccines against COVID-19 that have been shown in clinical trials and population analysis to be both effective against the disease and safe in terms of serious side effects.
Professor Gilbert talking about her own experience being vaccinated writes ‘Joining the socially distanced queue outside the clinic, I felt elated because I was about to receive the vaccine I had started to plan just over a year ago.’ She talks about the side effects that she experienced after that first dose ‘I had experienced a few hours of discomfort, and now I was tired.’ ….. ‘so much better than starting to experience COVID-19 symptoms and – as had already been the case for more than 100 million people – not knowing what lay in store.’ (Gilbert and Green 2021: 272).
There is a very small percentage of those who have received COVID-19 vaccines that have experienced far worse side effects than those described by Professor Gilbert, including ‘thrombosis in combination with thrombocytopenia’1 However, the risk of this very rare blood clotting disorder is even higher for those infected by COVID-19 (Hippisley-Cox et al. 2021).
In the early stages of the pandemic there was a real fear amongst many that it would take years for effective vaccines to be available and some concerns that there may never be an effective vaccine developed2. These fears have proven to be unfounded. At the time of writing in September 2021, there are multiple vaccines that have been widely used around the world and which are resulting in lower rates of infection, hospitalisation, and transmission for those who have been vaccinated (Lopez Bernal et al. 2021). The evidence is also that these vaccines are safe (Wu et al. 2021).
Despite the abundance of evidence that the vaccines approved for use in Australia, the UK, and the US and other similar countries are both safe and effective, there is a minority of the population who are sceptical of the safety or efficacy of the COVID-19 vaccines, or who doubt the risks of being vaccinated outweigh the risks of COVID-19 (Biddle et al 2021; Edwards et al 2021). This is especially the case in situations where the perceived risk of COVID-19 is low, either due to lower actual risk, or because of related scepticism of the severity of COVID-19.
There is a smaller group that are more than just sceptical and who are hostile to the use of COVID-19 vaccines, believing that information provided by government, the companies who have developed the vaccine, and those in the public health system is wrong, or outright lies. According to Curiel and Ramirez (2021: 1) ‘different anti-vaccine narratives are being created and are probably being adopted by large population groups with critical consequences’. Germani and Biller-Andorno (2021: 1) write that the anti-vaccination ‘movement’s success relies on a strong sense of community, based on the contents produced by a small fraction of profiles, with the community at large serving as a sounding board for anti-vaccination discourse to circulate online’.
This spectrum of views on the safety and efficacy of COVID-19 vaccines influences demand for vaccines. In countries like Australia which commenced the vaccine roll-out relatively late compared to many other OECD countries3, supply or availability has also been an issue.4 Progressively throughout 2021, vaccines have been made available to priority groups, with the
Determinants of COVID-19 vaccination and views of parents about vaccination of children in Australia: August 2021
5 The ANU Centre for Social Research and Methods
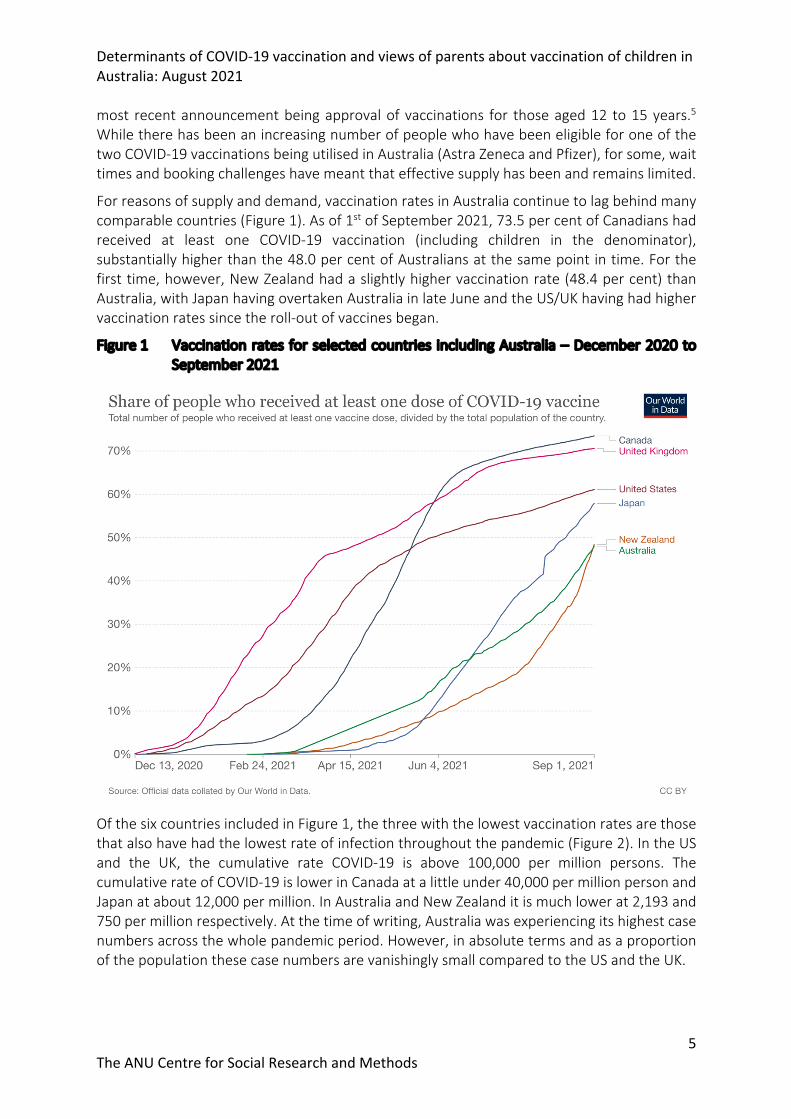
most recent announcement being approval of vaccinations for those aged 12 to 15 years.5 While there has been an increasing number of people who have been eligible for one of the two COVID-19 vaccinations being utilised in Australia (Astra Zeneca and Pfizer), for some, wait times and booking challenges have meant that effective supply has been and remains limited.
For reasons of supply and demand, vaccination rates in Australia continue to lag behind many comparable countries (Figure 1). As of 1st of September 2021, 73.5 per cent of Canadians had received at least one COVID-19 vaccination (including children in the denominator), substantially higher than the 48.0 per cent of Australians at the same point in time. For the first time, however, New Zealand had a slightly higher vaccination rate (48.4 per cent) than Australia, with Japan having overtaken Australia in late June and the US/UK having had higher vaccination rates since the roll-out of vaccines began.
Figure 1 Vaccination rates for selected countries including Australia – December 2020 to September 2021
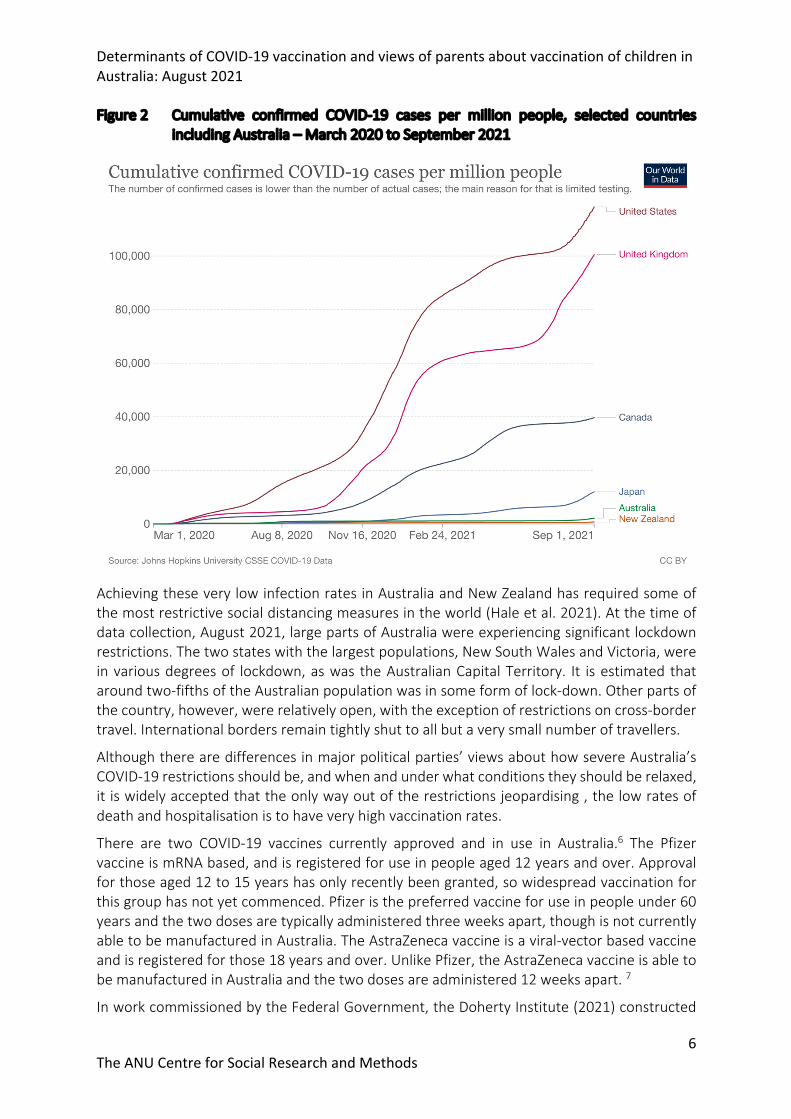
Of the six countries included in Figure 1, the three with the lowest vaccination rates are those that also have had the lowest rate of infection throughout the pandemic (Figure 2). In the US and the UK, the cumulative rate COVID-19 is above 100,000 per million persons. The cumulative rate of COVID-19 is lower in Canada at a little under 40,000 per million person and Japan at about 12,000 per million. In Australia and New Zealand it is much lower at 2,193 and 750 per million respectively. At the time of writing, Australia was experiencing its highest case numbers across the whole pandemic period. However, in absolute terms and as a proportion of the population these case numbers are vanishingly small compared to the US and the UK.
Determinants of COVID-19 vaccination and views of parents about vaccination of children in Australia: August 2021
6 The ANU Centre for Social Research and Methods
Figure 2 Cumulative confirmed COVID-19 cases per million people, selected countries including Australia – March 2020 to September 2021
Achieving these very low infection rates in Australia and New Zealand has required some of the most restrictive social distancing measures in the world (Hale et al. 2021). At the time of data collection, August 2021, large parts of Australia were experiencing significant lockdown restrictions. The two states with the largest populations, New South Wales and Victoria, were in various degrees of lockdown, as was the Australian Capital Territory. It is estimated that around two-fifths of the Australian population was in some form of lock-down. Other parts of the country, however, were relatively open, with the exception of restrictions on cross-border travel. International borders remain tightly shut to all but a very small number of travellers.
Although there are differences in major political parties’ views about how severe Australia’s COVID-19 restrictions should be, and when and under what conditions they should be relaxed, it is widely accepted that the only way out of the restrictions jeopardising , the low rates of death and hospitalisation is to have very high vaccination rates.
There are two COVID-19 vaccines currently approved and in use in Australia.6 The Pfizer vaccine is mRNA based, and is registered for use in people aged 12 years and over. Approval for those aged 12 to 15 years has only recently been granted, so widespread vaccination for this group has not yet commenced. Pfizer is the preferred vaccine for use in people under 60 years and the two doses are typically administered three weeks apart, though is not currently able to be manufactured in Australia. The AstraZeneca vaccine is a viral-vector based vaccine and is registered for those 18 years and over. Unlike Pfizer, the AstraZeneca vaccine is able to be manufactured in Australia and the two doses are administered 12 weeks apart. 7
In work commissioned by the Federal Government, the Doherty Institute (2021) constructed

Determinants of COVID-19 vaccination and views of parents about vaccination of children in Australia: August 2021
7 The ANU Centre for Social Research and Methods
models of COVID-19 infection and vaccination. These can be used to estimate the level of vaccine coverage at which restrictions could be reduced while ensuring the health and other systems do not become overwhelmed. systems to’ The Doherty Institute models suggest that the required vaccination rate to achieve this is between 70 and 80 per cent of those aged 16 years and over depending on the type of restrictions that remain in place.
However, as Hanly et al. (2021: 1) note ‘Maintenance of high levels of community testing to facilitate the rapid detection and isolation of new cases will be essential in the post-vaccination phase. Ongoing non-pharmaceutical interventions including masks may also be necessary to live with COVID-19.’ The Doherty Institute modelling also estimates that at 70 per cent vaccination coverage and partial ‘test, trace, isolate, quarantine’ (TTIQ) there will be 1,457 deaths in the first six months, though this is well below the 8,032 deaths estimated under 50 per cent coverage.
One of the (recognised) limits of the Doherty Institute (2021) modelling is that the national rate of 70 or 80 per cent, or even state/territory specific rates of that magnitude, would leave certain population groups with substantially lower rates of coverage than others. This includes children who are not part of the target rates, with approval only recently given for those aged 12 to 15 years to be vaccinated with Pfizer, and approval not yet granted for any vaccines for those 11 years and under. There are also groups within the adult population that may have lower uptake than others, or that may be particularly at risk if infected by the virus.
Low vaccination uptake for certain groups would be mitigated to a certain extent by the herd immunity that a high population coverage would bring. However, it is important to note that recent research suggests that herd immunity will not be achieved without substantial vaccination rates amongst children (McBryde et al. 2021). Furthermore, while COVID-19 vaccines available in Australia significantly reduce hospitalisation and death for the vaccinated individual (Lopez Bernal et al. 2021), their impact on transmission is unclear and still requires further investigation (Baraniuk 2021).
To bring forward the time at which restrictions can be loosened in Australia to as early as possible, and also to minimise the impact on vulnerable groups of a loosening of restrictions, it is important to accurately track the level of vaccination in Australia, as well as how vaccination uptake is distributed across key population groups. This will enable the targeting of interventions, as well as better understanding the impacts of easing certain restrictions.
2 Overview of the data and the remainder of the paper This paper provides the first detailed, publicly available analysis of the socioeconomic and attitudinal determinants of COVID-19 vaccination amongst both Australian adults and children. The analysis is based on the August 2021 wave of the ANUpoll series of surveys, which form part of the ANU Centre for Social Research and Methods’ COVID-19 Impact Monitoring survey. Respondents are taken from the Life in AustraliaTM panel, Australia’s only probability-based source of online and offline survey participants.
The August 2021 ANU COVID-19 impact monitoring survey collected data from 3,135 Australians aged 18 years and over. The data collection occurred between the 10th and the 23rd of August 2021 with 51.5 per cent of the eventual sample completing the survey on the 11th or 12th of August. The vast majority (95.9 per cent) of interviews were completed online with 4.1 per cent being completed over the phone. More detail on the survey is available in

Determinants of COVID-19 vaccination and views of parents about vaccination of children in Australia: August 2021
8 The ANU Centre for Social Research and Methods
Appendix 1), and the survey data is available for download through the Australian Data Archive (doi:10.80408/H6AQQE).
The August 2021 ANU COVID impact monitoring survey asked parents/carers of children about their views about the potential vaccination of their children. This, as far as we are aware, is the first large-scale survey on vaccine hesitancy/willingness in Australia focused on children. Such insights will become increasingly relevant as the vaccine roll-out extends to children.
There is of course other data being used in Australia on vaccine uptake. While data on a range of characteristics of individuals can be linked to the administrative data vaccination (vaccine registry data), the survey data allows a range of questions to be answered which cannot be addressed using administrative data.
First, the survey provides information on attitudes and behaviours in relation to COVID-19 including vaccine hesitancy and concerns about side effects. Second, the ANU COVID impact monitoring surveys provide longitudinal data, with information on the same group of individuals over multiple waves of data collection. This allows a range of analysis to be conducted. This includes an individual level analysis of changes in vaccine hesitancy, as well as information on attitudes and behaviours from prior to the vaccine roll-out and also from prior to the spread of COVID-19. This makes it substantially easier to control for reverse causality, whereby a person’s vaccination status might change their attitudes and behaviours, rather than the other way around.
While there are other surveys which provide information on views about COVID-19 vaccination, the ANU COVID impact monitoring survey has a larger sample than most other surveys, allowing for detailed breakdown in vaccination rates for small, policy-relevant sub-populations. Unlike non-probability or opt-in based panels which have large and unquantifiable biases, by using a probability-based panel it is possible to accurately estimate standard errors.
With this background in mind, the remainder of the paper is structured as follows. In the next section of the paper, we analyse adult vaccination rates in Australia, and how they vary by demographic and other characteristics. In Section 4 we look at self-reported vaccine hesitancy/willingness for adults, including a longitudinal analysis of change through time. In Section 5 we turn our focus to childhood vaccine hesitancy/willingness, with Section 6 providing some concluding comments.
3 Adult vaccination rates by demographic and other characteristics Respondents to the survey were asked whether they had received one or two COVID-19 vaccines at the time of interview (i.e., whether they were partially or fully vaccinated). According to the August 2021 ANUpoll, 57.2 per cent of the population aged 18 years or older had received at least one dose and 32.3 per cent were fully vaccinated. These vaccination rates are higher than the rate from the administrative vaccination data, which reports that at the start of the survey period (11 August 2021), 45.4 per cent of those aged 16 years older had received at least one dose of a vaccine and 23.7 per cent were fully vaccinated.8 By the end of the survey period administrative records suggested that 52.3 per cent of the 16+ population had received at least one dose and 30.0 per cent were fully vaccinated.9
The higher rate of vaccination estimated from ANUpoll is explained in part by the fact that ANUpoll does not include respondents aged 16 and 17 years, who have very low rates of vaccination but are included in the denominator for the national level estimates, and in part
Determinants of COVID-19 vaccination and views of parents about vaccination of children in Australia: August 2021
9 The ANU Centre for Social Research and Methods
by the increasing rate of vaccination over the interview period. It is also possible that people who participate in social surveys may be more likely to have been vaccinated than the population as a whole, although data is not available to test this. It should be noted that this analysis uses weights which benchmark to the Australian population.
Consistent with the administrative data, data from the August 2021 ANUpoll shows large differences in vaccination rates by age. According to the ANUpoll close to 90 per cent of those 65 years and over have received at least one vaccination, but only around one-third of those aged 18-34 years have received at least one vaccination. The August 2021 ANUpoll data indicates there is a slightly higher rate of vaccination for males compared to females, though this difference is not significantly different (p-value = 0.263).
3.1 Statistical modelling of factors associated with vaccine uptake – Model specification
In order to identify the individual characteristics associated with being vaccinated, a series of statistical models are estimated. In all of these models the dependent variable is whether the respondent has received at least one dose of a COVID-19 vaccine. Because the dependent variables takes one of two values (vaccinated versus unvaccinated) a binary probit model is estimated. The output of these five models are reported in Table 1.
In Model 1 the explanatory variables include demographic, socio-economic and geographic information. Model 2 adds to the explanatory variables included in Model 1, incorporating the respondent’s expected likelihood of being infected by COVID-19, anxiety and worry due to COVID-19, and a measure of psychological distress. Because people who have received a COVID-19 vaccine are likely to be less worried about COVID and therefore may have better mental health (i.e., there is a risk of reverse causation), the value of these variables from an earlier wave of data collection is used in the model (i.e., lagged values are used). Model 3 also includes the demographic and socioeconomic variables from Model 1, but also includes a set of variables measuring confidence in range of institutions.
Model 4 adds to the explanatory variables using responses to the question ‘How concerned are you that you would experience a side effect from a COVID-19 vaccination?’ as answered in April 2021. Because this question was asked in April 2021 only of respondents who had not been vaccinated at that time, the sample used to estimate Model 4 excludes those who had been vaccinated in April 2021.
Model 5 includes a set of pre-COVID characteristics. We include these variables because they are either unavailable in later waves, or because we expect that they have been severely impacted by COVID itself. Because this data linkage is over a longer time period, the sample size is reduced by a greater amount. We therefore keep the model reasonably parsimonious. Three key variables remain statistically significant in our final model.
3.2 Statistical modelling of factors associated with vaccine uptake – Results In order to assist with interpreting the magnitude of the association between the explanatory variable and vaccination uptake, we illustrate this using marginal effects which show the difference in the predicted probability of changing one variable only compared to the base case individual, using the base case characteristics which are described in the Table 1 note.
3.2.1 Demographic and socioeconomic characteristics The results from estimating Model 1 show that there are a range of demographic, socioeconomic and geographic factors associated with vaccine uptake (Table 1). The likelihood

Determinants of COVID-19 vaccination and views of parents about vaccination of children in Australia: August 2021
10 The ANU Centre for Social Research and Methods
of being vaccinated increases with age. Those who speak a language other than English at home were significantly and substantially less likely to have been vaccinated than those who speak English only. For someone with the base case characteristics, given underneath the table, the probability of being vaccinated is 48.9 per cent. For an otherwise identical person who speaks a language other than English, however, the probability is 10.7 percentage points lower.
There are no significant differences in the likelihood of being vaccinated between those born in Australia and those born overseas, or between those born in a non-English speaking country and those born in an English-speaking country. This suggests that it is the language a person speaks, rather than where they were born that matters. The lack of updated translated information on government health websites has been documented10 and this highlights the urgency in investing in up-to-date translations and promotion of this information through many information channels.
The other characteristic that has a substantial association with vaccine uptake is educational attainment. Those with a degree, and particularly those with a post-graduate degree were significantly more likely to have been vaccinated than those who had completed Year 12 only. For those with a postgraduate degree, the difference is equal to 22.8 percentage points, whereas for those with an undergraduate degree the difference is equal to 18.0 percentage points. There does not appear to be a large difference between those who had and who had not completed Year 12, nor is there any difference between those who had a Certificate III/IV or a Diploma and those without a qualification. This implies that it is university education rather than high school or other post-school qualifications that are highly associated with vaccination rates.
If the relative vaccination rates remain once Australia reaches the 70-80 per cent national vaccination rates, then non-English speaking Australians and those with relatively low levels of education are going to be at substantially increased risk of serious infection and mortality from COVID-19.
The differences across states and territories, and between cities and regional areas in the vaccination rates are reflected in the estimated association between geographic location and vaccination update. The results from Model 1 show that even after controlling for demographic and socio-economic characteristics, those who live in Sydney have the highest probability of having been vaccinated, followed by those who live in Melbourne, the other capital cities (Brisbane, Adelaide, Perth, Hobart, Darwin, and Canberra) and then those living in Victoria outside of Melbourne. Those who live in NSW outside of Sydney have the lowest probability of having been vaccinated, with those who live in other states outside of the capital cities also having a relatively low probability of being vaccinated. These patterns of vaccination rates are likely to reflect increased motivation of outbreaks in Sydney and Melbourne compared to regional areas and increased availability of Pfizer in areas of Sydney.
It is important to note that after controlling for other demographic and socio-economic characteristics, as well as geographic location, there is very little difference in vaccination rate by the socioeconomic status of the area in which a person lives, and none of the variables are statistically significant. There were also other variables that were also not statistically significant.
There was no difference in our model between Aboriginal and Torres Strait Islander Australians
Determinants of COVID-19 vaccination and views of parents about vaccination of children in Australia: August 2021
11 The ANU Centre for Social Research and Methods
in our sample compared to non-Indigenous Australians. Without controlling for other characteristics, there is a 3.5 percentage point difference, but this essentially disappears once other characteristics are controlled for. While it is true that the Life in AustraliaTM panel is not designed to allow analysis of the Indigenous population, and how it compares to the non-Indigenous population. However, this analysis gives some indication that any differences between Aboriginal and Torres Strait Islander Australians and the non-Indigenous population observed in other datasets may be due to other observable characteristics (in particular age, education, and location).
3.2.2 Attitudinal and behavioural variables The variables included in Model 1 are all available on administrative data systems, and in particular the linked data currently being analysed by researchers (a point we will return to in the concluding section). However, there are a range of other measures on the ANUpoll that could only be collected through surveys and these are the focus of the remainder of the models (Models 2-5 reported Table 1).
There is a complicated non-linear association between fear of infection and the likelihood of being vaccinated. This is demonstrated in Figure 3 without controlling for any other characteristics, but the same patterns hold in the econometric modelling. Setting the base case as those who think it not very likely that they will get infected (the most common category), those who think it not at all likely that they will be infected have a lower probability of having been vaccinated. This gives strong support for the view that some people have delayed getting vaccinated because they think it is not needed.
Although the difference is not statistically significant due to small sample sizes, those who think it very likely that they will be infected also have a lower probability of having been vaccinated. While the available data does not provide direct evidence on this, one possible explanation is that some people are fearful of being vaccinated and hence are not vaccinated, but because they are not vaccinated they are also more concerned about catching COVID.

Determinants of COVID-19 vaccination and views of parents about vaccination of children in Australia: August 2021
12 The ANU Centre for Social Research and Methods
Figure 3 Differences in vaccination rate by expected likelihood of infection as reported in April 2021
Source: ANUpoll, April, and August 2021.
Note: The ‘whiskers’ around the estimates represent the 95 per cent confidence intervals
There is also a strong association between anxiety and worry due to COVID-19 and vaccination, as well as between the K6 measure of psychological distress and vaccination. This difference is very large, with 62.0 per cent of those who in April 2021 who reported low levels of psychological distress having been vaccinated, compared to a vaccination rate of 42.4 per cent for the roughly one-in-ten Australians who were at risk of a serious mental illness. Mental health is clearly an important determinant of vaccine uptake.
A consistent finding from our previous analysis of vaccine hesitancy (Edwards et al. 2021) is that confidence in institutions has a strong association with vaccination. The estimates of the determinants of actual vaccine uptake using the August 2021 data shows that those who have a higher degree of confidence in state/territory governments have a statistically significant and substantially higher probability of having been vaccinated than with lower levels of confidence (Model 3). Confidence in none of the other institutions asked about in the survey is significantly associated with the likelihood of being vaccinated. This strongly suggests that, whatever the actual reality with regards to the roll-out of vaccines, it is the perceived effectiveness of state/territory governments that are going to influence vaccination rates. Putting this another way, those who want to see high rates of vaccination should be doing all they can to increase confidence in state/territory governments.
In April 2021 and in August 2021 those who had not then been vaccinated were asked ‘How concerned are you that you would experience a side effect from a COVID-19 vaccination?’ The most common response was slightly concerned, and we set this as our base category. Keeping in mind that in Model 4 we are not able to include those who had already been vaccinated in
53.7
62.9
58.7
40.6
0.0 10.0 20.0 30.0 40.0 50.0 60.0 70.0 80.0
Not at all l ikely
Not very likely
Somewhat likely
Very likely
Expe
cted
like
lihoo
d of
bei
ng in
fect
ed in
nex
t 6 m
onth
s (as
re
port
ed in
Apr
il 20
21)

Determinants of COVID-19 vaccination and views of parents about vaccination of children in Australia: August 2021
13 The ANU Centre for Social Research and Methods
April 2021, we find that those who were more concerned about side effects in April 2021 were less likely to have been vaccinated in August 2021. While this is perhaps not surprising, it is interesting to note that once these concerns about side effects are controlled for, there is no longer a significant association with speaking a language other than English and vaccination rates, and the size of the coefficient also declines substantially. If we exclude those who had already been vaccinated in April and don’t control for concerns about side effects, speaking a language other than English remains statistically significant, with a larger coefficient and a p-value of 0.01. This finding strongly suggests that one of the key factors that is influencing low vaccine uptake for those who speak a language other than English is concern about side effects. While there may be some benefits of making it easier for those who speak a language other than English to organise and attend vaccinations, this data suggests that without a targeted concurrent focus on reducing concerns about side effect for those who speak a language other than English, low rates of vaccination are likely to remain.
Concerns about side effects remain for those who in August 2021 had not yet been vaccinated. Exactly half of Australians who had not been vaccinated (50.0 per cent) were either very concerned (28.5 per cent) or moderately concerned (21.5 per cent). A further 36.9 per cent of Australians reported that they were slightly concerned, leaving only 13.1 per cent of Australians who were not at all concerned.
Household income as measured prior to the pandemic is strongly associated with vaccine uptake. This supports the conclusion from cross-sectional data that socioeconomic status is a strongly associated with uptake. People whose main occupation is as a professional (whether or not currently employed) have a higher probability of being vaccinated compared to people with another type of main occupation. Keeping in mind that we are controlling for education in the model, this shows that one of the key drivers of uptake up until now has been for people’s work. As the roll-out extends to the broader population in order to achieve population-level coverage, it will be important to ensure that all occupation groups see vaccination as important.
The final variable included in Model 5 is self-reported religiosity (measured on a scale of 0-10 with 10 indicating the highest level of religiosity). Holding constant the other characteristics included in the model, those who were more religious in February 2020 were less likely to be vaccinated in August 2021 than those who were less religious. This result strongly implies that those of any faith for whom their religion is important to them are more reluctant to get vaccinated, regardless of their education levels, income, or occupation. A vaccination campaign that is salient for the strongly religious is likely to assist in in meeting the COVID-19 vaccination rate targets. A critical feature of any campaign will be recruitment of religious leaders to advocate in their communities.11
4 Vaccine hesitancy, and the relationship with vaccination status The August 2020, and January, April and August 2021 COVID-19 impact monitoring surveys have asked respondents a version of the question ‘If a safe and effective vaccine to prevent COVID-19 were available to you now, would you…?’ with four response options. In August 2020 COVID-19 vaccines had not been approved and so the question at that time was hypothetical, whereas for the latter waves vaccines had been approved for use in Australia (though vaccines were not available for everyone). For the April and August 2021 waves the question was not asked of respondents who had been vaccinated.

Determinants of COVID-19 vaccination and views of parents about vaccination of children in Australia: August 2021
14 The ANU Centre for Social Research and Methods
In August 2021, 6.1 per cent of Australian adults who had not been vaccinated said that they definitely would not be vaccinated and 8.5 per cent said that they probably would not get vaccinated. The proportion who were vaccine hesitant was thus 14.6 per cent in August 2021. Not only is the vaccine hesitant group in August 2021 lower than the vaccine hesitant group in April 2021 when it was 17.1 per cent, because the vaccination rates have increased very substantially between April and August 2021, the vaccine hesitant are a much smaller proportion of the total population in August than they were in April.
When those who have been vaccinated are included in the denominator, in August 2021 93.9 per cent of Australians were either vaccinated, or said that they definitely or probably will get vaccinated once a safe and effective vaccine is available to them (Figure 4). While there has been some fluctuation in this measure over time, it is now far higher than it has been, at least since August 2020, with a low value for this measure observed in January 2021 (78.3 per cent) when vaccination had commenced in some countries, but the vaccines had not yet been approved in Australia.
Figure 4 Per cent of Australians who have been vaccinated or would probably/definitely get vaccinated
Source: ANUpoll, August 2020, and January, April, and August 2021.
Note: The ‘whiskers’ around the estimates represent the 95 per cent confidence intervals
It would appear that, at least as of August 2021, reaching the vaccination targets is not a matter of willingness/hesitancy, but a matter of time. The key challenge will be converting those who are willing to get vaccinated into actual vaccinations, the so-called intention-action or intention-behaviour gap (Sheeran and Webb 2016).
There is a strong correlation between vaccine willingness in April 2021 and vaccination rates in August 2021. However, while vaccine willingness/hesitancy is predictive, it is not deterministic. For those who had not been vaccinated in April but said that they would definitely get vaccinated once a safe and effective one was available to them, around three-quarters or 72.5 per cent had been vaccinated by August 2021. This declines to 46.0 per cent for those who in April 2021 said they probably would be vaccinated, 19.8 per cent of those
0
10
20
30
40
50
60
70
80
90
100
August 2020 January 2021 April 2021 August 2021
Per c
ent o
f Aus
tral
ians
who
hav
e be
en v
accin
ated
or w
ould
pr
obab
ly/d
efin
itely
get
vac
cinat
ed

Determinants of COVID-19 vaccination and views of parents about vaccination of children in Australia: August 2021
15 The ANU Centre for Social Research and Methods
who said they probably would not get vaccinated and 16.8 per cent of those who said that they definitely would not get vaccinated. While this shows that self-reported vaccine hesitancy is a predictive measure, it does also show that at least some of those who were vaccine hesitant or resistant end up getting vaccinated regardless. We can look at vaccine conversion for two groups – those who were broadly willing in April 2021 (probably or definitely would get vaccinated) and those who were broadly hesitant (probably or definitely would not get vaccinated). The transitions for these two groups are given in Figure 5a and Figure 5b respectively, and analysed in Table 2 using a regression model.
Figure 5a Transitions between vaccine willingness in April 2021 and vaccination/intentions in August 2021, those who were willing to get vaccinated when asked in April 2021
Source: ANUpoll, August 2020, and January, April, and August 2021.

Determinants of COVID-19 vaccination and views of parents about vaccination of children in Australia: August 2021
16 The ANU Centre for Social Research and Methods
Figure 5b Transitions between vaccine willingness in April 2021 and vaccination/intentions in August 2021, those who were hesitant to get vaccinated when asked in April 2021
Source: ANUpoll, August 2020, and January, April, and August 2021.
In order to understand these flows better, we model vaccine uptake in August 2021 separately for the vaccine hesitant and vaccine willing groups (as recorded in April 2021). Looking at the vaccine hesitant first, while the sample size is relatively small (337 observations), there are some characteristics that are statistically significant predictors of the probability of being vaccinated in August 2021 amongst those who were vaccine hesitant/resistant in April 2021 (what can be termed ‘hesitant converters’).
Australians aged 18 to 34 years who were less likely to be hesitant converters (compared to those aged 35 to 44 years), likely due to having lower levels of access to vaccines. Those aged 65 years and over were more likely to be vaccine converters. The coefficient for Aboriginal and Torres Strait Islander Australians is quite large and positive, but was not statistically significant due to the small sample size and large standard error. There were no significant differences by country of birth or language spoken at home.
Those who had a university degree, and particularly those with a post graduate degree were more likely to be ‘hesitant converters’. The biggest differences were, however, by geography. Those who live in Sydney were the most likely to have been vaccine converters, with 45.1 per cent of Sydneysiders who said they definitely or probably wouldn’t get vaccinated when asked in April having been vaccinated by August (this is an ‘unconditional’ estimate, but the patterns remain). This is likely due to the COVID-19 outbreak in Sydney.

Determinants of COVID-19 vaccination and views of parents about vaccination of children in Australia: August 2021
17 The ANU Centre for Social Research and Methods
We can also look at the factors associated with ‘willing converters.’ Here, the sample size is much larger (1,954), with a number of interesting patterns emerging. Females who were willing to be vaccinated in April 2021 are more likely to have been ‘willing convertors’, as were older Australians. This may reflect access issues and prioritisation for these groups, but it may reflect the general finding in the literature that these groups are less likely to suffer from intention-action gaps (Zarski et al. 2018).
In the other direction though, those who speak a language other than English (and who were willing to get vaccinated when asked in April 2021) were less likely to have been vaccinated by August 2021. Keeping in mind that the Language other than English group was less willing to start with in April 2021, the fact that this group appears to be more prone to the intention-action gap (or who potentially have barriers to access) implies a slightly different public policy targeting. It is not just about intentions for this group, but also supporting the conversion of these intentions into actions.
5 Childhood vaccination On the 27th of August it was announced that children in Australia between the age of 12 and 15 years would be able to book a COVID-19 Pfizer vaccine from 13th September 2021 (or perhaps more accurately, that parents/carers would be able to book on behalf of their children). At the time of writing, the World Health Organisation Strategic Advisory Group of Experts conclusion was that “..the Pfizer/BionTech vaccine is suitable for use by people aged 12 years and above”.12 Vaccinations have not been approved for children under the age of 12 in Australia, or in comparable countries (Li et al. 2021). However, trials are underway and/or soon to be completed for children younger than 12, and it is expected that for full population protection that vaccinations will need to be administered across the life course.
While the limited supply of the Pfizer vaccine (which is now approved for use in children 12-17 years) means that it is not generally available for children in this age range13, once supply of the approved vaccines increases, the extent to which children are vaccinated will depend on parent’s views about their children being vaccinated and for young adults, the views of the young person themselves.
The August 2021 ANU COVID impact monitoring survey asked adult respondents, for the first time, about each person in the household born from 2003 onwards (generally aged less than 18-years) ‘If a safe and effective vaccine to prevent COVID-19 were available to <NAME>, would you make the decision for them to…?’ with the same vaccine willingness/hesitancy options as when we asked about the respondent’s own decision making.
Responses were provided in relation to 1,368 children from 763 households. Across all parents/carers, respondents reported that for 42.5 per cent that they would definitely get their child vaccinated, 36.3 per cent would probably get their child vaccinated, 11.4 per cent would probably not get their child vaccinated and 9.8 per cent would definitely not get their child vaccinated. The distribution of these hesitancy/willingness rates are similar to those for adults when the vaccination program had not commenced (August 2020/January 2021 ANUpolls).
For children under 15 years, the proportion of parents responding that they would probably or definitely get their child vaccinated ranges from 71.7 per cent for children aged 0 to 4 years, 77.2 per cent for those aged 5 to 9 years and 76.6 per cent for those aged 10 to 14 (Figure 6). The proportion saying that they would get a child aged 15 to 18 years vaccinated was

Determinants of COVID-19 vaccination and views of parents about vaccination of children in Australia: August 2021
18 The ANU Centre for Social Research and Methods
substantially higher at 87.1 per cent. It should also be kept in mind that while older children will, in most cases, make their own decisions as to whether they get vaccinated, for many their parents’ views will be an important factor in their own COVID-19 vaccination decision.
Figure 6 Parent/carer views on childhood vaccination – by age, August 2021
Source: ANUpoll, August 2021.
Note: The ‘whiskers’ around the estimates represent the 95 per cent confidence intervals
There does not appear to be a relationship between parental vaccine willingness and the child’s sex, though there does appear to be a relationship with the respondent’s sex. Specifically, 75.1 per cent of children were reported to probably or definitely get a vaccine if the parent/carer was female, compared to 81.3 per cent if the parent/carer was male. The above results hold in an econometric model of childhood vaccination (Table 3), with a range of other characteristics also statistically significant.
Parents/carers who were aged 18 to 24, and those aged 45 years and over, were more willing for the child to get vaccinated (conditional on the child’s age). Those parents/carers who were Aboriginal or Torres Strait Islander were less willing than non-Indigenous parents/carers, with those who speak a language other than English also less willing for their child to be vaccinated.
Interestingly, there were no statistically significant differences between childhood vaccination willingness and whether or not the parent/carer had a degree. There were large differences by high school and other post-school qualifications though, with those who had a Certificate III/IV or Diploma less willing for the child to be vaccinated than those who had completed Year 12 only, and a lower willingness also for those who had not completed Year 12.
There was no relationship between the socioeconomic status of the area in which they lived and their own vaccination rates. However, vaccine willingness on behalf of children was lower in the most disadvantaged areas in Australia (although this difference was not statistically

Determinants of COVID-19 vaccination and views of parents about vaccination of children in Australia: August 2021
19 The ANU Centre for Social Research and Methods
significant). Controlling for area-level socioeconomic status, there were no differences in childhood vaccination willingness for those who lived in Sydney compared to the rest of NSW, but there was lower willingness in the rest of Australia.
In Model 2, we also include the natural log of household income as an additional explanatory variable. As income increases, the probability of having high vaccine willingness increases.
Not surprisingly, when we control for these characteristics of the child and the carer/parent, (Model 3) there is a strong relationship with the respondent’s own vaccine status/willingness. Those who have been vaccinated were no more or less willing to say their child will get vaccinated than those who hadn’t been vaccinated but said they definitely would be vaccinated if one was available. There are lower rates of willingness though as we move to parents who say they probably would, probably wouldn’t and definitely wouldn’t get vaccinated.
6 Concluding comments The only way in which Australia will be able to maintain a low rate of COVID-19 hospitalisation, and mortality and return to a more normal level of travel, social interaction, and government expenditure is through high vaccination rates. The Doherty Institute (2021) estimates that this will only be possible when 70 to 80 per cent of adults have been vaccinated. However, even this may not be sufficient if there are vulnerable population groups with low rates of vaccination, or if even more infectious/dangerous strains of the SARS-CoV-2 virus arrive in Australia.
This paper aims to support the achievement of these and even higher vaccination targets by providing for the first time, an analysis of the socioeconomic, attitudinal, and behavioural determinants of vaccination in Australia as of mid-August 2021, as well as views on vaccination for a representative sample of children in Australia.
We find important demographic and socioeconomic predictors of vaccine uptake. The most concerning findings are that vaccination rates are statistically significantly and substantially lower for those who have relatively low levels of education, those who speak a language other than English, those who live outside of NSW, and those who have low household income. If the relative vaccination rates remain once Australia reaches the 70-80 per cent national vaccination rates, then these groups are going to be at substantially increased risk of serious infection and mortality from COVID-19. Of these factors, the most easily addressed is the lower levels of vaccination for those who speak a language other than English, where better availability of translated information, with accurate information on side effects, should be routinely available.
Concerns about side effects remain important. There are also survey-specific predictors that are amenable to policy intervention or targeting. Some groups that may continue to have low rates of vaccination are those who have a low fear of infection; those experiencing psychological distress; those who have low confidence in state/territory governments; and those who report themselves as being very religious. It is harder to find these groups in the population, but messages could be constructed that are more salient for these groups.
Despite these important population groups, the survey data presented in this paper also shows an increased willingness amongst Australians to get vaccinated. Hesitancy has declined for those who haven’t been vaccinated, and 93.9 per cent of Australians are either now

Determinants of COVID-19 vaccination and views of parents about vaccination of children in Australia: August 2021
20 The ANU Centre for Social Research and Methods
vaccinated, or say that they definitely or probably will get vaccinated once a safe and effective vaccine is available.
In the not-too-distant future, the focus of the vaccine roll-out will turn to children. While the risk of COVID-19 is lower for young people, they are a key group that can spread infections to more vulnerable groups. There are some demographic groups who are more likely to say that they would not get their child vaccinated. This includes mothers/female carers, those who are Aboriginal and Torres Strait Islander, those who speak a language other than English, those with low education, and those who live in disadvantaged areas. Childhood vaccination will become a priority very soon and public health information campaigns will be important.
In order to achieve vaccination targets, policy needs to be based on all available evidence, and in addition to making registry data available for detailed analysis, it is important to keep investing in high quality surveys so we can track vaccination rates, as well as changing attitudes. Without this high-quality data, we will have more limited capacity to identify key population groups and effective targeting strategies to ensure that all individuals in Australia are adequately protected against COVID-19.

Determinants of COVID-19 vaccination and views of parents about vaccination of children in Australia: August 2021
21 The ANU Centre for Social Research and Methods
Appendix 1 About the survey The primary source of data for this paper is the August 2021 ANUpoll. Data collection commenced on the 10th of August 2021 with a pilot test of telephone respondents. The main data collection commenced on the 11th of August and concluded on the 23rd of August. The final sample size for the survey is 3,135 respondents. 52.0 per cent of the sample had completed the survey by the 12th of August and the average interview duration was 15.4 minutes. Of those who had completed the August 2021 survey, 86.7 per cent (N=2,717) had completed the April 2021 survey.
The Social Research Centre collected data online and through Computer Assisted Telephone Interviewing (CATI) in order to ensure representation from the offline Australian population. Around 4.1 per cent of interviews were collected via CATI. The contact methodology adopted for the online Life in Australia™ members is an initial survey invitation via email and SMS (where available), followed by multiple email reminders and a reminder SMS. Telephone non-response of panel members who have not yet completed the survey commenced in the second week of fieldwork and consisted of reminder calls encouraging completion of the online survey.
The contact methodology for offline Life in Australia™ members was an initial SMS (where available), followed by an extended call-cycle over a two-week period. A reminder SMS was also sent in the second week of fieldwork.
A total of 3,481 respondents were invited to take part in the survey, leading to a wave-specific completion rate of 90.1 per cent. Taking into account recruitment to the panel, the cumulative response rate for this survey is around 5.8 per cent.
Unless otherwise stated, data in the paper is weighted to population benchmarks. For Life in Australia™, the approach for deriving weights generally consists of the following steps:
1. Compute a base weight for each respondent as the product of two weights:
a. Their enrolment weight, accounting for the initial chances of selection and subsequent post-stratification to key demographic benchmarks
b. Their response propensity weight, estimated from enrolment information available for both respondents and non-respondents to the present wave.
2. Adjust the base weights so that they satisfy the latest population benchmarks for several demographic characteristics.
The ethical aspects of this research have been approved by the ANU Human Research Ethics Committee (2021/430).

Determinants of COVID-19 vaccination and views of parents about vaccination of children in Australia: August 2021
22 The ANU Centre for Social Research and Methods
Appendix 2 Regression tables

Determinants of COVID-19 vaccination and views of parents about vaccination of children in Australia: August 2021
23 The ANU Centre for Social Research and Methods
Table 1 Factors associated with having been vaccinated, August 2021 (continued over the page)
Explanatory variables Model 1 Model 2 Model 3 Model 4 Model 5 Coeff. Signif. Coeff. Signif. Coeff. Signif. Coeff. Signif. Coeff. Signif. Self-reported religiosity (February 2020) -0.010 ** Household income (natural log) (February 2020) 0.061 ** Occupation not a professional (February 2020) -0.077 ** Very concerned about side effects (April 2021) -0.036 Slightly concerned about side effects (April 2021) -0.206 *** Not at all concerned about side effects (April 2021) -0.380 *** Confident in the Federal Government -0.010 Confident in the Public Service 0.001 Confident in the State/Territory Government 0.121 *** Confident in Hospitals and the Health System 0.031 Confident in Police 0.046 Thinks not at all likely to be infected in next 6 months -0.074 ** Thinks not very likely to be infected in next 6 months -0.005 Thinks very likely to be infected in next 6 months -0.112 Anxious or worried due to COVID-19 0.068 ** Kessler-6 measure of psychological distress -0.010 *** Probability of base case 0.489 0.506 0.358 0.607 0.501 Sample size 3,012 2,599 2,595 2,293 1,901

Determinants of COVID-19 vaccination and views of parents about vaccination of children in Australia: August 2021
24 The ANU Centre for Social Research and Methods
Explanatory variables Model 1 Model 2 Model 3 Model 4 Model 5 Coeff. Signif. Coeff. Signif. Coeff. Signif. Coeff. Signif. Coeff. Signif. Female -0.004 0.000 0.005 0.038 0.032 Aged 18 to 24 years -0.076 -0.038 -0.014 -0.104 -0.066 Aged 25 to 34 years -0.129 *** -0.106 ** -0.100 ** -0.140 *** -0.136 *** Aged 45 to 54 years 0.232 *** 0.212 *** 0.234 *** 0.215 *** 0.248 *** Aged 55 to 64 years 0.345 *** 0.317 *** 0.367 *** 0.278 *** 0.363 *** Aged 65 to 74 years 0.422 *** 0.400 *** 0.486 *** 0.334 *** 0.435 *** Aged 75 years plus 0.436 *** 0.416 *** 0.508 *** 0.320 *** 0.446 *** Indigenous -0.011 -0.023 -0.014 0.030 0.056 Born overseas in a main English-speaking country -0.023 -0.045 -0.040 -0.056 -0.044 Born overseas in a non-English speaking country 0.038 0.009 0.006 0.048 0.082 Speaks a language other than English at home -0.107 ** -0.125 *** -0.103 ** -0.079 0.000 Has not completed Year 12 or post-school qualification -0.027 -0.027 0.000 0.008 -0.030 Has a post graduate degree 0.228 *** 0.248 *** 0.281 *** 0.210 *** 0.150 ** Has an undergraduate degree 0.180 *** 0.171 *** 0.190 *** 0.145 *** 0.110 ** Has a Certificate III/IV, Diploma or Associate Degree 0.010 0.001 0.022 0.028 0.015 Lives in the most disadvantaged areas (1st quintile) -0.007 0.013 0.011 0.000 0.029 Lives in next most disadvantaged areas (2nd quintile) 0.068 * 0.063 0.069 * 0.086 ** 0.062 Lives in next most advantaged areas (4th quintile) 0.017 0.016 0.016 0.012 0.004 Lives in the most advantaged areas (5th quintile) 0.050 0.070 0.073 * 0.058 0.116 ** Lives in non-capital city NSW -0.208 *** -0.220 *** -0.196 *** -0.258 *** -0.228 *** Lives in Melbourne -0.093 ** -0.121 *** -0.119 *** -0.114 ** -0.109 * Lives in non-capital city Victoria -0.153 *** -0.136 ** -0.125 ** -0.129 ** -0.167 ** Lives in another non-capital city -0.203 *** -0.233 *** -0.196 *** -0.274 *** -0.213 *** Lives in another capital city -0.144 *** -0.134 *** -0.127 *** -0.175 *** -0.129 ** Probability of base case 0.489 0.506 0.358 0.607 0.501 Sample size 3,012 2,599 2,595 2,293 1,901
Source: ANUpoll, April and August 2021 and Life in AustraliaTM, February 2020.
Notes: Probit Regression Model, with results presented as marginal effects, or the difference in probability compared to the base case. The base case individual for Model 1 is female; aged 35 to 44 years; non-Indigenous; born in Australia; does not speak a language other than English at home; has completed Year 12 but does not have a post-graduate degree; lives in neither an advantaged or disadvantaged suburb (third quintile); and lives in a capital city. Coefficients that are statistically significant at the 1 per cent level of significance are labelled ***; those significant at the 5 per cent level of significance are labelled **, and those significant at the 10 per cent level of significance are labelled *.

Determinants of COVID-19 vaccination and views of parents about vaccination of children in Australia: August 2021
25 The ANU Centre for Social Research and Methods
Table 2 Factors associated with having been vaccinated in August 2021, by willingness/hesitancy in April 2021
Explanatory variables Hesitant in April 2021 Willing in April 2021 Coeff. Signif. Coeff. Signif. Probably would get vaccinated (April 2021) -0.264 *** Definitely wouldn’t get vaccinated (April 2021) -0.104 Female -0.062 0.055 * Aged 18 to 34 years -0.222 ** -0.143 *** Aged 45 to 54 years 0.091 0.219 *** Aged 55 to 64 years 0.048 0.284 *** Aged 65 years plus 0.307 *** 0.328 *** Indigenous 0.250 -0.070 Born overseas in a main English-speaking country -0.069 -0.039 Born overseas in a non-English speaking country -0.152 0.057 Speaks a language other than English at home 0.026 -0.112 * Has not completed Year 12 or post-school qualification -0.006 0.046 Has a post graduate degree 0.265 * 0.198 *** Has an undergraduate degree 0.216 ** 0.136 *** Has a Certificate III/IV, Diploma or Associate Degree 0.071 0.013 Lives in the most disadvantaged areas (1st quintile) -0.076 0.026 Lives in next most disadvantaged areas (2nd quintile) 0.081 0.112 ** Lives in next most advantaged areas (4th quintile) -0.081 0.055 Lives in the most advantaged areas (5th quintile) 0.009 0.120 ** Lives in non-capital city NSW -0.309 ** -0.193 *** Lives in Melbourne -0.230 ** -0.088 Lives in non-capital city Victoria -0.189 -0.062 Lives in another non-capital city -0.334 *** -0.184 *** Lives in another capital city -0.335 *** -0.104 ** Probability of base case 0.448 0.571 Sample size 337 1,954
Source: ANUpoll, April and August 2021 and Life in AustraliaTM, February 2020.
Notes: Probit Regression Model, with results presented as marginal effects, or the difference in probability compared to the base case. The base case individual is female; aged 35 to 44 years; non-Indigenous; born in Australia; does not speak a language other than English at home; has completed Year 12 but does not have a post-graduate degree; lives in neither an advantaged or disadvantaged suburb (third quintile); and lives in a capital city. Coefficients that are statistically significant at the 1 per cent level of significance are labelled ***; those significant at the 5 per cent level of significance are labelled **, and those significant at the 10 per cent level of significance are labelled *.

Determinants of COVID-19 vaccination and views of parents about vaccination of children in Australia: August 2021
26 The ANU Centre for Social Research and Methods
Table 3 Factors associated with parent/carer saying that child would probably/definitely get vaccinated, August 2021
Explanatory variables Model 1 Model 2 Model 3 Coeff. Signif. Coeff. Signif. Coeff. Signif. Adult would definitely not get vaccinated -0.757 *** Adult would probably get vaccinated -0.680 *** Adult would probably get vaccinated -0.177 *** Adult would definitely get vaccinated -0.019 Household income (natural log) 0.046 *** 0.006 Child age 0.003 * 0.004 ** 0.003 *** Child female -0.024 -0.027 -0.002 Female -0.047 *** -0.043 * -0.008 Aged 18 to 24 years 0.075 *** 0.110 *** 0.037 ** Aged 25 to 34 years 0.016 0.025 0.009 Aged 45 years plus 0.028 * 0.038 * 0.004 Indigenous -0.139 ** -0.158 ** -0.041 Born overseas in a main English-speaking country 0.000 -0.010 -0.004 Born overseas in a non-English speaking country -0.009 0.006 -0.014 Speaks a language other than English at home -0.070 ** -0.095 ** -0.040 * Has not completed Year 12 or post-school qualification -0.084 ** -0.068 -0.024 Has a post graduate degree 0.018 -0.002 -0.040 Has an undergraduate degree -0.026 -0.057 -0.056 ** Has a Certificate III/IV, Diploma or Associate Degree -0.077 ** -0.100 ** -0.087 *** Lives in the most disadvantaged areas (1st quintile) -0.032 -0.030 -0.014 Lives in next most disadvantaged areas (2nd quintile) 0.010 0.020 -0.004 Lives in next most advantaged areas (4th quintile) 0.012 0.016 0.007 Lives in the most advantaged areas (5th quintile) 0.014 0.010 0.007 Lives in non-capital city NSW -0.009 -0.011 0.020 Lives in Melbourne -0.069 ** -0.079 * -0.011 Lives in non-capital city Victoria -0.081 ** -0.083 -0.029 Lives in another non-capital city -0.135 *** -0.143 *** -0.034 Lives in another capital city -0.105 *** -0.109 *** -0.030 * Probability of base case 0.922 0.885 0.960 Sample size 1,334 1,309 1,308
Source: ANUpoll, April and August 2021 and Life in AustraliaTM, February 2020.
Notes: Probit Regression Model, with results presented as marginal effects, or the difference in probability compared to the base case. The base case child is a boy, aged 0.The base case adult is female; aged 35 to 44 years; non-Indigenous; born in Australia; does not speak a language other than English at home; has completed Year 12 but does not have a post-graduate degree; lives in neither an advantaged or disadvantaged suburb (third quintile); and lives in a capital city. For Model 3, the base case has been vaccinated. Coefficients that are statistically significant at the 1 per cent level of significance are labelled ***; those significant at the 5 per cent level of significance are labelled **, and those significant at the 10 per cent level of significance are labelled *.

Determinants of COVID-19 vaccination and views of parents about vaccination of children in Australia: August 2021
27 The ANU Centre for Social Research and Methods

Determinants of COVID-19 vaccination and views of parents about vaccination of children in Australia: August 2021
28 The ANU Centre for Social Research and Methods
References Biddle, N., B. Edwards, M. Gray and K. Sollis (2021). “Change in vaccine willingness in
Australia: August 2020 to January 2021.” medRxiv preprint: doi: https://doi.org/10.1101/2021.02.17.21251957
Curiel, R.P. and H.G., Ramírez (2021). “Vaccination strategies against COVID-19 and the diffusion of anti-vaccination views.” Scientific Reports, 11(1): 1-13.
Doherty Institute (2021). Doherty Modelling Report for National Cabinet, The Doherty Institute, 30 July 2021. https://www.doherty.edu.au/uploads/content_doc/DohertyModelling_NationalPlan_and_Addendum_20210810.pdf [Accessed 9 September 2021]
Dubé E., M. Vivion and N.E. MacDonald (2015). “Vaccine hesitancy, vaccine refusal and the anti-vaccine movement: influence, impact and implications.” Expert Reviews Vaccines, 14(1): 100-117.
Edwards, B., N. Biddle, M. Gray and K. Sollis. (2021). “COVID-19 vaccine hesitancy and resistance: Correlates in a nationally representative longitudinal survey of the Australian population.” PLOS One, https://doi.org/10.1371/journal.pone.0248892
Germani, F. and N. Biller-Andorno (2021). “The anti-vaccination infodemic on social media: A behavioral analysis.” PloS one, 16(3), p.e0247642.
Gilbert, S. and C. Green (2021). Vaxxers: The Inside Story of the Oxford AstraZeneca Vaccine
and the Race Against the Virus. Hodder and Stoughton, London.
Hale, T., N. Angrist, R. Goldszmidt, R. et al. 2021. “A global panel database of pandemic policies (Oxford COVID-19 Government Response Tracker).” Nature Human
Behaviour, 5, 529-538 https://doi.org/10.1038/s41562-021-01079-8
Hamel, L. and M.Brodie (2021). KFF COVID-19 Vaccine Monitor: What we’ve learned. Kaiser Family Foundation. https://www.kff.org/coronavirus-covid-19/poll-finding/kff-covid-19-vaccine-monitor-what-weve-learned-april-2021/?utm_campaign=KFF-2021-The-Latest&utm_medium=email&_hsmi=121813674&_hsenc=p2ANqtz--SnAEgqfDplMBHLrwmai0S85AQw4_QIyM1N1GG8Co2YBRKi9G_IiGUQyX47BZyuwuVXKboPklrvtju3C8Vd0_AVMBUIg&utm_content=121813674&utm_source=hs_email
Hanly, M., T. Churches, O. Fitzgerald, C.R. McIntyre and L. Jorm (2021). “Vaccinating Australia: How long will it take?: medRxiv preprint: https://doi.org/10.1101/2021.02.02.21250979
Hanly, M.J., T. Churches, O. Fitzgerald, J.J. Post, C.R. MacIntyre and L. Jorm (2021). “The health system response to COVID-19 will continue long after we reach 80% vaccination coverage.” The Medical Journal of Australia, p.1.
Hippisley-Cox, J., M. Patone, X.W. Mei, D. Saatci, S. Dixon, K. Khunti, F. Zaccardi, P, Watkinson, M. Shankar-Hari, J. Doidge and D.A., Harrison (2021). “Risk of thrombocytopenia and thromboembolism after covid-19 vaccination and SARS-CoV-2 positive testing: self-controlled case series study.” British Medical Journal, 374.

Determinants of COVID-19 vaccination and views of parents about vaccination of children in Australia: August 2021
29 The ANU Centre for Social Research and Methods
Li, G., Finn, A., & Pollard, A. J. (2021). Should we be vaccinating children against COVID-19 in high-income countries? Expert Review of Vaccines, 1-4. doi:10.1080/14760584.2021.1951245
Lopez Bernal, J., Andrews, N., Gower, C., Robertson, C., Stowe, J., Tessier, E., . . . Ramsay, M. (2021). Effectiveness of the Pfizer-BioNTech and Oxford-AstraZeneca vaccines on covid-19 related symptoms, hospital admissions, and mortality in older adults in England: test negative case-control study. BMJ, 373, n1088. doi:10.1136/bmj.n1088
McBryde, E., Meehan, M., Caldwell, J., Adekunle, A., Ogunlade, S., Kuddus, A., . . . Cope, R. C. (2021). Modelling direct and herd protection effects of vaccination against the SARS-CoV-2 Delta variant in Australia. The Medical Journal of Australia. doi:10.5694/mja2.51263
Nicholas, J. (2021). “How Australia’s coronavirus vaccine rollout really compares with other countries.” The Guardian. 14 April 2021 https://www.theguardian.com/news/datablog/2021/apr/14/how-australias-coronavirus-vaccine-rollout-really-compares-with-other-countries
https://www.pewresearch.org/science/2021/03/05/growing-share-of-americans-say-they-plan-to-get-a-covid-19-vaccine-or-already-have/
Robertson, E.,K.S. Reeve, C.L. Niedzwiedz, J. Moore, M. Blake, M. Green, S.V. Katikireddi and M.J. Benezeval (2021). “Predictors of COVID-19 vaccine hesitancy in the UK household longitudinal study. Brain.” Behavior and Immunity, 94: 41-50. https://doi.org/10.1016/j.bbi.2021.03.008
Sheeran, P. and T.L. Webb (2016). “The intention–behavior gap.” Social and Personality
Psychology Compass, 10(9): 503-518.
Sherman, S.M., J. Sim,M. Cutts, H.Dasch, R. Amlot, G.J. Rubin, N, Sevdalis and L.E. Smith (2021). “COVID-19 vaccination acceptability in the UK at the start of the vaccination programme: a nationally representative cross-sectional survey (CoVAccS – wave 2).” medRxiv preprint. https://doi.org/10.1101/2021.04.06.21254973
Sherman, S.M., L.E. Smith, J. Sim, R. Amlot, M. Cutts, H. Dasch, G.J. Rubin, and N. Sevdalis (2020). “COVID-19 vaccination intention in the UK: Results from the ‘COVID-19 Vaccination Acceptability Study’ (CoVAccS), a nationally representative cross-sectional survey.” Human Vaccines & Immunotherapeutics, DOI: 10.1080/21645515.2020.1846397
Wu, Q., M.Z. Dudley, X. Chen, X. Bai, K. Dong, T. Zhuang, T., . . .and H. Yu (2021). “Evaluation of the safety profile of COVID-19 vaccines: a rapid review.” BMC Medicine, 19(1): 173. doi:10.1186/s12916-021-02059-5
Zarski, A.C., M. Berking, D. Reis, D. Lehr, C. Buntrock, R. Schwarzerand D.D. Ebert (2018). “Turning good intentions into actions by using the health action process approach to predict adherence to internet-based depression prevention: Secondary analysis of a randomized controlled Ttial. Journal of Medical Internet Research, 20(1), e9-e9. doi:10.2196/jmir.8814

Determinants of COVID-19 vaccination and views of parents about vaccination of children in Australia: August 2021
30 The ANU Centre for Social Research and Methods

Determinants of COVID-19 vaccination and views of parents about vaccination of children in Australia: August 2021
31 The ANU Centre for Social Research and Methods
Endnotes
1 https://www.health.gov.au/initiatives-and-programs/covid-19-vaccines/is-it-true/is-it-true-does-the-vaxzevria-astrazeneca-covid-19-vaccine-cause-blood-clots
2 https://www.abc.net.au/news/health/2020-04-17/coronavirus-vaccine-ian-frazer/12146616
3 https://www.theguardian.com/australia-news/2021/jul/01/australia-at-back-of-the-queue-for-pfizer-covid-vaccines-minister-admits
4 https://www.who.int/news-room/feature-stories/detail/lower-income-countries-and-indigenous-populations-receive-who-assistance-amid-the-ongoing-threat-of-covid-19
5 https://www.pm.gov.au/media/children-aged-12-15-years-now-eligible-covid-19-vaccine 6 https://www.ncirs.org.au/covid-19/covid-19-vaccines-frequently-asked-questions 7 A third vaccine, the Moderna vaccine is approved in Australia for people aged 12 years or
older and is expected to be available in Australia during September 2021. https://www.tga.gov.au/media-release/tga-provisional-approval-moderna-covid-19-vaccine-include-12-17-years-age-group
8 https://www.health.gov.au/sites/default/files/documents/2021/08/covid-19-vaccine-rollout-update-11-august-2021.pdf
9 https://www.health.gov.au/sites/default/files/documents/2021/08/covid-19-vaccine-rollout-update-jurisdictional-breakdown-22-august-2021.pdf
10 https://www.sbs.com.au/news/federal-government-scrambles-to-update-outdated-translated-covid-19-information/b4d58bf2-3f1c-481a-ac36-35234519ff11
11 https://www.who.int/news-room/feature-stories/detail/who-director-general-and-global-faith-leaders-high-level-dialogue-on-covid-19
12 https://www.who.int/news-room/q-a-detail/coronavirus-disease-(covid-19)-vaccines?topicsurvey=v8kj13)&gclid=Cj0KCQjw1dGJBhD4ARIsANb6Odl8Ncf8uc3COkV1Y22DGBveSl6ydTR4vPJlHrtImxaJPUJjb3qr0U8aArOuEALw_wcB
13 Unless the child meets one or more of a range of criteria that means they are eligible to receive the Pfizer vaccine.