Determinants and Effects of Non-Farm Enterprise ...econ.upm.edu.my/ijem/vol11no1/(10)-Paper 10...
18
Int. Journal of Economics and Management 11(1): 187 – 204 (2017) 187 IJEM International Journal of Economics and Management Journal homepage: http://www.econ.upm.edu.my/ijem SHEEHU ABDUL AZIZ a , SHAUFIQUE F. SIDIQUE bc* AND RUSMAWATI SAID b a Federal University Birnin Kebbi – Economics, Birnin Kebbi, Nigeria b Department of Economics, Faculty of Economics and Management, Universiti Putra Malaysia, Malaysia c Institute of Agricultural and Food Policy Studie, Universiti Putra Malaysia, Malaysia ABSTRACT This paper examines the determinants of non-farm enterprise (NFE) diversification decision among farm households in rural Nigeria and its effects on their economic wellbeing. By employing probit model, we find that NFE diversification decision significantly depends on household head’s education, household size, and community level infrastructures. The model also indicates that households residing closer to markets are more likely to diversify into NFE activities than those in remote areas. Unique to this study, we find that households having access to social and financial capital can overcome the entry barriers associated with NFE diversification. Propensity score matching technique was used to assess the impact of NFE diversification on household economic wellbeing, using annual total consumption expenditure and food shortage status of the household as indicators of economic wellbeing. The result reveals that NFE diversification has a significant positive impact on consumption expenditure and food availability. This suggests that NFE diversification could be a pathway for improving the economic wellbeing of farm households in rural areas of developing countries. Determinants and Effects of Non-Farm Enterprise Diversification on Household Economic Wellbeing in Rural Nigeria Article history: Received: 27 October 2016 Accepted: 02 April 2017 *Corresponding author: E-mail: shaufi[email protected] JEL Classification : D1, R2, I31 Keywords: Non-farm Enterprise Diversification; Farm Household; Economic Wellbeing ; Consumption Expenditure; Food Shortage.
Transcript of Determinants and Effects of Non-Farm Enterprise ...econ.upm.edu.my/ijem/vol11no1/(10)-Paper 10...

Int. Journal of Economics and Management 11(1): 187 – 204 (2017)
187
IJEMInternational Journal of Economics and Management
Journal homepage: http://www.econ.upm.edu.my/ijem
SHEEHU ABDUL AZIZa, SHAUFIQUE F. SIDIQUEbc* AND RUSMAWATI SAIDb
aFederal University Birnin Kebbi – Economics, Birnin Kebbi, NigeriabDepartment of Economics, Faculty of Economics and Management, Universiti
Putra Malaysia, MalaysiacInstitute of Agricultural and Food Policy Studie, Universiti Putra Malaysia,
Malaysia
ABSTRACT
This paper examines the determinants of non-farm enterprise (NFE) diversification decision among farm households in rural Nigeria and its effects on their economic wellbeing. By employing probit model, we find that NFE diversification decision significantly depends on household head’s education, household size, and community level infrastructures. The model also indicates that households residing closer to markets are more likely to diversify into NFE activities than those in remote areas. Unique to this study, we find that households having access to social and financial capital can overcome the entry barriers associated with NFE diversification. Propensity score matching technique was used to assess the impact of NFE diversification on household economic wellbeing, using annual total consumption expenditure and food shortage status of the household as indicators of economic wellbeing. The result reveals that NFE diversification has a significant positive impact on consumption expenditure and food availability. This suggests that NFE diversification could be a pathway for improving the economic wellbeing of farm households in rural areas of developing countries.
Determinants and Effects of Non-Farm Enterprise Diversification on Household Economic Wellbeing in Rural
Nigeria
Article history:Received: 27 October 2016 Accepted: 02 April 2017
*Corresponding author: E-mail: [email protected]
JEL Classification : D1, R2, I31
K e y w o r d s : N o n - f a r m E n t e r p r i s e Diversification; Farm Household; Economic Wellbeing ; Consumption Expenditure; Food Shortage.

Int. Journal of Economics and Management 11(1): 187 – 204 (2017)
188
INTRODUCTION
In recent years, studies on non-farm enterprises (NFEs) owned by rural households in Sub-Saharan Africa have attracted considerable attention in the rural development literature due to increasing inability of the farm sector to provide them with sustainable means of livelihood. Ellis (2000) argues that non-farm diversification is often a strategy that farm households use to moderate seasonal income variability and minimize the inherent risks associated with agriculture as a result of hostile agro-ecological factors.
The non-farm enterprise sector plays a vital role in enhancing the wellbeing of rural households as it provide them with income diversification opportunities that helps in slowing down rural-urban migration, reducing poverty, and improving food security status (Haggblade et al., 2007; Lanjouw, 2007; Ali and Peerlings, 2012). Evidence from the region suggests that non-farm sources accounts for 30−45 percent of rural households’ income (Reardon et al., 1992; Haggblade et al., 2007).
Despite mounting evidences on the potential contribution of NFEs to economic wellbeing of rural households in developing countries, factors influencing their decision to diversify into NFE activities are substantially left unexplored, specifically in Nigeria (Lanjouw and Lanjouw, 2001; Woldenhanna and Oskam, 2001; Loening et al., 2008). Stodies on the determinants have not yet taken into account the effect of access to mobile phone services and social capital on NFE diversification decision despite their importance to enterprenursship development. Most of the studies (Deininger and Olinto, 2001; Reardon et al., 2007; Babatunde and Qaim, 2009) focused on only the determinants of household decision to diversify into non-farm work, which makes it difficult to suggest policies that promote NFE diversification as a measure of improving the economic wellbeing of farm households in the region..
In addition, empirical studies on the possible impact of NFE diversification on economic wellbeing are quite scarce (Lanjouw, & Lanjouw, 2001; Holden et al, 2004; Liedhom et al. 2007). Studies on the impact of diversification on wellbeing focused mainly on households that diversify into non-farm work (Barret et al., 2001; Deininger and Olinto, 2001; Babatunde et al., 2010; Owusu et al., 2011). However, literature suggests that non-farm work is not the dominant source of income diversification in developing countries, especially in rural areas where the vast majority of the households are self-employed in family enterprises (Rijkers and Costa, 2012).
To address the current gaps, this study examines the determinants of NFE diversification and its effects on economic wellbeing of farm household, using a nation-wide survey data of Nigerian rural households. In this study, NFE diversification refers to the allocation of household production assets to all forms of owned businesses and self-employed economic activities that are undertaken in the non-farm sector of the economy. It is worthy to note that this study is limited to rural households that choose – either to specialize in farming or diversify into NFE activity as a means of sustaining their livelihood. The paper employs propensity matching technique to assess the impact of NFE diversification on household economic wellbeing. The advantage of matching method over other methods is that it takes care of self-selection bias that exist in the sample by matching diversified and undiversified households that share the same pre-diversification characteristics.
Int. Journal of Economics and Management 11(1): 187 – 204 (2017)
189
The outcome of this study had contributed to the growing literature on rural development by providing empirical evidence on the contribution of NFE diversification to economic wellbeing of farm households. In addition, the study would be of immense benefit to policy makers, development planners and other stakeholders who seek to promote rural development in African communities.
The rest of the paper is organized as follows. The next section provides an extended discussion on NFE diversification in rural Nigeria. Section three presents the paper’s conceptual framework. Section four describes the data and the methodology used in estimation of determinants of NFE diversification and its effects on household economic wellbeing. Section five discusses the empirical findings and the last section concludes.
NON FARM ENTERPRISE DIVERSIFICATION IN RURAL NIGERIA
Nigeria as a nation has a great potential for development in terms of human, material and natural resources. Despite this abundant resources, poverty is still widespread and continuously increasing in Nigeria (International Fund for Agricultural Development, 2009). The recent statistics of poverty reveals that out of 160 million Nigerians, more than 100 million people are classified as poor, and about 70% of the poor population resides in the rural areas (Nigerian Bureau of Statistics, 2012).
The incidence of poverty in Nigeria is extremely high in rural areas where up to 80 per cent of the population lived below the poverty line (World Bank, 2001). Abject poverty in the rural areas is attributable to the sole dependence of the population on subsistence farming as means of their livelihood where most people cultivates small piece of farm land and engage mainly in rain-fed farming. In support of this assertion, Fabusoro et al. (2010) reveal that farming is not a primary means of wealth generation or profit making for majority of rural households in Nigeria, but it serves as a food source for household consumption.
As farming alone does not provide most households in rural Nigeria with sufficient means of livelihood, The households tend to adopt NFE diversification as a strategy to smoothen their income throughout the farming and non-farming seasons. They engage in NFE activities in the off-farm season and return to farm work in the farming season. Majority of them take up NFE activities in small-scale local manufacturing, trading, building, mining, repair services and transportation services undertaken in the informal sector of the economy.
Non-farm income can be used to smoothen household consumption in case of food shortage. A study by the International Fund for Agricultural Development (IFAD, 2011) reaffirms that income from non-farm sector assists the small-farm households to become food secured, and also to improve their wellbeing. Igwe (2013) in his study of rural livelihood in eastern Nigeria finds that NFEs provide employment for the majority of young men and women, and family members in the post harvesting season.
Rural poverty reduction and wellbeing improvement efforts of successive governments in Nigeria has led to a series of collaborations and partnerships with relevant national and international development agencies aiming at promoting multiplicity of income sources through enhancement of households access to NFE activities. Meanwhile, the present Nigerian

Int. Journal of Economics and Management 11(1): 187 – 204 (2017)
190
government has included promotion of NFE activities as one of its poverty reduction strategies in its poverty alleviation program.
CONCEPTUAL FRAMEWORK
The conceptual framework for this study is a modified version of the Huffman and Lange (1989) model. In contrast to the adopted model, this model incorporates household time allocation decision for leisure, farming and NFE activity. The model has a single non-separable household utility function, and its optimization is subject to budget, time, production, and non-negativity constraints. The model captures farm households that are faced with two choices – either to continue with farming or diversify into NFE activity as a means of sustaining their livelihood.
The utility maximization function of each of the household is expressed as:
(1)
subject to:
(2)
(3)
(4)
(5)
(6)
Equation (1) represents household expected utility function U to be derived from farm and non farm enterprise activity; where C represents household consumption1 ; Tleis is the time household allocated for leisure; and Zn represents the vector of household head characteristics.
Equation (2) represents time constraint; where T is the household time endowment; Tfm, Tnfme and Tleis are the time allocated for farming, NFE activity and leisure respectively.
Equation (3) is the budget constraint. For this condition to hold, total household income must be equal to total household consumption expenditure. In the equation, represents the total income of the household; where (Pqfm - Kqfm)Qfm indicates net income from farming with Pqfm as the price per unit of farm output, Kqfm the cost per unit of farm output and Qfm represents the quantity of farm outputs produced by the household; (Pqfme - Kqfme)Qfme represents net income from NFE activity with being Pqfme the price per unit of NFE output, Kqfme the cost per unit of NFE output and Qfme represents the quantity of the NFE outputs; Yo represents exogenous income that the household generate from other sources.
Equation (4) is the farm production constraint; where Tfm represents time allocated for farming; Lfm refers to farm location characteristics ; Bfm are the barriers that household face in undertaking farming; σe represents the variation of farm output due to changes in weather condition; and Zfm are farm characteristics.
1 Household consumption takes account of all goods and services that are either produced or purchased for household consumption.

Int. Journal of Economics and Management 11(1): 187 – 204 (2017)
191
Equation (5) is the NFE production constraint; where Tnfme represents time allocated for NFE activity; Lnfme refers to specific characteristics of the location of NFE; Bnfme are the barriers that household face in undertaking NFE activity; and Znfme are the characteristics of NFE activity.
Equation (6) shows the non-negativity constraint on the time allocated to NFE activity. Where Tnfme denotes Time allocated for NFE activity. The equation captures household’s decision not to diversify into any form of NFE activity.
To derive the optimal solution of the model, substitute Equation 2-5 into the utility function assuming that utility function (U) and production function are quasi concave, continuous and twice differentiable
(7)
Differentiating of the expanded utility function with respect to Tfm, and Tfnme gives the following First Order Conditions (FOCs), which are prerequisite conditions that have to be satisfied for the maximasation of household utility:
(8)
(9)
(10)
The household optimal time allocation decision for leisure, farming and NFE activity is derived by solving the above FOCs:
(11)
The left hand side of equations (11–12) indicates the expected marginal utility of allocating
time for farm activity , while its right hand side represents the marginal utility of allocating time for leisure and NFE activity respectively. Since the time allocated for leisure and farming are assumed to be strictly positive, NFE diversification decision equation can be specified as follows:
(13)
implying that farm households with access to capital for investment or non-farm entrepreneurial

Int. Journal of Economics and Management 11(1): 187 – 204 (2017)
192
skills can choose to diversify into NFE activities if the expected marginal utility from farming is equal to the expected marginal utility from NFE activity. In contrast, if the expected marginal utility from diversifying into NFE activity is lower than the expected marginal utility from farming, the household will choose to continue relying on only farming as a means of livelihood.
DATA AND METHODOLOGY
Source of Data
Data for this study were obtained from the nationally representative General Household Survey (GHS- Panel) of Nigerian households conducted by the Nigerian Bureau of Statistics in collaboration with the World Bank in 2010-2011. The survey covered information on household enterprises, household consumption expenditure, and all other aspects of household living conditions. As this paper focused on rural Nigeria, we only utilize the rural sample of 3380 households. However, to take care of the outliers and maintain homogeneity, 20 observations with high consumption expenditure were removed from the sample leaving 3360 observations for the analysis.
Measurement of Variables
Non-farm diversification: Household responses on ownership of NFEs from the survey were used to capture NFE diversification decision. In the survey, farm households were asked if in the past 12 months do any member of the household has operated his or her own business, trading activity, or worked as a self-employed professional or craftsman. The response was used to construct a dummy variable for household diversification decision, which takes a value one if a household head responded that he or she owns any form of non-farm enterprise activity, and zero otherwise.
Household economic wellbeing: Economic wellbeing is measured by two indicators. The first one is annual household consumption expenditure, which is computed as the summation of all the expenditures that the household incurred for the provision of goods and services to household members in the past one year. This measure takes into account the market value of the food crops produced by the household for their personal consumption during the period, rental value of housing, non-food and durable good expenditures, gifts, and use value of durable goods. The second measure of economic wellbeing is related to the Food shortage experienced in the household. In the survey, household heads were asked whether in the past 12 month they have been faced with a situation where he or she cannot have enough food to feed the household. Based on the response, we construct a dummy variable that takes a value one if a household has experienced food shortage in the past one year and zero otherwise.
Household Characteristics: include sex, age, education and health status of the household head. Sex is coded as a dummy variable with value of one for male headed household and zero otherwise. The age of household head is measured in years. Education is measured in terms of
Int. Journal of Economics and Management 11(1): 187 – 204 (2017)
193
the years of education of the household head. Meanwhile, health status is a dummy variable taking the value of one if a household head is suffering from any form of health disability and zero otherwise.
Household Endowments: include household size and farm size. The variables are measured in terms of the total number of household members and size of cultivated land owned by the household respectively.
Community Level Infrastructures: entail access to electricity, public transportation, mobile phone services and market. With the exception of access to market, all the remaining community level infrastructures are coded as dummy variables with a value one if a household has access to such facilities and zero otherwise. Access to market is measured in terms of the distance of the household to the nearest product market (in kilometers).
Entry Barriers: include access to social capital and formal credit. Access to social capital is measured as a dummy variable taking the value of one if a household head is a member of any association and zero otherwise. Similarly access to formal credit is coded as a dummy variable with value one if a household has access to formal credit and zero otherwise.
Locational Factor: is measured by a dummy variable, which is assigned the value one if a household resides in northern Nigeria and zero otherwise.
Econometric Model: Determinants of NFE Diversification Decision
Probit model was used to examine the likelihood of the household to diversify into NFE activity. The model is specified as follows:
(14)
where Di is a dummy variable representing NFE diversification decision for household i, which takes a value of one, if a household head responded that either himself or herself or any member of the household has diversified into NFE activity and zero otherwise. β is a vector of maximum likelihood parameter estimates, and X is a vector of independent variables comprising of individual household level characteristics, household endowments, community level characteristics and entry barriers. The variables that captured individual household characteristics include sex, age, health status and years of education of household head; household endowments are denoted by farm size and family size of the household; community level characteristics are explained by access to electricity, mobile phone services, public transportation and access to market; and entry barriers are represented by household access to social capital and formal credit.

Int. Journal of Economics and Management 11(1): 187 – 204 (2017)
194
Econometric Model: NFE Diversification and Household Economic Wellbeing
Propensity score matching approach was used to assess the impact of NFE diversification on household economic wellbeing. The method compares the economic wellbeing of diversified households with that of undiversified households that have similar observable characteristics. In this study, diversified households are farm households that decide to diversify into NFE activities, while undiversified households are those that rely solely on farming as a means of livelihood. .
The propensity score P(Ti) is defined as the conditional probability of receiving a treatment given observable pre-diversification characteristics of the household, propensity score can be computed as:
(15)
Where Di is the indicator of NFE diversification; T denotes a vector of pre-diversification characteristics of household i; E is the expectation operator; and F(∙) represents normal cumulative distribution frequency. The propensity scores were predicted with probit model under the assumption of normal cumulative distribution. The assumption of the conditional independence of the score result extends the use of the propensity scores for the computation of the conditional treatment effect.
The predicted propensity scores provide the basis for matching households with the same observable characteristics. Hence, matching requirement has to be satisfied before computing the treatment/diversification effect. Becker and Ichino (2002) suggest that Average Treatment effect on the Treated (ATT) is the parameter of interest in propensity score matching analysis as it shows the actual gain from NFE diversification by comparing the economic wellbeing of diversified households with that of its counterfactual group of households that are closest in terms of their propensity scores. Therefore, ATT can be computed as follows:
ATT = E(T|1= 1) = E(Y(1)|D = 1) − E(Y(0)|D = 1) (16)
where E(Y(1)|D = 1) denotes the expected economic wellbeing outcome of diversified household; and E(Y(0)|D = 1) represents the counterfactual economic wellbeing of undiversified household, which indicates the probable economic wellbeing outcome of a diversified household if he/she had not diversified into NFE activity.
There are different matching techniques that have been suggested in the literature to match diversified and undiversified households of similar propensity scores. The commonly employed methods include radius or caliper, nearest neighbor, and kernel gaussian matching techniques. This study employs radius matching technique, which uses all of the comparison units within a pre-determined radius. The advantage of this method is that it uses as many comparison units available within the radius, thus allowing for the use of extra unit of observations when good matches are not available.

Int. Journal of Economics and Management 11(1): 187 – 204 (2017)
195
RESULTS AND DISCUSSIONS
Descriptive Statistics
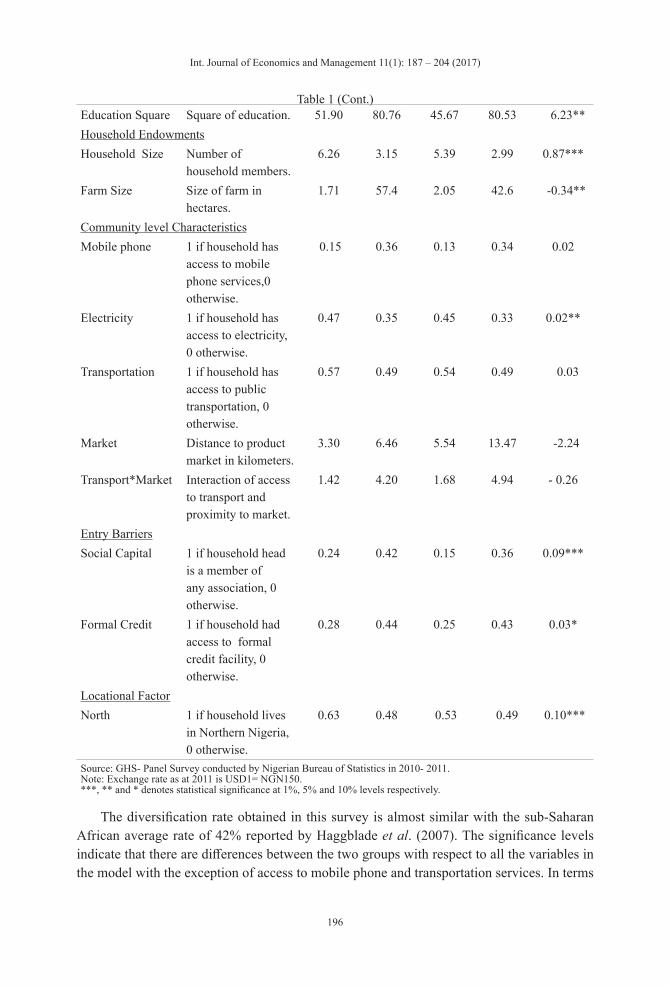
Table 1 presents the descriptive of the relevant variables used in the study or diversified and undiversified households and also their mean differences. The sample consists of 46% diversified households and 54% undiversified households that depend solely on farming as means of livelihood.
Table 1: Descriptive Statistics Diversified
(46%)Undiversified
(54% )
Variable Name Description Mean SD Mean SDDiff.in Means
Dependent variable NFE Diversification
1 if either the household head or any member of the household diversified into NFE activity, 0 otherwise.
Outcome VariablesConsumption Expenditure
Annual household consumption expenditure (in Naira).
408144 2728 329196 2386 78948***
Food Shortage 1 if household had experienced food shortage, 0 otherwise.
0.16 0.37 0.18 0.39 -0.02**
Independent VariablesHousehold CharacteristicsSex 1 if household head
is male,0 otherwise.0.89 0.31 0.85 0.36 0.04***
Age Age of household head.
48.0 14.29 50.0 16.30 - 2.00***
Age Square Square of age. 2596 1528 2862 1774 - 266***Health 1 if household head
has any form of health disability, 0 otherwise.
0.18 0.38 0.23 0.42 -0.05***
Education Years of formal education of household head.
4.67 5.49 3.97 5.47 0.70***
Int. Journal of Economics and Management 11(1): 187 – 204 (2017)
196
Education Square Square of education. 51.90 80.76 45.67 80.53 6.23**Household EndowmentsHousehold Size Number of
household members.6.26 3.15 5.39 2.99 0.87***
Farm Size Size of farm in hectares.
1.71 57.4 2.05 42.6 -0.34**
Community level CharacteristicsMobile phone 1 if household has
access to mobile phone services,0 otherwise.
0.15 0.36 0.13 0.34 0.02
Electricity 1 if household has access to electricity, 0 otherwise.
0.47 0.35 0.45 0.33 0.02**
Transportation 1 if household has access to public transportation, 0 otherwise.
0.57 0.49 0.54 0.49 0.03
Market Distance to product market in kilometers.
3.30 6.46 5.54 13.47 -2.24
Transport*Market Interaction of access to transport and proximity to market.
1.42 4.20 1.68 4.94 - 0.26
Entry BarriersSocial Capital 1 if household head
is a member of any association, 0 otherwise.
0.24 0.42 0.15 0.36 0.09***
Formal Credit 1 if household had access to formal credit facility, 0 otherwise.
0.28 0.44 0.25 0.43 0.03*
Locational FactorNorth 1 if household lives
in Northern Nigeria, 0 otherwise.
0.63 0.48 0.53 0.49 0.10***
Source: GHS- Panel Survey conducted by Nigerian Bureau of Statistics in 2010- 2011. Note: Exchange rate as at 2011 is USD1= NGN150. ***, ** and * denotes statistical significance at 1%, 5% and 10% levels respectively.
The diversification rate obtained in this survey is almost similar with the sub-Saharan African average rate of 42% reported by Haggblade et al. (2007). The significance levels indicate that there are differences between the two groups with respect to all the variables in the model with the exception of access to mobile phone and transportation services. In terms
Table 1 (Cont.)

Int. Journal of Economics and Management 11(1): 187 – 204 (2017)
197
of education, diversified households tend to have higher number of years of formal education than undiversified households. On the contrary, the farm size of undiversified households is higher than that of diversified households.
The percentage of diversified households having access to community level infrastructures and residing closer to market tends to be higher than that of undiversified households. However, the mean of access to formal credit for both groups reveals that rural households in Nigeria are experiencing low level of credit availability. This may be one of the possible reasons for low household participation level in NFE activities in rural Nigeria despite its potential contribution to wellbeing.The population of diversified households with access to social capital outweighs that of undiversified households and this indicates the importance social networking to NFE diversification. With regards to the outcome variables, the descriptive result indicates that the mean of consumption expenditure and food shortage status of diversified households is higher than that of undiversified households. However, we cannot rely on mean differences in assessing the impact of NFE diversification on household economic wellbeing as the comparison of the mean did not account for the differences between diversified and undiversified households. Thus, we use the propensity score matching technique to determine the actual effect of diversification on household wellbeing, as it takes care of the selection bias in the sample by matching diversified group with its counterfactual group that did not diversify.
Determinants of NFE Diversification Decision
The result of the probit regression for NFE diversification decision presented in Table 2 shows that the coefficients of almost all the variables in the model have significant effect on NFE diversification decision with the exception of farm size and access to formal credit. On gender perspective, female headed households are more likely to diversify into NFE activity than their male counterparts. This corroborates with the findings of Ali and Peerlings (2012) from Ethiopia.
Age of household head has a significant influence on NFE diversification decision. households with younger heads are more likely to diversify into NFE activities. On the contrary, households with ageing heads are less likely to diversify into NFE activities due to productivity decline associated with old age. The result is consistent with the findings of Abdullai and Crolerees (2001) in their study of households in Mali.. Predictably, the findings on health status of the households have shown that household heads having any form of health disability are less likely to be involved in NFE activities. This implies the importance of health to NFE activities.
The estimates on education show that the effects of formal education on NFE diversification decision are indeed non-linear. The effects are significantly positive up to a certain educational level and it becomes negative thereafter, as indicated by the square coefficient. The nonlinear effect of education on diversification decision is consistent with the finding of Loening et al. (2008) on NFE participation in rural Ethiopia.

Int. Journal of Economics and Management 11(1): 187 – 204 (2017)
198
Table 2: Probit Estimates of NFE Diversification Decision Dependent variable: NFE Diversification DecisionIndependent Variables Coefficients Marginal EffectsHousehold CharacteristicsSex -0.33***
(0.11)-0.12 (0.04)
Age 0.02** (0.01)
0.01 (0.01)
Age Square -0.01*** (0.01)
-0.01 (0.01)
Health -0.13** (0.05)
-0.05 (0.02)
Education 0.06*** (0.01)
0.02 (0.01)
Education Square -0.01*** (0.01)
-0.01 (0.01)
Household EndowmentsHousehold Size 0.03***
(0.01)0.01
(0.01)Farm Size -0.05
(0.04)-0.01 (0.01)
Community Level CharacteristicsMobile Phone 0.16**
(0.06)0.06
(0.02)Electricity 0.13**
(0.06)0.05
(0.02)Transport -0.11**
(0.05)-0.04 (0.02)
Market -0.02*** (0.01)
-0.01 (0.01)
Transport*Market 0.01* (0.01)
0.01 (0.01)
Entry BarriersSocial Capital 0.23***
(0.06)0.09
(0.02)Formal Credit 0.04**
(0.02)0.03
(0.01)Locational FactorNorth 0.23**
(0.05)0.08
(0.02)Number of Observations 3360Wald Chi Square 234***Pseudo R2 0.39Note: Robust standard errors are reported in parenthesis. ***, ** and * denotes statistical significance at 1%, 5% and 10% levels respectively.
Int. Journal of Economics and Management 11(1): 187 – 204 (2017)
199
Household size is another significant factor influencing NFE diversification decision. Households with larger family are more likely to be involved in NFE activities than households with smaller family. This finding is similar to Reardon et al. (1992) who reported that households with large family tends to incur higher expenditure, which intensifies their NFE diversification decision.
Households’ land size has the expected sign but is not significant. This result falls short of our expectation as we anticipated the coefficient to be negative and significant. Access to infrastructure plays an important role in determining diversification decision. Households with access to electricity and mobile phone services are more likely to diversify into NFE activities than those without access to such facilities.. However, transportation access only increases the likelihood of diversification for households living far from the market as indicated by the positive coefficient of the market and transport interaction variable. Similar studies suggest that access to transportation and electricity have significant positive impact on NFE activities in developing countries (Reardon et al., 1992; Lanjouw, 2001; Escobal, 2001; Ali and Peerling 2012).
Access to market is a very important factor influencing diversification decision. The result shows that households residing in communities near to market are more likely to diversify into NFE activities than those living in areas far from market. In support of this finding, Abdullai and Crolerees (2001) pointed out that households with access to market are in a better position to overcome market constraints and develop private market initiatives that promotes NFE diversification.
The result of entry barriers shows that households having access to social capital are more likely to diversify into NFE activities than those without access. This indicates the importance of membership of associations in overcoming the entry barriers associated with NFE diversification. Associations such as cooperatives provide loans, financial assistance and information to their members, thereby encouraging households’ participation in non-farm entrepreneurial activities. The coefficient of access to formal credit is positive and significant indicating the importance of formal credit to the development of non-farm enterprises in rural areas. In support of this finding, Abdulai and Crolerees, (2001) reveal that nonexistence of an effective formal credit market is one of the factors that affected development of NFE activities in developing countries.
Finally, locational factor is another key determinant of NFE diversification decision. Households residing in rural parts of northern Nigeria are more likely to diversify into NFE activities than their southern counterparts. The result confirms the differences in socio- economic characteristics and resource endowment of the north and south zones of rural Nigeria. This is also an expected finding given that the northern region usually experience rainfall for only three to four months in a year while the rainfall in the southern region is almost nine month in a year.
Impact of NFE Diversification on Household Economic Wellbeing
The propensity score estimates of the diversified and undiversified households within a region of common support were used to balance the observed distribution of the covariates across the

Int. Journal of Economics and Management 11(1): 187 – 204 (2017)
200
two groups in order to ensure that households with the same covariates have equal chances of being selected in assessing the impact of NFE diversification on household economic wellbeing.
The result of balancing test presented in Table 3 show that the balancing property has been satisfied in the estimated regression model, which implies that the distribution of the conditioning covariates did not differ across the diversified and comparison group in the matched sample. Column I and II of Table 3 are indicating the results of the chi-square test for joint significance of the covariates used in the regression model before and after matching. The chi-square test after the matching shows that the probability values of all the covariates in the regression model are not jointly significant. This confirms that there are no pre-treatment differences between the diversified and undiversified households in the sample, meaning that the self-selection bias has been removed and the matching requirement for the assessment of the impact of NFE diversification on household economic wellbeing has been satisfied.
Table 3: Balancing Test for Propensity Score Matching AnalysisI II III IV V
Independent Variables
p-valuea (Unmatched)
p-valuea (Matched)
Meanb Absolute
Bias (Unmatched)
Meanb Absolute
Bias (Matched)
Absolute Bias
Reduction
Household CharacteristicsSex 0.01 0.42 0.89 0.19 78.8Age 0.01 0.60 48.0 6.09 87.3Age Square 0.01 0.64 2596 244 90.6Health 0.01 0.93 0.18 0.01 97.5Education 0.01 0.84 4.67 0.26 94.4Education Square 0.02 0.70 51.9 0.45 82.4Household EndowmentsHousehold Size 0.01 0.56 6.26 0.45 92.7Farm size 0.01 0.45 4.31 0.62 85.5Community CharacteristicsMobile phone 0.17 0.43 0.15 0.08 40.7Electricity 0.01 0.77 0.22 0.01 77.5Transportation 0.14 0.83 0.57 0.08 85.2Market 0.01 0.90 3.30 0.03 98.8Transport*Market 0.19 0.79 1.42 0.22 84.2Entry BarriersSocial Capital 0.01 0.38 0.24 0.03 84.9Formal credit 0.07 0.57 0.27 0.08 67.5Locational factorNorth 0.01 0.91 0.63 0.01 98.0Note: ap-value of likelihood ratio test (Pr>x2)
Int. Journal of Economics and Management 11(1): 187 – 204 (2017)
201
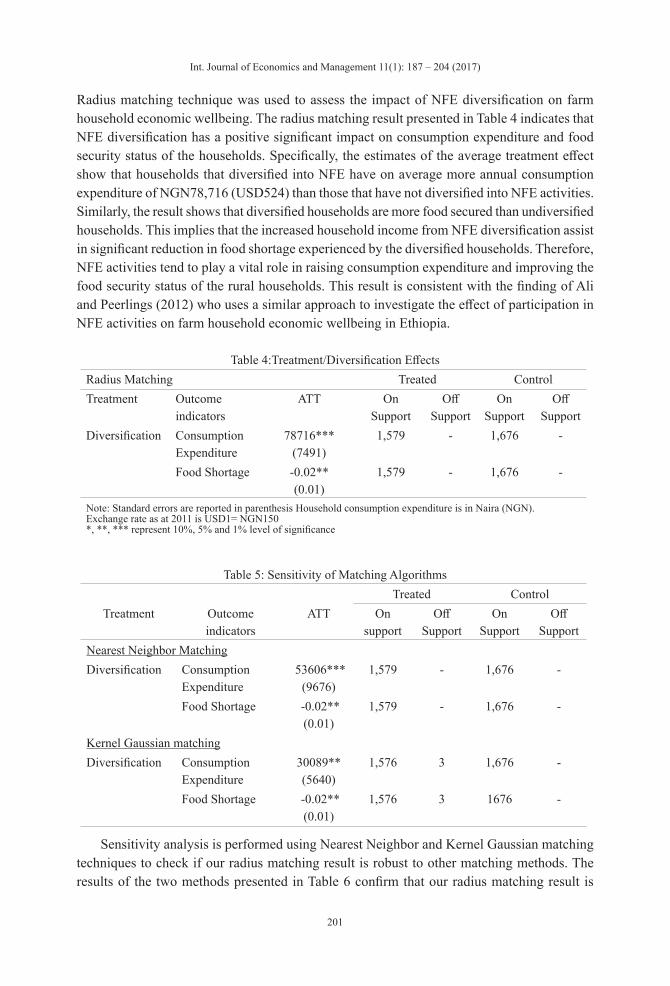
Radius matching technique was used to assess the impact of NFE diversification on farm household economic wellbeing. The radius matching result presented in Table 4 indicates that NFE diversification has a positive significant impact on consumption expenditure and food security status of the households. Specifically, the estimates of the average treatment effect show that households that diversified into NFE have on average more annual consumption expenditure of NGN78,716 (USD524) than those that have not diversified into NFE activities. Similarly, the result shows that diversified households are more food secured than undiversified households. This implies that the increased household income from NFE diversification assist in significant reduction in food shortage experienced by the diversified households. Therefore, NFE activities tend to play a vital role in raising consumption expenditure and improving the food security status of the rural households. This result is consistent with the finding of Ali and Peerlings (2012) who uses a similar approach to investigate the effect of participation in NFE activities on farm household economic wellbeing in Ethiopia.
Table 4:Treatment/Diversification EffectsRadius Matching Treated ControlTreatment Outcome
indicatorsATT On
SupportOff
SupportOn
SupportOff
SupportDiversification Consumption
Expenditure78716***
(7491)1,579 - 1,676 -
Food Shortage -0.02** (0.01)
1,579 - 1,676 -
Note: Standard errors are reported in parenthesis Household consumption expenditure is in Naira (NGN). Exchange rate as at 2011 is USD1= NGN150 *, **, *** represent 10%, 5% and 1% level of significance
Table 5: Sensitivity of Matching Algorithms Treated Control
Treatment Outcome indicators
ATT On support
Off Support
On Support
Off Support
Nearest Neighbor MatchingDiversification Consumption
Expenditure 53606***
(9676)1,579 - 1,676 -
Food Shortage -0.02** (0.01)
1,579 - 1,676 -
Kernel Gaussian matchingDiversification Consumption
Expenditure30089** (5640)
1,576 3 1,676 -
Food Shortage -0.02** (0.01)
1,576 3 1676 -
Sensitivity analysis is performed using Nearest Neighbor and Kernel Gaussian matching techniques to check if our radius matching result is robust to other matching methods. The results of the two methods presented in Table 6 confirm that our radius matching result is
Int. Journal of Economics and Management 11(1): 187 – 204 (2017)
202
quite robust and is not sensitive to other matching techniques.However , the radius outcome is slightly higher than that of other techniques.
CONCLUSION
This study uses the nationally representative survey data of rural households from Nigeria to examine the determinants of NFE diversification among the farm households and its effects on their economic wellbeing. The probit result shows that NFE diversification decision is determined by household head characteristics, household endowments, community level characteristics and entry barriers. Gender, marital status, age, health status and educational attainment of the individual household heads are found to have significant impact on diversification decision. Household size as one of the endowments of rural household has a significant positive impact on NFEs activities. Similarly, infrastructure at the community level have an important influence on NFE diversification. The results also indicate that households residing closer to local markets are more likely to diversify into NFEs than their counterparts in remote areas. The unique finding of this study of is that rural households having access to social and financial capital have managed to overcome the barriers associated with entry into NFE activities. This is an interesting finding which has not been given much attention in previous studies and portrays the importance of social networking and loans in promoting NFE activities in rural Nigeria.
The second part of the study employs propensity score matching technique to assess the impacts of NFE diversification on farm household economic wellbeing by using total annual consumption expenditure and food shortage status of the households as indicators of economic wellbeing. The result shows that NFE diversification has a positive significant impact on the total annual consumption expenditure and food availability in the household. This finding is consistent with the widely held view in the literature that income from NFE activities plays a vital role to smoothen household consumption and in improving food security status.
Given the roles that NFE diversification can play in improving the economic wellbeing of farm households, it is obvious that agriculture alone cannot bring the rapid changes needed in lifting households out of poverty and food shortage in rural areas of sub Saharan Africa. Thus, policies seeking to address food insecurity in this region should go beyond just food production measures. They should also consider enhancing the ability of farm households to diversify into NFE activities. Hence, this can be facilitated by increasing households’ access to formal credit by introducing rural banking scheme with simple collateral requirement. Associations such as cooperatives, women associations and business associations should be encouraged among the rural households as they promote NFE activities. Rural households should also be equipped with basic formal education by introducing programs such as free basic education and adult education in rural areas. The significance of community level infrastructures suggest that the role of government in providing the necessary infrastructures to rural communities is essential in promoting NFE diversification in developing countries. Although we find that NFE diversification has positive effects on consumption expenditure and food security status of the farm households, we cannot conclude whether it is the poor or the non-poor that benefits from NFE diversification. Thus, further research is still needed to fill this gap.

Int. Journal of Economics and Management 11(1): 187 – 204 (2017)
203
REFERENCES
Abdulai, A. and Crolerees, A. (2001), "Determinants of income diversification amongst rural households in Southern Mali", Food Policy, Vol. 26, pp. 437–452.
Abdulai, A. and Delgado, C. L. (1999), "Determinants of non-farm earnings of farm-based husbands and wives in Northern Ghana", American Journal of Agricultural Economics, Vol. 81, pp. 117–130.
Ali, M. and Peerlings, J. (2012), "Farm households and non-farm activities in Ethiopia : does clustering influence entry and exit ?", Agricultural Economics, Vol. 43, pp. 253–266.
Babatunde, R. O. and Qaim , M . (2009), "Patterns of income diversification in rural Nigeria : determinants and impacts", Quarterly Journal of International Agriculture, Vol. 48, pp. 305–320.
Babatunde, R. O. and Qaim, M. (2010), "Impact of off-farm income on food security and nutrition in Nigeria", Food Policy, Vol. 35, pp. 303–311.
Barret, C.B., Reardon, T. and Webb, P. (2001), "Non-farm income diversification and household livelihood strategies in rural Africa: concepts, dynamics, and policy implications", Food Policy, Vol. 26, pp. 315–331.
Becker, S. O. and Ichino, A. (2002), "Estimation of average treatment effects based on propensity scores", The Stata Journal, Vol. 2, pp. 358–377.
Deininger, K. and Olinto, P. (2001), "Rural non-farm employment and income diversification in Colombia", World Development, Vol. 29, pp. 455–465.
Ellis, F. (2000), "The determinants of rural livelihood diversification in developing countries", Journal of Agricultural Economics Vol. 51, pp. 289–302.
Escobal, J. (2001), "The determinants of non-farm income diversification in rural Peru", World Development, Vol. 29, pp. 497–508.
Fabusoro, E., Omotayo A. M., Apantaku, S. O. and Okuneye, P. A. (2010), "Forms and Determinants of Rural Livelihoods Diversification in Ogun State, Nigeria", Journal of Sustainable Agriculture, 34:4, 417 – 438
Haggblade, S., Hazell, P. and Reardon, T. (2007), "Transforming the Rural Non-Farm Economy: Opportunities and Threats in the Developing World", International Food Policy Research Institute, Baltimore: Johns Hopkins University Press, USA.
Haggblade, S., Hazell, P. and Reardon, T. (2010), "The rural non-farm economy: prospects for growth and poverty reduction" World Development, Vol. 38, pp. 1429–1441.
Huffman, W. E. and Lange, M. D. (1989), "Off-farm work decisions of husbands and wives : joint decision making" The Review of Economics and Statistics, Vol. 71, pp. 471–480.
IFAD (2009), "Federal Republic of Nigeria, Country Programme Evaluation Report. No. 1959-NG", International Fund for Agricultural Development.
IFAD (2011), "Non-Farm Opportunities from Smallholder Agriculture", Conference on New Directions. ://www.ifad.org/events/agriculture/doc/papers/non-farm.pdf.
Igwe, P.A (2013), "Rural Non-farm Livelihood Diversification and Poverty Reduction in Nigeria", Ph.D. Thesis, Business School , Plymouth University United Kingdom.

Int. Journal of Economics and Management 11(1): 187 – 204 (2017)
204
Lanjouw, P. (2007), "Does the Rural Non-Farm Economy Contribute to Poverty Reduction", In T. Haggblade, S., Hazell, P.B.R., Reardon (Ed.), Transforming the rural non-farm economy: Opportunities and threats in the Developing World. International Food Policy Research Institute. Baltimore: Johns Hopkins University Press, USA.
Lanjouw, J.O. and Lanjouw, P. (2001), "The rural non-farm sector issues and evidences", Agricultural Economics, Vol. 26, pp. 1–23.
Loening, J., Rijkers, B. and Soderbom, M. (2008), "Non-farm microenterprise performance and the investment climate : Evidence from rural Ethiopia", Policy Research Working Paper 4577. The World Bank.
National Bureau of Statistics (2012), "Nigerian General Household Survey: Basic Information Document", Abuja Nigeria.
Owusu, V., Abdulai, A. and Abdul-rahman, S. (2011), "Non-farm work and food security among farm households in northern Ghana", Food Policy, Vol. 36, pp. 108–118.
Reardon, T. (1997), "Using evidence of household income diversification to inform study of the rural non-farm labor market in Africa", World Development, Vol. 25, pp. 735–747.
Reardon, T., Delgado, T.C. and Malton, P. (1992), "Determinants and effects of income diversification among farm households in BurkinaFaso" Journal of Development studies, Vol. 289, pp. 264–296.
Rijkers, B. and Costa, R. (2012), "Gender and rural non-farm entrepreneurship", World Development, Vol. 40, pp. 2411–2426.
Rosenbaum, P. R. and Rubin, D. B. (1985), "Constructing a control matched group using multivariate samplingmethodsthat incorporate propensity score" The American Statistician, Vol. 39, pp. 33–38.
Woldenhanna, T. and Oskam, A. (2001), "Income diversification and entry barriers : evidence from Tigrayregion of northern Ethiopia", Food Policy, Vol. 26, pp. 351–365.
World Bank (2001), "World Development Indicators", Washington DC: World Bank