Detection systems part 2. 1Introduction 2Theoretical background Biochemistry/molecular biology...
103
Detection systems part 2
-
Upload
dominick-hilburn -
Category
Documents
-
view
215 -
download
1
Transcript of Detection systems part 2. 1Introduction 2Theoretical background Biochemistry/molecular biology...

Detection systems
part 2

1 Introduction
2 Theoretical background Biochemistry/molecular biology
3 Theoretical background computer science
4 History of the field
5 Splicing systems
6 P systems
7 Hairpins
8 Detection techniques
9 Micro technology introduction
10 Microchips and fluidics
11 Self assembly
12 Regulatory networks
13 Molecular motors
14 DNA nanowires
15 Protein computers
16 DNA computing - summery
17 Presentation of essay and discussion
Course outline

Scale

SEM and TEM

electrons scatter when they pass
through thin sections of a specimen
transmitted electrons (those that do
not scatter) are used to produce
image
denser regions in specimen, scatter
more electrons and appear darker
Electron microscope

Transmission electron microscope

Transmission electron microscope

Provides a view of the internal structure of a
cell
Only very thin section of a specimen (about
100nm) can be studied
Magnification is 10000-100000X
Has a resolution 1000X better than light
microscope
Resolution is about 0.5 nm
transmitted electrons (those that do not
scatter) are used to produce image
denser regions in specimen, scatter more
electrons and appear darker
Transmission electron microscope

Transmission electron microscope

Transmission electron microscope

TEM of a plant cell

TEM of outer shell of tumour spheroid

No sectioning is required
Magnification is 100-10000X
Resolving power is about 20nm
produces a 3-dimensional image of
specimen’s surface features
Uses electrons as the source of
illumination, instead of light
Scanning electron microscope

Scanning electron microscope

Scanning electron microscope

Scanning electron microscope

Contrast
Incident Electron Beam
Contrast formation

Ribosome

SEM of tumour spheroid

Scanning electron microscope

Fly head


STM and AFM

OpticalMicroscope
SEM SPM
Sample operatingenvironment
AmbientLiquidvacuum
vacuum AmbientLiquidVacuum
Depth of field small large MediumDepth of focus medium small smallResolution: x,y 1 m 5 nm 0.1-3.0 nmResolution: z N/A N/A 0.01 nmMagnification range 1X -2 x 103X 10X - 106X 5 x 102 - 108XSample preparationrequired
little Freeze drying,coating
None
Characteristicsrequired of sample
Sample must not becompletelytransparent to lightwavelength used
Surface must notbuild up charge andsample must bevacuum compartible
Sample must notexcessive variationssurface height
from http://www.di.com/
Characteristics of common techniques for
imaging and measuring surface morphology
Scanning probe microscopes

Contact Mode AFM
TappingMode™ AFM
Non-contact Mode AFM
Force Modulation
Lateral Force Microscopy
(LFM)
Scanning Thermal
Microscopy
Magnetic Force
Microscopy (MFM)
LiftMode
Phase Imaging
Scanning Capacitance
Microscopy
Electric Force
Microscopy (EFM)
Nanoindenting/Scratching
(IMHO)
Scanning Tunneling
Microscopy (STM)
Lithography
Scanning techniques

Type
Properties used for scanning
Resolution Used for
STM
Tunneling Current between sample and probe
Vertical resolution < 1 Å*Lateral resolution ~ 10 Å
=> Conductors=> Solids
SP
Surface profile Vertical resolution ~ 10 Å*Lateral resolution ~ 1000 Å
Conductors, insulators, semiconductors=> solids
AFM Force between probe tip and sample surface (Interatomic or electromagnetic force)
Vertical resolution < 1 Å*Lateral resolution ~ 10 Å
=> Conductors, insulators, semiconductor => liquid layers, liquid crystals and solids surfaces
MFM
Magnetic force Vertical resolution ~ 1 Å*Lateral resolution ~ 10 Å
=> Magnetic materials
SCM
Capacitance developed in the presence of tip near sample surface
Vertical resolution ~ 2 Å*Lateral resolution ~ 5000 Å
=> Conductors=> Solids
Scanning probe microscopes

using scanning probe microscopes it is
possible to image and manipulate matter on
the nanometer scale
under ideal conditions its is possible to
image and manipulate individuals atoms and
molecules
this offers the prospect of important new
insights in to the material world
this offers the prospect of important new
products and processes
Scanning probe microscopes

using a scanning tunneling microscope it is
possible to image individual nickel atoms
Scanning tunneling microscopes

it is also possible to manipulate individual
iron atoms on a copper surface
Scanning tunneling microscopes

Iron on copper Carbon monoxide on platinum
Scanning tunneling microscopes
it is also possible to have some fun

Xenon on nickel
Scanning tunneling microscopes
it is also possible to have some fun

With an atomic force microscope it is
possible to image the carbon atoms of a
carbon tube.
Atomic force microscope

Or manipulate carbon tubes.
Atomic force microscope

Or have some fun again.
Atomic force microscope

the scanning tunnelling microscope (STM) is
widely used to obtain atomically resolved images
of metal and other conducting surfaces
this is very useful for characterizing surface
roughness, observing surface defects, and
determining the size and conformation of
aggregates of atoms and molecules on a surface
increasingly STM is used to manipulate atoms and
molecules on a surface
Roher and Binnig won the Nobel Prize in 1986 for
their work in developing STM
Scanning probe microscopes

a conducting tip is held close
to the surface
electrons tunnel between the
tip and the surface, producing
an electrical signal
the tip is extremely sharp,
being formed by one single atom
it slowly scans across the
surface at a distance of only
an atom's diameter
Scanning probe microscopes

the tip is raised and lowered
in order to keep the signal
constant and maintain the
distance
this enables it to follow
even the smallest details of
the surface it is scanning
by recording the vertical
movement of the tip it is
possible to study the
structure of the surface atom
by atom
Scanning probe microscopes

a profile of the surface is
created
from that a computer-
generated contour map of the
surface is produced
limited to use with
conducting substrates
this limitation was addressed
by atomic force microscopy
Logic gate
Scanning probe microscopes

G. Binnig, Ch. Gerber and C.F. Quate, Phys. Rev. Lett. 56, 930 (1986)
First atomic force microscope

Atomic force microscope

the atomic force microscope (AFM) is widely used
to obtain atomically resolved images of non-metal
and other non-conducting surfaces
this is very useful for characterizing chemical
and biological samples
increasingly AFM is used to manipulate
macromolecules and cells on a surface
Bennig, Quate and Geber are credited with
developing AFM and have received many major
awards
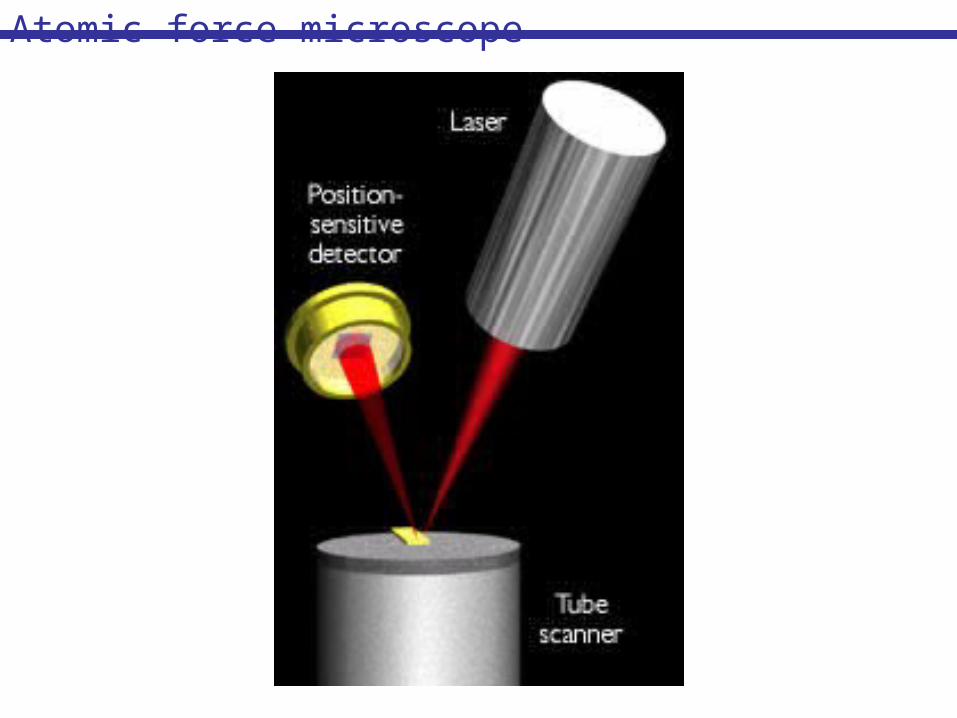
Atomic force microscope

an AFM works by scanning a ceramic tip over a
surface
the tip is positioned at the end of a cantilever
arm shaped like a diving board
the tip is repelled by or attracted to the surface
and the cantilever arm deflected
the deflection is measured by a laser that
reflects at an oblique angle from the very end of
the cantilever
Atomic force microscope

Atomic force microscope
Atomic force microscope

Atomic force microscope

Micofabricated cantilever beams and probe
tips for AFM.
Atomic force microscope

Atomic force microscope

Contact mode imaging (left) is heavily influenced by frictional
and adhesive forces which can damage samples and distort image
data.
Non-contact imaging (center) generally provides low resolution
and can also be hampered by the contaminant layer which can
interfere with oscillation.
TappingMode imaging (right) eliminates frictional forces by
intermittently contacting the surface and oscillating with
sufficient amplitude to prevent the tip from being trapped by
adhesive meniscus forces from the contaminant layer.
Scanning modes in AFM

Atomic force microscope

a plot of the laser
deflection versus tip
position on the sample
surface provides the
resolution of the hills and
valleys that constitute the
surface
the AFM can work with the tip
touching the sample (contact
mode), or the tip can tap
across the surface (tapping
mode) much like the cane of a
blind person.
proteins
bone cell
Atomic force microscope

the NanoPen was developed by Chad Mirkin over
the past few years
a nanopatterning technique in which an AFM tip
is used to deliver molecules to a surface via a
solvent meniscus, which naturally forms in the
ambient atmosphere
NanoPen

nanopatterning of a growing number of molecular
and biomolecular ‘inks’ on a variety of metal,
semiconductor and insulator surfaces.
NanoPen

NanoPen
numerous applications are foreseen

an AFM tip has been used to dissect a human
chromosome to remove a specific gene
NanoScalpel

an AFM tip has been used to dissect a plant to
remove a specific protein
NanoScalpel

Experiment - AFM forcespectroscopy
Anselmetti, Smith et. al. Single Mol. 1 (2000) 1, 53-58
Nature - DNA replication,polymerization
DNA unwinding

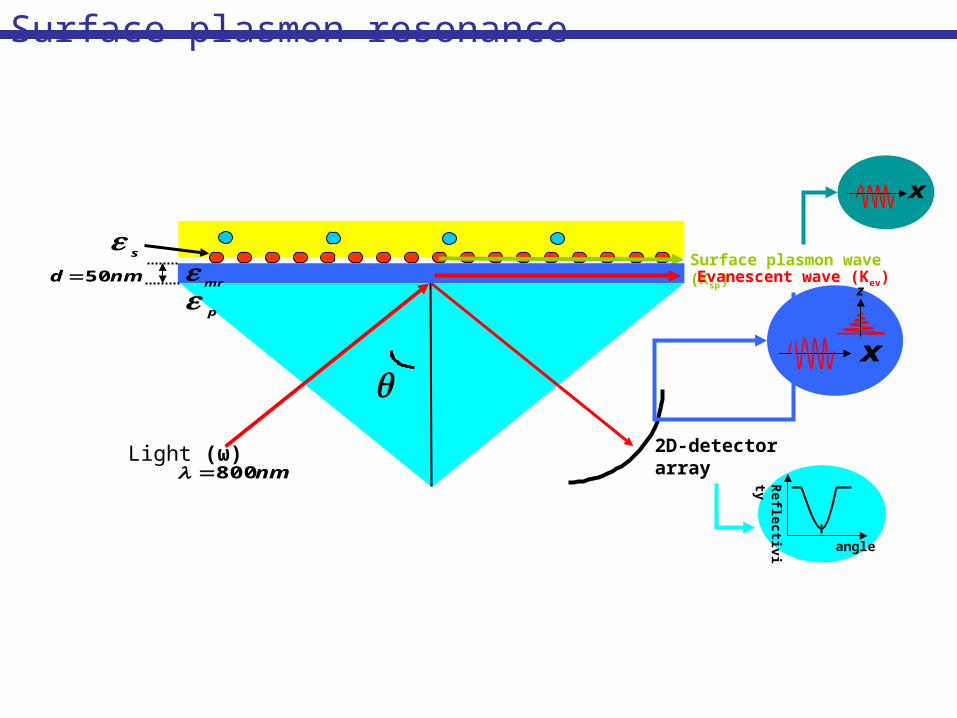
Surface Plasmon Resonance
angle
Reflectiv
ity
Light (ω) 2D-detectorarray
p
nm800
x
Surface plasmon wave (Ksp)s
nmd 50 Evanescent wave (Kev)
z
x
mr
Surface plasmon resonance

*
*
sin
sin
2
2
pmr
pmr
s
ssn
smr
smrsp cK
*sin
pev cKCondition of
Resonance =:
Theory of surface plasmon resonance

50 55 60 65 70 750
20
40
60
80
100
120
140
160
Inte
nsi
ty o
f lig
ht [W
]
Angle [degrees]
Water Methanol Ethanol Hexane
Surface plasmon resonance

SPR angle Reflective index
Methanol 63 o 1.329
Water 66 o 1.34
Ethanol 67 o 1.363
Hexane 69 o 1.375
Surface plasmon resonance

(1) bare gold (2) immobilization (3) hybridization
SPR on biochips
(1) (2) (3)
SPR Resonance Angle

Bryce P. Nelson, Anal. Chem. 2001, 73,1-7
Imaging SPR on biochips

http://www.gwcinstruments.com/
Imaging SPR on biochips

Robert M. Corn, Langmuir 2001, 17, 2502-2507
Imaging SPR on biochips

angle
intensity
SPR immuno sensor

(i) anti-progesterone
(ii) anti-testosterone
(iii) anti-mouse Fc
SPR immuno sensor

Resonance Unit (RU): 1000 RU
SPR angle: 0.1 degree
Mass change : 1ng/mm2
RI Change : 0.001
SPR binding kinetics: sensorgram

BIAcore SPR

BIAcore SPR

Ellipsometry

Allows us to probe the surface structure of
materials.
Makes use of Maxwell’s equations to
interpret data by Drude Approximation
Is often relatively insensitive to
calibration uncertainties.
Ellipsometry

Accuracies to the Angstrom
Can be used in-situ (as a film grows)
Typically used in thin film applications
Ellipsometry
html://www.phys.ksu.edu/~allbaugh/ellipsometry

Polarized light is reflected at an oblique
angle to a surface
The change to or from a generally elliptical
polarization is measured.
From these measurements, the complex index of
refraction and/or the thickness of the material
can be obtained.
Methodology

Determine ρ = Rp/Rs (complex)
Find ρ indirectly by measuring the shape of the
ellipse
Determine how e varies as a function of depth,
and thickness L of transition layer.
Theory

sincostantan ier
r i
s
p
Theory

Choose the polarizer orientation such that the relative
phase shift from Reflection is just cancelled by the phase
shift from the retarder.
We know that the relative phase shifts have cancelled if we
can null the signal with the analyzer
Null-ellipsometer

Applications

Application

Modified glass surface;
pattern biotin and avidin in perpendicular direction
use BSA to block the spacesavidin
biotin
Application

Gel electrophoresis

Electrophoresis is a technique used to
separate and sometimes purify macromolecules
that differ in charge, conformation or size.
Proteins and nucleic acids are mainly
concerned by that technique which is one of
the most used in molecular biology and
biochemistry (i.e. isozymes)
Electrophoresis

When charged molecules are placed in an
electric field, they migrate toward either the
positive (anode) or negative (cathode) pole
according to their charge.
Proteins can have either a net positive or net
negative charge (i.e. cathodic or anodic
peroxidases).
Nucleic acids have a constent negative charge
imparted by their phosphate.
Electrophoresis

Electrophoresis

Proteins and nucleic acids are electrophoresed
within a matrix or "gel". Commonly, the gel is
a thin slab, with wells for loading the sample.
Each extremity is in contact with an
electrophoresis buffer or the whole gel is
immersed within.
Ions present in the buffer carry the current
and maintain the pH at a relatively constant
value.
Electrophoresis

For proteins or nucleic acid separation the gel itself
is mainly composed of either agarose or polyacrylamid.
Gels

Agarose gels are extremely easy to prepare:
agarose powder is simply mix with buffer
solution, melted by heating, and poured.
Agarose is a polysaccharide extracted from
seaweed (non-toxic). The higher the agarose
concentration, the higher the resolution.
Low melting point agarose melts at about 65 C.
It is used to excised and purify fragments of
double-stranded DNA.
Agarose gels

Agarose gels have a large
range of separation but
relatively low resolving
power. By varying the
concentration of agarose
(from 4 to 0.5 %), fragments
of DNA, from 100 to 50,000
bp, can be separated using
standard techniques with a
resolution of a few bp.
Agarose gels

EtBr is a fluorescent dye that intercalates between
bases of nucleic acids and detection of DNA fragments
in gels.
It can be incorporated into agarose gels, or added to
DNA samples before loading to enable visualization of
the fragments within the gel, or present in a tank
were the gel is immersed after run and before
observation.
This last technique is the recommend because as might
be expected, binding of EtBr to DNA alters its mass
and rigidity, and therefore its mobility.
Ethidium bromide

Polyacrylamide is a cross-linked polymer of
acrylamide
The length of the polymer chains is dictated by the
concentration of acrylamid used, which is typically
between 3.5 and 20%.
Because oxygen inhibits the polymerization process,
they must be poured between glass plates (or
cylinders).
Polyacrylamide gels are significantly more annoying
to prepare than agarose gels.
Acrylamide gels

Acrylamide is a potent neurotoxin.
Disposable gloves when handling solutions
of acrylamide, and a mask when weighing
powder must be used.
Polyacrylamide is considered to be non-
toxic, but polyacrylamide gels should also
be handled with gloves due to the possible
presence of free acrylamide.
Acrylamide gels

Acrylamide gels have high resolutive power but
a relatively low range of separation.
Denaturing or not denaturing gel can be used.
First one are more resolutive, fragments of
DNA from 1 to a few hundred bp can be
separated with a resolution of 1bp. (Details
will be exposed during practical training)
Acrylamide gels

Gel electrophoresis

Gel electrophoresis

PCR

PCR is used to amplify (copy) specific DNA sequences in
a complex mixture when the ends of the sequence are
known
Source DNA is denatured into single strands
Two synthetic oligonucleotides complementary to the 3’
ends of the segment of interest are added in great
excess to the denatured DNA, then the temperature is
lowered
The genomic DNA remains denatured, because the
complementary strands are at too low a concentration to
encounter each other during the period of incubation,
but the specific oligonucleotides hybridize with their
complementary sequences in the genomic DNA
Polymerase chain reaction (PCR)

The hybridized oligos then serve as primers for DNA
synthesis, which begins upon addition of a supply of
nucleotides and a temperature resistant polymerase
such as Taq polymerase, from Thermus aquaticus (a
bacterium that lives in hot springs)
Taq polymerase extends the primers at temperatures
up to 72˚C
When synthesis is complete, the whole mixture is
heated further (to 95˚C) to melt the newly formed
duplexes
Repeated cycles (25—30) of synthesis (cooling) and
melting (heating) quickly provide many DNA copies
Polymerase chain reaction (PCR)

Polymerase chain reaction (PCR)