
Detection of Urban Damage Using Remote Sensing and … · Detection of Urban Damage Using Remote...
41
Detection of Urban Damage Using Remote Sensing and Machine Learning Algorithms: Revisiting the 2010 Haiti Earthquake Austin Jeffrey Cooner Thesis submitted to the faculty of the Virginia Polytechnic Institute and State University in partial fulfillment of the requirements for the degree of Master of Science In Geography Yang Shao (Chair) James B. Campbell Stephen P. Prisley November, 7 2016 Blacksburg, VA Keywords: earthquake damage, machine learning, computer vision, Random Forests, neural networks This work is licensed under a Creative Commons Attribution 4.0 International License.
Transcript of Detection of Urban Damage Using Remote Sensing and … · Detection of Urban Damage Using Remote...
Detection of Urban Damage Using Remote Sensing and Machine Learning Algorithms:
Revisiting the 2010 Haiti Earthquake
Austin Jeffrey Cooner
Thesis submitted to the faculty of the Virginia Polytechnic Institute and State University in
partial fulfillment of the requirements for the degree of
Master of Science
In
Geography
Yang Shao (Chair)
James B. Campbell
Stephen P. Prisley
November, 7 2016
Blacksburg, VA
Keywords: earthquake damage, machine learning, computer vision, Random Forests, neural
networks
This work is licensed under a Creative Commons Attribution 4.0 International License.
Detection of Urban Damage Using Remote Sensing and Machine Learning Algorithms:
Revisiting the 2010 Haiti Earthquake
Austin J. Cooner
(ACADEMIC ABSTRACT)
Remote sensing continues to be an invaluable tool in earthquake damage assessments and
emergency response. This study evaluates the effectiveness of multilayer feedforward neural
networks, radial basis neural networks, and Random Forests in detecting earthquake damage
caused by the 2010 Port-au-Prince, Haiti 7.0 moment magnitude (Mw) event. Additionally,
textural and structural features including entropy, dissimilarity, Laplacian of Gaussian, and
rectangular fit are investigated as key variables for high spatial resolution imagery classification.
Our findings show that each of the algorithms achieved nearly a 90% kernel density match using
the United Nations Operational Satellite Applications Programme (UNITAR/UNOSAT) dataset
as validation. The multilayer feedforward network was able to achieve an error rate below 40%
in detecting damaged buildings. Spatial features of texture and structure were far more important
in algorithmic classification than spectral information, highlighting the potential for future
implementation of machine learning algorithms which use panchromatic or pansharpened
imagery alone.

iii
Detection of Urban Damage Using Remote Sensing and Machine Learning Algorithms:
Revisiting the 2010 Haiti Earthquake
Austin J. Cooner
(PUBLIC ABSTRACT)
Satellite imagery can help emergency managers to better respond to the aftermath of
deadly earthquakes. This study evaluates the effectiveness of machine learning algorithms in
detecting earthquake damage caused by the 2010 Port-au-Prince, Haiti event. Additionally,
textural and structural features of high resolution black and white imagery are investigated as key
variables for damage classification. We found that each of the algorithms achieved nearly a 90%
wide area damage density match using the United Nations Operational Satellite Applications
Programme (UNITAR/UNOSAT) dataset as validation. The most effective algorithm achieved
an error rate below 40% in detecting damaged buildings. Spatial features of texture and structure
were far more important in classification than spectral information, highlighting the potential for
future implementation of machine learning algorithms which use panchromatic or pansharpened
imagery alone. This would reduce data requirements and allow response resources to be
allocated over space quicker and more efficiently.

iv
ACKNOWLEDGMENTS
I would like to thank my chair and committee: Dr. Yang Shao, Dr. James Campbell and
Dr. Stephen Prisley for their support and direction in the study; without their guidance I would
not have been able to complete this study. Also, I extend gratitude to the peer-reviewers and for
their time and helpful comments and suggestions for the version of this thesis published in
Remote Sensing. I would also like to thank Chris McCormick for his excellent tutorial on
RBFNN and corresponding software which was modified for use here. I would like to thank the
DigitalGlobe Foundation for their critical support in providing Quickbird imagery and the
Virginia Tech Open Access Subvention Fund for supporting the publication of this thesis.
Finally, I would like to thank Earl and Marion Nutter; without their entrusted scholarship this
study and my attendance at Virginia Tech would not be possible. The views expressed in this
document are those of the author and do not reflect the official policy or position of the United
States Air Force, Department of Defense, or the United States Government.

v
TABLE OF CONTENTS
ABSTRACT……………………………………………………………………………….……...ii ACKNOWLEDGMENTS………………………………………………………………………..iii TABLE OF CONTENTS…………………………………………………………………………iv LIST OF TABLES AND FIGURES……………………………………………………………...v PREFACE………………………………………………………………………………………...vi
MANUSCRIPT TITLE……………………………………………………………………………1
INTRODUCTION………………………………………………………………………………...2
MATERIALS AND METHODS………………………………………………………………….7 Study Area and Data Texture and Structure Machine Learning Algorithms Neural Networks Random Forests Testing and Accuracy Assessment
RESULTS…..……………………………………………………………………………………17 Building-by-Building Wide Area Generalizability Variable Importance
DISCUSSION……………………………………………………………………………………22
CONCLUSION…………………………………………………………………………………..27
WORKS CITED…………………………………………………………………………………29 APPENDIX A…………………………………………………………………………………....33 APPENDIX B……………………………………………………………………………………34
vi
LIST OF TABLES AND FIGURES
Table 1: Data used for the analysis..................................................................................................8 Table 2: Input features...................................................................................................................13 Table 3: Algorithmic results..........................................................................................................17
Figure 1: Study area.........................................................................................................................9 Figure 2: Pre- and post-earthquake feature comparison................................................................11 Figure 3: Neural network layout....................................................................................................14 Figure 4: ANN building-by-building results..................................................................................18 Figure 5: ANN kernel density results............................................................................................19 Figure 6: RBFNN error of commission example...........................................................................20 Figure 7: RBFNN error of omission example................................................................................20 Figure 8: Variable importance.......................................................................................................21
vii
PREFACE
The body of this work was published in Remote Sensing Volume 8, Issue 10 with Yang
Shao and James B. Campbell as coauthors. Austin Cooner (thesis author and corresponding
author of manuscript) designed the experiment, coded the software, and wrote the manuscript.
James Campbell provided direction and edited the manuscript. Yang Shao offered oversight,
guidance, and edited the manuscript. Manuscript was published under a Creative Commons (BY
4.0) license, and all satellite images were used in accordance with the EULAs provided by
DigitalGlobe.
1
Detection of Urban Damage Using Remote Sensing and Machine Learning
Algorithms: Revisiting the 2010 Haiti Earthquake
published in Remote Sensing 8(10), 2016
2
INTRODUCTION
Earthquakes accounted for over 60% of all natural disaster-related deaths from 2001-
2011 — a danger that will likely increase due to rapid global urbanization [1]. Immediately after
an earthquake occurs, satellite imagery is a critical component of damage mapping. Hussain et
al. noted that “information derived from remote sensing data greatly helps the authorities in
rescue and relief efforts, damage assessment, and the planning of remedial measures to safeguard
such events effectively” [2] (p. 1011). For immediate rescue operations, rapid damage maps
derived from satellite imagery must be developed quickly. A study of the 1995 Kobe earthquake
in Japan showed a drastic reduction of total rescued and proportion of survivors after the third
day of recovery efforts [3, 4]. However, because rapid mapping is required to balance immediacy
with in-depth analysis, early mapping efforts often yield coarse damage assessments [5].
Remote sensing has been used widely to map the effects of major disasters such as
earthquakes. Numerous studies have utilized electro-optical (EO), synthetic aperture radar
(SAR), light detection and ranging (LiDAR), ancillary data or a combination thereof for post-
earthquake damage detection [1, 5, 6]. One technique for damage detection involves fusion of
SAR and EO data in pixel-based damage detection. Stramondo et al. used a maximum likelihood
(ML) classifier on SAR features derived from the European Remote Sensing mission in
combination with EO data provided by the Indian Remote Sensing satellite in order to identify
damaged structures following the 1999 Izmit, Turkey earthquake [7]. A similar approach
combined SAR from COSMO/SkyMed mission and VHR EO data from the Quickbird satellite
to improve damage detection at block level after combining the two datasets in a pixel-based
classification following the 2009 L’Aquila earthquake [8].

3
As early as 1998, object-based image analysis (OBIA) has been used to detect earthquake
damage from remote sensing [9]. More recently, OBIA has been a continual focus in earthquake
detection damage with many studies focusing on the use of unmanned aerial systems (UAS),
LiDAR, and the popular image segmentation and classification software eCognition. Hussain et
al. [2] fused GeoEye-1 VHR EO data and airborne LiDAR elevation models derived from the
RIT-ImageCAT UAS for image segmentation using the Definiens (now eCognition) software
suite. The data were classified using nearest neighbor and fuzzy membership sets to detect
damaged buildings and rubble following the 2010 Haiti earthquake. Similarly, Pham et al. [6]
used aerial VHR RGB composite and LiDAR data (also from the RIT-ImageCAT UAS) along
with eCognition for object segmentation and damage detection.
The application of machine learning algorithms (MLAs) to earthquake damage detection
is a relatively new area of study. MLAs actively adapt and learn the problem at hand, often
mimicking natural or biological systems, instead of relying on statistical assumptions about data
distribution [10]. In addition to overall improved accuracy [11, 12], MLAs have several
advantages compared to traditional classification and change detection methods. MLAs work
with nonlinear datasets [11, 13], learn from limited training data [12, 14], and successfully solve
difficult-to-distinguish classification problems [15].
Ito et al. [16] used learning vector quantization (LVQ), a type of artificial neural network
(ANN) to classify SAR features signifying damage after the 1995 Kobe earthquake. Li et al. [17]
used a two-class support vector machine (SVM) on pre- and post-earthquake Quickbird imagery
along with spatial relations derived from the local indicator of spatial association (LISA) index to
detect structures damaged by the Wenchuan earthquake of 2008. Haiyang et al. utilized a SVM
approach in combination with eCognition image segmentation on the RIT-ImageCAT RGB and
4
LiDAR data, as well as the textural features of contrast, dissimilarity, and variance derived from
the gray level co-occurrence matrix (GLCM, a matrix which describes the frequency of similar
gray values in adjacency throughout the whole or a part of an image) to detect urban damage in
Port-Au-Prince [18]. Kaya et al. [19] used OBIA in combination with support vector selection
and adaptation (a type of SVM) on pansharpened Quickbird imagery to conduct damage
detection for specific buildings within Port-au-Prince after the 2010 earthquake. While OBIA
using SVMs have been researched extensively in the past, ANNs, particularly radial basis
function neural networks (RBFNNs), and Random Forests (RF) have shown promise in pattern
recognition and image classification [15, 20] and have yet to be examined in the application of
earthquake damage detection. All three algorithms require parameter-tuning process to achieve
optimal performance and a cross-validation approach can be applied to automate the parameter-
tuning. SVM has an advantage in dealing with small sample size problems due to its sparse
characteristics. However, for applications where a large number of training samples are
available, SVM often yields a large number of support vectors, resulting in unnecessary
complexity and long training time [21].
Evaluating structural dimensions such as the Laplacian of Gaussian (LoG) and object-
based metrics in addition to spectral and textural information could greatly increase damage
detection rates. LoG, a blob detection technique, has been used for medical applications in nuclei
mapping [22] and for the detection of buildings in bitemporal images [23]. As discussed earlier,
OBIA has shown strong results in urban scenes and earthquake damage detection. Huang and
Zhang had success applying the popular mean-shift segmentation algorithm for urban
classification in hyperspectral scenes while statistical region merging (SRM) is another
segmentation approach which is robust to noise and occlusions [24, 25]. Additionally, various
5
metrics such as rectangular fit, morphological shadow index, and morphological building index
can describe the structure of objects in the scene before or after segmentation [26-27]. Applying
structural descriptors such as a LoG filter and segmentation derived metrics to high resolution
satellite imagery as an additional input to an MLA could evince damage in difficult to detect
scenarios such as a pancake collapse [22, 28]. The robustness and generalizability of RF and
ANN along with the additional dimensions of texture and structure may provide higher
accuracies in the face of imperfect input data.
In past disasters, by the time an automated change detection scheme is ready for
implementation, a crowdsourced team of visual interpreters is already mapping damaged
buildings [29]. Dong & Shan mention that while manual digitization of damaged structures
requires trained image analysts and is unsuitable for large areas, “visual interpretation remains to
be the most reliable and independent evaluation for automated methods” [1] (p. 96).
Additionally, many previous studies suggest detection schema which require ancillary data such
as UAS products, LiDAR, or GIS databases. Many of these products are unavailable in
developing regions where the death toll is highest [30]. Using MLAs (RF and ANN), a rapid
damage map derived from readily available multispectral imagery could allow for a minimal
compromise between time and accuracy and allow first responders to more rapidly allocate their
resources in a crisis. RF and ANN along with derived textural and structural features may
provide improved balance between rapid and accurate damage detection. The main purposes of
this study include:
• Assess the performance of neural networks (to include radial basis function neural
networks), and Random Forests on very high resolution satellite imagery in earthquake damage
detection
6
• Investigate the usefulness of structural feature identifiers to include the Laplacian
of Gaussian and rectangular fit in identifying damaged regions
7
MATERIALS AND METHODS
Study Area and Data
The earthquake on January 12, 2010 near Port-au-Prince, Haiti was an exceptionally
devastating event. The initial shock of 7.0 Mw caused an astounding death toll: between 217,000
and 230,000 were reported dead by the Haitian government [2] and the official estimate has
grown to 316,000 [31]. Additionally, the earthquake and its subsequent aftershocks caused
extensive damage in and around Port-au-Prince including numerous landmark buildings such as
the National Palace [2]. Because of the high density of collapsed and damaged structures
available for training and validation of MLAs, the 2010 Haiti earthquake is an ideal case study to
evaluate automated damage detection methods.
For this research, we obtained high resolution multispectral and panchromatic remote
sensing data from the DigitalGlobe Foundation. A pre-disaster panchromatic image was acquired
in December of 2009 by the WorldView-1 satellite (accessed via DigitalGlobe’s EnhancedView
system) and post-disaster multispectral and panchromatic images were acquired on January 15,
2010 by the Quickbird 2 satellite. All datasets were resampled to 0.6 meters using the nearest
neighbor technique. Images were atmospherically corrected to TOA reflectance [32] and clipped
to the study area of central Port-Au-Prince. Pre- and post-earthquake imagery were coregistered
using 15 control points and a third order polynomial transformation with a RMSE of 0.55 meters.

8
Table 1. Data used for the analysis. Note the similar look angles between the two satellite images used and the relatively short gap between the pre- and post-earthquake images.
Sensor Native Resolution Acquisition
Date
Look Angle
WorldView-1 0.5m panchromatic
12/7/2009 27.62
QuickBird-2 2.4m multispectral 0.6m
panchromatic
1/15/2010 20.7
Remote sensing damage assessment: UNITAR/UNOSAT, EC JRC, World Bank
Vector (point) 1/15/2010 N/A
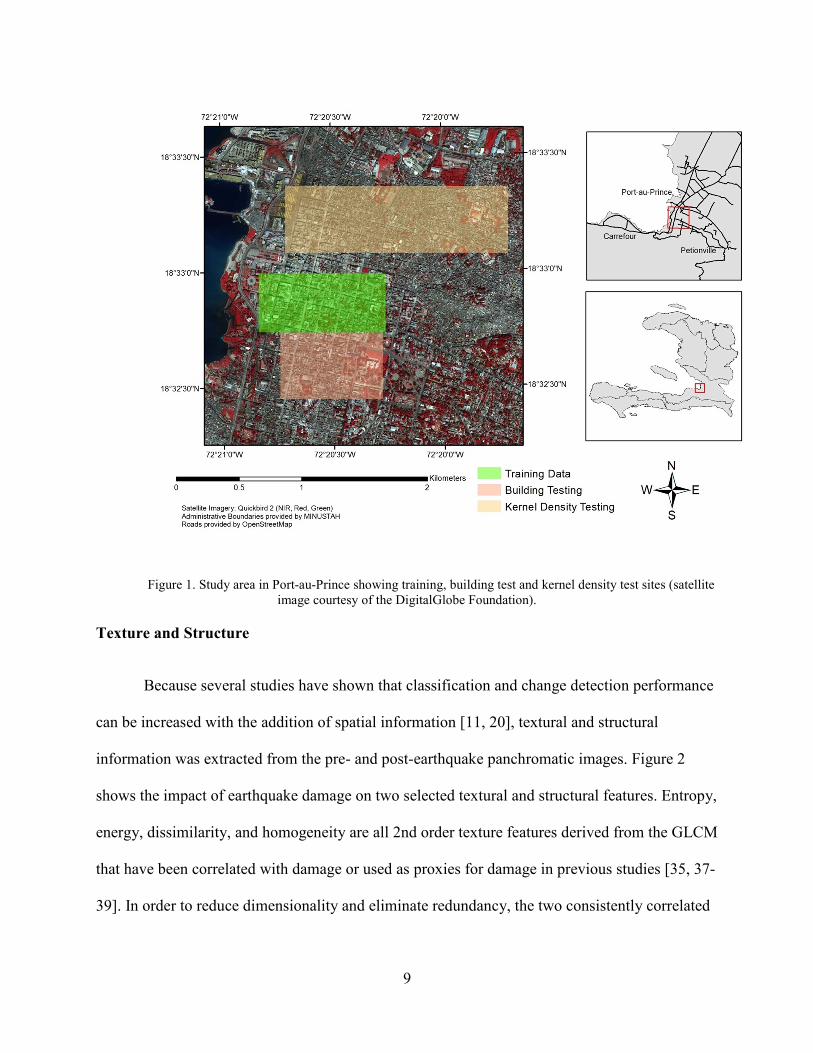
The study area (Figure 1) was divided into training and validation regions. Training
samples for the algorithms were selected by manually digitizing polygons over damaged
structures, ensuring that training data represented the input space of the entire study area. A total
of 1,214,623 undamaged and 134,327 damaged pixels were used for training. For validation
purposes, over 900 buildings were digitized and marked as damaged or undamaged according to
the UNOSAT Haiti damage assessment [33]. This dataset classifies damage as points classified
according to the European Macroseismic Scale developed in 1998 [34]. This classification
schema defines five damage levels ranging from minor/no damage to destruction [1, 5, 6, 35]. In
order to simplify the damage detection problem, the UNOSAT points belonging to the most
severe damage class (EMS grade V) were extracted for the validation sets and used for the
damaged building class. This action is required primarily because visual distinction between
classes is difficult even with sub-meter pixel resolution [1]. While these validation points have
been previously used in several studies [6, 36], it is important to note that the
UNOSAT/UNITAR dataset was derived through manual interpretation of satellite and aerial
imagery and very few points were ground verified. However, the assessment remains the
standard for validation of damage that occurred in the 2010 Haiti earthquake.
9
Figure 1. Study area in Port-au-Prince showing training, building test and kernel density test sites (satellite image courtesy of the DigitalGlobe Foundation).
Texture and Structure
Because several studies have shown that classification and change detection performance
can be increased with the addition of spatial information [11, 20], textural and structural
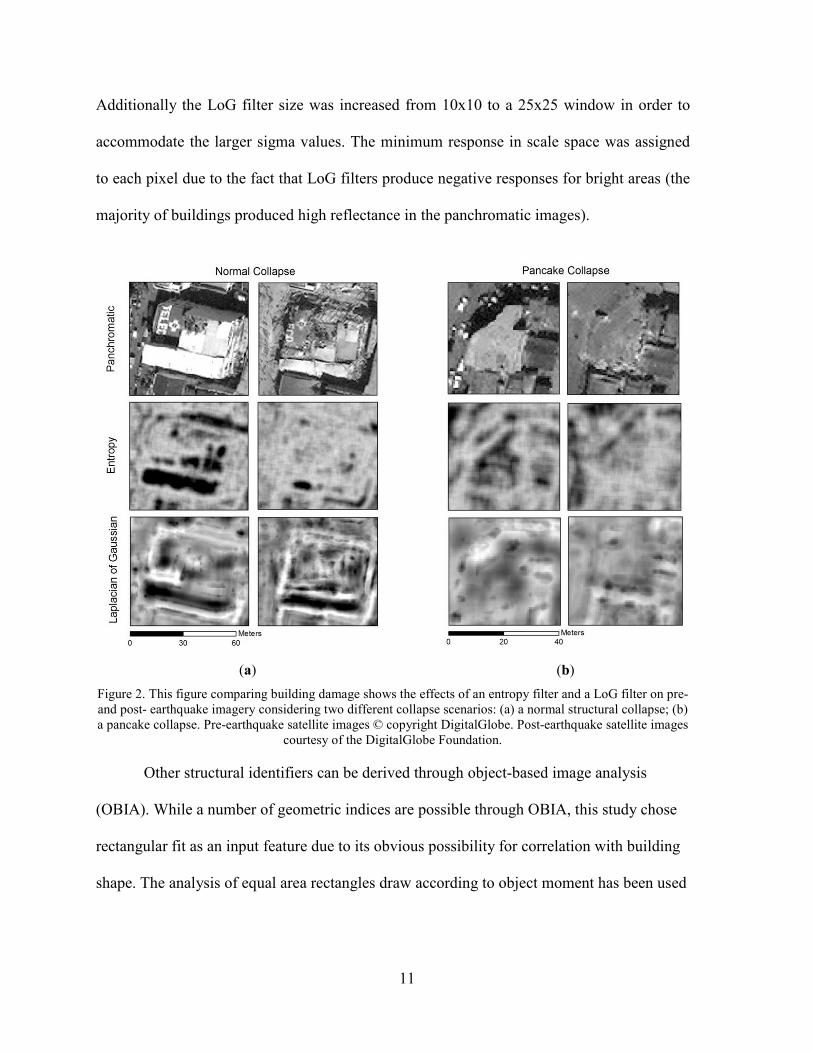
information was extracted from the pre- and post-earthquake panchromatic images. Figure 2
shows the impact of earthquake damage on two selected textural and structural features. Entropy,
energy, dissimilarity, and homogeneity are all 2nd order texture features derived from the GLCM
that have been correlated with damage or used as proxies for damage in previous studies [35, 37-
39]. In order to reduce dimensionality and eliminate redundancy, the two consistently correlated
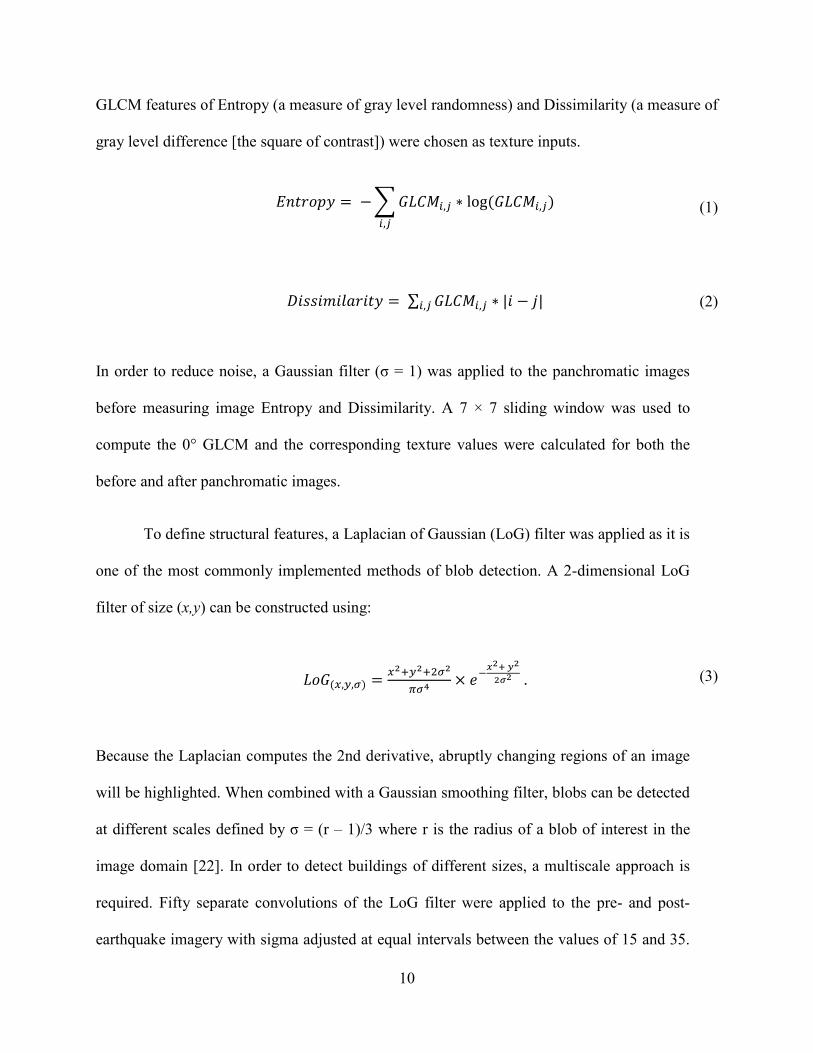
10
GLCM features of Entropy (a measure of gray level randomness) and Dissimilarity (a measure of
gray level difference [the square of contrast]) were chosen as texture inputs.
������� = − � � ���,� ∗ log(� ���,�)�,�
(1)
������������� = ∑ � ���,� ∗ |� − !|�,� (2)
In order to reduce noise, a Gaussian filter (σ = 1) was applied to the panchromatic images
before measuring image Entropy and Dissimilarity. A 7 × 7 sliding window was used to
compute the 0° GLCM and the corresponding texture values were calculated for both the
before and after panchromatic images.
To define structural features, a Laplacian of Gaussian (LoG) filter was applied as it is
one of the most commonly implemented methods of blob detection. A 2-dimensional LoG
filter of size (x,y) can be constructed using:
��(",#,$) = "%&#%&'$%($) × +,-%./%
%0% . (3)
Because the Laplacian computes the 2nd derivative, abruptly changing regions of an image
will be highlighted. When combined with a Gaussian smoothing filter, blobs can be detected
at different scales defined by σ = (r – 1)/3 where r is the radius of a blob of interest in the
image domain [22]. In order to detect buildings of different sizes, a multiscale approach is
required. Fifty separate convolutions of the LoG filter were applied to the pre- and post-
earthquake imagery with sigma adjusted at equal intervals between the values of 15 and 35.
11
Additionally the LoG filter size was increased from 10x10 to a 25x25 window in order to
accommodate the larger sigma values. The minimum response in scale space was assigned
to each pixel due to the fact that LoG filters produce negative responses for bright areas (the
majority of buildings produced high reflectance in the panchromatic images).
(a)
(b)
Figure 2. This figure comparing building damage shows the effects of an entropy filter and a LoG filter on pre- and post- earthquake imagery considering two different collapse scenarios: (a) a normal structural collapse; (b) a pancake collapse. Pre-earthquake satellite images © copyright DigitalGlobe. Post-earthquake satellite images
courtesy of the DigitalGlobe Foundation.
Other structural identifiers can be derived through object-based image analysis
(OBIA). While a number of geometric indices are possible through OBIA, this study chose
rectangular fit as an input feature due to its obvious possibility for correlation with building
shape. The analysis of equal area rectangles draw according to object moment has been used
12
as a more robust version of minimum bounding rectangle comparison [26]. Rectangular fit is
defined as
2+3�4�� = (56,57)58
, (4)
Where 9: is the area of the original object, 9; is the area of the equal rectangle (9: = 9;) and
9< is the overlaid difference between the equal rectangle and the original object [26]. For this
study, image segmentation was performed on both the before and after panchromatic images
using statistical region merging (SRM) as posited by Nock and Nielsen because of its fast and
simple implementation [40]. Setting the scale parameter Q = 512 enabled the many small
buildings in the scene to be distinguished. Each object’s rectangular fit was calculated and
included as an input dimension.
Machine Learning Algorithms
Once all preprocessing steps were taken and textural and structural features were derived,
the training and validation datasets were transformed into 14-dimensional arrays consisting of:
pre- panchromatic; pre- entropy; pre- dissimilarity pre- LoG; pre- rectangular fit; post-
panchromatic; post- entropy; post- dissimilarity; post- LoG; post- rectangular fit; blue; green;
red, and near infrared multispectral layers (see Table 2). Values in these layers were normalized
to fall between the values of -1 and 1 in order to standardize the input and validation layers.
While cross-validation was implemented for each MLA, exhaustive parameter analysis was not
performed due to the large number of training samples available. All MLA design, algorithm
implementation, training and validation were performed using MATLAB release 2015a on a 3.5
GHz quad core processor with 64 GB RAM.

13
Table 2. List of the input features and their corresponding data sources which were used as predictors for earthquake damage.
Input Feature Source
Panchromatic (450-900 nm) WV1 & QB2 Entropy
Dissimilarity LoG
Rectangular fit Blue (450-520 nm)
Green (520-600 nm) Red (630-690 nm)
WV1 & QB2 WV1 & QB2 WV1 & QB2 WV1 & QB2
QB2 QB2 QB2
Near infrared (760-900 nm) QB2
Neural Networks
Artificial neural networks are of continued interest due to their ability to approximate any
function given sufficient neurons in each layer, the flexibility of data distribution, and their
reduced computational complexity compared with statistical classification methods [11, 13, 20,
41]. A feedforward ANN (also known as multilayer perceptron) assigns small random
multiplicative weights and additive biases to input neurons and iteratively adjusts them with each
additional training data input, minimizing the surface of the performance function representing
the error between the training data and the network’s output in order to make the best
classification [11, 13, 41]. Neural network design is difficult due to the number of free
parameters and ambiguous requirements for network depth and complexity which depend upon
the problem at hand [41]. As a result, neurons were grown and pruned in various combinations
within 1-3 hidden layers until the network performance was maximized. The resulting ANN
consisted of two hidden layers of 20 neurons each with sigmoid transfer functions, and a binary
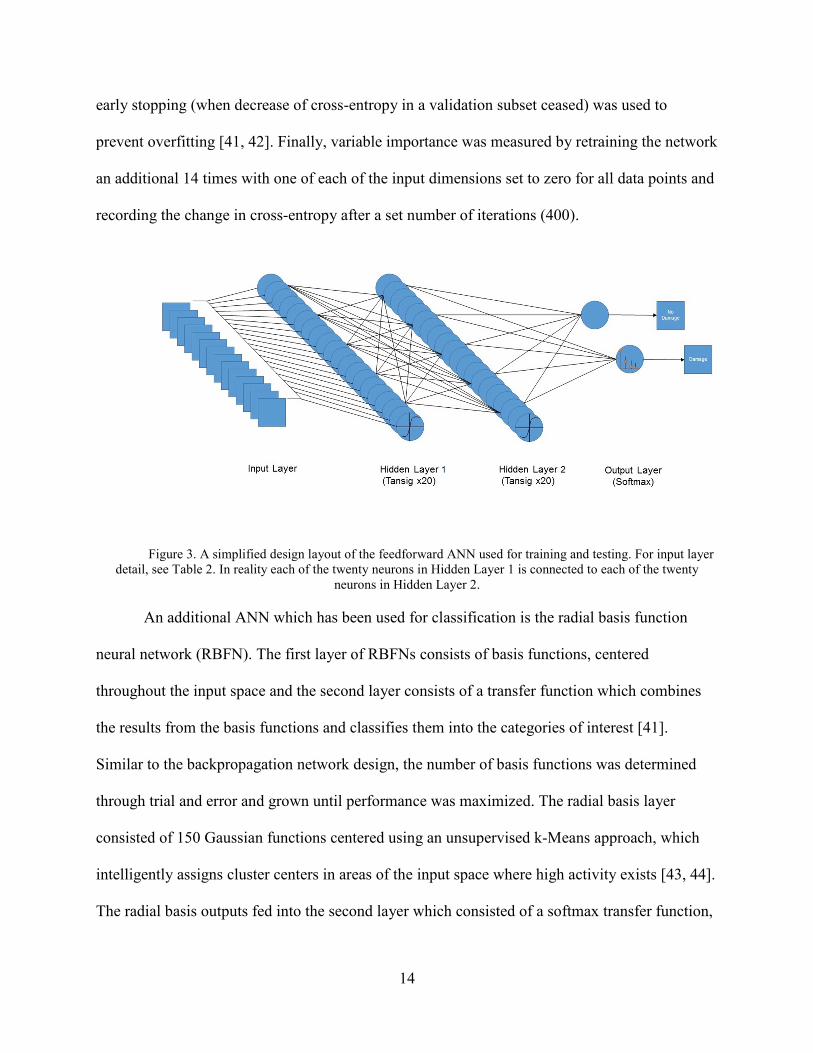
softmax output layer (see Figure 3). Training was accomplished using backpropagation and the
scaled conjugate gradient algorithm to minimize cross-entropy and two-fold cross validation via
14
early stopping (when decrease of cross-entropy in a validation subset ceased) was used to
prevent overfitting [41, 42]. Finally, variable importance was measured by retraining the network
an additional 14 times with one of each of the input dimensions set to zero for all data points and
recording the change in cross-entropy after a set number of iterations (400).
Figure 3. A simplified design layout of the feedforward ANN used for training and testing. For input layer detail, see Table 2. In reality each of the twenty neurons in Hidden Layer 1 is connected to each of the twenty
neurons in Hidden Layer 2.
An additional ANN which has been used for classification is the radial basis function
neural network (RBFN). The first layer of RBFNs consists of basis functions, centered
throughout the input space and the second layer consists of a transfer function which combines
the results from the basis functions and classifies them into the categories of interest [41].
Similar to the backpropagation network design, the number of basis functions was determined
through trial and error and grown until performance was maximized. The radial basis layer
consisted of 150 Gaussian functions centered using an unsupervised k-Means approach, which
intelligently assigns cluster centers in areas of the input space where high activity exists [43, 44].
The radial basis outputs fed into the second layer which consisted of a softmax transfer function,

15
trained by minimizing cross-entropy using the scaled conjugate gradient with early stopping as
before.
Random Forests
Random Forests, which was originally proposed by Breiman [45], is an ensemble
classifier consisting of a large number of classification and regression trees (CART), where final
classification is performed by a winner-takes-all voting system. The algorithm trains each tree on
an independently drawn subset of the original data (bootstrap aggregating or bagging) and
determines the number of features to be used at each node by the evaluation of a random vector
[45, 46]. Because RF is an ensemble classifier, the Law of Strong Numbers dictates that RF will
converge without overfitting the model, so that the computationally optimal number of trees can
be found through testing the algorithm. Additional benefits include robustness to outliers and
noise and built-in estimates of error and variable importance [45, 47]. Using MATLAB’s
TreeBagger function, training was accomplished using 400 (additional tree growth resulted in no
further decrease in out-of-bag error) classification trees grown by selecting 3 variables (at
random) for each node split. Additionally, the out-of-bag error was collected and variable
importance was measured for comparison with the ANN approach.
Testing and Accuracy Assessement
After training, validation testing was performed on two different datasets. The first dataset
consisted of an area including the National Palace just to the south of the training area where
building footprints were previously digitized. For this testing area, output from the algorithms
was converted to polygons and a building by building accuracy assessment was performed on the
first dataset by examining where the algorithmic damage intersects with the building footprints,

16
which resulted in a simple confusion matrix. This approach was taken in order to ensure that our
accuracy measurements were based on actual objects in the scene rather than a pixel-by-pixel
assessment. The second validation dataset included a larger area in order to test the algorithms’
performance when based on kernel density map rank matching. This secondary assessment
followed the procedures used by Tiede et al. [36] and Pham et al. [6] in which the centroid points
of the damage polygons are computed and kernel density raster maps are generated for both the
test damage points as well as the UNOSAT/UNITAR control data points. The damage density
for each dataset was projected onto a 20m raster grid and the rank value of each cell was
computed according to the quartile of density that cell belonged to. The two maps were overlaid
and accuracy was assessed by subtracting the UNOSAT/UNITAR kernel density map from the
test kernel density maps, with final output values ranging from -3 (omission error) to +3
(commission error).
17
RESULTS
Building-By-Building
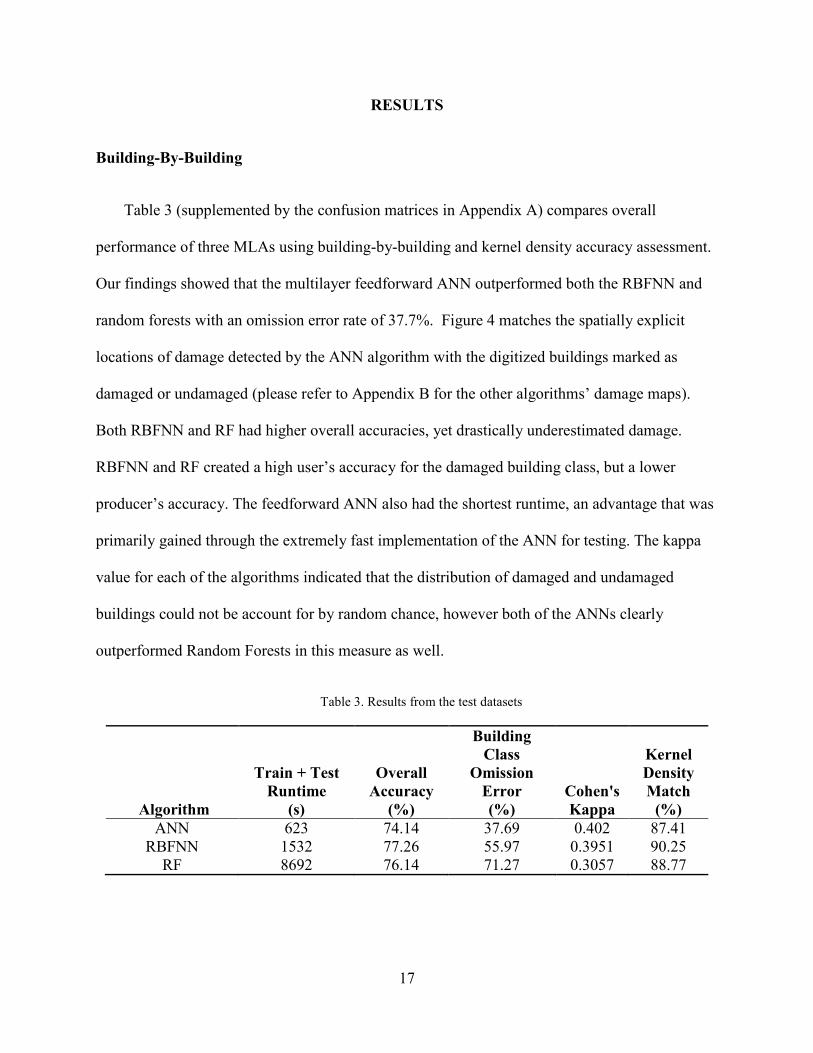
Table 3 (supplemented by the confusion matrices in Appendix A) compares overall
performance of three MLAs using building-by-building and kernel density accuracy assessment.
Our findings showed that the multilayer feedforward ANN outperformed both the RBFNN and
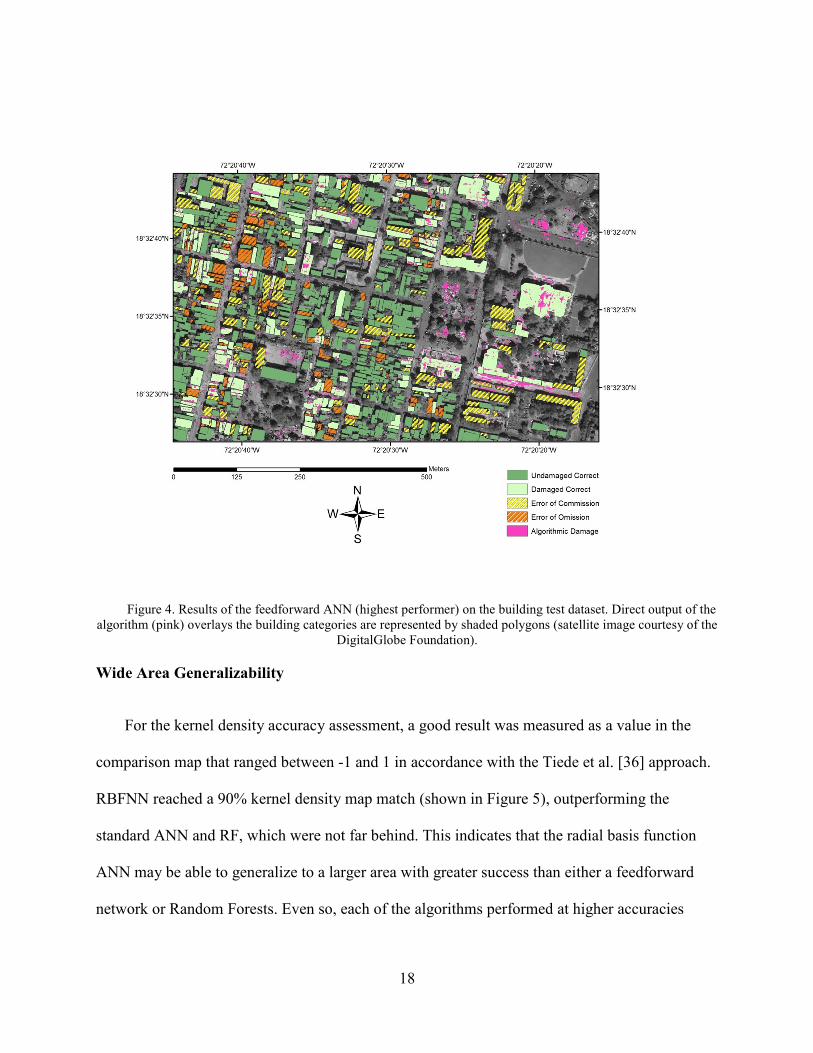
random forests with an omission error rate of 37.7%. Figure 4 matches the spatially explicit
locations of damage detected by the ANN algorithm with the digitized buildings marked as
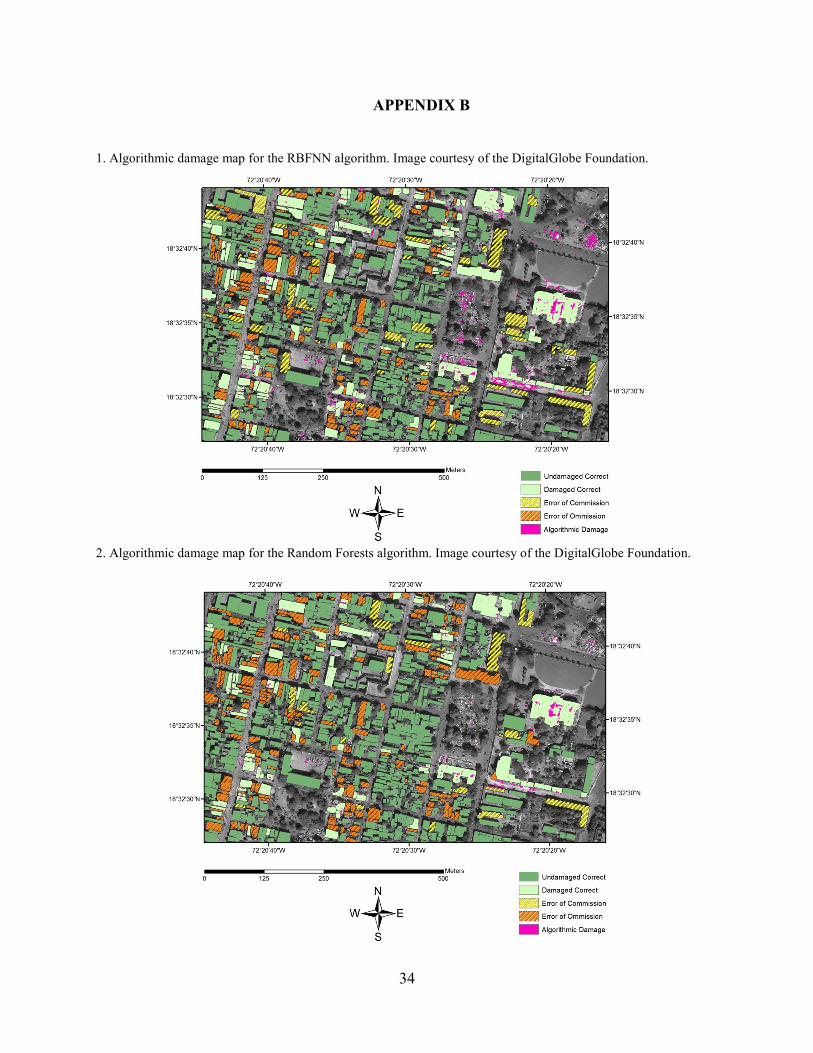
damaged or undamaged (please refer to Appendix B for the other algorithms’ damage maps).
Both RBFNN and RF had higher overall accuracies, yet drastically underestimated damage.
RBFNN and RF created a high user’s accuracy for the damaged building class, but a lower
producer’s accuracy. The feedforward ANN also had the shortest runtime, an advantage that was
primarily gained through the extremely fast implementation of the ANN for testing. The kappa
value for each of the algorithms indicated that the distribution of damaged and undamaged
buildings could not be account for by random chance, however both of the ANNs clearly
outperformed Random Forests in this measure as well.
Table 3. Results from the test datasets
Algorithm
Train + Test
Runtime
(s)
Overall
Accuracy
(%)
Building
Class
Omission
Error
(%)
Cohen's
Kappa
Kernel
Density
Match
(%)
ANN 623 74.14 37.69 0.402 87.41 RBFNN 1532 77.26 55.97 0.3951 90.25
RF 8692 76.14 71.27 0.3057 88.77
18
Figure 4. Results of the feedforward ANN (highest performer) on the building test dataset. Direct output of the algorithm (pink) overlays the building categories are represented by shaded polygons (satellite image courtesy of the
DigitalGlobe Foundation).
Wide Area Generalizability
For the kernel density accuracy assessment, a good result was measured as a value in the
comparison map that ranged between -1 and 1 in accordance with the Tiede et al. [36] approach.
RBFNN reached a 90% kernel density map match (shown in Figure 5), outperforming the
standard ANN and RF, which were not far behind. This indicates that the radial basis function
ANN may be able to generalize to a larger area with greater success than either a feedforward
network or Random Forests. Even so, each of the algorithms performed at higher accuracies

19
when generalizing the distribution of damage over a wide area instead of detecting individual,
building level damage.
Figure 5. Results of the RBFNN algorithm on the kernel density test dataset. Each 20m cell is marked from -3 to 3, where an adequate density match falls between -1 and 1 (satellite image courtesy of the DigitalGlobe
Foundation).
Beyond examining an algorithm’s wide area generalizability, kernel density accuracy
assessment also allowed for investigation into areas of common error of both omission and
commission. One of the more interesting results was that these areas were common in all three
algorithms. A common error of commission occurred in the north-center of the test area and
coincided with the development of an internally displaced persons (IDP) camp (see Figure 6).
According to the algorithms, this camp broke up the “structure” of the underlying field and
increased the randomness of the texture, which led it to misclassify the area as a damaged
building. Figure 7 shows a common area of omission error contained within the map in the
central region of the testing area. The underlying cause of error in this region is the scene
complexity and high density of small structures before the earthquake occurred. This preexisting
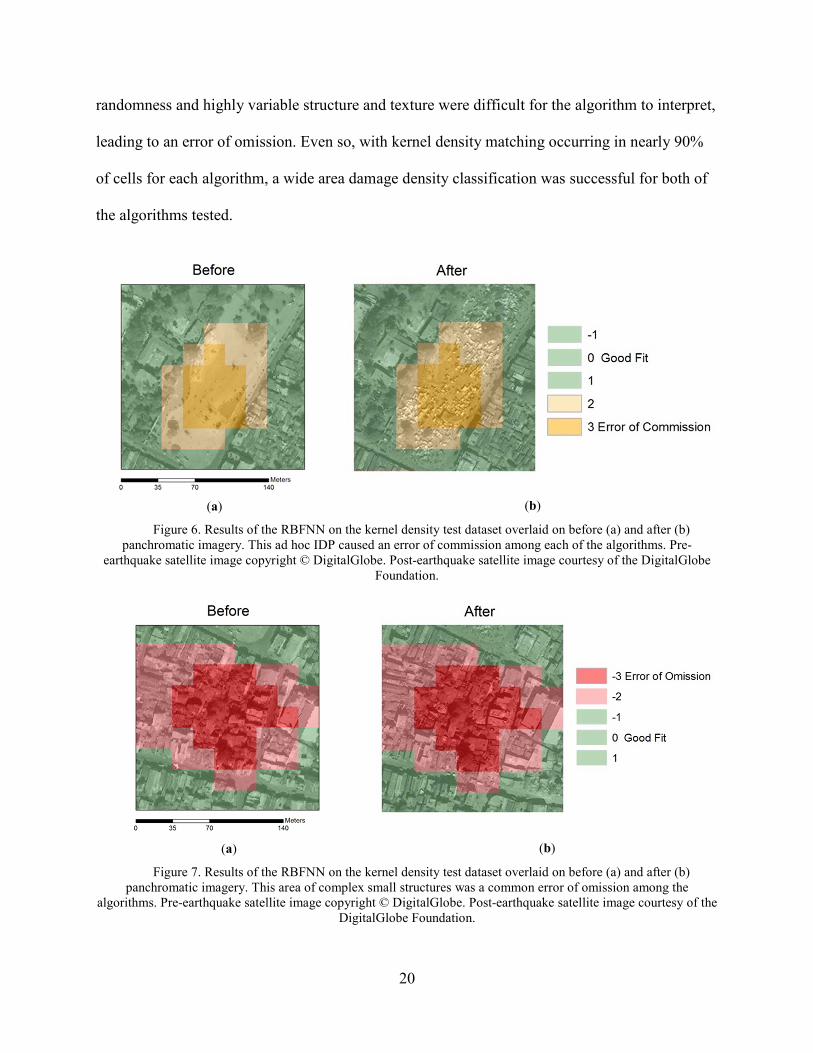
20
randomness and highly variable structure and texture were difficult for the algorithm to interpret,
leading to an error of omission. Even so, with kernel density matching occurring in nearly 90%
of cells for each algorithm, a wide area damage density classification was successful for both of
the algorithms tested.
(a)
(b)
Figure 6. Results of the RBFNN on the kernel density test dataset overlaid on before (a) and after (b) panchromatic imagery. This ad hoc IDP caused an error of commission among each of the algorithms. Pre-
earthquake satellite image copyright © DigitalGlobe. Post-earthquake satellite image courtesy of the DigitalGlobe Foundation.
(a)
(b)
Figure 7. Results of the RBFNN on the kernel density test dataset overlaid on before (a) and after (b) panchromatic imagery. This area of complex small structures was a common error of omission among the
algorithms. Pre-earthquake satellite image copyright © DigitalGlobe. Post-earthquake satellite image courtesy of the DigitalGlobe Foundation.
21
Variable Importance
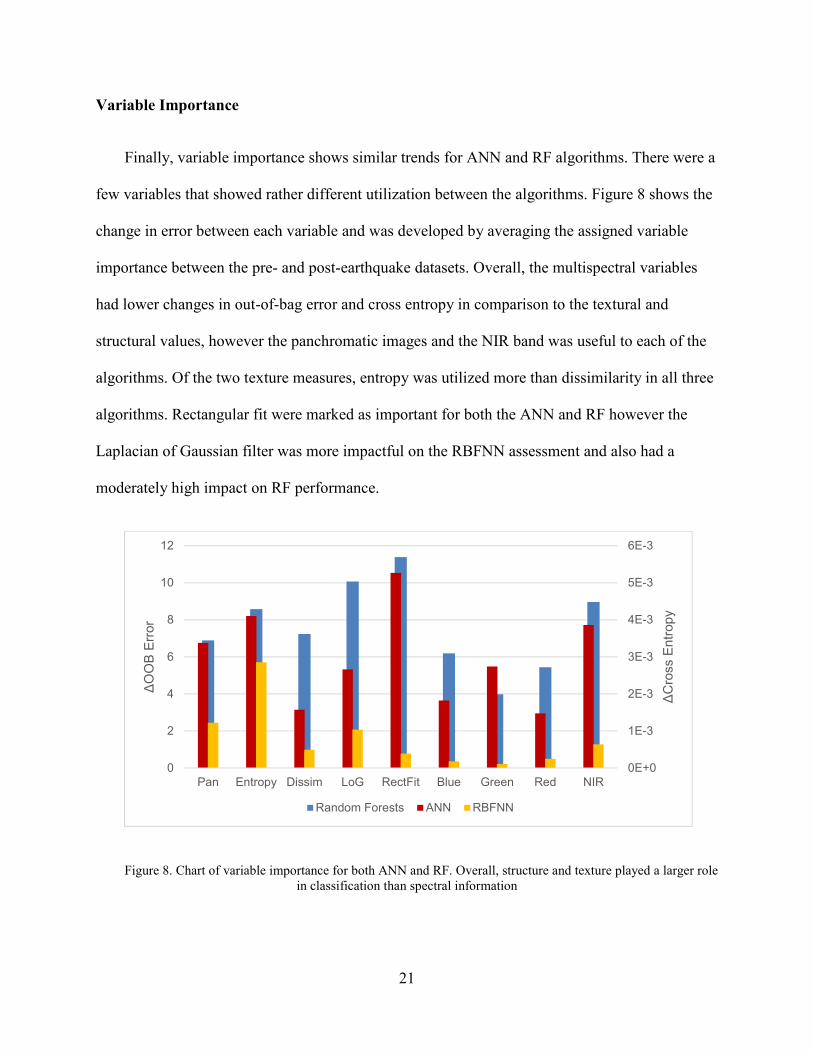
Finally, variable importance shows similar trends for ANN and RF algorithms. There were a
few variables that showed rather different utilization between the algorithms. Figure 8 shows the
change in error between each variable and was developed by averaging the assigned variable
importance between the pre- and post-earthquake datasets. Overall, the multispectral variables
had lower changes in out-of-bag error and cross entropy in comparison to the textural and
structural values, however the panchromatic images and the NIR band was useful to each of the
algorithms. Of the two texture measures, entropy was utilized more than dissimilarity in all three
algorithms. Rectangular fit were marked as important for both the ANN and RF however the
Laplacian of Gaussian filter was more impactful on the RBFNN assessment and also had a
moderately high impact on RF performance.
Figure 8. Chart of variable importance for both ANN and RF. Overall, structure and texture played a larger role in classification than spectral information
0E+0
1E-3
2E-3
3E-3
4E-3
5E-3
6E-3
0
2
4
6
8
10
12
Pan Entropy Dissim LoG RectFit Blue Green Red NIR
∆C
ross E
ntr
opy
∆O
OB
Err
or
Random Forests ANN RBFNN
22
DISCUSSION
It is difficult to determine outright which algorithm is better. While the multilayer ANN
outperformed RF in building by building assessments and required slightly less overall training
time, it required a large number of training samples in order to perform well. This is not
necessarily the case for the RF algorithm. Also, it is rather easy to overfit an ANN to the training
data, which can be avoided using RF due to its nature as an ensemble classifier [41, 45]. Finally,
ANNs can also become stuck at local minima in the performance surface without reaching the
global solution, yielding an insufficient result [41]. However, in our study, the multilayer ANN
had the lowest rates of error in detecting damaged buildings, without sacrificing much
performance in wide area generalization or overall accuracy. SVMs, while not examined here,
have shown promise in earthquake detection in previous studies [17 - 19]. While our study
focused on ANNs and RF, as little research has been done on their applicability to earthquake
detection problems, future studies may investigate the performance of these algorithms (to
include SVM) with respect to training sample size.
Beyond damage detection performance, practical considerations require an investigation into
time complexity, particularly when considering any kind of operationalization of an algorithm in
automatic damage detection. RF took much longer than either of the ANNs to train and test the
datasets. The time complexity of a single classification and regression tree is O(mn · logn) where
m is the total number of variables and n is the number of samples [48]. Because RF is an
ensemble classifier, the overall time complexity of Random Forests can be summarized as
O(M(mn · logn)) where M is the number of trees grown. For large number of samples with
moderate dimensionality, this can be quite time consuming. In contrast, neural network
complexity is highly dependent on network architecture. Time complexity for the scaled
23
conjugate descent algorithm is often polynomial, overall complexity is determined by the
problem and the number of free parameters (weights, biases, or basis functions [in the case of
RBFNN]) required to describe that problem [49]. As such, testing showed that the ANNs trained
faster and tested faster, which is important to consider given the requirement to process a
potentially large amount of imagery in an operational context.
As previously discussed, a number of preprocessing steps are required to develop each of
the textural and structural dimensions. Also, a k-means unsupervised clustering was used as part
of the RBFNN algorithm to intelligently center the basis functions before training. Each of these
steps adds time and complexity to the final product. For future studies, the parallelization of
many of these processes is one way to greatly reduce computational time. Our data were
gathered using serial processing (primarily because a parallel implementation of k-means was
not immediately available) in order to establish a baseline and fairly assess each algorithm,
however parallel implementations (which include GPU processing) of both ANN and RF training
are readily available for use and will greatly speed up training and implementation of these
machine learning algorithms.
The actual results from this study mirrored what was expected quite well; the areas of
imagery where texture and structure were broken up were often identified as damage, as one
would expect. As mentioned in the results section, one interesting finding was that each of the
algorithms erroneously identified IDP camp areas as building damage. These IDP camps are ad
hoc structures (tents, tarps, and shanties) built primarily on open spaces before the earthquake
struck. As these IDP camps were erected, they broke up the coherent texture and structure of the
underlying terrain, causing the algorithm to mark them as damage. While this is technically an
error of commission, it is nevertheless a useful result in showing the power of MLAs in seeking
24
out patterns as well as their ability to simultaneously detect damage and displaced persons. In an
operational context, the MLA results in combination with a priori knowledge of building
distribution via a GIS database would allow first responders and emergency planners to easily
distinguish damaged structures from these IDP camps.
As the experiment on variable importance showed, the textural and structural features
were some of the most important factors which allowed both ANNs and RF to detect damage and
IDP camps. Stramondo et al. [7] also used important textural features for earthquake damage
detection although in their study a maximum likelihood classifier was used. This line of thinking,
paramount to computer vision applications, is expanded here by using more intelligent
algorithms and readily available data. The importance of the panchromatic features along with
the texture and structure products derived exclusively from that panchromatic imagery
presupposes that future implementations of machine learning may be able to perform earthquake
damage detection from panchromatic imagery alone. One reason that the multispectral imagery
was not a driving variable is simply due to resolution; the native 2.4m is too coarse to detect
many of the features associated with earthquake damage. Interestingly, the only multispectral
product which was found to be an important variable for each of the algorithms was the near
infrared band, which may have resulted from a correlation between exposed rubble and a higher
NIR reflectance. These findings may guide future research in determining which variables to
focus on in earthquake damage studies.
Our focus on simple panchromatic imagery is a departure from many previous earthquake
studies. The state-of-the-art focuses on LiDAR, SAR, unmanned aerial vehicles, and the software
suite eCognition [1]. However, the access and availability of these additional data requirements
may be limited in the aftermath of a destructive earthquake in a less developed region such as
25
Haiti. A return to easily accessible data products such as multispectral or even panchromatic
imagery alone could allow a MLA (potentially even one that is pre-trained) to detect imagery
without the requirement of ancillary data. One potential disadvantage of the reliance on
bitemporal VHR imagery is the requirement for precise coregistration. Different look angles can
cause problems in classification and change detection. While image registration is still important
to our study, a small look angle difference may not be critical due to our use of textural and
structural features rather than the VHR imagery alone. Additionally, registration errors can be
seen as a source of noise in the system; each of the MLAs used has been shown to be robust to
noise [41, 45]. The difference in our look angles (~7°) did not appear to cause any damage
detection errors in a visual survey of our results. Future research may investigate the limits of
acceptable look angle differences or use a complex coregistration approach to eliminate the issue
altogether [50].
The future of earthquake damage detection may lie in deep convolutional neural networks
(DCNN) coupled with high performance computing and graphics processing units (GPUs).
DCNNs have already pushed the boundaries of artificial intelligence and image recognition;
rather than being told which textural, structural, or spectral inputs should be used, these networks
automatically learn and identify the defining features (convolutions) of the problem at hand in
order to classify future samples [51, 52]. Initial results are promising. Using MatConvNet (a
deep learning library for Matlab), we experimented with training a DCNN with the VGG-F
architecture following the approach and using the hyperparameters described by Chatfield et al.
[52, 53]. We segmented the post-earthquake pansharpened image using SRM and trained the
DCNN on each labeled, extracted object. The DCNN was not only able to detect buildings at a
comparable rate (>55% detection rate), it was able to distinguish between damage and IDP
26
camps (>65% detection rate) and did so using an after-only pansharpened image, reducing data
requirements and eliminating the need for coregistration. A pre-trained DCNN optimized
specifically for earthquake detection may offer a robust and operationally implementable
solution to the much studied topic of earthquake damage detection.

27
CONCLUSION
This study analyzed the use of machine learning algorithms to include feedforward neural
networks, radial basis function neural networks, and Random Forests in detecting earthquake
damage caused by the January 12, 2010 event near Port-au-Prince, Haiti. The algorithms’
efficacy was improved by providing coregistered 0.6m multitemporal imagery, texture features
(dissimilarity and entropy), and structure features (Laplacian of Gaussian and rectangular fit) as
inputs. Detection results were assessed on a structure specific basis by digitizing more than 900
buildings and comparing each MLA’s response to the UNITAR/UNOSAT validation set. For a
wide area generalization, a kernel density map comparison was performed between each of the
algorithms’ classification results and the UN damage validation points.
The feedforward ANN consisting of two hidden layers had the lowest error rate (< 40%)
without sacrificing much performance in overall accuracy or generalization to wider area damage
estimates. Additionally, textural and structural features derived from panchromatic imagery were
shown to be more important than spectral variables in the algorithms’ classification process.
Each algorithm had common errors of commission occurring around ad hoc IDP camps that were
spontaneously formed in open spaces following the earthquake; this technically incorrect result
can be easily integrated with a GIS layer containing building footprints.
The results of this study show that not only do MLAs have potential for use in earthquake
damage detection, but that panchromatic or pansharpened imagery can be the exclusive data
source for training and testing. Measures of variable importance found that the panchromatic
derived texture and structure products are the main drivers behind the success of these “shallow”
machine learning algorithms. Future research into an operationally implementable machine

28
learning method is warranted. An attractive next step is to transition into deep learning where
convolutional neural networks move beyond pixel-based or object-based paradigms and begin to
detect remotely sensed features in ways akin to natural image recognition.

29
WORKS CITED
1. Dong, L. and J. Shan, A Comprehensive Review of Earthquake-induced Building Damage Detection with Remote Sensing Techniques. ISPRS Journal of Photogrammetry and Remote Sensing, 2013. 84: p. 85-99.
2. Hussain, E., et al., Building Extraction and Rubble Mapping for City Port-au-Prince Post-2010 Earthquake with GeoEye-1 Imagery and Lidar Data. Photogrammetric Engineering & Remote Sensing, 2011. 77(10): p. 1011-1023.
3. Comfort, L.K., Self organization in disaster response: The Great Hanshin, Japan earthquake of January 17, 1995. Quick Response Report. Vol. 78. 1996, Boulder, CO: Natural Hazards Research and Applications Information Center.
4. Smith, K., Environmental Hazards. 3 ed. 2001, London: Routledge.
5. Voigt, S., et al., Rapid Damage Assessment and Situation Mapping: Learning from the 2010 Haiti Earthquake. Photogrammetric Engineering & Remote Sensing, 2011. 77(9): p. 923-931.
6. Pham, T.-T.-H., et al., Towards a Rapid Automatic Detection of Building Damage Using Remote Sensing for Disaster Management: The 2010 Haiti Earthquake. Disaster Prevention and Management, 2014. 23(1): p. 53-66.
7. Stramondo, S., et al., Satellite Radar and Optical Remote Sensing for Earthquake Damage Detection: Results from Different Case Studies. International Journal of Remote Sensing, 2006. 27(20): p. 4433-4447.
8. Dell’Acqua, F., et al., Earthquake Damages Rapid Mapping by Satellite Remote Sensing Data: L’Aquila April 6th, 2009 Event. IEEE Journal of Selected Topics in Applied Earth Observations and Remote Sensing, 2011. 4(4): p. 935-943.
9. Gamba, P. and F. Casciati, GIS and Image Understanding for Near-Real-Time Earthquake Damage Assessment. Photogrammetric Engineering & Remote Sensing, 1998. 64(10): p. 987-994.
10. Goldberg, D. and J. Holland, Genetic Algorithms and Machine Learning. Machine Learning, 1988. 3(2): p. 95-99.
11. Xu, J.B., et al., Remote Sensing Image Classification Based on a Modified Self-organizing Neural Network with a Priori Knowledge. Sensors & Transducers, 2013. 153(6): p. 29-36.
12. Melgani, F. and L. Bruzzone, Classification of Hyperspectral Remote Sensing Images with Support Vector Machines. IEEE Transactions on Geoscience and Remote Sensing, 2004. 42(8): p. 1778-1790.
30
13. Benediktsson, J., P.H. Swain, and O.K. Ersoy, Neural Network Approaches Versus Statistical Methods in Classification of Multisource Remote Sensing Data. IEEE Transactions on Geoscience and Remote Sensing, 1990. 28(4): p. 540-552.
14. Shao, Y. and R.S. Lunetta, Comparison of support vector machine, neural network, and CART algorithm for the land-cover classifcation using limited data points. ISPRS Journal of Photogrammetry and Remote Sensing, 2012. 70: p. 78-87.
15. Pal, M., Random Forest Classifier for Remote Sensing Classification. International Journal of Remote Sensing 2005. 26(1): p. 217-222.
16. Ito, Y., et al., Extraction of damaged regions using SAR data and neural networks. International Archives of Photogrammetry and Remote Sensing, 2000. 33(B1): p. 156-163.
17. Li, P., et al. Urban Building Damage Detection From Very High Resolution Imagery Using One-Class SVM and Spatial Relations. in IEEE International Geoscience and Remote Sensing Symposium. 2009. Cape Town.
18. Haiyang, Y., C. Gang, and G. Xiaosan, Earthquake-collapsed building extraction from LiDAR and aerophotograph based on OBIA, in 2nd International Conference on Information Science and Engineering. 2010: Hangzhou, China. p. 2034-2037.
19. Kaya, G., N. Musaoglu, and O.K. Ersoy, Damage Assessment of 2010 Haiti Earthquake with Post-Earthquake Satellite Image by Support Vector Selection and Adaptation. Photogrammetric Engineering & Remote Sensing, 2011. 77(10): p. 1025-1035.
20. Li, J., Q. Du, and Y. Li, An efficient radial basis function neural network for hyperspectral remote sensing image classification. Soft Computing, 2015: p. 1-7.
21. Duda, R., P. Hart, and D. Stork, Pattern Classification. 2d ed. 2004, New York: Wiley.
22. Kong, H., H. Akakin, and S. Sarma, A Generalized Laplacian of Gaussian Filter for Blob Detection and Its Applications. IEEE Transactions on Cybernetics, 2013. 43(6): p. 1719-1733.
23. Ilsever, M. and C. Ünsalan, Two-Dimensional Change Detection Methods. 2012, London: Springer.
24. Huang, X. and L. Zhang, An Adaptive Mean-Shift Analysis Approach for Object Extraction and Classification from Urban Hyperspectral Imagery. IEEE Transactions on Geoscience and Remote Sensing, 2008. 46(12): p. 4173-4185.
25. Li, H., H. Gu, Y. Han, J. Yang, An Efficient Multiscale SRMMHR (Statistical Region Merging and Minimum Heterogeneity Rule) Segmentation Method for High-Resolution Remote Sensing Imagery. IEEE Journal of Selected Topics in Applied Earth Observations and Remote Sensing, 2009. 2(2): p. 67-73.

31
26. Sun, Z., et al., Regular Shape Similarity Index: A Novel Index for Accurate Extraction of Regular Objects from Remote Sensing Images. IEEE Transactions on Geoscience and Remote Sensing, 2015. 53(7): p. 3737-3748.
27. Huang, X. and L. Zhang, Morphological Building/Shadow Index for Building Extraction from High-Resolution Imagery Over Urban Areas. IEEE Journal of Selected Topics in Applied Earth Observations and Remote Sensing, 2012. 5(1): p. 161-172.
28. Bignami, C., et al., Objects textural features sensitivity for earthquake damage mapping, in Joint Urban Remote Sensing Event, U. Stilla, et al., Editors. 2011: Munich.
29. Marshall, A. How Amateur Mappers Are Helping Recovery Efforts In Nepal. 2015 [cited 2016; Available from: http://www.citylab.com/tech/2015/04/how-amateur-mappers-are-helping-recovery-efforts-in-nepal/391703/.
30. Kahn, M.E., The Death Toll From Natural Disasters: The Role of Income, Geography, and Institutions. The Review of Economics and Statistics, 2005. 87(2): p. 271-284.
31. USGS. Earthquakes with 1,000 or More Deaths 1900-2014. 2015 19 February 2015 [cited 2015 17 November].
32. Krause, K., Radiometric Use of QuickBird Imagery. 2005, DigitalGlobe: Longmont, CO.
33. UNITAR/UNOSAT, E. JRC, and W. Bank, Remote Sensing Damage Assessment. 2010.
34. Grünthal, G., European macroseismic scale 1998: EMS-98. 1998, Luxembourg: European Seismological Commission, Subcommission on Engineering Seismology, Working Group Macroseismic scales.
35. Dell’Acqua, F. and P. Gamba, Remote Sensing and Earthquake Damage Assessment: Experiences, Limits, and Perspectives. Proceedings of the IEEE, 2012. 100(10): p. 2876-2890.
36. Tiede, D., et al., Automated damage indication for rapid geospatial reporting. An operational object based approach to damage density mapping following the 2010 Haiti earthquake. Photogrammetric Engineering & Remote Sensing, 2011. 77(9): p. 1-10.
37. Gebejes, A. and R. Huertas, Texture Characterization based on Grey-Level Co-occurrence Matrix, in Conference on Informatics and Management Sciences. 2013. p. 375-378.
38. Miura, H., S. Modorikawa, and S.H. Chen, Texture Characteristics of High-Resolution Satellite Images In Damaged Areas of the 2010 Haiti Earthquake, in 9th International Workshop on Remote Sensing for Disaster Response. 2011: Stanford University.
39. Tomowskia, D., et al. Change Visualization Through A Texture-Based Analysis Approach For Disaster Applications. in ISPRS TC VII Symposium. 2010. Vienna, Austria: ISPRS.
32
40. Nock, R. and F. Nielsen, Statistical Region Merging. IEEE Transactions on Pattern Analysis and Machine Intelligence, 2004. 26(11): p. 1452-1458.
41. Hagan, M., et al., Neural Network Design. 2nd ed. 2015, Lexington, KY.
42. Shao, Y., G.N. Taff, and S.J. Walsh, Comparison of early stop criteria for neural network-based sub-pixel classification. IEEE Geoscience and Remote Sensing Letters, 2010. 8(1): p. 113-117.
43. Schwenker, F., H. Kestler, and G. Palm, Three learning phases for radial-basis-function networks. Neural Networks, 2001. 14: p. 439-458.
44. McCormick, C. Radial Basis Function Network (RBFN) Tutorial. 2013 [cited 2015 Nov-Dec].
45. Breiman, L., Random Forests. Machine Learning, 2001. 45: p. 5-32.
46. Breiman, L., Bagging Predictors. Machine Learning, 1996. 24: p. 123-140.
47. Geiss, C., et al., Estimation of seismic building structural types using multi-sensor remote sensing and machine learning techniques. ISPRS Journal of Photogrammetry and Remote Sensing, 2015. 104: p. 175-188.
48. Witten, I., E. Frank, and M. Hall, Data Mining. 3rd ed. 2011, Burlington, MA: Elsevier.
49. Moller, M.F., A Scaled Conjugate Gradient Algorithm for Fast Supervised Learning. Neural Networks, 1991. 6: p. 525-533.
50. Leprince, S., S. Barbot, F. Ayoub, and J. Avouac. Automatic and Precise Orthorectification, Coregistration, and Subpixel Correlation of Satellite Images, Application to Ground Deformation Measurements. IEEE Transactions on Geoscience and Remote Sensing, 2007. 45(6): p. 1529-1558.
51. Krizhevsky, A., I. Sutskever, and G. Hinton. ImageNet Classification with Deep Convolutional Neural Networks. in Advances in Neural Information Processing Systems. 2012.
52. Chatfield, K., K. Simonyan, A. Vedaldi, and A. Zisserman. Return of the Devil in the Details: Delving Deep into Convolutional Nets. Proceedings of the British Machine Vision Conference. BMVA Press, September 2014.
53. Vedaldi, A. and K. Lenc. MatConvNet - Convolutional Neural Networks for MATLAB. Proceedings of the 23rd ACM international conference on Multimedia. Brisbane, Australia. 2015.
33
APPENDIX A
Undamaged UNOSAT
Damaged UNOSAT ANN UA
Undamaged ANN 498 101 83.14
Damaged ANN 131 167 56.04
ANN PA 79.17 62.31
RBFNN UA
Undamaged RBFNN 575 150 79.31
Damaged RBFNN 54 118 68.60
RBFNN PA 91.41 44.03
RF400 UA
Undamaged RF 606 191 76.04
Damaged RF 23 77 77.00
RF PA 96.34 28.73
34
APPENDIX B
1. Algorithmic damage map for the RBFNN algorithm. Image courtesy of the DigitalGlobe Foundation.
2. Algorithmic damage map for the Random Forests algorithm. Image courtesy of the DigitalGlobe Foundation.


![Detection of Urban Damage Using Remote Sensing and …As early as 1998, object-based image analysis (OBIA) has been used to detect earthquake damage from remote sensing [9]. More recently,](https://static.fdocuments.us/doc/165x107/5e83254667b2fd44422a3055/detection-of-urban-damage-using-remote-sensing-and-as-early-as-1998-object-based.jpg)

![[REMOTE SENSING] 3-PM Remote Sensing](https://static.fdocuments.us/doc/165x107/61f2bbb282fa78206228d9e2/remote-sensing-3-pm-remote-sensing.jpg)


