carrot celery peas sweet potato Vegetable Word Mat potato ...

i
DETECTION OF SWEET POTATO VIRUSES IN WESTERN KENYA, DEVELOPMENT OF A MULTIPLEX PCR TECHNIQUE FOR SIMULTANEOUS DETECTION OF MAJOR VIRUSES AND
EVALUATION OF MEDICINAL PLANTS FOR ANTIFUNGAL AND ANTIBACTERIAL ACTIVITIES AGAINST THE CROP PATHOGENS
By
Sylvia Awino Opiyo
A thesis submitted in fulfillment of the requirements for the degree of Doctor of Philosophy in Chemistry.
Department of Chemistry
Maseno University
©2011

ii
DECLARATION
I hereby declare that this thesis is my original work and has not been submitted for award a
degree or any other award in any university. This thesis has been submitted for examination with
the approval of my supervisors.
Sylvia Awino Opiyo
Sign ------------------------------------------------ Date ----------------------------------------------
Reg. No. PG/PHD/006/07
Supervisors
Prof. Philip O. Owuor -------------------------- Date -----------------------------------------------
Department of Chemistry, Maseno University
Prof. Lawrence L.A.O. Manguro ---------------------------- Date --------------------------------
Department of Chemistry, Maseno University
Dr. Elijah M. Ateka ----------------------------------- Date ------------------------------------
Department of Horticulture, Jomo Kenyatta University of Agriculture and Technology

iii
ACKNOWLEDGEMENT
I would like to express special thanks to my supervisors, Prof. P.O. Owuor, Prof. L.A.O.
Manguro and Dr. E.M. Ateka for supervising this research, and for their invaluable advice and
encouragement during the time we have worked together. Many thanks go to Prof. Manguro for
carrying my isolates to Germany for spectroscopic analysis during his visit to Germany. I
acknowledge Dr. B.A. Nyende, the Director of Institute of Biotechnology Research (IBR), Jomo
Kenyatta University of Agriculture and Technology (JKUAT) for allowing part of the research to
be done in his laboratory. The staff of the Department of Chemistry, Maseno University and
research staff of the Department of Botany (Maseno University and JKUAT) are greatly
acknowledged for their time and expertise generously given during the research period. Special
appreciation is to my colleagues Mr. K. Bowa, Mr. C. Ochieng’, Ms. D. Akinyi and Ms H.W.
Karuri for their assistance, support and encouragement. Greatest thanks go to New Partnership
for Africa’s Development (NEPAD), Canadian International Development Agency (CIDA),
Biosciences Eastern and Central Africa Network (BecANet) and Higher Education Loans Board
(HELB) for financial support.
My most profound appreciation goes to my husband Peter Owiti Opiyo, my natural products
Jacqueline, Dixon and Linda and my mother (Mama Perez N. Opiyo) for their support, patience
and perseverance throughout my study period in which they missed my attention badly.

iv
DEDICATION
To my husband, Peter Owiti Opiyo and children Jacqueline, Dixon and Linda.

v
Abstract
Sweet potato is an important food crop worldwide since it is drought tolerant and acts as a famine relief crop. However, its production is limited by viral, fungal and bacterial infections. Lack of rapid and sensitive techniques for detection of infections inhibits their control. Use of synthetic chemicals to manage microbial infections causes is discouraged since they ar non-biodegradable. The aim of this study was to identify viruses infecting sweet potato in western Kenya, develop a multiplex PCR protocol for detection of major viruses of the crop, and evaluate efficacy of medicinal plants for antimicrobial activity against the crop pathogens. Symptomatic sweet potato vines obtained from farmers’ fields were testes for ten viruses using NCM-ELISA. The mPCR protocol for detection of SPFMV and SPCSV was optimized through variation of test parameters under standard PCR conditions. Extracts from Warburgia ugandensis, Elaeodendron schweinfurthianum and Terminalia brownii, which are traditionally used to manage microbial infections, were fractionated using chromatographic methods to obtain pure compounds. Structures of isolates were determined using spectroscopic and physical methods. Extracts and isolates were tested for antimicrobial activity against Alternaria spp, Aspergillus niger, Fusarium oxysporum, F. solanum, Rhizopus stolonifer (fungi), Ralstonia solanacearum and Streptomyces ipomoeae (bacteria). Five viruses namely SPFMV, SPCSV, SPMMV, SPCFV and CMV were detected. Eighty nine percent of samples had viral infection with over 80% showing multiple infections. Occurrence of CMV in Kenya was recorded for the first time. An mPCR protocol was successfully developed that detects SPFMV and SPCSV. Phytochemical studies afforded 26 compounds including 7α-acetylugandensolide that was isolated from W. Ugandensis for the first time. All the methanol, ethyl acetate and n-hexane extracts of the three plants were active against one or more of the test organisms. Methanol extract of W. ugandensis exhibited significantly higher activity (24.50 mm) than positive controls against R. stolonifer. Eighteen out of the twenty six compounds isolated exhibited antimicrobial activity against one or more of the test pathogens at concentrations ≤200 µg/ml. Polygodial, warbuganal, mukaadial, ugandensidial, ugandensolide, deacetoxyugandensolide and muzigadial, exhibited low MIC (MIC ≤ 50 µg/ml) against one or more pathogens that was comparable to those exhibited by standard drugs. This study provided a quantitative assessment of viruses infecting sweet potato in western Kenya and a simplified mPCR protocol for routine rapid detection of SPFMV and SPCSV. Scientific proof for the efficacy of extracts of W. ugandensis, E. schweifurthianum and T. brownii as antimicrobial agents against sweet potato pathogens and perhaps other crop pathogens was also provided.

vi
TABLE OF CONTENTS
PAGE
DECLARATION ……….…….……….…………….………………….....….........……. ii
ACKNOWLEDGEMENT................................................................................................. iii
DEDICATION ……………….………….……………………..….…......................…... iv
ABSTRACT ………………….……….…………….………….............................………v
TABLE OF CONTENTS …..............................................................................................vi
LIST OF ABBREVIATIONS AND ACRONYMS …………………………............…xiv
1.0 CHAPTER ONE: INTRODUCTION .................................................................1
1.1 Sweet potato.............................................................................................................1
1.2 Statement of the problem.........................................................................................5
1.3 Objectives of the study.............................................................................................6
1.4 Hypothesis ...............................................................................................................6
1.5 Justification of the study .........................................................................................7
2.0 CHAPTER TWO: LITERATURE REVIEW..................... ................................8
2.1 Origin and distribution of sweet potato ..................................................................8
2.2 Importance of sweet potato .....................................................................................8
2.3 Constraints to sweet potato production....................................................................9
2.3.1 Virus infection in sweet potato .............................................................................10
2.3.2 Fungal and bacterial infection in sweet potato .....................................................11
2.3.3 Management of sweet potato infections ...............................................................11
2.4 The use of plant extracts in disease management .................................................13
2.5 Plants and antimicrobial production .....................................................................15
2.6 Medicinal plants used in this study .......................................................................17
2.6.1 Warburgia ugandensis ..........................................................................................17
2.6.2 Elaeodendron schweinfurthianum ........................................................................21
2.6.3 Terminalia brownii ...............................................................................................25

vii
3.0 CHAPTER THREE: MATERIALS AND METHODS .............. ....................28
3.1 Establishment of the incidence and identity of sweet potato viruses.....................28
3.1.1 Survey of sweet potato viruses .............................................................................28
3.1.2 Serological analysis of sweet potato samples........................................................28
3.1.3 Total ribonucleic acid extraction from CMV infected samples ............................29
3.1.4 Reverse transcription and polymerase chain reaction (RT-PCR) .........................30
3.2 Development of a multiplex PCR technique for detection of SPFMV and
SPCSV...................................................................................................................30
3.2.1 RNA extraction from SPFMV and SPCSV infected samples ..............................30
3.2.2 Optimization of multiplex conditions ...................................................................31
3.2.3 Singlex PCR and RT-PCR assay ..........................................................................31
3.2.4 Multiplex PCR and RT-PCR assay .......................................................................32
3.2.5 Evaluation of the developed mRT-PCR protocol .................................................32
3.3 Phytochemical studies ...........................................................................................33
3.3.1 General experimental procedure ...........................................................................33
3.3.2 Collection of plant materials .................................................................................33
3.3.3 Preparation and solvent extraction of plant materials ...........................................34
3.3.4 Isolation of compounds from W. ugandensis ........................................................34
3.3.5 Isolation of compounds from E. schweinfurthianum ............................................39
3.3.6 Isolation of compounds from T. brownii ..............................................................41
3.4 Evaluation of antifungal and antibacterial activity of plant extracts ....................43
3.4.1 Isolation of spoilage fungi and bacteria from decayed sweet potato ....................43
3.4.2 Antifungal and antibacterial assay of crude extracts ............................................43
3.4.3 Antifungal and antibacterial assay of pure isolates and MIC determination ........44
4.0 CHAPTER FOUR: RESULTS AND DISCUSSION .......................................45
4.1 Viruses infecting sweet potato in western Kenya..................................................45
4.2 Multiplex PCR protocol for detection of SPFMV and SPCSV.............................50
4.3 Results from phytochemical studies......................................................................52
4.3.1 Identification of compounds from W. ugandensis.................................................52
4.3.2 Identification of compounds from E. schweinfurthianum.....................................75
4.3.3 Identification of compounds from T. brownie ......................................................87
4.4 Results from antifungal and antibacterial assay ...................................................91

viii
4.4.1 Antifungal activity of crude extracts and isolates..................................................91
4.4.2 Antibacterial activity of crude extracts and isolates .............................................96
5.0 CHAPTER FIVE:SUMMARY, CONCLUSSIONS AND
RECOMMENDATIONS...................................................................................101
5.1 Summary..............................................................................................................101
5.2 Conclusions..........................................................................................................103
5.3 Recommendations................................................................................................104
5.4 Suggestions for further studies.............................................................................104
REFERENCES ...........................................................................................................................106
APPENDICES ............................................................................................................................125

ix
LIST OF TABLES PAGE
Table 1: Virus-specific primer pairs used to amplify SPFMV and SPCSV in mPCR ..................31
Table 2: Proportion (%) of samples per district that reacted positive ............................................46
Table 3: Proportion (%) of sweet potato samples that reacted positive .........................................47
Table 4: 13C (90 MHz) and 1H (360 MHz) NMR data of compound 13 in CDCl3 ........................53
Table 5: 13C (90 MHz) and 1H (360 MHz) NMR data of compound 14 in CDCl3 ........................55
Table 6: 13C (90 MHz) and 1H (360 MHz) NMR data of 15 in CDCl3 ..........................................56
Table 7: 13C (90 MHz) and 1H (360 MHz) NMR data of compound 16 in CDCl3 ........................57
Table 8: 13C (90 MHz, CDCl3) and 1H (360 MHz) NMR data of compound 22 ...........................59
Table 9: 13C (90 MHz) and 1H (360 MHz) NMR data of compound 23 in CDCl3 ........................61
Table 10: 13C (90 MHz) and 1H (360 MHz) NMR data compound 101 in CDCl3 ........................62
Table 11: 13C (90 MHz) and 1H (360 MHz) NMR data compound 20 in CDCl3 ..........................64
Table 12: 13C (90 MHz) and 1H (360 MHz) NMR data compound 104 in CDCl3 ........................66
Table 13: 13C (90 MHz) and 1H (360 MHz) NMR data of compound 21 in CDCl3.......................68
Table 14: 13C (90 MHz) and 1H (360 MHz) NMR data of compound 17 in CDCl3 ......................69
Table 15: 13C (90 MHz) and 1H (360 MHz) NMR data of compound 19 in CDCl3 ......................71
Table 16: 13C (90 MHz) and 1H (360 MHz) NMR data of compound 102 in CDCl3 ....................72
Table 17: 13C (90 MHz) and 1H (360 MHz) NMR data of compound 103 in CDCl3 ....................74
Table 18: 13C (90 MHz) and 1H (360 MHz) NMR data of compound 63, 90 and 109 ..................78
Table 19: 13C NMR (90 MHz, CDCl3) of compounds 44, 106, 108 and 45 ..................................83
Table 20: 1H NMR (360 MHz) of compounds 44, 106, 108 and 45 .............................................84
Table 21: 13C (90 MHz, CDCl3) compounds 107 and 105 ............................................................86
Table 22: 13C NMR (90 MHz, CDCl3) data of compounds 110, 88 and 83 ..................................90

x
Table 23: Antifungal activity of crude extracts .............................................................................92
Table 24: Minimum inhibitory concentration of pure compounds ................................................95
Table 25: Antibacterial activity of crude extracts .........................................................................96
Table 26: Minimum inhibitory concentration (MIC, µg/ml) of pure compounds .........................99

xi
LIST OF FIGURES Page
Figure 1: Some virus symptoms observed on sweet potato plants......................................3
Figure 2: Some of the symptoms exhibited by microbial infections in sweet potato …….4
Figure 3: Proportion (%) of single and mixed virus infections detected ……….…….... 49
Figure 4: Electrophoresis profile of DNA amplified produc...................................……. 51
Figure 5: Proposed EIMS fragmentation pattern of compound 88 ...................................89
Figure 6: Comparative activity of methanol extracts …………………….................….. 93
Figure 7: Comparative activity of Blitox and extract of W. ugandensis…………..….... 93
Figure 8: Comparative antibacterial activity of E. schweinfurthianum extracts ……..….97
xii
LIST OF APPENDICES Page
Appendix A: Publications for this study .........................................................................125
Appendix B: A map showing the sampling areas............................................................126
Appendix C: Buffers for NCM-ELISA............................................................................126
Appendix D: Statistical analysis of antimicrobial activity..............................................126
Appendix 1: Spectra of compound 13.............................................................................137
Appendix 2: Spectra of compound 14.............................................................................140
Appendix 3: Spectra of compound 15.............................................................................143
Appendix 4: Spectra of compound 16.............................................................................146
Appendix 5: Spectra of compound 22.............................................................................148
Appendix 6: Spectra of compound 23.............................................................................151
Appendix 7: Spectra of compound 101...........................................................................154
Appendix 8: Spectra of compound 20.............................................................................157
Appendix 9: Spectra of compound 104...........................................................................160
Appendix 10: Spectra of compound 21...........................................................................163
Appendix 11: Spectra of compound 17...........................................................................166
Appendix 12: Spectra of compound 19...........................................................................169
Appendix 13: Spectra of compound 102.........................................................................171
Appendix 14: Spectra of compound 103.........................................................................174
Appendix 15: Spectra of compound 63...........................................................................177
Appendix 16: Spectra of compound 90...........................................................................179
Appendix 17: Spectra of compound 109.........................................................................182
Appendix 18: Spectra of compound 44...........................................................................185
Appendix 19: Spectra of compound 106.........................................................................188
Appendix 20: Spectra of compound 108.........................................................................191
xiii
Appendix 21: Spectra of compound 45...........................................................................194
Appendix 22: Spectra of compound 107.........................................................................197
Appendix 23: Spectra of compound 105.........................................................................199
Appendix 24: Spectra of compound 110.........................................................................201
Appendix 25: Spectra of compound 88...........................................................................204
Appendix 26: Spectra of compound 83...........................................................................207

xiv
LIST OF ABBREVIATIONS AND ACRONYMS
A niger Aspergellus niger
Altern spp Alternaria species
AP Alkaline Phosphate
BCIP 5-Bromo-4-Chloro-3-Indolyl Phosphate
bp Base pair
C NMR Carbon Nuclear Magnetic Resonance
cDNA Complementary deoxyribonucleic acid
CH2Cl2 Dichloromethane
CIP International Potato Centre
CMV Cucumber Mosaic Virus
COSY Correlation spectroscopy
C.V. Coefficient of variation
d Doublet
dd Doublet of doublet
DEPT Distortionless Enhancement of Polarization Transfer
DMSO Dimethyl sulfoxide
DNA Deoxyribonucleic acid
dNTP 2’, 3’- Deoxyribonucleoside-5’- phosphate
EIMS Electron Ionization Mass Spectroscopy
ELISA Enzyme-Linked Immunosorbent Assay
ESI-MS Electrospray Impact Mass Spectroscopy
EtOAc Ethyl acetate
EtOAc Ethyl acetate
F. oxy Fusarium oxysporum
F. sol Fusafium solani
FAO Food Agriculture Organization
NMR Nuclear Magnetic Resonance

xv
1H NMR Proton Nuclear Magnetic Resonance
HMBC Heteronuclear Multiple Bond Correlation
HMQC Heteronuclear Multiple Quantum Coherence
Hz Hertz
IR Infrared Spectroscopy
J Coupling constant
L.S.D. Least significant difference
m Multiplet
m/z Mass to charge ratio
M+ Molecular ion
MeOH Methanol
MeOH Methanol
MHz Mega Hertz
MIC Minimum Inhibitory Concentration
MS Mass Spectroscopy
NBT Nitroblue tetrazolium
n-Hex n-Hexane
NMR Nnuclear Magnetic Resonance
NOESY Nuclear Overhauser Effect Spectroscopy
PCR Polymerase Chain Reaction
PDA Potato Dextrose Agar
q Quartet
Rf Rate of flow
RNA Ribonucleic acid
RT-PCR Reverse Transcription Polymerase Chain Reaction
s Singlet
SPCaLV Sweet Potato Caulimo-Like Virus
SPCFV Sweet Potato Chlorotic Fleck Virus

xvi
SPCSV Sweet Potato Chlorotic Stunt Virus
SPFMV Sweet Potato Feathery Mottle Virus
SPLCV Sweet Potato Leaf Curl Virus
SPMMV Sweet Potato Mild Mottle Virus
SPMSV Sweet Potato Mild Speckling Virus
SPVD Sweet Potato Virus Disease
SPVG Sweet Potato Virus G
SwPLV Sweet Potato Latent Virus
t Triplet
Taq Thermophilus acquaticus
TBS Tris buffered saline
T-TBS Tris Buffered Saline supplemented with Tween-20
TLC Thin Layer Chromatography
UV Ultraviolet spectroscopy
δ Chemical shift
νmax Maximum wavelength of absorption

1
CHAPTER ONE
1.0 INTRODUCTION
1.1 Sweet potato
Sweet potato (Ipomoea batatas L.) is one of mankind’s highest yielding crops with higher
food value and total production per unit area than other staple crops such as maize, rice, sorghum
and millet (FAO, 2002). Worldwide, the importance of sweet potato is exceeded only by cereals
(wheat, maize, rice and barley) and potato (Solanum tuberosum) (Carey et al., 1997; FAO,
2002). Although the crop is grown in more than 100 countries around the globe, about 90% is
produced in Asia with just below 5% in Africa (Woolfe, 1992). Sweet potato serves as a staple
diet in many parts of Africa (Carey et al., 1996). China is the world’s highest producer with
annual harvest of 100 million tones followed by Uganda, Nigeria, Indonesia and Vietnam (FAO,
2002).
Sweet potato is adaptable to a wide range of agro-ecological conditions and performs
well in low - input agriculture (CIP, 1996). The production of the crop in Africa is concentrated
in East Africa around the Great Lake regions (Gibson et al., 1997). The presence and the
adaptation of sweet potato to the tropical areas where per capita incomes are generally low and
its nutritional value make the crop an important component in food production and consumption.
Sweet potato is an important food security and famine relief crop during seasons of crop failure
(CIP, 1998). The production of the crop can be staggered, while harvesting can be done in
piecemeal thereby ensuring continuous source of food for farm families.
In the last decade, the importance of sweet potato increased greatly in many African
regions due to frequent droughts and prevalence of pests and diseases which adversely affect the
production of staple food crops such as maize, cassava and banana (Thottappilly et al., 1993;
Otim-Nape et al., 2000; Tushemereirwe et al., 2004). Kenya is the seventh largest African sweet
potato producer with average yield of 8.2 tones /ha against a potential of 50 tons/ha (FAO, 2002;
2003). With the increasing population and diminishing arable land per house hold, there is a need
to increase sweet potato yields to meet the demand for the crop. The main sweet potato
producing regions of Kenya are western, eastern, central and coastal areas (MOA, 1999).

2
Despite its high potential for food security, production of sweet potato is constrained by
pests and diseases (Carey et al., 1997; Karyeija et al., 1998; Gibson and Aritua, 2002; Aritua et
al., 2007). Several viruses (Is Hak et al., 2003; Mukasa et al., 2003; Ateka et al., 2004; Tairo et
al., 2004; Miano et al., 2006), fungi and bacteria (Lenne, 1991; Skuglund et al.,1990; Clark and
Hoy, 1994; Onuegbu, 2002; Aritua et al., 2007; Osiru et al., 2007) infect the crop. Sweet potato
feathery mottle virus (SPFMV) is the most widespread in many parts of the world (Moyer and
Salazar, 1989; Nishiguchi et al., 1995; Sakai et al., 1997). When infecting alone, SPFMV seem
insignificant in its effects on sweet potato (Gibson et al., 1998; Karyeija et al., 2000). A greater
damage is realized when SPFMV infects sweet potato in the presence of Sweet potato chlorotic
stunt virus (SPCSV), leading to sweet potato virus disease (SPVD), the most harmful disease of
the crop (Geddes, 1990; Gibson et al., 1998; Gibson and Aritua, 2002). Some of the fungi and
bacteria associated with pathogenesis of sweet potato include Macrophomina phaseoli, Diplodia
gossypina, Monilochaetes infuscans, Alternaria spp, Aspergellus niger, Fusarium oxysporum, F.
solanum, Rhizopus stolonifer (Fungi), Ralstonia solanacearum, Streptomyces scabies, S.
ipomoea, Erwinia carotovora and E. chrysanthemi (bacteria) (Clark and Moyer, 1988; Skuglund
et al., 1990; Lenne, 1991; Ristaino, 1993; Clark and Hoy, 1994; Clark et al., 1998). Apart from
reducing the yield, these infections cause rotting of sweet potato in the field, during storage and
transportation, making the produce unpalatable (Person and Martin 1940; Clark and Moyer,
1988; Snowdown, 1991, Clark and Hoy, 1994; Clark et al., 1998). Some of the symptoms
exhibited by sweet potato infections are shown in Fig. 1 nd 2.
Lake Victoria Crescent has higher infection levels due to favourable climatic conditions
for the pathogens infection and disease development (Lenne, 1991; Skuglund et al., 1990; Aritua
et al., 2007; Osiru et al., 2007). However, information on viruses infecting sweet potato in
western Kenya is scanty.
Viral infections are mainly managed by prevention and controlling their spread (Aritua et
al., 1998; Gibson and Aritua, 2002; Ghosh and Aglave, 2007). Farmers use cultural practices
such as crop rotation, removal and destruction of infected plants as soon as they are detected
(Dent, 1995). Farmers also select relatively healthy vines as the parent of the next crop as a
control measure (Aritua et al., 1998; Gibson and Aritua, 2002). Such practices have not been
effective due to absence of visible symptoms (Gibson et al., 1998; Karyeija et al., 2000). Since
in most, cases viral infections co-exist, rapid and effective methods of multiple virus detection

3
will enable selection of ‘clean’ planting materials. A number of enzyme-linked immunosorbent
assays (ELISA) protocols have are uses for virus detection. However, the protocols are not
applicable unless antibodies specific to the virus being tested is available. Polymerase chain
reaction (PCR) technique is an alternative rapid method for virus detection. Several multiplex
PCR protocols have been developed for virus detection in other crops such as citrus and pepper
but there is none for detection of sweet potato viruses.
Fig. 1: Some virus symptoms observed on sweet potato plants (A) purpling of leaves in plants
infected with SPCSV, (B) symptomless leaves of plants infected with SPFMV, (C) vein
clearing in leaves of plants infected with SPMMV, (D) deformed leaves of plants infected
with SPFMV and SPCSV, (E) interveinal chlorosis in leaves of plants infected with
SPMMV, (F) chlorotic, small deformed leaves in plants infected with SPFMV and SPCSV,
(G) severe symptoms in plants infected with SPFMV, SPCSV, SPMMV and SPCFV, (H)
chlorotic spots on leaves of plants infected with SPFMV and SPMMV (Adapted from
Nyaboga et al., 2008).

4
B C
D E
A
F
G H I
Fig. 2: Some of the symptoms exhibited by microbial infections in sweet potato; (A) Healthy
roots, (B) Cross section of root with symptoms of Fusarium root rot (left) and Fusarium
surface rot (right), (C) Internal and external views of roots infected with black rot
(Ceratocystis fimbriata), (D) Roots with black rot lesions (left and right) and un-infected
roots (center), (E) Internal and external views of roots with Java black, rot (Diplodia
gossypina) at different stages of development (F) Sweet potatoes with symptoms of scurf
(Monilochaetes infuscans), (G) Internal views of root with charcoal rot (Macrophomina
phaseoli), (H) Internal and external views of roots infected with Rhizopus soft rot (R.
stolonifer) and (I ) Sweet potato with symptoms of bacterial soft rot (Erwinia chrysanthami)
(Adapted from Sikaro, 1995).

5
The use of synthetic chemicals to manage infections in crops is discouraged since they
are not easily biodegradable therefore accumulate in the environment and are gradually absorbed
into the food chain (Khanna et al., 1989). The use of biodegradable agrochemicals from natural
origin is an attractive possibility. A biological method of control is preferred in most cases
because it is selective with no side effect and it is usually cheap compared to the conventional
synthetic chemicals. Resistance to biological control is rare and biological control agents are
self-propagating and self-perpetuating (Okigbo and Ikediugwu, 2000; Okigbo, 2003, 2004,
2005). Extracts from medicinal plants are traditionally known to control diseases in plants and
tuber crops (Sivropou et al., 1997; Kim et al., 1998; Perez et al., 1999; Amadioha, 2003; Okigbo
and Emoghene, 2004; Okigbo and Nmeka, 2005). Extracts of Warburgia ugandensis, Terminalia
brownii and Elaeodendron schweinfurthianum are used in ethnomedicine to manage viral, fungal
and bacterial infections (Kokwaro, 2009; Wilson and Woldo, 1979; Heine and Brenzinger,
1988). Phytochemical studies of Warburgia, Terminalia and Elaendendron species have lead to
isolation of different compounds some of which have antimicrobial activities. Scientic proof for
the medicinal claims is lacking It is necessary to evaluate the extracts of these plants for their
possible use in managing infections of sweet potato.
1.2 Statement of the problem
Sweet potato is an important crop which acts as food security and famine relief crop.
However, its production is constrained by viral, fungal and bacterial infections. Information on
identity and distribution of viruses infecting in western Kenya is lacking. Effective methods of
detecting multiple virus infection are lacking. Effective methods of managing the fungal and
bacterial infections are lacking.
6
1.3 Objectives of the study
The aim of this study was to identify the viruses infecting ordinary sweet potato grown by
rural folk in western Kenya, develop a protocol for simultaneous detection of major viral
infections and investigate the efficacy of some tradidionally used medicinal plant extracts in the
management of fungal and bacterial infections of the crop.
The specific objectives were to:-
i. Determine the identity and distribution of viruses which infect sweet potato in
western Kenya.
ii. Develop a mPCR protocol for the simultaneous detection of SPFMV and SPCSV, the
most economically important viruses of sweet potato.
iii. Isolate and characterize the chemical constituents of W. ugandensis, E.
schweifurthianum and T. brownii.
iv. Evaluate the antimicrobial activity of Warburgia ugandensis, Elaeodendron
schweifurthianum and Terminalia brownii extracts against fungi and bacteria which
infect sweet potato.
v. Determine the antimicrobial principles from the plants.
1.4 Null hypotheses
i. No more viruses rather than the reported ones infect sweet potato in western Kenya
with possible multiple interactions.
ii. Multiplex PCR-based technique may not enable simultaneous detection of several
viruses.
iii. Medicinal plant extracts do not contain secondary metabolites which exhibit
antimicrobial activity against fungi and bacteria that infect sweet potato.

7
1.5 Justification of the study
Sweet potato is important root crop in developing countries since it is inexpensive and
rich source of carbohydrates, vitamins and essential minerals. It serves as an important source of
quality nourishment to the urban and rural people who live below the poverty line. Increased
cultivation of the crop is being encouraged in Africa, where vitamin A deficiency is a serious
health problem (http://en.wikipedia.org/wiki/Sweet_potato 5th June, 2010). However, the
production of sweet potato is limited by viral, fungal and bacterial infections (Carey et al., 1997).
Losses induced by these infections range from 1% to 100% (Gibson et al., 1998; FAO, 2002;
Gutierrez et al., 2003). Information on the identity and distribution of sweet potato viruses in
western Kenya, which is the main sweet potato producing region in the country, is scanty.
Since the control of viral diseases is largely preventive, reliable and rapid methods of
detection and diagnosis are neccessary. Enzyme linked immunosorbent assay (ELISA) such as
nitrocellulose membrane (NCM)-ELISA, double antibody sandwich (DAS)-ELISA and triple
antibody sandwich (TAS)-ELISA have been used routinely for virus detection. However, the
method is not applicable unless the antibody specific to the virus studied is available. Since the
viruses co-infect sweet potato leading to more severe infections (Mukasa et al., 2003; Ateka et
al., 2004; Tairo et al., 2004), a technique that allows simultaneous detection is highly called for.
There are reports of multiplex polymerase chain reaction (mPCR) systems for the detection of
two or even more plant viruses infecting crop plants (Ghosh and Aglave, 2007). However such
system for sweet potato has not been developed.
Synthetic chemicals have been used to control infections in crops (Clark and Moyer,
1988). However, the use of such chemicals apart from their potential danger to both human
health and environment (Cameron and Julian, 1984; Obagwu et al., 1997; Osman and Al-
Rehiayam, 2003; Masuduzzaman et al., 2008; Siva et al., 2008), are unaffordable for most
farmers. Moreover, resistance by pathogens to such chemicals has rendered some of them
ineffective (Cameron and Julian 1984; Zhonghua and Michailides, 2005). In order to fully
exploit the potential of the sweet potato crop, there is a need to search for affordable, readily
available, sustainable and environmentally friendly means of managing the problems posed by
these pathogens.
8
CHAPTER TWO
2.0 LITERATURE REVIEW
2.1 Origin and distribution of sweet potato
Sweet potato (Ipomoea batatas Lam) originated from Central and South America,
probably in the region between the Yucatan Peninsula of Mexico and the mouth of Orinoco
River in Venezuela (Onwueme, 1978). Its dissemination to Polynesia is associated with voyages
of early Peruvian or Polynesian explorers and traders. The crop was brought to Europe much
later, in the 14th century by Christopher Columbus, a Portuguese explorer, on his return journey
from South America. By the16th Century, the crop reached Africa, India and Eastern Asia
through the Portuguese traders and explorers (Onwueme, 1978).
2.2 Importance of sweet potato
Staple crops such as maize, rice, sorghum and millet do not match the yield per unit area
of sweet potato that also has higher food value (FAO, 2002). On a worldwide scale, the
importance of sweet potato is exceeded only by cereals (wheat, maize, rice and barley) and
potato (Solanum tuberosum) (Carey et al., 1997; FAO, 2002). Although the crop is grown in
more than 100 countries around the globe, about 90% is produced in Asia with just below 5% in
Africa (Woolfe, 1992). About 75% of African sweet potato production is concentrated in East
Africa, especially around Lake Victoria, where it is a basic subsistence crop, grown by rural
women near their homes to feed their families (Kapinga et al., 1995; Gibson et al., 1997; Gibson
and Aritua, 2002). The crop is dependable since it is drought tolerant and acts as food security
and famine relief crop during periods of crop failures (Karyeija et al, 1998). The presence and
the adaptation of sweet potato to the tropical areas where per capita incomes are generally low
and its nutritional value make the crop an important component in food production and
consumption. The importance of sweet potato increased greatly in many African regions due to
frequent droughts and prevalence of pests and diseases which adversely affect the production of
staple food crops (Thottappilly et al., 1993; Otim-Nape et al., 2000; Tushemereirwe et al., 2004).

9
Tuberous storage roots of sweet potato are generally eaten while steamed, baked, fried or
boiled (Carey et al., 1997). The crop is one of the most nutritionally complete foods, especially
useful in vegetarian dishes (www.recipes4us.co.uk, 12th July, 2010). Besides simple starches,
sweet potato is rich in carbohydrates, dietary fiber, beta carotene (a vitamin A equivalent
nutrient), vitamin C, and vitamin B6 (www.recipes4us.co.uk, 12th July, 2010). Important minerals
found in the crop include calcium, phosphorous, iron, sodium and potassium (Woolfe, 1992).
Young sweet potato leaves are also used as nutritious vegetables and are rich sources of vitamin
A, B2, iron and protein (Woolfe, 1992). Its vines are good dairy animal feed supplements because
of the high protein content and are easily digestible (www.recipes4us.co.uk,11th, 12th July, 2010;
www.cipotato.org/sasha/07, 11th August, 2010). Sweet potato is a very popular item of local and
regional trade especially in East and Central Africa regions (CIP, 1996; 1998). It is also a
potential source of raw material for industries which produce snacks, starch, flour, crisps dyes,
ethanol and spirits (CIP, 1996; 1998). Due to the numerous uses of sweet potato, there is a need
to improve its production in order to meet its demand.
2.3 Constraints to sweet potato production
Sweet potato withstands adverse climatic conditions better than most agricultural crops.
However, a wide range of pathogens such as fungi, bacteria, nematodes and viruses infect the
crop (Moyer and Salazar, 1989; Geddes, 1990; CIP, 1995; Carey et al, 1997). Apart from
reducing photosynthetic area and transport of nutrients, these diseases also cause rotting of tubers
both in fields and storage hence causing significant losses (Skoglund and Smit, 1994; Carey,
1996; Ristaino, 1993; Clark and Hoy, 1994; Clark and Moyer, 1988; Clark et al., 1998). The
persistence of high incidences of infections on sweet potato is attributed to use of infected
planting materials. The vegetative propagation, usually done using cuttings from a previous crop
to establish a new crop also increases the risk of build-up of the pathogens (Karyeija et al.,
1998). Search for effective method for managing the infections is necessary.

10
2.3.1 Virus infection in sweet potato
Among the biological factors, virus diseases rank second to weevil in causing yield
reduction in sweet potato (Karyeija et al., 1998; Gibson and Aritua, 2002). Several viruses have
been reported infecting sweet potato including Sweet potato feathery mottle virus (SPFMV),
Sweet potato chlorotic stunt virus (SPCSV), Sweet potato mild mottle virus (SPMMV), Sweet
potato chlorotic fleck virus (SPCFV), Sweet potato latent virus (SPLV), Sweet potato caulimo-
like virus (SPCa-LV), Cucumber mosaic virus (CMV), Sweet potato virus Y (SPVY), C-6,
Sweet potato virus G (SPVG), Sweet potato mild speckling virus (SPMSV) and Sweet potato leaf
curl virus (SPLCV) (Is Hak et al., 2003; Mukasa et al., 2003; Ateka et al., 2004; Tairo et al.,
2004; Miano et al., 2006). SPFMV, SPCSV, SPMMV, SPCFV and SPLCV have been detected
in some parts of East Africa (Miano et al., 2006). However, there is little information on the
distribution of sweet potato viruses in western Kenya, which is the main sweet potato producing
region in the country.
Sweet potato feathery mottle virus (SPFMV) is the most prevalent and widespread in
many parts of the world where sweet potato is cultivated (Moyer and Salazar, 1989; Nishiguchi
et al., 1995; Sakai et al., 1997). When infecting alone, SPFMV seem insignificant in its effects
on sweet potato (Gibson et al., 1998; Karyeija et al., 2000). A greater economic impact is
realized when SPFMV infects sweet potato in the presence of Sweet potato chlorotic stunt virus
(SPCSV), leading to sweet potato virus disease (SPVD), the most harmful disease of the crop in
Africa and elsewhere (Geddes, 1990; Gibson et al., 1998; Gibson and Aritua, 2002). In preveous
studies (Ateka, 2004; Ateka et al., 2004; Miano et al., 2006; Nyaboga et al., 2008), apparently
symptomatic plants tested negative in NCM-ELISA indicating that there are viruses in sweet
potato not yet identified. There is need for further tests to identify the unknown infections.

11
2.3.2 Fungal and bacterial infection in sweet potato
Several fungi are reported to be associated with reduction of yield and rotting of sweet
potato including Monilochaetes infuscans, Fusarium oxysporum, Ceratocysts fimbriata,
Rhizopus stolonifer, Macrophomina phaseolina, F. solani and Botryodiplodia theobromae
Alternaria spp. Penicillium spp, Certocystis fimbriata, Diaporthe batatalis, Aspergillus niger
and A. flavus have been implicated as fungi responsible for decay of Sweet potato roots (Clark
and Hoy, 1994; Onuegbu, 2002). Fungi associated with post harvest fungal rots to include
Mortierella ramanniana, Rhizopus stolonifer, Mucor pusillus, Botrytis cinerea, Erysiphe
polygoni and A. flavus (Oyewale, 2006).
Bacteria that cause infection in sweet potato include Agrobacterium tumefaciens, Erwinia
carotovora, E. chrisanthemi, Streptomyces scabies, S. acidiscabies and Ralstonia salanacearum
(Clark and Moyer, 1988; Ristaino, 1993; Clark and Hoy, 1994; Barton et al., 1997; Lemanga et
al., 1997; Clark et al., 1998). These pathogens invade the host through wounds and cracks and
sources of inocula include soil, infected mother plants or contaminated water and harvesting
equipments (Sikaro, 1995). The infections create local discolouration and disruption of
surrounding tissues of infected tubers (Snowdon, 1991), resulting in changes in appearance,
deterioration of texture and flavor, hence reduction in the market value and misfortune to farmers
(Person and Martin, 1940; Clark and Moyer, 1988; Clark et al., 1998). Search for effective
methods of cotroling these fungal and bacterial infections is necessary.
2.3.3 Management of sweet potato infections
Viral infections in plants are generally managed by prevention and controlling their
spread (Aritua et al., 1998; Gibson and Aritua, 2002; Ghosh and Aglave, 2007). Cultural
practices such as crop rotation, removal and destruction of plants as soon as they become
infected and eradication of sources of infection and inoculum are used to control the spread of
sweet potato diseases (Dent, 1995). Farmers also select relatively healthy vines as the parent of
the next crop as a control measure (Aritua et al., 1998; Gibson and Aritua, 2002). These cultural
methods of managing the crop infections have been ineffective since some infections do not
exhibit visible symptoms, making it impossible to select safe seeds or to employ cultural

12
methods of management. Availability of fast and effective methods of virus detection may
enable safe selection of clean planting materials and effective control of spread of the viruses.
While ELISA is used routinely for virus detection, the method is not applicable unless the
antibody for the virus studied is available. Secondly, the ELISA technique is only sensitive
during dry seasons of the year when the viruses concentrations in plant are high (Ghosh and
Aglave, 2007). Polymerase chain reaction (PCR) is an alternative rapid virus detection method.
Several singlex PCR (sPCR) – based methods have been reported for a number of sweet potato
viruses (Nishiguchi et al., 1995; Ki and Sun, 2002; Kokkinos and Clark, 2006). Since sweet
potato infecting viruses in East Africa mostly occur as multiple infections (Gibson et al., 1998;
Karyeija et al., 2000; Mukasa et al., 2003), availability of multiplex virus detection protocols
could lower the time and cost of detection. There are reports of multiplex PCR (mPCR) systems
for the detection of two or even more plant viruses infecting crop plants including rice, citrus,
pepper, grapes potato and sugar beets (Manifra and Hadidi, 1994; Nie and Singh, 2000; Bertolini
et al., 2001; Meunier et al., 2003; Periasamy et al., 2006; Bhat and Siju, 2007; Ghosh and
Aglave, 2007). However, there is no such system available for sweet potato.
Synthetic chemicals such as virazole [1], pyrazofurin [2], azaguanine [3], carbaryl [4],
dichloronitroaniline [5] and blitox (copper oxychloride) [6] are used to manage plant infections
(Lozoya et al., 1984; Clark and Moyer, 1988). Such chemicals pose adverse effects on
ecosystems and are possible carcinogenic risks (Cameron and Julian, 1984; Osman and Al-
Rehiayam, 2003; Masuduzzaman et al., 2008; Siva et al., 2008). Some of these chemicals are
not easily biodegradable therefore they accumulate in the environment and are gradually
absorbed into the food chain (Khanna et al., 1989). Furthermore, the synthetic chemicals are
costly and are out of reach of most subsistence farmers (Obagwu et al., 1997; Amienyo and
Ataga, 2007). It is necessary to search for affordable environmentally friendly antimicrobial
agents.

13
O
OH OH
HO
N
N
O
H 2N
O
OH OH
HO
HN
NOH
CONH 2
N
HN
HN N
N
O
H 2N
1 2 3
OCONHCH 3
ClCl
NO 2
NH 2
3Cu(OH)2.CuC l2
4 5
6
2.4 The use of plant extracts in disease management
The use of medicinal plants in managing diseases is widespread (Farnsworth, 1994). The
production of medicines and the pharmacological treatment of diseases began with the use of
herbs (Tyler, 1997). Other than for the purposes of scientific inquiry, plants have served as
models in drug development for three reasons. First, each plant is a unique chemical factory
capable of synthesizing a large number of highly complex and unusual chemical substances. In
United States of America, about 25 % of prescription drugs contain active principles that are still
sourced from higher plants and there is increasing popularity in the use of plant-derived
prescriptions (Farnsworth and Morris, 1976). The World Health Organization (WHO) estimates
that about 80% of the population of the developing countries relies exclusively on plants to meet
their healthcare needs (Farnswoth et al., 1986). Secondly, the biologically active substances
derived from plants have served as templates for synthesis of pharmaceutical formulations. Such
compounds may have poor pharmaceutical and toxicological profiles that may be improved
through derivatization. Thirdly, many highly active secondary metabolites from plants have been
instrumental as pharmacological tools to evaluate physiological processes (Farnsworth, 1984).

14
In Nigeria, plant extracts have been used to control fungal diseases in cowpea
(Amadioha, 2003), banana (Okigbo and Emoghene, 2004) and yam (Okigbo and Nmeka, 2005).
Galangin [7] isolated from Helichrysum aureonitens showed antiviral activity against HSV-1 and
Cox B1 (Meyer et al., 1997), while quercetin [8] which is widely distributed in the plant
kingdom exhibited activity against HIV (Kim et al., 1998; www.herbalextractsplus.com/
quercetin.cfm, 14th July, 2010; www.florahealth.com/flora/home /Canada/HealthInformation,
10th August, 2010). A triterpene lactone, lancilactone C [9] isolated from stems and roots of
Kadsura lancilimba inhibited HIV replication with an EC50 value of 1.4 mg/ml (Chen et al.,
1999). Essential oil extracted from aerial part of Salvia fructiosa exhibited virucidal activity
against Herpes Simplex Virus 1 and the active principles were found to be 1, 8-cineole [10],
thujone [11] and camphor [12] (Sivropou et al., 1997; Deans and Waterman, 1993).
O
OH
OOH
OH
R
O
O
O
OH
O O
O
7 R = H 8 R = OH 9
10 11 12
The essential oil of Melaleuca alternifolia was effective in decreasing local lesions of
tobacco mosaic virus (TMV) in Nicotiana glutinosa (Bishop, 1995). Extracts of Thuja
occidentallis and Psidium guajava inhibited the growth of bean common masaic virus (BCMV)
(Prasad et al., 2007) while the growth tomato mosaic virus in tomato (ToMV) was checked by
extracts from decomposed tomato plants (Avgelis and Morios, 1989). Essential oils from
Ocimum sanctum and Peperomia pellucida have inhibitory activity against cowpea mosaic virus
(CPMV), mung bean mosaic virus (MBMV), bean commonil mosaic virus (BCMV) and
southern bean mosaic virus (SBMV). Ocimum sanctum crude extracts concentration of 3,000
ppm yielded inhibition of 89.6, 90, 92.7, 88.2% against CPMV, MBMV, BCMV, and SBMV,

15
respectively. Other reports showed 62% inhibition against tobacco mosaic virus (TMV) by
essential oil from fresh carrot leaves (Khanna. et al., 1989) while Tagetes minuta oil was active
against carnation ring spot (CaRSV) and carnation vein mottle viruses (CaVMV) (Khanna et al.,
1989).
Seed extracts of Moringa oleifera exhibited antimicrobial activity against soil pathogens
namely Pasturella multocida, Escherichia coli, Bacillus subtilis, Staphylocuccus aureus,
Fusarium solani and Rhizopus solani (Jabeen et al., 2008). Water extracts of Alchornea
cordifolia, Annona muricata, Allium sativum, Gacinia cola and Zingiber officinale exhibited
antifungal activity against Aspergillus flavus, A. niger, Botryodiplodia theobromae, Fusarium
solani, Fusarium oxysporum and Rhizopus stolonifer which cause disease in sweet potato
(Amienyo and Ataga, 2007). In another study (Mekbib et al., 2007), crude extracts of medicinal
plants including Achyranthus aspera, Tribulus terrestris, Withania somnifera, Acacia seyal,
Dolichos oliver, Cissus quadrangularis and Mirabilis jalapa exhibited antimicrobial activity
against plant and food-borne pathogens namely Shigella sonnei, Staphylococcus epidermidis, S.
faecalis, Salmonella typhimurium, Pseudomonas syringae, Ralstonia solanacearum,
Xanthomonas campestris, Penicillium digitum, Geotrichum candidum and Phytophthora
nicotianae. Crude extracts of Ocimum gratissimum and Aframomum melegueta were active
against fungal pathogen namely Aspergillus niger, A. flavus, Fusarium oxsporium Rhizopus
stolonifer, Botryodiplodia theobromae and Penicillium chrysogenum which cause soft rot of yam
tuber (Okigbo and Ogbonnaya, 2006). The need to investigate the antifungal and antibacterial
activities of medicinal plant extracts against sweet potato pathogens is highly called for.
2.5 Plants and antimicrobial production
Plants have several ways of generating antimicrobial compounds to protect them against
pathogens (Kuc, 1990). External plant surfaces are often protected by biopolymers e.g. waxes
and fatty acid esters such as cutin and suberin. In addition, external tissues can be rich in
phenolic compounds, alkaloids, steroid glycoalkaloids and other compounds, which inhibit the
development of fungi and bacteria (Kuc, 1985). Cell walls of some monocotyledons contain
antimicrobial protein, referred to as thionins (Carr and Klessig, 1989).

16
Plant cells containing sequestered glycosides release them when ruptured by injury or
infection. These glycosides may have antimicrobial activity against the invading pathogens or
may be hydrolyzed by glycosidases to yield more active aglycones. In the case of phenolic
compounds, these may be oxidized to highly reactive, antimicrobial quinone and free radicals
(Kuc, 1985; Dean and Kuc, 1987). Thus, damage to a few cells may rapidly create an extremely
hostile environment for a developing pathogen. This rapid, but restricted disruption of a few cells
after infection can also result in the biosynthesis and accumulation of phytoalexins at sites of
infections (Kuc, 1985; Carr and Klessig, 1989; Dean and Kuc, 1987). Phytoalexins are degraded
by some pathogens and by the plant, thus they are transient constituents and their accumulation is
a reflection of both biosynthesis and degradation (Kuc, 1985). Biopolymers including lignin,
callose and suberin are often associated with the phytoalexin accumulation at the site of injury or
infection. These provide both mechanical and chemical restriction of development of pathogens
(Kuc, 1985; Carr and Klessig, 1989; Rao and Kuc, 1990). The macromolecules produced after
infection or certain forms of physiological stress include enzymes which can hydrolyze the walls
of some pathogens including chitinases and proteases (Carr and Klessig, 1989). Unlike the
phytoalexins and structural biopolymers, the amounts of these enzymes increase systematically
in infected plants even in response to localized infection. These enzymes are part of a group of
stress or infection-related proteins commonly referred to as pathogenesis-related (PR) proteins.
The function of many of these proteins is unknown. Some may be defense compounds while
others may regulate the response to infection (Carr and Klessig, 1989; Boller, 1987; Rao and
Kuc, 1990).
Another group of systematically produced biopolymer defense compounds comprises the
peroxidases and phenoloxidases (Hammerschmidt et al., 1982, Rao and Kuc, 1990). Both can
oxidize phenols to generate protective barriers to infection, including lignin. Phenolic oxidation
products can also cross-link to carbohydrates and proteins in the cell walls of the plants and fungi
to restrict further microbial development (Stermer and Hammerschmidt, 1987). Peroxidases also
generate hydrogen peroxide, which is strongly antimicrobial. Associated with peroxidative
reactions after infection is the transient localized accumulation of hydroxyl radicals and super
oxide anion, both of which are highly reactive and toxic to cells (Hammerschmidt et al., 1982,
Rao and Kuc, 1990).

17
Plants therefore have several mechanisms to counter antimicrobial attack. Some of the
antimicrobial compounds in plants may be exploited for use against fungal and bacterial
diseases. Plants have developed an arsenal of weapons to survive attacks by microbial invasions.
These include physical barriers as well as chemical ones, i.e. the presence or accumulation of
antimicrobial metabolites. These are either produced in plant (prohibitins) or are induced after
infection, the so-called phytoalexins. Since phytoalexins can also be induced by abiotic factors
such as UV irradiation, they have been defined as antibiotics formed in plants via a metabolic
sequence induced either biotically or in response to chemical or environmental factors (Grayer et
al., 1994).
When an infection or damage to plant takes place, a number of processes are activated
and some of the compounds produced become activated immediately whereas phytoalexins take
two to three days to be produced. Sometimes it is difficult to determine whether the compounds
are phytoalexins or prohibitins and moreover, the same compound may be antimicrobial in one
species and a phytoalexinin another (Grayer et al., 1994). Since the advent of antibiotics in
1950s, the use of plant derivative as antimicrobials has been virtually non-existence but the pace
is rapidly on the increase as we begin to realize the need for new and effective treatments. Since
the use antimicrobial principles from natural origin is environmentally safe and resistance is rear,
further such geared towards identification of more of such principles is necessary.
2.6 Medicinal plants used in this study
2.6.1 Warburgia ugandensis
The genus Warburgia (Conellaceae) consists of two species widely distributed in East
Africa, namely W. stuhlmanii Engl. and W. ugandensis. W. ugandensis Sprague is one of the
most highly utilized medicinal plants in tropical and subtropical Africa and is now highly
endangered in the wild (Kioko et al., 2005). It is rated as the second highest priority medicinal
plant species in Kenya (Kariuki and Simiyu, 2005). Dried bark of the tree is commonly chewed
and the juice swallowed as a remedy for stomach ache, constipation, toothache, venereal
diseases, cough, fever, muscle pains, weak joints and general body pains (www
Worldagroforetsrycentre. org/sea/products/AFDbases/af/asp/ Specie sInfo, 12th June, 2010). The
leaf decoction baths are used as a cure for skin diseases while the bark, roots or leaves can be

18
boiled in water and drunk to treat malaria, although this causes violent vomiting (Kokwaro,
2009). In addition, the leaves of W. ugandensis are sometimes used locally as a spice for food.
Warburgia plants are characterized by the presence of drimane sesquiterpenes (Kioy et
al., 1990a; 1990b; Mohanlall and Odhiv, 2009; Xu et al., 2009a). Some of the sesquiterpenes
isolated from the plants include polygodial [13], warbuganal [14], mukaadial [15], ugandensidial
[16], cinnamolide [17], 9α, 11α-dihydroxycinnamolide [17a], 9α, 11α-dihydroxy-6β-
acetylcinnamolide [17b], 9α-hydroxycinnamolide [17c], 11α-hydroxycinnamolide [17d],
cinnamolide-3β-ol [18], cinnamolide-3β-acetate [19], ugandensolide [20], deacetylugandensolide
[21], muzigadial [22], 6β-hydroxymuzigadial [23], muzigadiolide [24] dendocarbins L [25] and
M [26] (Kubo et al., 1976; 1977; Kioy et al., 1989; 1990a; 1990b; Mashimbye et al., 1999;
Manguro et al., 2003a; 2003b; Wube et al., 2005; Clarkson et al., 2007; Xu et al., 2009a) .
Drimane-type sesquiterpenes glycosides; mukadial 6-O-β-D-glucopyranoside [27] and mukadial
6-O-α-L-rhamnoside [28] were isolated from the methanolic leaf extract of W. stuhlmannii
(Manguro et al., 2003b).
O
CHO
CHO
R2
R2
O
R1
R1
R1 R213 H H14 OH H15 OH OH16 OH OAc
R1 R2 R3 R417 H H H H17a H OH OH H17b H OH OH OAc17c H OH H H17d H H OH H18 OH H H H 19 OAc H H H
R3
H
R4
H

19
O
O
OR
O
O
OH
CHO
CHO
R
OH
20 R =Ac21 R- H
22 R = H23 R = OH 24
H H
H
H
O
O
OH
R
25 R = Beta OH26 R= Alpha OH
CHO
CHO
OR
OH
27 R = Glu28 R = Rha
H H
Flavonoids and flavonol glycosides including Kaempferol [29], kaempferol 3-glucoside
[30], kaempferol 3-rhamnoside [31], kaempferol 3-arabinose [32], kaempferol 7-glucoside [33],
kaempferol 3-rhamnoside 7, 4ʹ-digalactoside [34], kaempferol 3, 7, 4ʹ-triglucoside [35],
kaempferol 3-rhamnoside 4ʹ-galactoside [36], quercetin [37], quercetin 3-glucoside [38],
quercetin 3-rhamnoside 7, 4ʹ-digalactoside [39], quercetin 3-rhamnoside [40], myricetin [41],
myricetin 3-galactoside [42] and myricetin 3-rhamnoside [43] (Manguro et al., 2003a; 2003b).

20
O
OOH
OR1
OR3
OR5
R4
R2
R1 R2 R3 R4 R5 29 H H H H H 30 H H H H Glu 31 H H H H Rha 32 H H H H Ara 33 Glu H H H H 34 Gal H Gal H Rha 35 Glu H Glu H Glu 36 H H Rha H Rha 37 H OH H H H 38 H OH H H Glu 39 Gal OH Gal H Rha 40 H OH H H Rha 41 H OH H OH H 42 H OH H OH Gal 43 H OH H OH Rha
Extracts from Warburgia species have been reported to exhibit numerous biological
activities including antibacterial, antifungal, antiviral activity and trypanocidal effects (Kubo and
Nakanishi, 1979; Kioy et al., 1990a; Wube et al., 2005; Clarkson et al., 2007; Mbwambo et al.,
2009). Crude extract from stem bark of W. ugandensis showed activity against Mycobacterium
tuberculosis H37Rv and M. Bovis BCG Pasteur (Madikane et al., 2007). A study (Rugutt et al.,
2006) showed that crude extracts from leaves and stem bark of W. ugandensis to be active
against soil pathogens namely Fusarium oxysporum, Alternaria passiflorae, and Aspergillus
niger. Olila et al. (2001; 2002) demonstrated that this plant has both anitiviral, antibacterial and
antifungal activities. Some of the antimicrobial principles from Warburgia species include
polygodial [13], warbuganal [14] and muzigadial [22] (Kioy et al., 1990a; Wube et al., 2005;
Rugutt et al., 2006). However, there is little or no work on the evaluation of efficacy of extracts
Warburgia species in the management of plant pathogens especially plant fungal and bacterial
infections.

21
2.6.2 Elaeodendron schweinfurthianum
Elaeodendron species are used widely for a number of medicinal applications. For
example, Kokwaro (2009) reported that dry powdered roots of E. schweinfurthianum are used in
the management of wounds and primary symptoms of syphilis. Chewing of the plant has been
said to cure diarrhoea. On the other hand, ingestion of E. schweinfurthianum leaves, fruits or
bark is said to cause sudden death. The genus is characterized by the presence of terpenoids,
(Anjaneyulu and Rao, 1980b; Weeratunga et al., 1982; Weeratunga and Kumar, 1985; Kubo et
al., 1990), steroids (Shimada et al., 1982; Yasuko et al., 1985) and flavonoids (Weeratunga et
al., 1985).
Friedooleanane derivatives; friedelin [44], canophyllal [45] canophyllol, [46], 28-
acetoxycanophyllol [47], methylfriedoolean-3-one-28-oate [48], friedelan-3-one-25-al [49], 25-
hydroxyfriedelin [50], 25-acetoxyfriedeline [51], elaeodendrol [52] and elaeodendadiol [53]
were isolated from root bark of E. glaucum (Anjaneyulu and Rao, 1980a). Weeratunga and
Kumar (1985) isolated 25, 28-dihydroxyfriedoolean-3-one [54], 25-hydroxy-3-oxofriedoolean-
28-al [55] and friedoolean-5-ene-3β, 29-diol [56] from the root bark of E. balae. In other studies
(Kubo et al., 1990; Anjeneyulu and Rao, 1980b), elabunin [57], lupeol [58] and its derivatives;
betulin [49], 23-hydroxybetulin [60] and betulinic acid [61] were isolated from E. buchananii. A
sesquiterpene of the eudesmane type, with five hydroxyl functions, mutangin [62] was isolated
from E. buchananii (Tsanou et al., 1993).
O
R1
R2
R1 R244 Me Me45 Me CHO46 Me CH2OH47 Me CH2OAc48 Me OAc49 CHO Me50 CH2OH Me51 CH2OAc Me52 Me OH53 CH2OH Me54 CH2OH CH2OH55 CH2OH CHO

22
HO
CH2OH
OH
O 5756
R 2
R 1 R 1 R258 M e M e59 M e O H60 O H O H61 M e C O2M e
AcO
OBz
OAc
O
M e
CH 2OBz
M e
Me
OAc
62
Phytochemical studies of Elaeodendron species resulted into the isolation of β-sitosterol
[63], sitosterol-3β-glucoside [64], Buchaninoside [65] (Yasuko et al., 1995), elaeodendroside A,
D, E, F, G, I, J, H, O, B and C [66 - 76] and elaeodendrogenin [77] (Shimada et al., 1982).
Elaeocyanidin [78] ourateacatechin [79] and ouratea-proancyanidin A [80] were isolated
from ethyl acetate extract of the root bark of E. balae (Weeratunga et al., 1985).

23
RO63 R = H64 R = Glu
O
OOHO
OMeOH
OH
O O
OAc
O
65
R1 R2 R3
156 O α OH, H H2
157 H2 H2 H2
158 H2 H2 β OAc, H
159 β OH, H α OH, H H2
160 α OH, H α OH, H H2
161 H2 α OH, H H2
162 α OH, H O H2
O
OOHO
OO
OH
O O
O
OO
ROH
OH
O O
OAc
R
73 R = H74 R = OH 75 R = Alpha OMe
76 R = Beta OMe
O
O
O
O
O
O
O
OH
R1
R2
R3

24
O O
AcO
HO77
O
O
HO
OH
Me
Me
OH
OMe
OH
78
OHO
HO
OH
OH
OMe
OH
OHO
HO
OH
OH
OHO
HO
OH
OH
OMe
OH
79 80

25
Previous biological activity studies of Elaeodendron species showed that their extracts
are cytotoxic. In a study by Shimada et al. (1982), ethanol extract of seeds of E glaucum showed
inhibitory in-vitro activity against cells derived from human nasopharynx carcinoma. The
cytotoxic compounds from E glaucum are elaeodendroside A, D, E, I, and O, compounds 66, 67,
68, 71, 74 and lupeol [58] (Shimada et al., 1982; 1985; Kupchan et al., 1977). Phytochemistry,
antifungal and antibacterial activities of E. scweifurthianum have not been reported.
2.6.3 Terminalia brownii
Terminalia brownii Fries (Combretaceae) is found in many parts of Africa and it has
different uses. The leaves are used by traditional healers in Tanzania to control diarrhoea and
stomach ache, gastric ulcers, colic, and heartburn (Mbuya et al., 1994; Fyhrquist et al., 2002). In
the Democratic Republic of Congo barks from the stems, branches, and trunks are used to
manage urogenital infections, urethral pain, endometritis, cystitis, leucorrhoea, syphilis, and
gonorrhoea (Dhetchuvi and Lejoly, 1990). Traditional healers in Kenya use leaves of the plant to
treat malaria (Heine and Heine, 1988). The decoction of the stem bark, trunk and branches is
taken orally to treat dysmenorrhoea, nervosity, hysteria, epilepsy, beriberi, dyspepsia,
stomachache, gastric ulcers, and colitis (Lindsay and Hepper, 1978; Fyhrquist et al., 2002). Stem
barks are chewed to treat cough and as emetic, infusion of barks and leaves are mixed with meat
to treat hepatitis (Timberlake, 1987). Traditional healers in Ethiopia use the stem and barks to
treat jaundice, hepatitis, liver cirrhosis, and yellow fever (Kokwaro, 2009; Wilson and Woldo,
1979; Heine and Brenzinger, 1988).
Phytochemical studies of some Terminalia species have reported the presence of
terpenoids and flavonoids (Reddy et al., 1994; Fayez and Mahmoud, 1998; Garcez et al., 2006;
Cao et al., 2010). Terpenoids previously isolated from Terminalia species include arjunic acid
[81], arjunetin [82], arjungenin [83], arjunglucoside I [84], arjunolic acid [85], arjunlucoside II
[86], 23-galloylarjunglucoside II [87], betulinic acid [88], ursonic acid [89] (Kong et al., 1954;
Row et al., 1970; Honda et al., 1976a; 1976b; Tsuyuki et al., 1979; Anjaneyulu and Rama, 1982;
Reddy et al., 1994; Pettit et al., 1996; Conrad et al., 1998; Singh et al., 2004; 2008; Garcez et
al., 2006; Haque et al., 2008). Steroids such as sitosterol [63] and stigmasterol [90] were
reported from the species (Garcez et al., 2006; Haque et al., 2008).

26
HO
HO
R3
COOR2
R1
HO
HO
CH2
COOGlu
OH
OH
O O
HO
87
R1 R2 R381 OH H CH382 OH Glu CH383 OH H CH2OH84 OH Glu CH2OH85 H H CH2OH86 H Glu CH2OH
HO
CO2H
OH
CO2H
88 89
HO
90

27
Flavonoids isolated from Terminalia species include naringenin-4́, 7-dimethyl ether [91],
isosakuranetin [92], naringenin [93], liquiritigenin-4́ , 7-dimethyl ether [94], liquiritigenin-4́ -
methyl ether [95], liquiritigenin-7-methyl ether [96], sukuranetin [97], 7, 4́-dimethyl 3́-
methylflavone [98] and two chalcones [99 and 100] (Sharma et al., 1982; Garcez et al., 2006).
Biological activities of Terminalia species include antifungal, antibacterial (Dwivedi and
Udupa, 1989; Conrad et al., 1998; Moshi and Mbwambo, 2005; Mbwambo et al., 2007; Singh et
al., 2008), antioxidant, antitumor (Garcez et al., 2006), feeding deterrent and growth inhibitor
(Singh et al., 2004). Singh et al (2008) reported the antimicrobial principles to be arjunic acd
[81], arjungetin [82] and arjungenin [83]. Phytochemistry, antifungal and antibacterial activities
of T. brownii have not been reported.
OR2O
R1 O
OR3
OHO
OH
OMe
98
R1 R2 R3
91 OH CH3 CH392 OH H CH393 OH H H94 H CH3 CH395 H H CH396 H CH3 H97 OH CH3 H
R1O
OH O
OR2
R1 R2
99 H H100 CH3 H
28
CHAPTER THREE
3.0 MATERIALS AND METHODS
3.1 Establishment of the incidence and identity of sweet potato viruses in
western Kenya
3.1.1 Survey of sweet potato viruses
In western Kenya, sweet potato is widely grown in Bungoma, Busia, Kakamega, Teso
and Vihiga districts in Western Province which lie between latitude 0° 30' N to 0° 58' S and
longitude 33° 58' E to 35° 38' E; Homa Bay, Kisii, Kisumu, Rachuonyo and Siaya districts in
Nyanza Province located between latitude 0° to 1°' N and longitude 33° 55' E to 35° 38' E
(Appendix B). A survey was conducted in sweet potato fields in the ten districts in April 2009 as
previously described (Tairo et al., 2004). Sweet potato fields with a 3 to 5-month-old crop were
randomly sampled along rural roads or paths at approximately 2-5 km intervals. A total of 327
vines from symptomatic ordinary sweet potato plants were collected and transferred to Jomo
Kenyatta University of Agriculture and Technology (JKUAT), Department of Horticulture where
they were planted in 15-20 cm diameter pots in sterile soil (solar sterilization) enriched with
diammonium phosphate fertilzer in an insect-proof screenhouse and watered regularly. Plants
were sprayed regularly with Malathion against aphids and whiteflies to avoid virus spread among
the plants. The samples were tested for virus infections after one month.
3.1.2 Serological analysis of sweet potato samples
Symptomatic sweet potato samples collected during the survey were subjected to
serological testing for SPFMV, SPCSV, SPMMV, SPCFV, SPMSV, SPCa-LV, SPLV, C-6,
SPVG and CMV using nitrocellulose membrane enzyme-linked immunosorbent assay (NCM-
ELISA) using standard NCM-ELISA kit obtained from the International Potato Center, CIP,
Lima, Peru (Gibb and Padovan, 1993). The Kit contained polyclonal antibodies specific to
SPFMV, SPCSV, SPMMV, SPCFV, SPMSV, SPCa-LV, SPLV, C-6, SPVG and CMV as well
as negative and positive controls.

29
Three leaf discs (1–cm diameter) from a composite sample of three leaves taken from
different points (bottom, middle and top) of sweet potato plant (one month old) were ground in 1
ml of extraction buffer (Appendix C) in plastic bags. The ground sample was allowed to stand
for 30 – 45 minutes at room temperature for the sap to phase out. Using a clean pipette each
time, 15 µl of clear supernatant of each sample was blotted at the center of a square made on the
nitrocellulose membrane. The membrane was allowed to dry at the room temperature for about
15 – 30 minutes. Once dry, the membrane was immersed in 30 ml blocking solution (Appendix
C) in a Petri dish for 1h. The blocking solution was discarded and the membrane immersed in a
Petri dish with the primary antibody diluted (1:1000, v/v) in antibody solution. The membrane
was then incubated at room temperature overnight, with a constant agitation on an orbital shaker
(50 rpm). The primary antibody solution was discarded and unbound antibodies removed from
the membranes by washing with constant agitation in T-TBS (Appendix C) four times for three
minutes each time at 100 rpm. The membranes were then immersed in 30 ml of goat anti–rabbit
alkaline phosphatase (GAR – AP) solution (1:1000 v/v) in a Petri dish for 1h. The substrate
solution, nitro blue tetrazolium chloride / 5-bromo-4-chloro–3– indolyl phosphate (NBT/BCIP),
was added and the reaction allowed to proceed for 30 min at room temperature. Positive and
negative reactions were determined by visual assessment with different grades of purple colour
indicating positive reactions. The substrate solution was discarded after 30 min of incubation and
membranes washed twice with distilled water to stop any further colour development.
3.1.3 Total ribonucleic nucleic acid extraction from Cucumber mosaic virus
(CMV) infected samples
Fresh young leaf tissue (100 mg) was ground to fine powder in liquid nitrogen using a
mortar and pestle. Total RNA was extracted from leaves of sweet potato samples determined to
be infected with CMV from the serological analysis and from a healthy control. The RNA was
extracted using RNeasy® Plant Mini Kit (Qiagen Inc., Valencia, CA) according to the
manufacturer’s instructions (Qiagen, 2006). The integrity of the extracted RNA was evaluated by
electrophoresis in 1% agarose gel stained with ethidium bromide (Sigma). Total RNA was
amplified using CMV-specific primers, 5'-GCC GTA AGC TGG ATG GAC AA- 3' and 5'-TAT
GAT AAG AAG CTT GTT TCG CG-3' forward and reverse primers, respectively (Wylie et al.,
1993). The primers were synthesized by Sigma, Life Sciences Corporation (Germany).

30
3.1.4 Reverse transcription and polymerase chain reaction (RT-PCR)
Reverse transcription (RT) was performed in 18.8 µl reaction mixture using Omniscript®
Reverse Transcription Kit according to the manufacturer’s instructions (Qiagen, 2004). Three (3)
µl of total RNA (1 µg/µl), 0.2 µl of reverse primer, 0.3 µl of random primer and 9.5 µl of RNase-
free H2O were incubated at 70 ºC for 10 min then cooled in ice. For the first strand cDNA
synthesis, 2.0 µl of 10x strand buffer, 0.3 µl of 10 mM dNTP mix, 0.5 µl of Omniscript® Reverse
Transcriptase (Qiagen Inc., Valencia, CA), 0.5 µl of RNase inhibitor and 2.5 µl of RNase - free
H2O were added to the reaction tube and the mixture further incubated at 42 ºC for 1 h. PCR was
performed using the Taq PCR Master Mix Kit according to the manufacturer’s protocol (Qiagen,
2002). PCR reaction mixture, 20.0 µl, consisted of 10.0 µl of PCR Master Mix (containing 25nM
MgCl2, dNTP mix 10 mM each, Taq polymerase and 10x QIAGEN PCR buffer), 4.0 µl of Q –
Solution (Qiagen), and 0.3 µl each of forward and reverse primer, 1.0 µl of cDNA (1 µg/µl) and
4.4 µl of RNase free H2O was prepared. PCR was carried out using the following cycling
conditions: one cycle at 95 ºC, 5 min for initial denaturation followed by 35 cycles 96 ºC, 5 sec
for denaturation, 61 ºC, 5 sec for primer annealing and 72 ºC, 30 sec for extension and a final
extension at 72 ºC for 1 min. PCR products were analyzed by electrophoresis using 1% agarose
gel stained with ethidium bromide and DNA bands were visualized under UV light (254 nm).
3.2 Development of a multiplex PCR technique for detection of SPFMV and
SPCSV
3.2.1 RNA extraction from SPFMV and SPCSV infected samples
Total RNA was extracted from leaves of sweet potato samples infected with both
SPFMV and SPCSV and a healthy control using RNeasy® Plant Mini Kit (Qiagen Inc.,
Valencia, CA) according to the manufacturer’s instruction (Qiagen, 2006). Two sets of primers
specific to SPFMV and SPCSV (Table 1) were developed and obtained from a commercial
source (Sigma, Life Sciences Corporation, Germany). The SPFMV primers were designed from
highly conserved regions of the SPFMV strains prevalent in East Africa namely the East African
strain (SPFMV-EA), ordinary strain (SPFMV-O), and the common strain (SPFMV-C) ( Ateka,
2004; Mukasa et al., 2003).

31
Table 1: Virus-specific primer pairs used to amplify SPFMV and SPCSV in
mPCR
Virus Primer name Primer /Sequence Expected product size (bp)
SPFMV SPFMV-F
SPFMV-R
5'-GGACGAGACACTAGCAA-3'
5'-TTCTTCTTGCGTGGAGACGT-3'
703
SPCSV SPCSV-F
SPCSV-R
5'-ACGTTGGTTGGCGTTGA-3'
5'-ATCTGCGGGAACTGACACG-3'
235
3.2.2 Optimization of multiplex conditions
The reactions were optimized by varying the amount of complementary DNA (cDNA)
template of each target. Optimization was carried out by methodical variation of test parameters
under standard PCR conditions. The cDNA template amounts tested ranged from 1.0 to 3.0 µg
per PCR reaction mix of 20 µl and 40 µl for singlex PCR (sPCR) and mPCR, respectively. The
annealing temperature ranged from 60 to 63 °C whereas the number of cycles ranged from 30 to
35.
3.2.3 Singlex PCR and RT-PCR assay
The designed specific primer sets of SPFMV and SPCSV were tested against templates
of RNA extracted from leaves of sweet potato plants showing SPVD symptoms separately in
Singlex PCR (sPCR). Reverse transcription (RT) was performed using Omniscript® Reverse
Transcriptase according to the manufacturer’s protocol (Qiagen, 2006). Reverse primers,
SPFMV-R and SPCSV-R (Table 1) specific to SPFMV and SPCSV, respectively were used.
DNA amplification was performed using the Qiagen’s Taq PCR Master Mix Kit (Qiagen)
following the manufacturer’s instructions(Qiagen, 2002). PCR was carried out using the
following parameters: initial denaturation at 95 ºC, 5 min followed by 35 cycles 96 ºC, 5 sec for
denaturation, 63 ºC, 5 sec for primer annealing and 72 ºC, 30 sec for extension and a final
extension at 72 ºC for 1 min.

32
3.2.4 Multiplex PCR and RT-PCR assay
The mPCR, similar to the sPCR, consisted of a two step reaction procedure which
included reverse transcription followed by PCR amplification. Total RNA was subjected to
cDNA synthesis in a 19.0 µl as follows: Three µg of total RNA, 0.2 µl each of SPFMV-R and
SPCSV-R primers (Table 1), 0.3 µl of random primer and 9.5 µl of RNase free H2O were
incubated at 70 ºC for 10 min. To the reaction mixture, 2.0 µl of 10x strand buffer, 0.3 µl of 5
mM dNTP mix, 0.5 µl of Omniscript® Reverse Transcriptase (Qiagen), 0.5 µl of RNase inhibitor
and 2.5 µl of RNase free H2O were added. The resulting master mix was incubated at 42 ºC for 1
hr followed by 70 ºC for 10 min. The mPCR reaction mixture consisted of 1.0 to 3.0 µg of the
synthesized cDNA (containing cDNA for SPFMV and SPCSV), 20 µl PCR Master Mix
(Qiagen), 0.3 µl of each of the two set of primers, 8.0 µl of Q-Solution (Qiagen), and the final
volume made up with RNase free H2O. The mPCR was performed using the following
parameters; initial denaturation at 95 ºC for 5 min followed by 30 - 35 cycles 96 ºC, 5 sec for
denaturation; 60 – 63 ºC, 5 sec for primer annealing and 72 ºC, 30 sec for extension and a final
extension at 72 ºC for 10 min to determine the annealing temperature for the two primers.
3.2.5 Evaluation of the developed mRT-PCR protocol
Thirteen symptomatic and one healthy sweet potato samples collected from farmers’
fields were tested for SPFMV and SPCSV infection using the developed protocol. Two µg of
cDNA template was used in the PCR under the following parameters: one cycle at 95 ºC for 5
min followed by 35 cycles 96 ºC, 5 sec for denaturation; 63 ºC, 5 sec for primer annealing and 72
ºC, 30 sec for extension and a final extension at 72 ºC for 10 min.

33
3.3 Phytochemical studies of W. ugandensis, E. schweinfurthianum and T.
brownii plants
3.3.1 General experimental procedure
Melting points were determined on a Gallenkamp (Loughborough, UK) melting point
apparatus and are uncorrected. Distilled solvents were used for extraction and chromatographic
separations. Analytical thin layer chromatograms (TLC) were run on 0.2mm thick layer of silica
gel, Merck. Column chromatography was performed on silica gel 70-230 mesh (Sigma). The UV
spectra were run on Pye Unicam SP8-150 UV/visible spectrophotometer (Cambridge, UK. IR
data were recorded on a Perkin-Elmer FTIR 600 series spectrophotometer (Waltham, MA,
USA). The NMR data were measured in CDCl3 and CDCl3-DMSO-d6 on a Bruker NMR
ultrashield TM (Darmstadt, Germany) operating at 360 and 90 MHz 1H and 13C for, respectively.
The MS data were obtained on a Varian MAT 8200A instrument (Bremen, Germany).
3.3.2 Collection of plant materials
The stem bark of W. ugandensis was obtained from species grown near St. Mary’s Hospital
along Nakuru-Gilgil highway (latitude 0° 24' 42.49'' S and longitude 36° 15' 10.59'' E) in
August 2008. E. schweinfurthianum stem bark was collected from Shimba Hills (latitude 4°
15' 53.84'' S and longitude 39° 22' 19.61'' E) in September 2008. Stem bark of T. brownii was
collected near Kindu Bay Mission Hospital along Kendu Bay - Oyugis road (latitude 0° 22'
22.00'' S and longitude 34° 39' 09.05'' E) in November 2008. The collection process of the
various plant specimens was supervised by Mr. Mutiso of the Department of Botany,
University of Nairobi. Identification of the plants was done at the Kenya National Museum
and at the Department of Botany, University of Nairobi herbaria after comparison with
authentic samples. Warburgia ugandensis (2008/08/01/SAO/CHEMMK), E.
schweinfurthianum (2008/09/04/SAO/CHEMMK) and T. brownii (2008/11/15/SAO/
CHEMMK).

34
3.3.3 Preparation and solvent extraction of plant materials
Plant materials were cut into small pieces and air-dried for one month under a shade. The
material specimens were ground into fine powder in readiness for extraction. The sample
preparation and extraction procedure were carried out as described by Harbone (1994). Cold
sequential extraction was done with distilled organic solvents of increasing polarity, (n-hexane,
ethyl acetate and methanol). Powdered plant (2 kg) material was soaked in n-hexane (3 x 3 L)
solvents and left to stand for seven days, with occasional shaking. The macerate was filtered and
the filtrate concentrated under vacuum using rotary evaporator. The same extraction procedure
was repeated with ethyl acetate and finally with methanol.
The stem bark of W. ugandensis afforded 20 g, 105 g and 215 g of n-hexane, ethyl acetate and
methanol extracts, respectively. Extracts from E. schweinfurthianum were obtained in 15 g, 100
g and 210 g of n-hexane, ethyl acetate and methanol extracts, respectively. T. brownii stem bark
sequential solvent extraction produced 18 g, 75 g and 150 g of n-hexane, ethyl acetate and
methanol extracts, respectively. Extracts were stored at 4 0C for phytochemical and antimicrobial
activity studies against sweet potato fungi and bacteria.
3.3.4 Isolation of compounds from W. ugandensis
For chromatographic separation, portions of n-hexane (15 g) and ethyl acetate (65 g)
extracts were combined because the two extracts showed similar profiles on thin TLC. The
combined extract (80 g) was dissolved in minimum amount of ethyl acetate and adsorbed into
silica gel before evaporation to dryness. The resulting dark brown oily material was loaded on
top of silica gel packed glass column (5 x 60 cm, 200 g) and eluted with increasing gradient of
EtOAc in n-hexane, EtOAc, CH2Cl2-MeOH mixture with increasing concentration of MeOH and
elution was finally concluded with neat MeOH. The whole process was done under medium
pressure.
A total of 400 fractions (each 20 ml) were sampled and their homogeneity monitored by
TLC using solvent systems: n-hexane-ethyl acetate (9:1, 4:1, 3:2, 2:1 and 1:1) and CH2Cl2-
MeOH (95:5 and 9:1). The eluants were combined to afford the following fraction pools.

35
I) Fraction 15-60 (n-hexane - EtOAc 95:5 eluate, 15 g) was an oily substance with aromatic
smell. It was kept for future GC - MS analysis.
II) Eluate (n-hexane- EtOAc 9:1, and 4:1, fractions 64 -100, 10 g) showed four sports Rf values
0.53 (major component), 0.42, 0.35 and 0.22, which turned greenish purple with
anisaldehyde – conc. H2SO4 mixture after spraying and heating at 100 °C. The fractions were
combined and from this pool crystallized out white needles which were filtered and further
purified by re-crystallization (n-hexane- EtOAc, 95:5) to give polygodial [13], Rf = 0.53 (n-
hexane- EtOAc, 4:1), 120 mg. The mother liquor was evaporated under reduced pressure and
upon flash chromatography using (n-hexane – EtOAc 9:1) followed by the same solvent
system in the ratios 19:3 and 4:1 to give further 13, 25 mg, cinnamolide [17] (n-hexane-
EtOAc, 4:1, Rf = 0.42, 73 mg), warbuganal [14] (n-hexane- EtOAc 4;1, Rf 0.35, 65 mg) and
9-deoxymuzigadial [101] (n-hexane- EtOAc 4:1, Rf = 0.22, 45 mg).
III) Pool III (n-hexane- EtOAc 4:1, 3:2 and 1:1, fractions 102-220, 15 g) contained one major
spot Rf value 0.33 (n-hexane- EtOAc 3:2) which masked other spots. This pool also
crystallized out to give amorphous powder which was further purified by re-crystallization in
n-hexane- EtOAc 19:3 to afford white plate-like material, muzigadial [22], 2000 mg. The
mother liquor was evaporated under reduced pressure and further purification by repeated
flash chromatography over silica gel column (3 x 60 cm, 100 g) using (n-hexane - EtOAc
(9:1, 4:1 and 3:2) and collecting 10 ml each gave a further polygodial [13], 15 mg,
warburganal [14, 20 mg] and muzigadial [22, 68 mg]. The other secondary metabolites
isolated from this eluate included bemadienolide [102, n-hexane – EtOAc 3:2, Rf = 0.22, 55
mg] and drimenin [103, n-hexane – EtOAc 3:2, Rf = 0.18, 64 mg].
IV) Eluate IV (n-hexane - EtOAc, 1:2 and EtOAC, fractions 225 -300, 11 mg) afforded five spots
of Rf values 0.36, 0.32, 0.29, 0.26 and 0.18 using eluent: n-hexane – EtOAc, 1:1. The spots
upon spraying with anisaldehyde – conc. H2SO4 mixture and heating turned greenish purple.
A change of developing reagent to iodine vapor revealed an additional spot of Rf value 0.34.
This pool was resolved into individual compounds by fractionation over silica gel column 3.5
x 60 cm, 150 g) using n-hexane- EtOAc (3:2) to give further 14, 22 and 102 in 16, 29 and 10
mg, respectively. Also isolated from this fraction were 3β-acetoxycinnamolide [19, Rf = 0.26,

36
65 mg], 7α-acetoxyugandensolide [104, Rf = 0.34, 85 mg] and ugandensidial [16, Rf = 0.18,
54 mg].
V) Eluate V ( EtAOc, fractions 310 - 360, 9 g) showed three spots Rf values 0.61 (major), 0.59
and 0.46 using CH2Cl2-MeOH, 97:3 as the developing solvent. Application of this pool to
repeated silica gel column (2.5 x 60 cm, 120 g) eluting with CH2Cl2-MeOH (99:1) and
collecting 10 ml each afforded mukaadial [15, Rf = 0.61, 100 mg], 6α-hydroxymuzigadial
[23, Rf = 0.59, 55 mg] and ugandensolide [20, Rf = 0.46, 72 mg].
VI) Eluate VI (CH2Cl2-MeOH, 95:5 and 9:1, fractions 365 - 400, 8 g) showed one component
with Rf = 0.41 after development with CH2Cl2-MeOH (95:5) and spraying with anisaldehyde
– conc. H2SO4 mixture. The compound was obtained in pure form by re-crystallization in n-
hexane-CH2Cl2-MeOH (97:2.5:0.5) to give white crystals, deacetoxyugandensolide [21], 45
mg.
Polygodial [13]: white needle crystals (n-hexane- ethyl acetate mixture), C15H22O2, Rf value of
0.53 (n-hexane: ethyl acetate 4:1), mp 58 -59 °C (lit. [Jansen et al., 1988] 57 °C); [α]D -131°
(MeOH, c, 0.35); UV λmax (CH3CN) 226 nm ; IR νmax (KBr) cm-1: 1730, 1680, 1645; 1H and 13C NMR
δ (ppm): See Table 4; EIMS m/z (rel. int.): 234 [M]+ (1), 206 (55), 191 (25), 121 (65), 109 (60),
41 (100).
Warbuganal [14]: White crystals (n-hexane- ethyl acetate mixture), C15H22O3, Rf 0.35 (n-
hexane: ethyl acetate 4:1), mp 134 -135 °C (lit. [Kioy et al., 1989] 134 -136 °C); [α]D -216°
(MeOH, c, 1.0); UV λmax (CH3CN) 223 nm ; IR νmax (KBr) cm-1: 3451, 2947, 2921, 2868, 2803,
1714, 1681, 1644; 1H and 13C NMR: δ (ppm): See Table 5; ESI-MS m/z: 273 [M+Na] +.
Mukaadial [15]: White needdle crystals (CH2Cl2-MeOH), C15H22O4, Rf 0.61 (CH2Cl2-MeOH
97:3), mp 228-229 °C (lit. [Kioy et al., 1989] 230 °C); [α]D -35° (MeOH, c, 0.5); UV λmax (CH3CN)
218 nm ; IR νmax (KBr) cm-1: 3350, 2990, 2923, 2798, 2701, 1720, 1696, 1466; 1H and 13C NMR:
δ (ppm): See Table 6; EIMS m/z (rel. int.): 266 [M]+ (5), 248 (100), 236 (15), 230 (46), 220 (23),
202 (21), 175 (27), 160 (6), 138 (8), 104 (10), 94 (4).
Ugandensidial [16]: White needles (n-hexane- ethyl acetate), C17H24O5, Rf 0.18 (n-haxane: ethyl
acetate 1:1), mp 136 - 137 °C (lit. [Kioy et al., 1990a] 138 -140 °C); [α]D -360° (MeOH, c, 2.5);
UV λmax (CH3CN) 220 nm ; IR νmax (KBr) cm-1: 3428, 3007, 2945, 2848, 1743, 1781, 1692, 1462; 1H

37
and 13C NMR: δ (ppm): See Table 7; EIMS m/z (rel. int.): 308 [M]+ (5), 280 (34), 237 (12), 220
(50), 148 (56), 109 (60), 60 (80), 43 (100).
Muzigadial [22]: White plate-like material (n-hexane: ethyl acetate mixture), C15H20O3, Rf 0.33
(n-hexane: ethyl acetate 3:2), mp 123 -125 °C (lit. [Kubo et al., 1977] 122 - 124 °C); [α]D -230°
(MeOH, c, 2.0); UV λmax (CH3CN) 228 nm ; IR νmax (KBr) cm-1: 3455, 2966, 2921, 2870, 1731,
1671; 1H and 13C NMR: δ (ppm): See Table 8; EIMS m/z (rel. int.): 248 [M]+ (10), 237 (100),
219 (19), 109 (43)69 (50), 41 (52).
6α-Hydroxymuzigadial [23]: White crystals (CH2Cl2-MeOH mixture), C15H20O4 Rf 0.59
(CH2Cl2-MeOH 97:3), mp 150-152 °C; [α]D -97° (MeOH, c, 0.35); UV λmax (CH3CN) 210 nm ; IR
νmax (KBr) cm-1:3360, 2958, 2860, 1727, 1678, 1639, 1454, 1387, 1318, 1171, 1135, 1055, 1029,
986, 897; 1H and 13C NMR: δ (ppm): See Table 9; EIMS m/z (rel. int.): 265 [M+1]+ (3), 248 (12),
247 (100), 235 (5), 229 (8), 219 (7), 201 (13), 173 (15), 109 (4), 95 (1).
9-Deoxymuzigadial [101]: Pale yellow oil, C15H20O2, Rf 0.22 (n-hexane: ethyl acetate 4:1); [α]D
-78° (MeOH, c, 0.35); UV λmax (CH3CN) 216 nm ; IR νmax (KBr) cm-1: 2960, 2922, 2870, 1714, 1680,
1655, 1408, 1340, 1205, 1140, 1022, 994, 840; 1H and 13C NMR: δ (ppm): See Table 10; EIMS
m/z (rel. int.): 232 [M]+ (100), 217 (39), 214 (90), 203 (59), 199 (57), 189 (48), 173 (70), 159 .
Ugandensolide [20]: White needle crystals (CH2Cl2-MeOH), C17H24O4, Rf 0.57 (CH2Cl2-MeOH
97:3), mp 215-218 °C (lit. [Brooks and Drafan, 1969a] 218 °C); [α]D +23° (MeOH, c, 1.0); UV
λmax (CH3CN) 220 nm ; IR νmax (KBr) cm-1: 3451, 29.31, 2887, 1733, 1672, 1463, 1370, 1342, 1251,
1203, 1142, 1063, 1027; 1H and 13C NMR: δ (ppm): See Table 11; EIMS m/z (rel. int.): 308 [M]+
(10), 266 (96), 248 (96), 233 (28), 215 (20), 177 (28), 163 (35), 69 (28), 55 (26), 43 (100).
7α-Acetoxyugandensolide [104]: White gummy material, C19H26O6, Rf 0.34 (n-hexane-ethyl
acetate 1:1), mp 228-230 oC; [α]D +24° (MeOH, c, 0.01); UV λmax (CH3CN) 218 and 228 nm ; IR νmax
(KBr) cm-1: 2966, 2915, 1758, 1728, 1681, 1458, 1373, 1245, 1196, 1095, 1043, 1009, 964, 742; 1H and 13C NMR: δ (ppm): See Table 12; EIMS m/z (rel. int.): 350 [M]+ (2), 307 (23), 290 (65),
274 (15), 248 (18), 247 (100), 232 (35), 206 (22), 42 (84).
Deacetoxyugandensolide [21]: White needle crystals (n-hexane-EtOAc-MeOH 97:2.5:0.5),
C15H22O4, Rf value 0.41 (n-hexane: ethyl acetate 7:3), mp 260-264 °C (lit. [Kioy et al., 1990a]
260 - 265 °C); [α]D +70° (MeOH, c, 1.0); UV λmax (CH3CN) 220 nm; IR νmax (KBr) cm-1: 3350, 2930,
38
1727, 1672, 1468, 1344, 1281, 1063, 1015, 966, 787, 687, 554, 462; 1H and 13C NMR: δ (ppm):
See Table 13; EIMS m/z (rel. int.): 266 [M]+ (100), 248 (35), 215 (45), 151 (55), 136 (75), 69
(88), 41 (100), 39 (25).
Cinnamolide [17]: White crystals (n-hexane-ethyl acetate mixture), C15H22O2, Rf, 0.42 (n-
hexane-ethyl acetate 4:1), mp 126-128 °C (lit. [Kubo et al., 1990a] 128 - 129 °C); [α]D -29°
(MeOH, c, 0.1); UV λmax (CH3CN) 224 nm ; IR νmax (KBr) cm-1: 2918, 2862, 1754, 1689, 1458, 1388,
1328, 1219, 1037, 1010, 962, 742, 675, 628; 1H and 13C NMR: δ (ppm): See Table 14; EIMS m/z
(rel. int.): 234 [M]+ (7), 219 (7), 124 (89), 111(30), 109 (100), 69 (28).
3β-Acetoxycinnamolide [19]: White crystals (n-hexane-ethyl acetate), C17H24O4, Rf value 0.26
(n-hexane-ethyl acetate 4:1), mp 152-155 °C (lit. [Kioy et al., 1990a] 153 - 155 °C); [α]D +7°
(MeOH, c, 0.1); UV λmax (CH3CN) 221 nm; IR νmax (KBr) cm-1: 2970, 2955, 1754, 1728, 1682, 1482,
1461, 1444, 1422, 1396, 1376, 1244, 1201, 1140, 1095, 1041, 1040, 967, 742; 1H and 13C NMR:
δ (ppm): See Table 15; EIMS m/z (rel. int.): 292 [M]+ (100), 232 (45), 231 (5), 122 (6), 121 (26),
106 ( 7), 95 (3)
Bemadienolide [102]: White crystals (n-hexane- ethyl acetate mixture), C15H20O2, Rf value 0.22
(n-hexane: ethyl acetate 3:2), mp 124-126 °C (lit. [Canonica et al., 1969b] 124 - 124 °C); [α]D -
181° (MeOH, c, 0.35); UV λmax (CH3CN) 210 nm ; IR νmax (KBr) cm-1: 2978, 1760, 1640, 1461, 1398,
1246; 1H and 13C NMR: δ (ppm): See Table 16; EIMS m/z (rel. int.): 232 [M]+ (27), 217 (10),
203 (18), 176 (15), 173 (18), 161 (26), 149 (39), 147 (100), 131 (20), 119 (32), 91 (28), 41 (28).
Drimenin [103]: White crystals (n-hexane-ethyl acetate), C15H22O2, Rf 0.18 (n-hexane: ethyl
acetate 3:2), mp 131-133 °C (lit. [Wenkert et al., 1964] 132 - 133 °C); [α]D -42° (MeOH, c,
0.76); UV λmax (CH3CN) 226 nm ; IR νmax (KBr) cm-1: 2923, 2848, 1761, 1706, 1487, 1385, 1365,
1274, 1172, 1134, 1003, 985, 933, 861, 809, 715, 560; 1H and 13C NMR, 13C NMR: δ (ppm): See
Table 17; EIMS m/z (rel. int.): 235 [M]+ (100), 191 (10), 189 (10), 179 (7), 139 (6), 124 (28), 111
( 25), 95 (12), 91 (5).

39
3.3.5 Isolation of compounds from E. shweinfurthianum
Isolation of compounds from n-hexane extract: The crude extract (10 g) was mixed
with silica gel in a minimum amount of n-hexane in a round bottom flask. The solvent was
removed in a vacuo to obtain a free flowing brown substance. The extract was fractionated over
silica gel column (2.5 x 60 cm, 100g) using n-hexane with gradient of ethyl acetate up to 100%.
A total of 100 fractions each of 20 ml were collected and their composition monitored by TLC
using solvent systems: n-hexane ethyl acetate, 9:1 and 4:1. Fractions showing similar TLC
profiles were combined resulting into three pools (I-III). Pool I (fractions 1-23, 1 g) did not show
any spot on TLC and was discarded. Pool II (fractions 31-68, 3 g) crystallized out to give a white
compound upon which, on further purification using n-hexane-ethyl acetate (9:1) gave α-amyrin
acetate [105] 56 mg. The mother liquor of this pool upon TLC analysis using n-hexane-EtOAc
(9:1) showed one spot of Rf values 0.45, and was subjected to further column chromatography
with n-hexane- EtOAc (9:1) to afford stigmasterol [90] (78 mg). Pool III (fractions 73-100, 3 g)
also crystallized out and after re-crystallization (n-hexane-EtOAc, 9:1) afforded further
stigmasterol [90] 45 mg.
Isolation of compounds from ethyl acetate extract: Ethyl acetate extracts of E.
shweinfurthianum (75 g) was fractionated over in silica gel column (3.0 x 60 cm, 200 g) using n-
hexane-ethyl acetate (10% increment of ethyl acetate), ethyl acetate neat and finally with
CH2Cl2-MeOH (with 10% and 20% increment of MeOH) to yield 251 fractions (20 ml each).
The composition of the fractions was monitored by TLC using n-hexane-ethyl acetate (4:1, 3:2
and1:1) and CH2Cl2-MeOH (9:1 and 4:1) as solvent systems. Fractions showing similar TLC
profiles were combined resulting in five pools (I-V).
Pool I (fractions 1-44, 8.2 g) which gave one spot on TLC Rf value 0.23 (n hexane-ethyl
acetate 9:1) on subjection to further fractionation eluting with n hexane-ethyl acetate ( 95:5, 9:1)
gave α-amyrin acetate [105] 30 mg, . Pool II (fractions 45-113, 15 g) which was eluted with n-
hexane: ethyl acetate mixture (9:1) showed three spots of Rf values 0.23, 0.33 and 0.42 on TLC
with the same solvent system. Further column chromatography with n-hexane: ethyl acetate
mixture (95:5, 9:1, 4:1) further afforded α-amyrin acetate [105] 72 mg, 3-oxofriedooleanane [44]
65 mg and β-sitosterol [63] 54 mg. Pool III (fractions 114-163, 17g) which was eluted with n-

40
hexane: ethyl acetate mixture (4:1) gave three major spots on TLC using the same solvent
system. On subjection to further column chromatography eluting with n-hexane: ethyl acetate
mixture (9:1, 4:1, 3:2) pool III yielded stigmasterol [90] 78 mg, 3-oxofriedoolean-28-al [45] 80
mg and 3α-hydroxyfriedooleanane [106] 83 mg. Pool IV (fractions 164-211, 12.5 g) showed two
major spots on TLC with n-hexane: ethyl acetate mixture (7:3) and on further fractionation
eluting with n-hexane: ethyl acetate mixture (4:1, 7:3) afforded α-amyrin [107] 77 mg and 3-
oxofriedoolean-29-ol [108] 93 mg. Pool V (fractions 212-151, 8.9 g) was further subjected to
column chromatography using of n-hexane: ethyl acetate mixture (7:3, 3:2) to yield lanosterol
[109] 74 mg.
β-Sitosterol [63]: white crystals (n-hexane-ethyl acetate), C29H50O, Rf value 0.42 (n-hexane:
ethyl acetate 9:1), mp 134-135 °C(lit. [Abu-Mustafa et al., 1960] 136 - 137 °C); [α]D +49°
(MeOH, c, 0.35); UV λmax (CH3CN) 202 nm; IR νmax (KBr) cm-1: 3404, 2924, 1635, 1455; 1H and 13C
NMR: δ (ppm): See Table 18; ESI-MS m/z 437 [M+Na] +.
Stigmasterol [90]: white crystals (n-hexane-ethyl acetate), C29H50O, Rf 0.16 (n-hexane: ethyl
acetate 9:1), mp 169-170 °C (lit. [Shammel et al., 1996] 169.5 °C); [α]D +51° (MeOH, c, 2.0); UV
λmax (CH3CN) 257 nm; IR νmax (KBr) cm-1: 3356, 2941, 2869, 1663, 1647, 1457, 1381, 1369; 1H and 13C NMR: δ (ppm): See Table 18; EIMS m/z (rel. int.): 412 [M]+ (24), 369 (4), 314 (1), 300 (4),
271 (36), 255 (8), 246 (10), 231 (4), 171 (4), 159 (8), 147 (14), 133 (13), 119 (21), 107 (31), 81
(67), 55 (100), 45 (85).
Lanosterol [109]: White crystals (5% MeOH in CH2Cl2), C30H50O, Rf value 0.46 (n-hexane:
ethyl acetate 4:1), mp 144-145 °C (lit. [Clayton and Bloch, 1955] 132 - 133 °C); [α]D +62°
(MeOH, c, 1.12); UV λmax (CH3CN) 202 nm; IR νmax (KBr) cm-1: 3462, 2928, 1644, 1445; 1H and 13C
NMR: δ (ppm): See Table 18; ESI-MS m/z 449 [M+Na]+.
3-Oxofriedooleanane [44]: White crystals (n-hexane-ethyl acetate mixture), C30H50O, Rf value
0.33 (n-hexane-ethyl acetate 9:1), mp 260 -261 °C (lit. [Sod et al., 2009] 258.1 – 261.3 °C); [α]D
-28° (MeOH, c, 1.12); IR νmax (KBr) cm-1: 1706, 2927-2869, 1450, 1339; 1H and 13C NMR: δ
(ppm): See Table 19 & 20; EIMS m/z (rel. int.): 426 [M]+ (100), 411 (20), 344 48), 341 (10),
302 (36), 273 (50), 246 (34), 218 (36), 205 (42), 179) (34), 137 (28), 125 (60), 123 )62), 109
(72), 95 (82), 69 (88), 55 (59), 41 (32).

41
3α-Hydroxyfriedooleanane [106]: White crystals (CH2Cl2-MeOH 9:1), C30H52O, Rf value 0.28
(n-hexane ethyl acetate 4:1) mp 290-292 °C (lit. [Budzikiewics et al., 1963] 303 – 304.3 °C);
[α]D +18° (MeOH, c, 1.12); IR νmax (KBr) cm-1: 3476, 2933, 2869, 1449, 1338; 1H and 13C NMR:
δ (ppm): See Table 18 & 20; EIMS m/z (rel. int.): 428 [M]+ (30), 413 (22), 395 (30), 248 (12),
220 (30), 206 (22), 177 (21), 165 (67), 137 (26), 123 (48), 108 (74), 95 (100)69 (90), 55 (44), 41
(22).
3-Oxofriedoolean-29-ol [108]: White crystals (n-hexane- ethyl acetate mixture), C30H50O2, Rf
value 0.38 (n-hexane: ethyl acetate 4:1), mp 250-252 °C (lit. [Abbas et al., 2007] 252 - 253 °C);
[α]D +87° (MeOH, c, 1.0); 1H and 13C NMR: δ (ppm): See Table 19 & 20; ESI-MS m/z: 465
[M+Na]+.
3-Oxofriedoolean-28-al [45]: White needles (5% MeOH in CH2Cl2), C30H48O2, Rf value, 0.22
(n-hexane- ethyl acetate 4:1), mp 263-265 °C (Mahato and Kundu, 1994] 262 - 263 °C);; [α]D
+65° (MeOH, c, 1.0); 1H and 13C NMR: δ (ppm): See Table 19 & 20; ESI-MS m/z: 463 [M+Na]+.
α-Amyrin [107]: White crystals (5% MeOH in CH2Cl2), C30H50O, Rf value of 0.32 (n-hexane:
ethyl acetate 4:1), mp 180-181 °C (lit. [Goldstein and Jenkins, 2006] 181 – 181.5 °C); [α]D +83°
(MeOH, c, 1.12); 1H and 13C NMR: δ (ppm): See Table 21; ESI-MS m/z: 449 [M+Na] +.
α-Amyrin acetate [105]: White crystals (n-hexane-ethyl acetate mixture), C32H52O2, Rf 0.23 (n-
hexane: ethyl acetate 9:1) mp 214-215 °C (lit. [Goldstein and Jenkins, 2006] 225 – 226 °C); [α]D
+77° (MeOH, c, 1.22); 1H and 13C NMR: δ (ppm): See Table 21; ESI-MS m/z: 491 [M+Na] +.
3.3.6 Isolation of compounds from T. brownii
The composition of n-hexane extract of T. brownii was monitored by TLC and was found
to contain no major spot/ compound and was discarded. Ethyl acetate extract (75 mg) was
subjected to column chromatography over silica gel eluting with n-hexane-ethyl acetate (10%
increment of ethyl acetate), ethyl acetate neat and finally with CH2Cl2-MeOH (with 10% and
20% increment of MeOH) to give 132 fractions (each 20 ml). The composition of the fractions
was monitored by TLC eluent: n-hexane-ethyl acetate (4:1, 3:2 and1:1) and CH2Cl2-MeOH (9:1
and 4:1). Fractions showing similar TLC profiles were combined, resulting to five pools (I-V).
Pool I (fractions 3-16, 6 g) showed an intense purple colouration upon spraying with

42
anisaldehyde – conc. H2SO4 mixture and heating. The pool contained mainly fatty acids and was
discarded. Pool II (fractions 18-32, 8.5 g) which showed two spots on TLC with n-hexane- ethyl
acetate (9:1) was subjected to further column chromatography eluting with n-hexane: ethyl
acetate ( 95:5, 9:1, 85:15, 4:1). Recrystalization was done in CH2Cl2 – EtAOC mixture to afford
β-sitosterol [63], 85 mg and stigmasterol [90] 65 mg. Pool III (fractions 37-66, 10.5 g) also
showed two spots on TLC with n-hexane- ethyl acetate (4:1) was further fractionated by column
chromatography eluting with n-hexane: ethyl acetate (4:1, 75:25, 7:3, 65:35, 3:2) to give
monogynol A [110], 95 mg and betulinic acid [88], 98 mg on recrystalization with CH2Cl2 –
EtAOC mixture . Pool IV (fractions 72-101, 9.6 g) afforded arjungenin [83], 65 mg after
repeated column chromatography eluting with EtOAc followed by EtOAc: MeOH mixture (95:5,
9:1).
Monogynol A [110]: White crystals (CH2Cl2 - MeOH), C30H52O2, Rf value of 5.8 (n-hexane:
ethyl acetate 9:1), mp 237-238 °C (lit. [Ulubleen et al., 1994] 232 °C); [α]D +39° (MeOH, c,
1.28); UV λmax (CH3CN) 210 nm; 1H NMR (CDCl3, 360 MHz) δ ppm: 3.20 (1H, dd, J = 7.9, 3.6
Hz, H-3), 1.78 (1H, m, H-19), 1.74 (1H, m, H-1), 1.61 (1H, m, H-2), 1.49 (1H, m, H-18), 1.36
(1H, m, H-7), 1.23 (1H, m, H-9), 1.18, 1.09, 1.05, 0.97, 0.95, 0.85, 0.84, 0.76 (24H, s, 8 x Me); 13C NMR: δ (ppm): See Table 22; ESI-MS m/z 467 [M+Na]+.
Butelinic acid [88]: White crystals from dichloromethane – methanol mixture, C30H48O3, Rf
value 0.18 (n-hexane: ethyl acetate 7:3), mp 280 - 282 °C (lit. [Sod et al., 2009] 279 - 281 °C);
[α]D +10° (MeOH, c, 1.0); UV λmax (CH3CN) 220 nm; IR νmax (KBr) cm-1: 3455 (OH), 3072 (=CH2),
2942, 2869, 1687, 1642, 1458, 1387; 1H NMR (CDCl3, 360 MHz) δ ppm: 4.73 (1H, br. s, H-
29a), 4.60 (1H, br. s, H-29b), 3.20 20 (1H, dd, J = 8.2, 6.0 Hz, H-3), 2.99 20 (1H, dt, J = 10.8,
5.4 Hz, H-19), 2.24 20 (1H, m, H-16), 1.97 20 (1Hm, H-22), 1.69, 0.97, 0.97, 0.96, 0.83, 0.75
(18H, s, 6 x Me); 13C NMR: δ (ppm): See Table 22; EIMS m/z (rel. int.): 456 [M]+ (65), 438
(18), 248 (70), 207 (65), 189 (100).
Arjungenin [83]: White amorphous solid from CH2Cl2-MeOH mixture, C30H48O6, Rf value of
0.32 (n-hexane: ethyl acetate 1:1), mp 282-283 °C. lit. [Honda et al., 1976a] 293-294 °C); [α]D
+29° (MeOH, c, 2.0); UV λmax (CH3CN) 214 nm; IR νmax (KBr) cm-1: 3404, 2935, 2720, 1705, 1640,
1462, 1362, 1067, 1024; 1H NMR (CDCl3, 360 MHz) δ ppm: 5.22 (1H, br. s, H-12), 4.48 (1H, d,
J = 8.1 Hz, H-3), 4.01 (1H, m, H-2), 3.75 (1H, d, J = 10.1, Hz, H-23a), 3.36 (1H, d, J = 10.0 Hz,

43
H-23b), 3.33 (1H, m, H-19), 1.27, 1.08, 0.89, 0.87, 0.83, 0.64 (18H, s, 6 x Me); 13C NMR: δ
(ppm): See Table 22. ESI-MS m/z 527 [M+Na]+.
3.4 Evaluation of antifungal and antibacterial activity of plant extracts
3.4.1 Isolation of spoilage fungi and bacteria from decayed sweet potato
Deteriorating sweet potato tubers were obtained from the open market (Maseno). Pieces 3
x 3 x 2 mm cut from advancing edge of a rot were surface sterilized in 70% alcohol for 1 min,
dried on sterile tissue paper and plated out on Nutrient Agar (NA) and Potato Dextrose Agar
(PDA). The plates were incubated at room temperature for up to 5 days after which fungal and
bacterial growth associated with rot affected tissue identified with the aid of the appropriate
taxonomic keys (Ainsworth et al., 1973). The isolates were maintained on PDA slants at 4°C till
needed.
3.4.2 Antifungal and antibacterial assay of crude extracts
Antifungal and antibacterial activity of the methanol, ethyl acetate and n-hexane extracts
of W. ugandensis, E. schweifurthianum and T. brownii was evaluated by the agar diffusion
method (Barry et al., 1979). Test fungi used were Alternaria spp, A. niger, F. oxysporum, F.
solanum and R. stolonifer while test bacteria used were R. solanacearum (gram negative) and S.
ipomoeae (gram positive). The test was performed in sterile petri-dishes (90 mm diameter)
containing 20 ml PDA and NA for fungi and bacteria, respectively. PDA and NA media were
prepared by reconstituting 39 and 28 g in 1 litre of distilled water and heated to dissolve
completely. The media were sterilized by autoclaving at 120 °C for 20 min. Inoculation was
done by spreading 0.5 ml of spore suspension (1 x 10⁵ colony forming unit/ ml) of the test
pathogen on the surface of the solidified agar (Kariba et al., 2001). Paper disc (Whatmann No. 1,
5 mm diameter) were impregnated with 100 µl of the plant extracts (5 mg/ml) using a sterile
micropipette and left for 30 min to dry at room temperature in the hood. The dried discs were
placed on the surface of the solidified inoculated agar and incubated at 28 ºC for 48 h for fungi
and 37 ºC for 24 h for bacteria. Blitox, dithane M-5 and streptomycin sulphate (10µg/ml) were
used as positive controls while DMSO without plant extract was used as a negative control. All
tests were done in triplicates. The presence of zones of inhibition around the disc was interpreted

44
as an indication of antimicrobial activity. Inhibition zones were measured as described by Reiner
(1982).
3.4.3 Antifungal and antibacterial assay of pure isolates and minimum
inhibitory concentration (MIC)
The minimum inhibitory concentration (MIC) of pure isolates were determined using the
method described by Anastasiah and Ndalut (2005).) at varying concentrations of 200, 100, 50,
25, 12.5, 6.25, 3.13 and 1.56 µg/ml. Sterile paper discs were impregnated with 100 µl of the
reconstituted samples. The dried discs were transferred aseptically into PDA and NA plates
previously inoculated with test fungi and bacteria, repectively as described in Section 3.4.2. MIC
(in µg/ml) was regarded as the lowest concentration that produced a visible zone of inhibition.

45
CHAPTER FOUR
4.0 RESULTS AND DISCUSSION
4.1 Viruses infecting sweet potato in western Kenya
Symptomatic sweet potato samples collected from farmers’ fields in Western Kenya were
tested for SPFMV, SPCSV, SPMMV, SPCFV, SPMSV, SPCa-LV, SPLV, C-6, SPVG and CMV
using NCM-ELISA. Out of the 327 samples tested, 89% were infected whereas (11%) gave
negative results (Table 2). Samples from Western Province showed 94% infection whereas those
from Nyanza Province showed 84% infection. Samples from Bungoma, Busia, Kakamega, Kisii
and Rachuonyo showed 100% infection. Siaya District of Nyanza Province showed the least
frequency of infection (60%).
Five viruses namely SPFMV, SPCSV, SPMMV, SPCFV and CMV were detected from
the serological analysis (Table 3). SPFMV, which was the most widespread, was detected in
samples from all the 10 districts surveyed with frequency of detection ranging from 60% to
100%. A total of 293 (89%) of the samples tested reacted with SPFMV-specific antibody.
SPCSV was the second most widespread and was detected in 179 (55%) of the samples.
SPMMV, SPCFV and CMV were also detected in the samples at 17%, 12% and 5% respectively.
SPMMV was detected in 9 out of 10 districts whereas SPCFV was detected in 8 out of 10
districts. CMV, which was the least widespread, was detected in 4 out of 10 of the districts
surveyed namely Bungoma (14%), Teso (11%), Kisii (10%), and Rachuonyo (15%).
Previously, SPFMV, SPCSV, SPMMV, SPCFV and SPMSV were reported to infect
sweet potato in Kenya (Ateka et al., 2004; Miano et al., 2006; Nyaboga et al., 2008). The
widespread occurrence of SPFMV in the region is in agreement with previous reports that the
virus occurs virtually everywhere sweet potato is grown including countries in tropical and sub-
tropical areas as well as temperate regions (Moyer and Salazar, 1989; Salazar and Fuentes,
2001). The widespread occurrence of SPFMV (89%) as compared to the other four viruses
detected might be related to the way farmers select their planting materials. Since sweet potato
plants that are singly infected with SPFMV exhibit mild or no clearly visible symptoms (Gibson

46
et al., 1997), farmers find it difficult to distinguish and exclude SPFMV- infected cuttings from
the planting materials they select for the next crop, thereby maintaining this virus.
Table 2: Proportion of samples per district that reacted positive for one or more
viruses tested from NCM-ELISA
Province District Number of
samples tested Plants that reacted positive to one or
more viruses (%)
Western Bungoma 36 100
Busia 33 100
Kakamega 27 100
Teso 27 85
Vihiga 30 78
Mean 30 93
Nyanza Homa Bay 30 90
Kisii 27 100
Kisumu 30 70
Rachuonyo 57 100
Siaya 30 60
Mean 36 84
Overall mean 33 89

47
Table 3: Proportion (%) of sweet potato samples that reacted positive for
different viruses detected from NCM-ELISA
Province District No. of samples
tested SPFMV SPCSV SPMMV SPCFV CMV
Western Bungoma 36 100 92 17 25 14
Busia 33 100 91 9 18 0
Kakamega 27 89 44 10 10 0
Teso 27 89 56 33 0 11
Vihiga 30 90 50 10 10 0
Mean 30 94 67 16 13 5
Nyanza H/bay 30 90 50 10 5 0
Kisii 27 100 44 11 6 10
Kisumu 30 70 50 20 20 0
Rachuonyo 57 100 42 32 21 15
Siaya 30 60 30 0 0 0
Mean 36 84 43 15 10 5
Overall mean 33 89 55 15 10 5
SPFMV = Sweet potato feathery mottle virus; SPCSV = Sweet potato chlorotic stunt virus;
SPMMV = Sweet potato mild mottle virus; SPCFV = Sweet potato chlorotic fleck virus; CMV =
Cucumber mosaic virus.

48
The high frequency of detection of the dual infection of SPFMV and SPCSV in this study
concurred with findings from previous studies (Mukasa et al., 2003; Ateka et al., 2004; Tairo et
al., 2004; Miano et al., 2006; Nyaboga et al., 2008). Co-infection of SPFMV and SPCSV causes
sweet potato virus disease (SPVD) which is economically the most important disease of sweet
potato (Gibson et al., 1998; Mukasa et al., 2003). The viral mixtures of infections lead to
synergistic effect which results in severer damage to sweet potato than it would be achieved if an
individual virus was infecting the crop alone (Gutierrez et al., 2003). All CMV infected plants
carried SPFMV and this observation was in agreement with previous reports (Cohen et al.,
1988), suggesting a synergistic co-existence between the two viruses.
Over 80% of the samples tested showed presence of mixed infections. The most common
infection combination was that of SPFMV and SPCSV and was detected in 52% of the samples
(Fig. 3). Other dual infection combinations detected were SPFMV + SPMMV (13%), SPFMV +
SPCFV (14%), SPFMV + CMV (4%), SPCSV + SPMMV (9%), SPCSV + SPCFV (10%) and
SPCFV + SPMMV (5%). The most widespread triple infection combination detected was
involving SPFMV + SPCSV + SPMMV which was detected in 9% of the samples. Other triple
infection combinations detected include SPFMV + SPCSV + SPCFV (2%) and SPFMV +
SPCSV + CMV (1%). A complex virus infection involving 4 viruses (SPFMV + SPCSV +
SPMMV + SPCFV) was detected in 1% of the samples.
Out of the 327 symptomatic samples tested, 89% were infected by at least one of the
viruses tested (Table 2). The high incidence of viral infection could be attributed to the piece-
meal harvesting and continuous cropping which are practiced in the region, thereby providing a
continuous reservoir of the infecting pathogens. Whereas samples were selected on the basis of
presence of virus-like symptoms, 11% did not react with any of the ten virus-specific antibodies
used in this study. This observation suggests the presence of variants of known viruses that are
not recognized by the antibodies used or new viruses. More assays targeting viruses other than
the ones tested in this study is necessary.
Total RNA extracted from samples that reacted positively with antibodies specific to
CMV were subjected to RT-PCR using primers specific to CMV to confirm that the positive
colour reaction observed in the NCM-ELISA did not result from contamination or an artifact.
Analysis of PCR products by electrophoresis using 1% agarose gel showed successful DNA
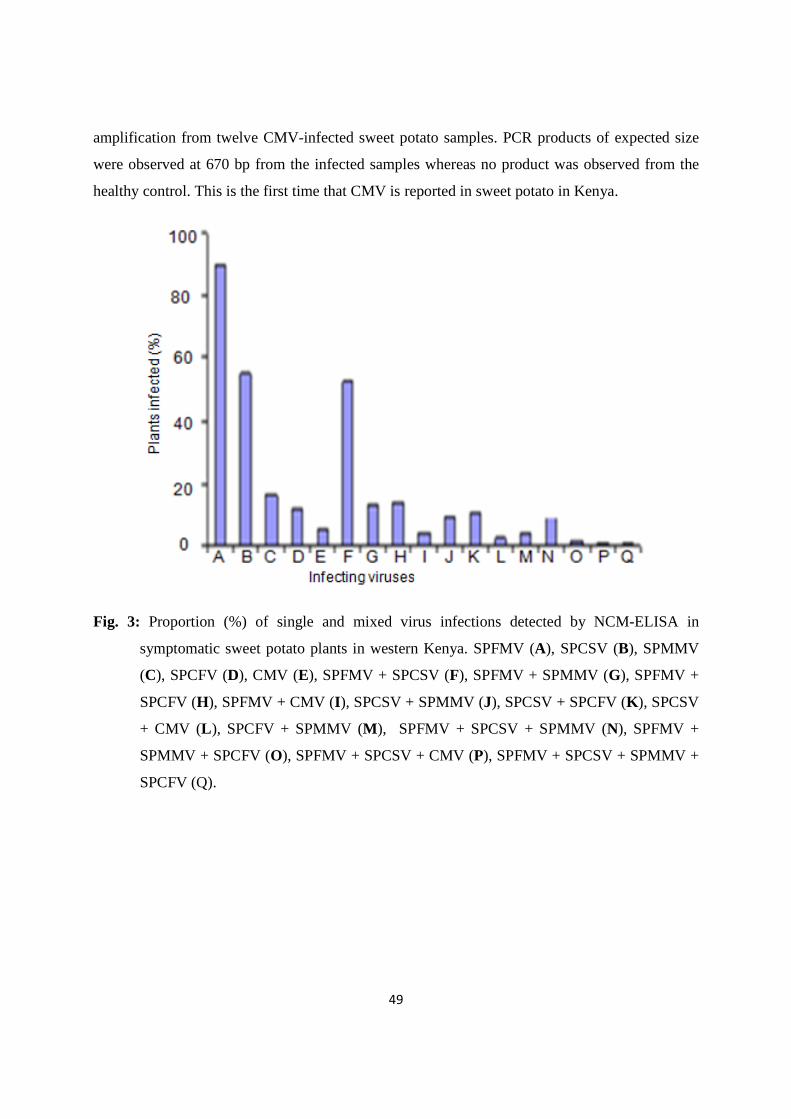
49
amplification from twelve CMV-infected sweet potato samples. PCR products of expected size
were observed at 670 bp from the infected samples whereas no product was observed from the
healthy control. This is the first time that CMV is reported in sweet potato in Kenya.
Fig. 3: Proportion (%) of single and mixed virus infections detected by NCM-ELISA in
symptomatic sweet potato plants in western Kenya. SPFMV (A), SPCSV (B), SPMMV
(C), SPCFV (D), CMV (E), SPFMV + SPCSV (F), SPFMV + SPMMV (G), SPFMV +
SPCFV (H), SPFMV + CMV (I ), SPCSV + SPMMV (J), SPCSV + SPCFV (K ), SPCSV
+ CMV (L ), SPCFV + SPMMV (M ), SPFMV + SPCSV + SPMMV (N), SPFMV +
SPMMV + SPCFV (O), SPFMV + SPCSV + CMV (P), SPFMV + SPCSV + SPMMV +
SPCFV (Q).

50
4.2 Multiplex PCR protocol for detection of SPFMV and SPCSV
Two PCR primers set specific to SPFMV and SPCSV were selected for optimization of
the mPCR. Different amplification assays with varying amounts of (1.0 – 3.0 µg), varying
annealing temperatures (60 – 63 ºC) and varying number of cycles (30 – 35) were also performed
to optimize the multiplex reaction conditions. The best amplification was obtained with 2.0 µg of
the cDNA template with 35 cycles compared to 1.0 µg and 3.0 µg (results not shown). There was
no significant difference between 60 ºC and 63 ºC for the annealing temperature; although better
results were obtained by 63 ºC than 60 ºC. PCR products of expected sizes for SPFMV and
SPCSV (703 and 235 bp, respectively) were obtained from sweet potato leaf samples infected
with SPFMV and SPCSV by both sPCR and mPCR (Fig. 4) while no amplification products
were obtained from healthy plants.
Thirteen sweet potato samples showing sweet potato virus disease (SPVD) symptoms tested in
PCR assay were analyzed using NCM – ELISA to confirm the PCR results. Antibodies specific
to SPFMV and SPCSV obtained from International Potato Centre (CIP, Lima, Peru) were used.
All the samples tested, including the positive control reacted positively (spots developed a purple
coloration after the final colour development reaction) with both SPFMV and SPCSV antibodies.
Spots from healthy sweet potato samples (negative control) did not show any apparent colour
change on nitrocellulose membrane.
In East Africa, the presence of high incidences associated with virus diseases in sweet
potato is attributed to the use of infected planting materials (the most common virus source). The
vegetative propagation usually done using cuttings from a previous crop to establish a new crop
(Karyeija et al., 1998) also increase the risk of build up of viruses. To reduce the chances of
virus transmission through use of infected cuttings, use of virus tested planting materials is
necessary. Results from this study show the successful use of a simplified mPCR as a rapid assay
for the simultaneous detection of SPFMV and SPCSV leading to improved turnaround time and
reduced cost of virus detection. Since the primers used for SPFMV amplification were broad
based, this increases the chances of detection and are therefore appropriate for routine assays.

51
Fig. 4: Electrophoresis profile of DNA amplified products from total RNA obtained from 13
symptomatic and 1 healthy sweet potato samples by singlex and multiplex PCR. Lane
M: DNA size marker (200 bp); Lanes 1 – 3: singlex PCR using primers specific to
SPCSV; Lanes 4 – 6: singlex PCR using primers specific to SPFMV; Lane 7 – 13:
multiplex PCR with mixed viral cDNA’s using two primer pairs specific to SPFMV
and SPCSM; Lane 14: healthy control.

52
4.3 Results from phytochemical studies
Crude extracts from W. ugandensis, E. schweifurthianum and T. brownii were subjected
to repeated column chromatography on silica gel (see materials and methods section) to afforded
26 compounds consisting of one new and 25 known compounds. The structures of the isolates
were determined using physical and spectroscopic methods.
4.3.1 Identification of compounds from W. ugandensis
Fractionation of extracts from W. ugandensis led to the isolation of 14 compounds
identified as polygodial [13], warburganal [14], mukaadial [15], ugandensidial [16], muzigadial
[22], 6α-hydroxymuzigadial [23], 9-deoxymuzigadial [101], ugandensolide [20], 7α-
acetoxyugandensolide [104], deacetoxyugandensolide [21], cinnamolide [17], 3β-
acetoxycinnamolide [19], bemadienolide [102] and drimenin [103]. Compounds 103 and 104
were isolated from the plant for the first time.
Polygodial [13] was isolated as white crystals with Rf value of
0.53 (n-hexane: ethyl acetate 4:1), mp 58 – 59 oC and [α]D -131° (MeOH,
c, 0.35). The electron ionization mass spectrum ( EIMS) 70 eV of 13
(Appendix 1) gave a molecular ion peak at m/z 234, corresponding to a
molecular formula C15H22O2, a fact which was supported by the 13C
NMR and DEPT spectrum (Table 4) which showed 15 distinct carbon signals consisting of
three methyl, four ethylene, five methine and three quaternary carbons atoms. The 1H and 13C
NMR data were similar to those reported for polygodial (Kubo et al., 1983; Kioy et al., 1990a;
Barrero et al., 1995).
Peaks at δ 201.90 and 193.21 in the 13C NMR spectrum corresponding to an isolated and
α,β-unsaturated aldehyde groups, respectively, suggesting 13 to be an 8, 9-dialdehyde
sesqiterpene derivative. Similarly peaks at δ 154.41 and 138.06 inferred the presence of a double
bond between C-7 and C-8 (Kubo et al., 1976; Fukuyama et al., 1982; Kioy et al., 1990b:
Barrero et al., 1995). The carbon signals at δ 33.01, 21.86 and 15.18 in the 13C NMR spectrum
were assigned to the methyl carbons at C-13, C-14 and C-15, respectively. The presence of the
two aldehyde groups were confirmed by 1H NMR spectrum (Appendix 1) which showed two
singlets at δ 9.53 and 9.47 integrating for one proton each while the peak at δ 7.17 (dd, J = 6.0,
CHO
CHO
13
H
H
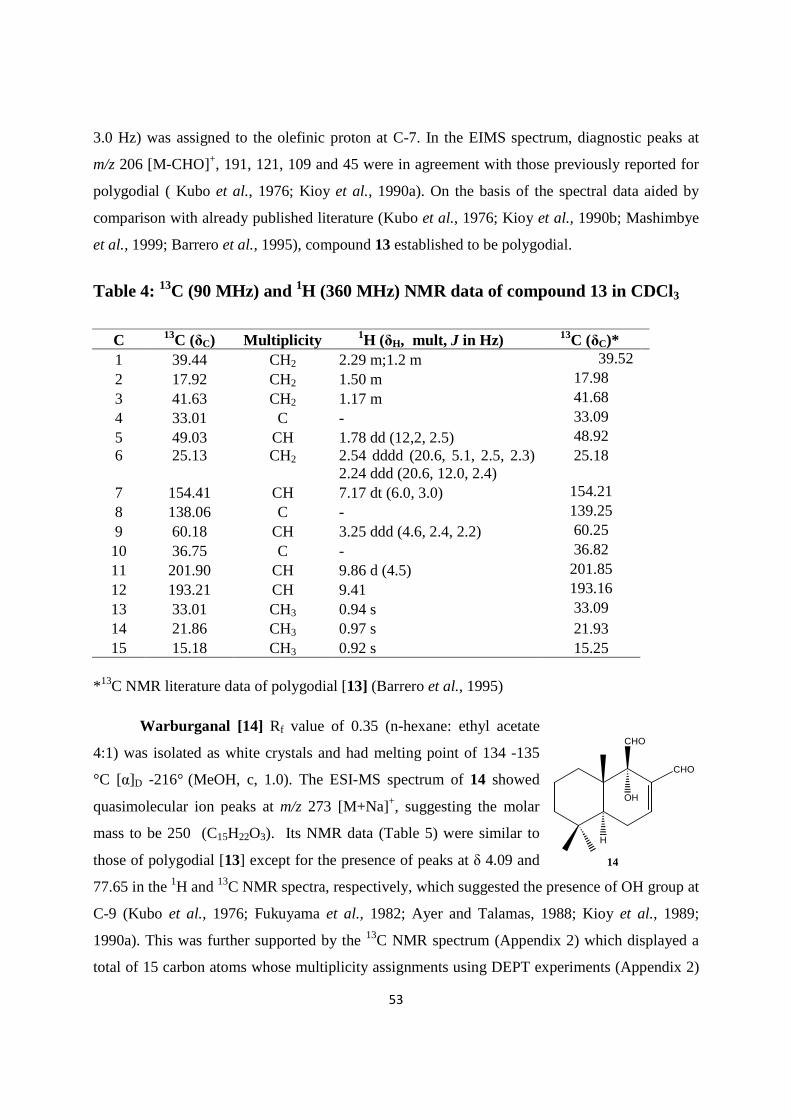
53
3.0 Hz) was assigned to the olefinic proton at C-7. In the EIMS spectrum, diagnostic peaks at
m/z 206 [M-CHO]+, 191, 121, 109 and 45 were in agreement with those previously reported for
polygodial ( Kubo et al., 1976; Kioy et al., 1990a). On the basis of the spectral data aided by
comparison with already published literature (Kubo et al., 1976; Kioy et al., 1990b; Mashimbye
et al., 1999; Barrero et al., 1995), compound 13 established to be polygodial.
Table 4: 13C (90 MHz) and 1H (360 MHz) NMR data of compound 13 in CDCl3
C 13C (δC) Multiplicity 1H (δH, mult, J in Hz) 13C (δC)*
1 39.44 CH2 2.29 m;1.2 m 39.52 2 17.92 CH2 1.50 m 17.98 3 41.63 CH2 1.17 m 41.68 4 33.01 C - 33.09 5 49.03 CH 1.78 dd (12,2, 2.5) 48.92 6 25.13 CH2 2.54 dddd (20.6, 5.1, 2.5, 2.3)
2.24 ddd (20.6, 12.0, 2.4) 25.18
7 154.41 CH 7.17 dt (6.0, 3.0) 154.21 8 138.06 C - 139.25 9 60.18 CH 3.25 ddd (4.6, 2.4, 2.2) 60.25 10 36.75 C - 36.82 11 201.90 CH 9.86 d (4.5) 201.85 12 193.21 CH 9.41 193.16 13 33.01 CH3 0.94 s 33.09 14 21.86 CH3 0.97 s 21.93 15 15.18 CH3 0.92 s 15.25
* 13C NMR literature data of polygodial [13] (Barrero et al., 1995)
Warburganal [14] Rf value of 0.35 (n-hexane: ethyl acetate
4:1) was isolated as white crystals and had melting point of 134 -135
°C [α]D -216° (MeOH, c, 1.0). The ESI-MS spectrum of 14 showed
quasimolecular ion peaks at m/z 273 [M+Na]+, suggesting the molar
mass to be 250 (C15H22O3). Its NMR data (Table 5) were similar to
those of polygodial [13] except for the presence of peaks at δ 4.09 and
77.65 in the 1H and 13C NMR spectra, respectively, which suggested the presence of OH group at
C-9 (Kubo et al., 1976; Fukuyama et al., 1982; Ayer and Talamas, 1988; Kioy et al., 1989;
1990a). This was further supported by the 13C NMR spectrum (Appendix 2) which displayed a
total of 15 carbon atoms whose multiplicity assignments using DEPT experiments (Appendix 2)
CHO
CHO
14
OH
H
54
established the presence of three methyl, four methylene, four methine and four quaternary
carbons. The peaks at δ 202.27 and 192.70 in the 13C NMR confirmed the presence of isolated
and α,β-unsaturated aldehyde groups. On the other hand, signals at δ 157.63 and 140.26
confirmed the presence of a tri-substituted double bond between C-7 and C-8 while the peaks at
δ 33.03, 22.09 and 15.18 were assigned to the three methyl groups at C-13, C-14 and C-15,
respectively (Fukuyama et al., 1982). The fragment ion peaks in the EIMS (70 eV) spectrum at
m/z 232 [M-H2O]+, 221 [M-CHO]+, 204, and 189 further supported the presence of a dialdehyde
drimane sesquiterpene (Kubo et al., 1976; Ayer and Talamas, 1988; Kioy et al., 1989; 1990a;
Mashimbye et al., 1999).
Further examination of the 1H NMR spectrum revealed an olefinic peak at δ 7.28 (dd, J =
4.8, 2.8 Hz) which confirmed the presence of the tri-substituted carbon-carbon double bond
between C-7 and C-8. The signals at δ 9.73 and 9.41 were assigned to the aldehyde carbon atoms
at C-11 and C-12, respectively while the three singlets at δ 1.09, 0.99 and 0.95, integrating for
three protons each, confirmed the three methyl groups at C-13, C-14 and C-15, respectively. On
the basis of the spectral data (Table 5) as well as comparison with the reported data in the
literature (Kubo et al., 1976; Fukuyama et al., 1982; Ayer and Talamas, 1988; Kioy et al., 1989;
1990a; Mashimbye et al., 1999), compound 14 was concluded to be warburganal.

55
Table 5: 13C (90 MHz) and 1H (360 MHz) NMR data of compound 14 in CDCl3
Carbon 13C (δC) Multiplicity 1H (δH, mult, J in Hz) 13C (δC)*
1 41.26 CH2 1.80 m, 1.26 m 41.3 2 17.72 CH2 1.69 m 17.7 3 31.12 CH2 1.54 m 31.2 4 33.04 C - 33.0 5 41.68 CH 1.89 dd, 11.8, 5.1 41.7 6 25.92 CH2 2.58 dt, 21.6, 5.1
2.35 ddd, 21.6, 11.8, 3.0 25.9
7 157.63 CH 7.28 dd, 4.9, 2.8 157.2 8 140.26 C - 140.5 9 77.65 C 4.09 s (OH) 77.1 10 41.43 C - 41.4 11 202.27 CH 9.73 s 202.0 12 192.70 CH 9.41 s 192.5 13 33.01 CH3 1.09 s 33.0 14 22.09 CH3 0.99 s 22.0 15 15.18 CH3 0.95 s 17.0
* 13C NMR data of warbuganal from literature (Ayer and Talamas, 1988)
Mukaadial [15], Rf value 0.61 (CH2Cl2-MeOH, 97:3), mp 228-
229 °C, [α]D -35° (MeOH, c, 0.5), isolated as white crystals, showed a
molecular formula C15H22O4 as determined by 1H, 13C NMR, DEPT)
data (Table 6) and a molecular ion peak, [M]+ at m/z 266 in the EIMS
spectrum. The IR spectrum showed significant peaks at 3347, 2798,
2701, 1720 and 1697 cm-1 suggesting OH, aldehyde functional groups
and carbon-carbon double bond (Kubo et al., 1983; Kioy et al., 1989).
13C NMR and DEPT spectra of 15 (Appendix 3) showed 15 distinct resonances
attributed to three methyl, three methylene, two methine, three quaternary, two olefinic and two
carbonyl carbons. The spectrum resembled closely that of polygodial [13], with the major
difference being the presence of two peaks at δ 77.40 and 66.98 for hydroxylated quaternary and
methine carbons at C-9 and C-6, respectively (Kubo et al., 1983; Kioy et al., 1989; 1990a;
1990b). Peaks at δ 203.49 and 193.47 were assigned to the aldehyde carbons at C-11 and C-12,
respectively while peaks at δ 158.99 and 138.76 were attributed to the olefinic carbons at C-7
and C-8, respectively. The peaks at δ 36.24, 22.48 and 17.89 confirmed the presence of the three
CHO
CHO
15
OH
OH
H

56
methyl groups at C-13, C-14 and C-15, a fact which was further supported by the presence of
three singlets at δ 1.15, 1.08 and 1.03 integrating for three protons each in the 1H NMR spectrum
(Appendix 3). Other significant peaks in the 1H NMR spectrum were at δ 9.64(s) and 9.40(s)
which confirmed the presence of the two –CHO functional groups; δ 7.03 (s) indicating a vinylic
proton (R2C=CHR); δ 5.15 (s) and 5.04 (s) assigned to the hydroxyl groups and δ 4.41(ddd, J =
10.8, 9.0 and 2.4 Hz) assigned to the proton at C-6 (Kubo et al., 1983; Kioy et al., 1989; 1990a;
Ying et al., 1995).The large coupling costant observerd between H-5 and H-6 showed H-6 to be
equitorial position thus suggesting the stereochemistry at C-6 to be a shown in 15 (Kioy et al.,
1989). Based on the spectroscopic data as well as comparison with the reported data in
literature, compound 15 was identified as mukaadial.
Table 6: 13C (90 MHz) and 1H (360 MHz) NMR data of 15 in CDCl3
Carbon 13C (δC) Multiplicity 1H (δH, mult, J in Hz) 13C (δC)* 1 42.82 CH2 1.76 ddd (13.2, 13.2, 3.4)
1.42 m 42.4
2 32.84 CH2 1.75 m 32.6 3 17.77 CH2 1.37 m 17.3 4 36.24 C - 36.2 5 47.43 CH 1.89 d (10.8) 47.9 6 66.98 CH 4.41 ddd (10.6, 9.0, 2.4)
5.04 d (4.5) 67.2
7 158.99 CH 7.03 s 158.7 8 138.76 C - 139.3 9 77.40 C 5.15 s 77.6 10 43.09 C - 43.1 11 203.49 CH 9.64 s 202.5 12 193.47 CH 9.40 s 192.3 13 17.89 CH3 1.03 s 17.1 14 22.48 CH3 1.08 s 21.9 15 36.24 CH3 1.15 s 35.8
* 13C NMR (90 MHz, pyridine-d5) data of mukaadial from literature
(Kioy et al., 1989)
Ugandensidial [16] was isolated as white needles from n-hexane:
ethyl acetate, Rf value 0.18 (n-haxane: ethyl acetate 1:1), mp 136-137
°C, [α]D -360° (MeOH, c, 2.5). The NMR data of compound 16 (Table
CHO
CHO
16
OH
OAc
H

57
7) were similar to those of mukaadial [15] except for the presence of two extra peaks at δ 169.95
and 21.46 in the 13C NMR spectrum supported by a singlet at δ 2.15 in the 1H NMR spectrum
(Appendix 4), integrating for three protons, which suggested that 16 is the acetylated mukaadial
(Brooks and Draffan, 1969a; Al-Said et al., 1990; Kioy et al., 1990a).The 13C NMR spectrum of
16 displayed a total of 17 distinct carbon signals corresponding to four methyl, three methylene,
five methine and five quaternary carbon atoms. Peaks at δ 201.02 and 192.94 suggested the
presence of an isolated and a conjugated carbonyl carbon, respectively, while those at δ 148.54
and 140.89 confirmed the presence of a trisubstituted carbon-carbon double bond at C-7, thus
confirming the basic skeleton to be a drimane type sesquiterpene (Brooks and Draffan, 1969a;
Al-Said et al., 1990; Kioy et al., 1990). Signals at δ 76.60 and 66.97 confirmed the presence of
the two hydroxylated carbons atoms at C-9 and C-6.
Table 7: 13C (90 MHz) and 1H (360 MHz) NMR data of compound 16 in CDCl3
Carbon 13C (δC) Multiplicity 1H (δH, mult, J in Hz) 1H (δH,)* 1 44.00 CH2 1.79 m nr 2 32.57 CH2 1.60 m nr 3 17.59 CH2 1.55 m nr 4 33.91 C - - 5 44.87 CH 2.05 d (4.7) 2.04 6 66.97 CH 5.90 t (4.7) 5.89 7 148.54 CH 7.01 d (4.7) 7.00 8 140.89 C - - 9 76.60 C 4.10 t (1.4) 4.10 10 41.54 C - - 11 201.02 CH 9.77 s 9.76 12 192.94 CH 9.49 s 9.48 13 17.67 CH3 1.17 s 1.17 14 24.74 CH3 1.34 s 1.34 15 31.80 CH3 1.03 s 1.03
CH3CO 169.95 C - - CH3CO 21.46 CH3 2.15 s 2.14
* 1H NMR (250 MHz, CDCl3) data of ugandensidial from literature (Kioy et al., 1990a)
nr = not recorded

58
Examination of the 1H NMR spectrum futher showed the presence of three tertiary
methyl groups (δ 1.03 s, 1.34 s 1ndd 1.17 s) and an olefinic proton (δ 7.01 s), thus further
supporting the aforesaid facts (Brooks and Draffan, 1969b; Kioy et al., 1989; Fukuyama et al.,
1985). The peaks at δ 9.77 and 9.49 as usual were assigned to the aldehyde protons at C-11 and
C-12, respectively, while a triplet at δ 5.90 (t, J = 4.7 Hz) was assigned to the proton at C-6
(Kioy et al., 1990a). The stereochemistry at C-6 was assigned as shown due to the small
coupling constant between H-5 and H-6. Based on the NMR data (Table 7), the EIMS diagnostic
peaks at m/z 280, 279 [M-CHO], 248 [M-HOAc], 237, 109 and 69 as well as comparison with
data from the literature, compound 16 was identified as ugandensidial.
Muzigadial [22], mp 123-125 °C and Rf value of 0.33
(n-hexane: ethyl acetate 3:2), was isolated as white plate-like
material from n-hexane - ethyl acetate mixture with [α]D -230°
(MeOH, c, 2.0). Infrared (IR) spectrum of 22 showed
significant absorption peaks at 3455 cm-1 suggesting the
presence of OH group; 1722 cm-1 indicating the presence of
>C=O carbon and 1685 cm-1 indicating the presence of C=C (Kubo et al., 1977; Kioy et al.,
1990a; Mashimbye et al., 1999; Rabe et al., 2000).
The EIMS spectrum of 22 which gave a molecular ion peak at m/z 248 [M] +
corresponding to the molecular formula C15H20O3 and was further supported by 13C NMR and
DEPT spectrum (Appendix 5) which afforded 15 distinct signals consisting of four quaternary,
five methine, four methylene and two methyl carbon atoms suggested a drimane type
sesquiterpene. The four olefinic peaks at δ155.64, 151.61, 139.95 and 106.07 in the 13C NMR
spectrum (Table 8) confirmed the presence of exocyclic and internal carbon-carbon double bonds
at C-4 and C-7 (Al-Said et al., 1990; Ying et al., 1995). The presence of the two aldehyde groups
at C-11 and C-12 was confirmed by the two carbonyl peaks at δ 201.21 and 192.66 while the
signal at δ 77.61 confirmed the presence of the oxygenated quaternary carbon C-9 (Kioy et al.,
1989; Kioy et al., 1990a; Ying et al., 1995).
CHO
CHO
22
OH
H

59
Above evidence was further supported by the 1H NMR spectrum of 22 which was in
agreement with data previously reported for compound 22 (Kioy et al., 1990; Ying et al., 1995).
A singlet at δ 0.88 and a doublet at δ 1.08 (J = 6.6 Hz), integrating for three protons each, were
assigned to the methyl groups at C-15 and C-14, respectively. The peaks at δ 9.64 and 9.43 in the 1H NMR spectrum further confirmed the presence of two aldehyde protons (CHO) while the
olefinic signals at δ 4.93 and 4.75 confirmed the presence of a terminal carbon-carbon double
bond between C-4 and C-13 (Kioy et al., 1990a; Ying et al., 1995). The peak at δ 7.24 (t, J = 3.5
Hz) was assigned to the proton at C-7. On the basis of the above evidences as well as comparison
with literature data (Kioy et al., 1990a; Ying et al., 1995; Mashimbye et al., 1999; Rabe et al.,
2000) compound 22 was identified as muzigadial.
Table 8: 13C (90 MHz, CDCl3) and 1H (360 MHz) NMR data of 22 in CDCl3
Carbon 13C (δC) Multiplicity 1H (δH, mult, J in Hz) 13C (δC)* 1 31.70 CH2 2.01 m;1.68 m 31.7 2 30.83 CH2 1.71 m 30.9 3 38.18 CH 1.10 m 38.2 4 151.61 C - 151.6 5 40.21 CH 2.65 m 40.2 6 27.59 CH2 2.63 m; 2.55 m 27.6 7 155.64 CH 7.24 t, 3.5 155.8 8 139.95 C - 139.9 9 77.61 C 4.05 s (OH) 77.6
10 42.33 C - 42.4 11 201.21 CH 9.64 s 201.3 12 192.66 CH 9.43 s 192.3 13 106.07 CH2 4.93 br s; 4.75 br s 106.1 14 18.38 CH3 1.08 d, 6.6 18.4 15 15.05 CH3 0.88 s 15.1
* 13C NMR data of muzigadial from literature (Ying et al., 1995)

60
6α-Hydroxymuzigadial [23]
Compound 23 was isolated as white crystals from n-
hexane- ethyl acetate mixture and had an Rf value 0.59
(CH2Cl2-MeOH 97:3), mp 150-152 °C and [α]D -97° (MeOH,
c, 0.35). The IR spectrum of 23 exhibited significant
absorption peaks at 3360, 1727 and 1678 cm-1 suggesting the
presence of a hydroxyl, carbonyl carbon and C=C (Wube et al., 2005). The 13C NMR data (Table
9) were similar to those reported for muzigadial [22] (Kubo et al., 1977; Kioy et al., 1990a;
1990b; Rabe et al., 2000) except for presence of an oxymethine peak at δ 65.94 which suggested
an additional OH group at C-6 (Kioy et al., 1990a; 1990b; Brooks and Draffan, 1969a). The 13C
NMR spectrum (Appendix 6) showed a total of 15 carbons corresponding to two methyl, three
methylene, six methine and four non-protonated carbons. The presence of dialdehyde functional
groups was confirmed by 1H-13C detected heteromolecular multiple quantum coherence (HMQC)
experiments where the carbon peaks at δ 200.53 (C-11) and 192.61 (C-12) correlated with
protons at δ 9.66 and 9.50, respectively. The four olefinic peaks in the 13C NMR spectrum at δ
148.78, 153.92, 139.07 and 106.79 confirmed the presence of two carbon-carbon double bonds
in the molecule. The methylene peak at δC 106.79 coupled with two vinylic protons at δH 5.13
and 5.02. Similarly, the methine peak at δC 153.92 coupled to a proton at δ 7.09 in the HMQC
spectrum, thus allowing the placement of the carbon-carbon double bonds at C-4 and C-7
(Brooks and Draffan, 1969a; Kioy et al., 1989; 1990a; Ying et al., 1995). The stereochemistry of
C-6 OH group was established as axial because of the large coupling constant observed between
the 6-H and 5-H (Kubo et al., 1977; 1983; Kioy et al., 1990a; Rabe et al., 2000 Wube et al.,
2005). The proton signals at δ 1.12 and 0.95, integrating for three protons each, and correlated to
the carbon peaks at δ 18.15 and 15.78, respectively, confirmed the methyl carbons at C-14 and
C-15.
The above data was further supported by the EIMS data which afforded a molecular ion
peak at m/z 265 [M+1]+ corresponding to the molecular formula C15H20O4. Other diagnostic
peaks in the CI-MS spectrum were those at m/z 247 [M-H2O]+, 235 [M-CHO), 229 and 173. On
the basis of the spectral data as well as comparison with literature data, compound 23 was
identified as 6α-hydroxymuzigadial.
CHO
CHO
23
OH
OH
H

61
Table 9: 13C (90 MHz) and 1H (360 MHz) NMR data of 23 in CDCl3
Carbon 13C (δC) Multiplicity 1H (δH, mult, J in Hz) 1 31.62 CH2 2.02 m, 1.69 m 2 31.57 CH2 1.73 m, 1.03 m 3 38.62 CH 2.02 m 4 148.87 C - 5 50.18 CH 2.63 d (9.6) 6 65.94 CH 4.67 ddd (9.6, 8.1, 2.4) 7 153.92 CH 7.09 d ( 9.5) 8 139.75 C - 9 77.30 C 4.12 s
10 44.02 C - 11 200.53 CH 9.65 s 12 192.61 CH 9.50 s 13 106.72 CH2 5.13 s,5.02 s 14 18.15 CH3 1.12 d, 6.6 15 15.78 CH3 0.95 s
9-Deoxymuzigadial [101]
Compound 101 was isolated as Pale yellow oil, Rf
value 0.22 (n-hexane: ethyl acetate 4:1), [α]D -78° (MeOH, c,
0.35). The ESI-MS spectrum of 190 which showed a
molecular ion peak at m/z 255 [M+Na]+ corresponding to a
molecular mass of 232 amu The 13C NMR and DEPT spectra
(Appendix 7) which displayed 15 distinct carbon signals
corresponding to two methyl, four methylene, six methine and three quaternary carbon atoms
suggested 101 to be a sesquiterpene. The 1H and 13C NMR data of 101 (Table 10) exhibited
signals that were similar to those previously reported for muzigadial [22] (Kubo et al., 1977; El-
Feraly et al., 1978; Al-Said et al., 1990), except for the absence of the oxygenated carbon signal
at C-9. Instead, a methine signal at δ 58.3 attributed to the same carbon was observed suggesting
101 to be deoxymuzigadial (Kioy et al., 1989; 1990a; Al-Said et al., 1990). The 13C NMR
spectrum signals at δ 201.21 and 192.66 confirmed the presence of an isolated and a conjugated
carbonyl carbons at C-11 and C-12, respectively, while the peaks at δ 155.64, 151.61, 139.95 and
106. 07 confirmed the presence of internal and exocyclic double bonds (Al-Said et al., 1990;
CHO
CHO
H
101
H

62
Ying et al., 1995). Other diagnostic peaks in the 13C NMR spectrum were observed at δ 15.05
and 18.58 corresponding to the methyl carbons at C-15 and C-14, respectively.
The 1H NMR spectrum displayed three olefinic peaks δ 7.23 dd (J = 4.0, 2.3 Hz), 4.93 dd
(J = 1.5, 1.5 Hz) and 4.75(s) further confirmed the presence of the double bonds (Al-Said et al.,
1990). The two singlets at δ 9.64 and 9.44 were assigned to the aldehyde protons at C-11 and C-
12, respectively. Based on the spectral data as well as comparison with literature data, compound
101 was concluded to be 9-deoxymuzigadial (Brooks and Draffan, 1969b; Kioy et al., 1990a).
Table 10: 13C (90 MHz) and 1H (360 MHz) NMR data of compound 101 in CDCl3
Carbon 13C (δC) Multiplicity 1H (δH, mult, J in Hz) 13C (δc)* 1 31.70 CH2 1.92 m, 1.72 m 31.4 2 30.83 CH2 1.68 m, 1.15 m 31.6 3 38.18 CH 2.03 m 38.5 4 151.61 C - 151.3 5 42.33 CH 2.51 m 45.8 6 27.59 CH2 2.48 m 27.0 7 155.64 CH 7.23 dd (4.0, 2.3 ) 152.9 8 139.95 C - 137.9 9 58.26 CH 2.65 m 58.3 10 40.21 C - 38.2 11 201.21 CH 9.64 s 201.1 12 192.66 CH 9.44 s 193.3 13 106.07 CH2 4.93 dd (1.5, 1.5), 4.75 s 106.0 14 18.38 CH3 1.07 d (6.3) 18.4 15 15.05 CH3 0.78 s 13.5
* 13C NMR (90 MHz, CDCl3) data of 9-deoxymuzigadial (Al-Said et al., 1990)

63
Ugandensolide [20]
Compound 20 was isolated as white needle crystals from CH2Cl2-
MeOH (9:1), mp 215-218 °C, Rf value 0.46 (CH2Cl2-MeOH 97:3), [α]D
+23° (MeOH, c, 1.0). The EIMS spectrum of 20 showed an ion peak at
m/z 308 corresponding to a molecular formula C17H24O4. Other diagnostic
peaks in the EIMS spectrum were observed at m/z 290 [M-H2O]+, 248
[M-HOAc]+, 230, 202 and 175.
The 1H and 13C NMR data (Table 11) were similar to those
previously reported for ugandensolide (Brooks and Draffan, 1969a; Canonica et al., 1969a; Kioy
et al., 1990a; 1990b; Mohanlall and Odhiv, 2009). In the 13C NMR spectrum (Appendix 8) 17
distinct peaks corresponding to four methyl, four methylene, three methine and six non-
protonated carbon atoms were observed, suggesting an acetylated drimane sesquiterpene. The
presence of an acetate group was supported by the signal at δ 2.03 s in the 1H NMR spectrum
integrating for three protons, and a signal at δ 170.96 in the 13C NMR spectrum. The 13C NMR
spectrum als exhibited a carbonyl peak at δ 171.85 suggesting the presence of a lactone system
(Canonica et al., 1969a; Kioy et al., 1990a; 1990b). Olefinic peaks at δ 154.09 and 137.95
confirmed the presence of a carbon-carbon double bond, which was confirmed to be tetra-
substituted by the absence of olefinic peak in the 1H NMR spectrum (Brooks and Draffan, 1969a,
Kioy et al., 1989; 1990a).
O
O
OAc
OH
20
H

64
Table 11: 13C (90 MHz) and 1H (360 MHz) NMR data of compound 20 in CDCl3
Carbon 13C (δC) Multiplicity 1H (δH, mult, J in Hz) 1H (δH,)* 1 42.99 CH2 2.53 d (12.8) 2.55 2 18.26 CH2 1.68 m nr 3 36.29 CH2 1.18 m nr 4 35.27 C - - 5 49.23 CH 1.63 (1.5) 1.61 6 73.78 CH 5.34 s 5.36 7 66.04 CH 4.17 dd (5.5, 1.0)
3.57 d (5.5) 4.21
- 8 154.09 C - - 9 137.95 C - - 10 33.32 C - - 11 171.85 C - - 12 69.70 CH2 4.85 d (17.2)
4.61 dd (17.2, 1.0) 4.91 4.65
13 20.71 CH3 1.43 s 1.47 14 33.07 CH3 1.02 s 1.05 15 21.36 CH3 1.00 s 1.02
CH3CO 170.96 C - - CH3CO 23.04 CH3 2.03 s 2.09
* 1H NMR (250 MHz, CDCl3) data of ugandensolide (Kioy et al., 1990a)
nr = not reported.
The OH proton at δ 3.57 was coupled with a proton at δ 4.17 dd (J = 5.5, 1.0 Hz)
confirming the OH to be secondary. The peaks at δ 73.78, 66.04 and 69.70 in the 13C NMR
spectrum confirmed the presence of two oxymethine and lactone methylene carbons at C-6, C-7
and C-12, respectively. The three singlets at δ 1.00, 1.02 and 1.43, integrating for three protons
each, were assigned to the tertiary methyl carbons at C-13, C-14 and C-15 (Brooks and Draffan,
1969b; Kioy et al., 1990a). A broad singlet at δ 5.34 was assigned to the proton on the carbon
bearing the acetate (-CH-OAc) while two doublet at δ 4.85 and 4.61, J = 17.2 Hz each, were
assigned to the lactone methylene protons, -O-CH2- (Brooks and Draffan, 1969a). The rest of the
NMR peaks were assigned as shown in Table 11. Based on the spectral data as well as
comparison with literature data, compound 20 was identified as ugandensolide

65
7α-Acetylugandensolide [104]
Compound 104 Rf 0.34 (n-hexane - ethyl acetate 1:1), mp 228-
230 oC, [α]D +24° (MeOH, c, 0.01); was isolated as white gummy
material. High resolution mass spectrum (HRMS, 70 eV) spectrum
(Appendix 9) displayed a molecular ion peak at m/z 350 [M]+
corresponding to C19H26O6 formula. The IR spectrum showed the
presence of an ester carbonyl (1732 cm-1), lactone (1680 cm-1) and
olefinic bond (1632 cm-1). The 13C NMR spectrum exhibited 19
distinct carbon signals corresponding to five methyl, four methylene,
three methine and seven quaternary carbon atoms. The 13C NMR data (Table 12) were similar to
those previously reported for ugandensolide [20], except for the presence of two additional
peaks at δ 169.78 and 20.76 which suggested the compound to be acetylated ugandensolide
(Kioy et al., 1989; 1990a; 1990b), confirmed by the 1H NMR spectrum (Appendix 9) exhibited
a singlet at δ 2.08 integrating for three protons. The absence of the dialdehyde peaks in 13C
NMR spectrum and the presence of peaks at δ 170.90 and 70.22 signified lactone carbonyl and
methylene carbons, respectively (Canonica et al., 1969a; Kioy et al., 1990a). Peaks at δ 69.64
and 66.60 which correlated to protons δ 5.54 (tr, J = 1.7 Hz Hz) and 5.15 (dd, J = 1.3 Hz) in the
HMBC spectrum were assigned to the oxymethine carbons at C-6 and C-7 respectively further
confirmed the diacetyl groups. The stereochemistry at C-6 and C-7 followed from the small
vicinal coupling constants of protons at H-5, H-6 and H-7 (Brooks and Draffan, 1969a; Kioy et
al., 1990a).
O
O
OAc
OAc
104
H

66
Table 12: 13C (90 MHz) and 1H (360 MHz) NMR data compound 104 in CDCl3
Carbon 13C (δC) Multiplicity 1H (δH, mult, J in Hz) 1 43.06 CH2 2.56 d tr d (13.1, 3.5, 1.6)
1.19 tr dd (13.2, 3.8, 0.8) 2 18.26 CH2 1.80 m; 1.62 m 3 36.27 CH2 1.53 m; 1.29 tr dd (13.6, 4.1, 0.8) 4 35.41 C - 5 50.54 CH 1.54 d (1.7) 6 69.64 CH 5.54 tr (1.7) 7 66.60 CH 5.15 dd (1.3) 8 150.62 C - 9 140.29 C - 10 33.34 C - 11 170.90 C - 12 70.22 CH2 4.71 dd (17.8, 1.1)
4.6 1 d (17.7) 13 22.85 CH3 1.05 s 14 33.14 CH3 1.03 s 15 20.56 CH3 1.51 s
6-CH3CO 171.06 C - 6-CH3CO 21.27 CH3 2.13 s 7-CH3CO 169.78 C - 7-CH3CO 20.76 CH3 2.08 s
The position of carbon – carbon double bond was confirmed to be between C-8 and C-9
by the presence of quarenary carbon peaks at δ 150.62 and 140.29 (Canonica et al., 1969a; Kioy
et al., 1990a; 1990b). Other diagnostic peaks in 13C NMR observed at δ 22.85, 33.14 and 20.56
were assigned to methyl carbons (C-13, C-14 and C-15). In the HMQC spectrum, peaks at δ 4.71
(dd, J = 17.8, 1.1 Hz) and 4.61 (d, J = 17.7 Hz) which correlated to the carbon peak at δ 70.22
further confirmed oxymethylene protons (-OCH2). On the basis of the above spectral evidence
together with further diagnostic peaks in the EIMS spectrum at m/z 307 [M-CH3CO] +, 290 [M-
HOAc]+, 232 [M-OAc-OAc]+ and 247 [M-OAc-CH3]+, compound 104 was identified as 7α-
acetylugandensolide. Synthetic 104 was previously reported by Brooks and Draffan (1969b) but
it was isolated from W. ugandensis in this study.

67
Deacetoxyugandensolide [21]
Compound 21, white needles from n-hexane-ethyl acetate-MeOH
(97:2.5:0.5), had mp 260-264 °C, Rf value 0.4 (CH2Cl2-MeOH, 95:5) and
[α]D +70° (MeOH, c, 1.0). IR spectrum showed significant peaks at 3350
(OH) and 1727 (>C=O) cm-1. The EIMS of the compound gave an ion
peak at m/z 266 corresponding to a molecular formula C15H22O4 and was
supported by the 13C NMR spectrum (Appendix 10) which gave 15
distinct carbon signals attributed to three methyl, four methylene, three
methine and five non-protonated carbons. The 1H and 13C NMR data of
21 (Table 13) were in agreement with those previously reported for deacetoxylugandensolide
(Brooks and Draffan, 1969a; Kioy et al., 1989; 1990a; Ying et al., 1995). The 13C NMR peaks at
δ 171.46 was assigned to the lactone carbonyl carbon at C-11 while the olefinic signals at δ
155.59 and 134.25 confirmed the presence a carbon - carbon double bond between C-8 and C-9,
a fact further supported by the absence of a vinylic proton peak in the 1H NMR spectrum, thus
confirming the double bond to be tetrasubstituted (Brooks and Draffan, 1969b; Kubo et al.,
1983; Kioy et al., 1989; 1990a; 1990b). Similarly, the 13C NMR peak at δ 68.19 was assigned to
the lactone oxymethylene carbon (-OCH2R) while those at δ 70.12 and 67.64 were assigned to
the oxymethine carbons (-OCHR2) at (C-6 and C-7). Peaks at δ 32.90, 22.83 and 19.94 were
assigned to the tertiary methyl carbons atoms positioned at C-13, C-14 and C-15.
The 13C NMR data were supported by the 1H NMR spectrum which gave peaks at δ 5.17
(s) and 4.30 (s) assigned to oxymethine protons (H-6 and H-7) while signals at δ 4.88 d (J = 17.2
Hz) and 4.65 d (J = 17.2 Hz) were assigned to the lactone oxymethylene protons. The presence
of the three tertiary methyl groups was confirmed by the singlets at δ 1.49, 1.24 and 1.03 (Brooks
and Draffan, 1969a; Kioy et al., 1989, 1990a; 1990b). Based on the spectral data as well as
comparison with literature data, compound 21 was identified as deacetoxyugandensolide.
O
O
OH
OH
21
H

68
Table 13: 13C (90 MHz) and 1H (360 MHz) NMR data of compound 21 in CDCl3
Carbon 13C (δC) Multiplicity 1H (δH, mult, J in Hz) 13C (δc)* 1 42.43 CH2 2.42 m 42.4 2 17.85 CH2 17.8 3 35.80 CH 35.9 4 34.75 C - 34.7 5 49.00 CH 2.83 m 49.2 6 70.12 CH 5.71 s, 4.12 s (OH) 71.0 7 67.64 CH 4.30 s, 3.94 s (OH) 68.8 8 155.59 C - 156.9 9 134.25 C - 135.7 10 33.24 C - 33.6 11 171.46 C - 171.6 12 68.19 CH2 4.88 d (17.2), 4.65 d (17.2) 69.3 13 19.94 CH3 1.49 s 20.0 14 32.90 CH3 1.24 s 32.7 15 22.83 CH3 1.03 s 27.7
* 13C NMR (90 MHz, CDCl3) data of deacetoxylugandensolide (Kioy et al., 1990a)
Cinnamolide [17]
Compound 17 was isolated as white crystals from n-hexane-
ethyl acetate mixture and had mp 126-128 °C, Rf value 0.42 (n-
hexane-ethyl acetate 4:1) and [α]D -29° (MeOH, c, 0.1). Its IR
spectrum showed diagnostic peaks at 1754 and 1689 cm-1 sugesting
the presence of carbonyl and alkene functional groups. The EIMS
spectrum (Appendix 11) afforded a molecular ion peak at m/z 234
suggesting a formula C15H22O2 and was supported by 13C NMR spectrum and DEPT experiments
which exhibited 15 carbon signals attributed to three methyl, five methylene, three methine and
four non-protonated carbon atoms. The NMR data of 17 (Table 14) were similar to those
reported for cinnamolide (Canonica et al., 1967a; Kubo et al., 1976; Kioy et al., 1989; 1990a;
1990b; Ying et al., 1995). Infact, the 13C NMR peak at δ 169.suggested the presence of lactone
carbonyl carbon while peaks at δ 135.90 and 126.98 inferred the presence of a tri-substituted
carbon-carbon double bond at C-7 (Canonica et al., 1967a; Kubo et al., 1976). The carbon-
carbon double bond was confirmed to be tri-substituted by the presence of an olefinic peak at δ
O
O
17
H
H

69
6.88 dd (J = 4.5, 3.5 Hz) in 1H NMR spectrum assigned to H-7. The 13C NMR peaks at δ 32.52,
21.00 and 13.07 confirmed the presence of three tertiary methyl carbons at C-13, C-14 and C-15,
respectively (Kubo et al., 1976; Canonica et al., 1967a).
In the 1H NMR spectrum, diagnostic peaks at δ 4.38 d (J = 10.0 Hz) and 4.04 d (J = 10.0
Hz) were assigned to the lactone oxymethylene protons at C-11 while those at δ 0.81 s, 0.92 s
and 0.95 s integrating for three protons each, signified the methyl protons at C-13, C-14 and C-
15 (Kioy et al., 1989; 1990a; Ying et al., 1995). Based on the spectral data as well as comparison
with literature data, compound 17 was identified as cinnamolide.
Table 14: 13C (90 MHz) and 1H (360 MHz) NMR data of compound 17 in CDCl3
Carbon 13C (δC) Multiplicity 1H (δH, mult, J in Hz) 1H (δH,)* 1 39.13 CH2 1.60 m, 1.22 m nr 2 18.19 CH2 1.50 m nr 3 41.86 CH2 1.30 m nr 4 33.92 C - - 5 50.49 CH 1.40 dd (11.7, 5.3) 1.38 6 24.66 CH2 2.39 m, 2.12 m 2.10 7 135.90 CH 6.88 dd (4.5, 3.5) 6.87 8 126.98 C - - 9 49.37 CH 2.83 dd (9.2, 3.5) 2.80 10 32.82 C - - 11 66.88 CH2 4.38 d (10.0), 4.04 d (10.0) 4.38, 4.04 12 169.81 C - - 13 32.52 CH3 0.92 s 0.92 14 21.00 CH3 0.95 s 0.94 15 13.07 CH3 0.81 s 0.81
* 1H NMR (250 MHz, CDCl3) data of cinnamolide from literature (Kioy et al., 1990)
Nr = not reported

70
3β-Acetoxycinnamolide [19]
Compound 19 was isolated as white crystals from n-
hexane-ethyl acetate and had mp 152-155 °C, Rf value 0.26 (n-
hexane-ethyl acetate 4:1), and [α]D +7° (MeOH, c, 0.1). The
EIMS spectrum of 19 gave a molecular ion peak at m/z 292
corresponding to molecular formula C17H24O4. This was
supported by 13C NMR and DEPT spectra (Appendix 12) which
showed 17 carbon peaks corresponding to four methyl, four methylene, four methine and five
quaternary carbon atoms. The 1H and 13C NMR data of 19 (Table 15) were similar to those
reported for 3β-acetoxylcinnamolide (Canonica et al., 1967a; 1967b; Kioy et al., 1990a, 1990b;
Ying et al., 1995). The 13C NMR peaks at δ 170.52 and 169.56 were attributable to the lactone
and acetyl carbonyl carbons, respectively while peaks at δ 135.56 and 127.00 were assignable to
the olefinic carbons (Canonica et al., 1967a; 1967b; Kioy et al., 1990a). Other siginificant peaks
were at δ 79.92 assigned to the acetylated carbon at C-3; δ 66.74 assigned to lactone
oxymethylene carbon at C-11; δ 27.58, 21.08, 15.84, 13.32 attributed to the methyl carbons at C-
13, C-14, C-15 and MeCO (Kioy et al., 1990a 1990b, Ying et al., 1995).
The 13C NMR data were supported by 1H NMR spectrum which confirmed the presence
of a vinyl proton at δ 6.87 dt (J = 6.8, 3.5 Hz) and lactone oxymethylene protons at δ 4.39, t (J =
9.2 Hz) and 4.05 t (J = 9.2 Hz). The spectrum also showed the presence of an oxymethine proton
(H-3) at δ 4.52 with two coupling constants, one of which (J = 11.5 Hz) indicating an axial
configuration, thus confirming the acetyl group to be in equatorial (β) position. Other significant
peaks in the 1H NMR spectrum of 19 were at δ 2.07, 0.82, 0.92 and 0.98 each integrating for
three protons and were assigned to methyl protons of MeCO and C13, C14 and C15 methyls
(Canonica et al., 1967a; 1967b; Kioy et al., 1990a, 1990b; Ying et al., 1995). Based on the
spectral data as well as comparison with literature data, compound 19 was identified as 3β-
acetoxycinnamolide.
O
AcO
O
19
H
H

71
Table 15: 13C (90 MHz) and 1H (360 MHz) NMR data of 19 in CDCl3
Carbon 13C (δC) Multiplicity 1H (δH, mult, J in Hz) 13C (δc)* 1 36.64 CH2 1.42 m, 1.64 m 36.7 2 23.33 CH2 1.72 m 23.4 3 79.92 CH 4.52 dd (11.5, 5.0) 80.0 4 33.80 C - 33.9 5 50.34 CH 1.46 m 50.5 6 24.44 CH2 2.40 m, 2.23 m 36.7 7 135.56 CH 6.87 dt (6.8, 3.5) 135.6 8 127.00 C - 127.1 9 49.06 CH 2.81 dd (4.9, 3.5) 49.2 10 37.43 C - 37.5 11 66.74 CH2 4.39 t (9.2), 4.05 t (9.2) 66.8 12 170.52 C - 170.6 13 13.32 CH3 0.92 s 13.3 14 15.84 CH3 0.98 s 15.8 15 27.58 CH3 0.82 s 27.6
MeCO 169.56 C - 169.6 MeCO 21.08 CH3 2.07 21.0
* 13C NMR (90 MHz, CDCl3) data of 3β-acetoxylcinnamolide (Kioy et al., 1990a)
Bemadienolide [102]
Compound 102 was isolated as white crystals from n-
hexane- ethyl acetate mixture and had mp 124-126 °C, Rf value 0.22
(n-hexane: ethyl acetate, 3:2) and [α]D -181° (MeOH, c, 0.35). Its
EIMS spectrum exhibited a molecular ion peak at m/z 232
corresponding to molecular formula C15H20O2, a fact that was
supported by 13C NMR and DEPT spectra (Appendix 13) which
showed the presence of 15 carbon atoms consisting of three methyl, four methylene, three
methine and five non-protonated carbon atoms. Its 1H and 13C NMR data (Table 16) were similar
to those previously reported for bemadienolide (Canonica et al., 1967a; 1967b; Kubo et al.,
1977). The 13C NMR peaks at δ 171.66, 131.65, 117.56 and 122.33 cofirmed the presence of an
additional carbon-carbon double bond which was assigned to be between C-6 and C-7 (Canonica
et al., 1967a; 1967b). Other 13C NMR peaks at δ 170.21 and 67.67 were assigned lactone
O
O
102
H

72
carbonyl and oxymethylene carbon atoms, respectively. Other diagnostic peaks observed at δ
32.25, 22.52 and 14.97 were assigned to the three tertiary methyl carbon atoms at C-13, C-14
and C-15, respectively.
The above data was supported by the 1H NMR spectrum (Appendix 14) which gave
peaks at δ 6.32 d (J = 10.0 Hz) and 6.01 d (J = 10.0 Hz) attributed to olefinic protons at C-6 and
C-7; δ 4.83 d (J = 17.2 Hz) and 4.77 d (J = 17.2 Hz) attributed to lactone oxymethylene protons
at C-11; δ 0.99, 1.01 and 1.04 attributed to tertiary the three methyl protons at C-13, C-14 and
C-15 (Canonica et al., 1967a; 1967b; Kubo et al., 1977; Fukuyama et al., 1982). Based on the
spectral data as well as comparison with literature data, compound 102 was identified as
bemadienolide.
Table 16: 13C (90 MHz) and 1H (360 MHz) NMR data of 102 in CDCl3
Carbon 13C (δC) Multiplicity 1H (δH, mult, J in Hz) 1 40.53 CH2 1.68 m 2 17.93 CH2 1.26 m 3 33.53 CH2 1.56 m 4 32.71 C - 5 52.34 CH 2.22 m 6 117.56 CH 6.01 d (10.0) 7 131.65 CH 6.32 d (10.0) 8 122.33 C - 9 171.66 C - 10 36.75 C - 11 67.67 CH2 4.83 d (17.2), 4.77 d (17.2) 12 170.21 C - 13 32.25 CH3 1.01 s 14 22.52 CH3 1.04 s 15 14.97 CH3 0.99 s

73
Drimenin [103]
Compound 103 was isolated as white crystals from n-hexane -
ethyl acetate mixture, mp 131-133 °C, Rf value 0.18 (n-hexane: ethyl
acetate 3:2) and [α]D -42° (MeOH, c, 0.76). The EIMS spectrum of 103
exhibited a molecular ion peak at m/z 235 [M+1]+ suggesting a
molecular formula C15H22O2 and was supported by 13C NMR spectrum
(Appendix 14) which gave a total of 15 peaks attributed to three
methyl, five methylene, three methine and four non protonated carbon
atoms. The 1H and 13C NMR data (Table 17) were similar to those previously reported for
drimenin (Suzuki et al., 1970; Fukuyama et al., 1985; Barrero et al., 1995; Akita et al., 2000).
The 13C NMR peaks at δ 175.31 was suggestive of lactone carbonyl presence while those at δ
121.13 and 129.77 indicated the carbon-carbon double bond at C-7 (Fukuyama et al., 1985;
Barrero et al., 1995). The position of the double bond was supported by the presence of an
olefinic proton signal (δ 5.74 d, J = 4.0 Hz) which demonstrated the carbon-carbon double bond
to be tri-substituted (Fukuyama et al., 1985; Barrero et al., 1995). Other peaks in the 13C NMR
spectrum were observed at δ 69.79 assigned to oxymethylene carbon at C-12; δ 32.95, 21.32 and
13.89 assigned to tertiary methyl carbons at C13 –C15 (Suzuki et al., 1970; Fukuyama et al.,
1985; Akita et al., 2000). The more deshielded resonance for the lactone methylene carbon (δ
69.79) allowed its placement at C-12 as opposed to C-12 in cinnamolide (Kioy et al., 1990;
Fukuyama et al., 1985; Barrero et al., 1995).
O
O
103
H
H

74
Table 17: 13C (90 MHz) and 1H (360 MHz) NMR data of compound 103 in CDCl3
Carbon 13C (δC) Multiplicity 1H (δH, mult, J in Hz) 1H (δH)*
1 38.37 CH2 1.17 – 1.65 m NR
2 18.17 CH2 1.17 – 1.65 m NR
3 23.25 CH2 1.17 – 1.65 m NR
4 34.30 C -
5 53.59 CH 1.98 m NR
6 42.24 CH2 1.78d (12.8), 2.48 d (18.1) NR
7 121.13 CH 5.74 d (4.0) 5.62-5.84
8 129.77 C -
9 49.56 CH 2.78 s NR
10 41.54 C -
11 175.31 C -
12 69.79 CH2 4.66 s 4.57-4.27
13 32.95 CH3 0.87 s
14 21.32 CH3 0.92 s 0.89-0.92
15 13.89 CH3 0.89 s
*1H NMR (250 MHz, CDCl3) data of drimenin from literature (Wenkert and Strike, 1964).
NR = Not reported.
Other diagnostic peaks in the 1H NMR peak of 103 were observed at δ 4.66 s, attributed
to lactone oxymethylene protons (-CO-OCH2-); δ 0.87 s, 0.89 s and 0.92 s attributed to the
methyl protons at C-13, C-14 and C-15 (Fukuyama et al., 1985; Barrero et al., 1995). Based on
the spectral data as well as comparison with literature data, compound 103 was identified as
drimenin.
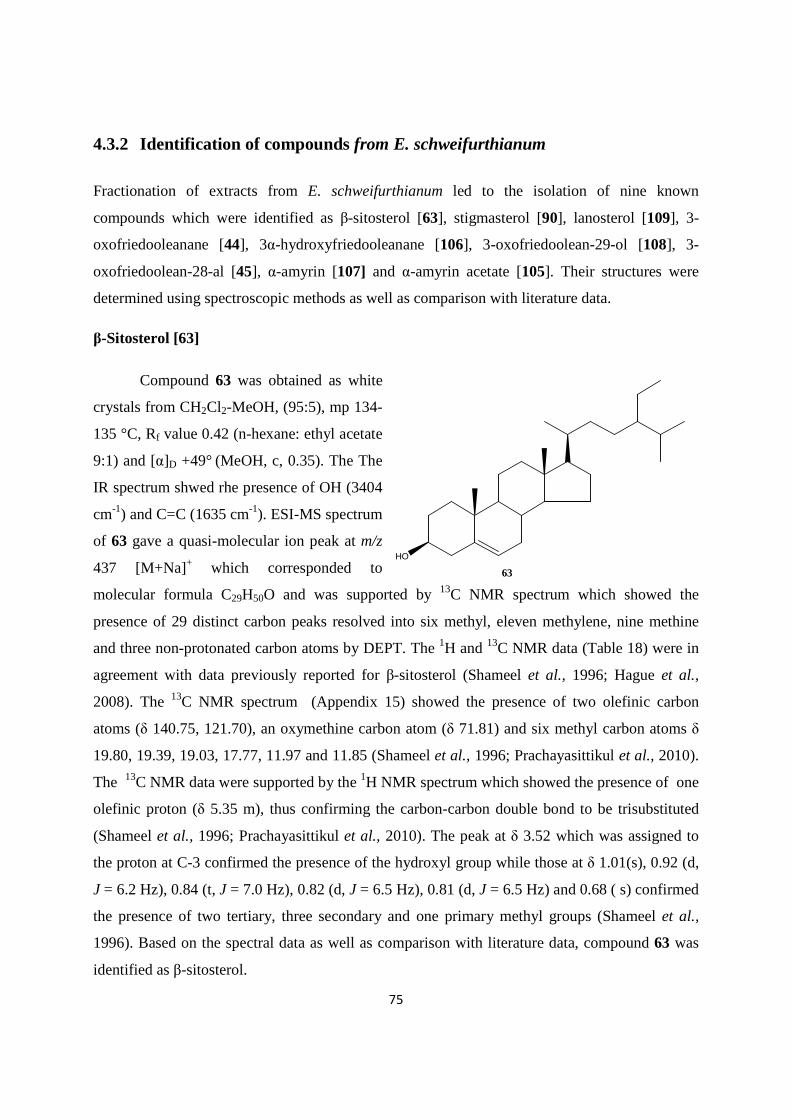
75
4.3.2 Identification of compounds from E. schweifurthianum
Fractionation of extracts from E. schweifurthianum led to the isolation of nine known
compounds which were identified as β-sitosterol [63], stigmasterol [90], lanosterol [109], 3-
oxofriedooleanane [44], 3α-hydroxyfriedooleanane [106], 3-oxofriedoolean-29-ol [108], 3-
oxofriedoolean-28-al [45], α-amyrin [107] and α-amyrin acetate [105]. Their structures were
determined using spectroscopic methods as well as comparison with literature data.
β-Sitosterol [63]
Compound 63 was obtained as white
crystals from CH2Cl2-MeOH, (95:5), mp 134-
135 °C, Rf value 0.42 (n-hexane: ethyl acetate
9:1) and [α]D +49° (MeOH, c, 0.35). The The
IR spectrum shwed rhe presence of OH (3404
cm-1) and C=C (1635 cm-1). ESI-MS spectrum
of 63 gave a quasi-molecular ion peak at m/z
437 [M+Na]+ which corresponded to
molecular formula C29H50O and was supported by 13C NMR spectrum which showed the
presence of 29 distinct carbon peaks resolved into six methyl, eleven methylene, nine methine
and three non-protonated carbon atoms by DEPT. The 1H and 13C NMR data (Table 18) were in
agreement with data previously reported for β-sitosterol (Shameel et al., 1996; Hague et al.,
2008). The 13C NMR spectrum (Appendix 15) showed the presence of two olefinic carbon
atoms (δ 140.75, 121.70), an oxymethine carbon atom (δ 71.81) and six methyl carbon atoms δ
19.80, 19.39, 19.03, 17.77, 11.97 and 11.85 (Shameel et al., 1996; Prachayasittikul et al., 2010).
The 13C NMR data were supported by the 1H NMR spectrum which showed the presence of one
olefinic proton (δ 5.35 m), thus confirming the carbon-carbon double bond to be trisubstituted
(Shameel et al., 1996; Prachayasittikul et al., 2010). The peak at δ 3.52 which was assigned to
the proton at C-3 confirmed the presence of the hydroxyl group while those at δ 1.01(s), 0.92 (d,
J = 6.2 Hz), 0.84 (t, J = 7.0 Hz), 0.82 (d, J = 6.5 Hz), 0.81 (d, J = 6.5 Hz) and 0.68 ( s) confirmed
the presence of two tertiary, three secondary and one primary methyl groups (Shameel et al.,
1996). Based on the spectral data as well as comparison with literature data, compound 63 was
identified as β-sitosterol.
HO
63

76
Stigmasterol [90]
Compound 90 was isolated as white crystals
from CH2Cl2 – MeOH (95:5), mp 169-170 °C, Rf
value 0.16 (n-hexane: ethyl acetate 9:1) and [α]D +51°
(MeOH, c, 2.0). IR spectrum of 23 showed peaks at
3356 and 1647 cm-1 indicating the presence of
hydroxyl group and carbon-carbon double bond,
respectively. The EIMS spectrum afforded a
molecular ion peak at m/z 412 which corresponded to a molecular formula C29H50O. The EIMS
data were supported by 13C NMR and DEPT spectra (Appendix 16) which shows the presence of
29 carbon atoms consisting of six methyl, nine methylene, eleven methine and three quaternary
carbon atoms. The 1H and 13C NMR data (Table 18) were similar to those previously reported for
stigmasterol (Sukurai et al., 1972; Shameel et al., 1996; Reginatto et al., 2001; Forgo and Kover,
2003). The EIMS spectrum further showed daughter ions at m/z 369 [M-C3H7]+, 300 [M-C8H17]
+
and 271 [M-C10H21]+ which were similar to those of stigmasterol (Sukurai et al., 1972; Shameel
et al., 1996; Reginatto et al., 2001). The 13C NMR olefinic peaks at δ 139.56, 138.09, 127.65 and
117.32 confirmed the presence of two carbon-carbon double bonds (tri- and di-substituted) at C-
5 and C-22 while the peak at δ 71.04 confirmed the presence of oxymethine carbon atom at C-3
(Shameel et al., 1996; Reginatto et al., 2001; Forgo and Kover, 2003). Other peaks in the 13C
NMR spectrum were at δ 12.06, 21.99, 21.38, 12.16, 19.05 and 12.9 which confirmed the
presence of six methyl groups and were assigned as shown in Table 18.
The 13C NMR data were supported by 1H NMR spectrum (Table 18) which showed the
presence of three olefinic protons at δ 5.18 m, 5.15 d (J = 15.3 Hz) and 5.03 dd (J = 15.3, 8.1
Hz); a proton attached to a oxymethine carbon atom (δ 3.54 m) and six methyl groups at δ 0.54
s, 0.84 s, 0.78 d (J = 7.1 Hz), 0.82 d (J = 6.5 Hz), 1.00 d (J = 6.5 Hz) and 0.79 t (J = 8.0 Hz)
corresponding to two tertiary, three secondary and one primary methyl groups (Sukurai et al.,
1972; Shameel et al., 1996; Reginatto et al., 2001). Based on the spectral data as well at
comparison with literature information, compound 90 was identified as stigmasterol.
90

77
Lanosterol [109]
Compound 109 was isolated as white crystals from CH2Cl2 – MeOH (95:5) mp 144-145
°C, Rf value 0.46 (n-hexane: ethyl acetate 4:1) and
[α]D +62° (MeOH, c, 1.12). the IR spectrum showed
the presence of OH (3462 cm-1) and C=C (1644cm-1.
The compound was shown to have a molecular
formula of C30H50O as determined by 13C NMR,
DEPT and ESI-MS spectrum (Appendix 17) which
gave a quasi-molecular ion peak at m/z 449 [M+Na]+ suggesting the molecular weight of the
compound to be m/z 426. The 1H and 13C NMR data (Table 18) were similar to those previously
reported for lanosterol (Müller, 2002). 13C NMR and DEPT spectra showed the presence of four
olefinic peaks corresponding to three quaternary (δ 134.05, 134.05, 130.56) and one methine (δ
124.91) carbon atom, a fact which was supported by the presence of an olefinic peak at δ 5.08 t
(J = 6.6 Hz) in the 1H NMR spectrum (Müller, 2002). The HMBC peak at δ 78.68 correlating
with a proton at δ 3.24 dd (J = 10.7, 4.4 Hz) suggested the OH group at C-3 to be in equatorial
conformation (Mohanlall and Odhiv, 2009; Nagwa, 2000; Reginatto et al., 2001). Other
characteristic peaks in the 13C NMR spectrum were the methyl signals (δ 15.52, 15.52, 17.80,
19.27, 21.25, 21.90 25.93 and 28.00) which confirmed the presence of the eight methyl groups in
lanosterol (Müller, 2002), a fact which was further supported by 1H NMR peaks at δ 0.69 s, 0.81
s, 0.87 s, 0.98 s, 1.01 s, 1.68 s, 1.60 s, and 0.95 d (J = 6.3 Hz). Based on the spectral data as well
as comparison with literature data, compound 109 was identified to be lanosterol.
HO
109

78
Table 18: 13C (90 MHz) and 1H (360 MHz) NMR data of 63, 90 and 109 in CDCl3
Carbon 63 (δC)
63* (δC)
90 (δC)
90** (δC)
109 (δC)
63 (δH)
90 (δH)
109 (δH)
1 37.25 37.31 37.28 37.0 36.02 1.76 2 31.66 31.81 31.87 31.9 27.82 1.74, 1.34 3 71.81 71.90 71.04 72.0 78.68 3.52 3.54 3.24 4 42.30 42.40 40.69 42.5 38.53 1.66 - 5 140.75 140.90 139.56 140.8 50.06 - 6 121.70 121.87 117.32 121.8 18.25 5.35 5.18 7 33.71 32.07 29.75 32.1 28.25 1.67 8 31.91 32.00 30.12 32.2 134.05 2.01 - 9 50.14 50.81 49.64 50.5 134.05 1.62 - 10 36.50 36.61 34.32 36.5 35.25 - - 11 21.08 21.12 21.63 21.2 21.00 1.54 12 39.78 40.30 39.57 40.0 39.18 1.88 1.22 13 42.32 42.61 43.37 42.2 44.14 - - 14 56.77 56.78 56.14 57.1 49.47 1.26 - 15 24.29 24.32 23.08 24.5 24.25 1.45 1.36 16 28.24 28.24 28.40 28.9 35.93 1.75, 1.25 17 56.06 56.20 55.22 56.3 36.68 1.80 - 18 11.97 11.90 12.06 12.2 15.83 0.68 0.54 0.69 19 19.39 19.44 21.99 19.5 19.27 1.01 0.84 0.98 20 36.14 36.26 40.43 40.4 36.68 2.20 21 19.03 10.09 21.38 21.4 18.90 0.92 1.00 0.95 22 33.95 34.00 138.09 138.3 36.02 5.15 23 29.16 29.31 127.65 129.7 26.49 5.03 24 45.82 45.80 51.28 51.5 124.91 1.53 5.08 25 26.09 26.21 31.57 32.2 130.56 1.52 - 26 18.77 18.80 12.16 12.2 28.00 0.82 0.78 1.68 27 19.80 19.80 19.05 19.2 17.80 0.81 0.82 1.60 28 23.07 23.10 25.35 25.4 25.93 1.39 0.81 29 12.85 11.92 12.99 12.2 15.5 0.84 0.79 1.01 30 21.25 0.87
* 13C NMR (75 MHz, CDCl3) data of β-sitosterol (Shameel et al., 1996)
** 13C NMR (75 MHz, CDCl3) data stigmasterol (Forgo and Kover, 1996)

79
3-Oxofriedooleanane [44]
Compound 44 was isolated as white crystals, Rf value
0.33 (n-hexane: ethyl acetate 9:1), mp 260-261 °C and [α]D -
28° (MeOH, c, 1.12). The EIMS spectrum of 44 gave a
molecular ion peak at m/z 426 corresponding to a molecular
formula C30H50O and was supported by the 13C NMR and
DEPT spectra (Appendix 18) which displayed a total of 30
carbon atoms attributed to eight methyl, eleven methylene,
four methine and seven quaternary carbon atoms. The 1H and 13C NMR data (Table 19 and 20)
were similar to data previously reported for 3-oxofriedooleanane (Anjaneyulu and Rao, 1980a;
Weeratunga et al., 1983; Mahato and Kundu, 1994; De Lampasona et al., 1998; Costa and
Carvalho, 2003) and were supported by the IR spectrum which exhibited a peak at 1706 cm-1
thus confirming the presence of a carbonyl carbon (Anjaneyulu and Rao, 1980a; Weeratunga et
al., 1983). The 13C NMR spectrum gave a peak at δ 213.24 which further confirmed the presence
of a carbonyl carbon atom at C-3. Other characteristic peaks in the 13C NMR and DEPT spectra
were the methyl peaks at δ 6.81, 14.59, 17.91, 18.63, 20.21, 32.05, 31.73 and 34.94 which
confirmed the presence of the eight methyl groups in 3-oxofriedooleanane (Anjaneyulu and Rao,
1980a; Weeratunga et al., 1983; Mahato and Kundu, 1994; Costa and Carvalho, 2003).
The 13C NMR data were supported by 1H NMR spectrum (Table 20) which showed the
presence of eight methyl signals attributed to seven tertiary (δ 0.70 s, 0.84 s, 0.92 s, 0.97 s, 0.98
s, 1.04 s and 1.16 s) and one secondary (δ 0.86 d, J =7.0 Hz) methyl groups (Anjaneyulu and
Rao, 1980a; Weeratunga et al., 1983; Costa and Carvalho, 2003). Further examination of EIMS
spectrum of 44 revealed fragmentation pattern typical of a saturated triterpene (Costa and
Carvalho, 2003; Budzikiewics et al., 1963; Anjaneyulu and Rao, 1980a; Weeratunga et al.,
1983) as evidenced by characteristic daughter ions at m/z 411[M-15]+, 344, 273, 205 and 123.
Based on the spectral data as well as comparison with literature data, compound 44 was
identified as 3-oxofriedooleanane.
O
44

80
3α-Hydroxyfriedooleanane [106]
Compound 106 was obtained as white crystals from
CH2Cl2 – MeOH (9:1), Rf value 0.28 (n-hexane ethyl acetate
4:1) mp 290-292 °C and [α]D +18° (MeOH, c, 1.12). The IR
spectrum of 106 showed the presence of a hydroxyl group at
3476 cm-1 (Silverstain et al., 1981). The EIMS spectrum
showed a molecular ion peak at m/z 428, corresponding to C30H52O formula and was supported
by 13C NMR spectrum (Appendix 19) which showed 30 distinct carbon peaks attributed to eight
methyl, eleven methylene, five methine and six quaternary carbon atoms. Other significant peaks
were at m/z 413 [M-Me]+, 395 [M-Me-H2O]+, 206 [C14H22O]+ and 220 [C16H28]+ which are
characteristic peaks commonly found in the spectra of oleanane type of triterpenes with OH at
C-3 (Anjaneyulu and Rao, 1980b; Siddiqui et al., 1989; Mahato and Kundu, 1994).
The 1H and 13C NMR data of 106 (Table 19) were in agreement with those previously
reported for 3α-hydroxyfriedooleanane (Anjaneyulu and Rao, 1980a; Mahato and Kundu, 1994)
and closely resembled those of 3-oxofriedooleanane [44] except for the presence of an
oxymethine peak at δ 72.72 with corresponding oxymethine proton signal at δ 3.73 d (J = 2.3
Hz) in the 1H NMR spectrum, thus confirming the presence of OH group at C-3 (Anjaneyulu and
Rao, 198a; Siddiqui et al., 1989; Mahato and Kundu, 1994). The small coupling constant (2.3
Hz) allowed the assignment of α- orientation of the OH group (Anjaneyulu and Rao, 1980a;
Gupta and Sing, 1989; Mahato and Kundu, 1994; El-Lahlou et al., 1999). Other characteristic
peaks in the 13C NMR spectrum were observed at δ 11.61, 16.38, 18.23, 18.64, 20.11, 31.78,
32.08 and 35.02 which confirmed the presence of the eight methyl groups in friedooleanane type
of triterpenes (Anjaneyulu and Rao, 1980a; Mahato and Kundu, 1994).
The 13C NMR data were further supported by the 1H NMR spectrum which displayed
seven tertiary methyl singlets (δ 0.88, 0.96, 0.98, 0.99, 1.00, 1.01 and 1.17) and a doublet at δ
0.94 (J = 7.0 Hz) assigned to methyl protons at C-23 (Anjaneyulu and Rao, 1980a; Anjaneyulu
and Rao 1980b). Based on the spectral data as well as comparison with literature data, compound
106 was identified as 3α-hydroxyfriedooleanane.
HO
106

81
3-Oxofriedoolean-29-ol [108]
The compound was isolated as white crystals from n-
hexane- ethyl acetate mixture, Rf value 0.38 (n-hexane: ethyl
acetate 4:1), mp 250-252 °C and [α]D +87° (MeOH, c, 1.0).
The ESI-MS spectrum of 108 gave a quasi-molecular ion peak
at m/z 465 [M+Na]+ corresponding to a molecular weight of
442 and formula C30H50O2 and was supported by 13C and
DEPT spectra (Appendix 20) which showed the presence of 30 carbon atoms consisting of
seven methyl, twelve methylene, four methine and seven non-protonated carbon atoms.
The 1H and 13C NMR data (Table 19 & 20) were similar to those reported for 3-
oxofriedoolean-29-ol (Weeratunga and Kumar, 1985; Mahato and Kundu, 1994) and closely
resembled those of 3-oxofriedooleanane [44] except for the presence of an oxymethine peak at δ
74.74 in the 13C NMR spectrum which suggested the presence of a hydroxyl group at C-28
(Weeratunga and Kumar, 1985; Mahato and Kundu, 1994). Other significant peaks in the 13C
NMR were at δ 213.19 (carbonyl carbon at C-3) and the seven methyl peaks at δ 6.81, 14.64,
17.68, 18.43, 20.74, 25.79 and 32.06 (Weeratunga and Kumar, 1985; Mahato and Kundu, 1994).
The 1H NMR spectrum (Appendix 20) peak at δ 3.26 s, further confirmed the presence of
–OH at C-29 (Weeratunga and Kumar, 1985). 1H NMR spectrum singlets at δ 0.72, 0.86, 1.02,
1.04, 1.21, 1.25 further confirmed the presence of six tertiary methyl groups while a doublet at δ
0.87 (J = 6.5 Hz) confirmed the presence of secondary methyl protons at C-23 (Weeratunga and
Kumar, 1985; Mahato and Kundu, 1994). Peaks at δ 2.36 (m) and 2.40 (m) were assigned to
protons at C-4 and C-2, repectively. Based on the spectral data as well as comparison with
literature data, compound 108 was identified as 3-oxofriedoolean-29-ol.
108
O
OH

82
3-Oxofriedoolean-28-al [45]
Compound 45 was isolated as white needles from
CH2Cl2-MeOH (95:5), Rf value, 0.22 (n-hexane- ethyl acetate
4:1), mp 263-265 °C and [α]D +65° (MeOH, c, 1.0). The ESI-
MS of the 45 showed a quasi-molecular ion peak at m/z 463
[M+Na]+, corresponding to a molecular weight of 440 and
molecular formula C30H48O2. The ESI-MS data were supported
by 13C NMR and DEPT experiments (Appendix 21) which showed the presence of 30 distinct
carbon peaks consisting of seven methyl, eleven methylene, five methine and seven non-
protonated carbon atoms. The 1H and 13C NMR data of 45 (Table 19 and 20) closely resembled
those of 3-oxofriedooleanane [44] except for the presence of a peak at δ 205.47, which suggested
45 to be 3-oxofriedooleanane with an aldehyde group attached to it (Mahato and Kundu, 1994).
The 13C NMR data (Table 19) were similar to those previously reported for 3-oxofriedoolean-28-
al, canophyllal (Mahato and Kundu, 1994; Abbas et al., 2007)
and gave carbonyl carbon peaks at δ 213.01 and 205.47 which were assigned to the ketone and
aldehyde carbonyl carbon atoms at C-3 and C-28, respectively (Mahato and Kundu, 1994; Abbas
et al., 2007; Olmedo et al., 2008). Other characteristic peaks were at δ 6.77, 13.74, 14.46, 16.12,
18.58, 18.92, 26.80 which were assigned to the seven methyl carbon atoms at C-23, C-27, C-29
and C-30 (Mahato and Kundu, 1994).
1H NMR spectrum of 45 which gave a peak at δ 9.39 (-CHO) also displayed seven methyl peaks
consisting of six singlets (δ 0.70, 0.85, 0.87, 0.89, 0.97 and 1.01) and a doublet (δ 0.88 J = 6.6),
thus further supporting the 13C data (Mahato and Kundu, 1994; Abbas et al., 2007; Olmedo et
al., 2008). Based on the spectral data as well as comparison with literature data, compound 45
was identified as 3-oxofriedoolean-28-al (canophyllal).
CHO
45
O

83
Table 19: 13C NMR (90 MHz, CDCl3) of compounds 44, 106, 108 and 45
Carbon 44 44* 106 106** 108 108*** 45 45*** 1 22.42 22.3 17.50 16.43 22.26 22.3 22.25 22.3 2 41.50 41.5 35.17 35.46 41.50 41.6 41.41 41.5 3 213.24 213.2 72.76 72.79 213.19 213.2 213.01 214.0 4 58.17 58.2 49.17 49.39 58.30 58.3 58.12 58.2 5 42.14 42.1 37.10 37.99 42.17 42.3 42.02 42.0 6 41.23 41.3 41.73 41.92 41.27 41.4 41.15 41.0 7 18.20 18.2 15.79 17.65 18.22 18.3 18.15 18.1 8 53.05 53.1 53.19 53.34 53.38 53.5 50.41 52.8 9 37.38 37.4 37.82 37.27 37.42 37.5 37.12 37.1 10 59.43 59.4 61.35 61.58 59.44 59.6 59.45 59.2 11 35.54 35.6 35.55 35.71 35.62 35.7 36.30 35.4 12 30.43 30.5 30.63 30.73 29.74 29.8 28.49 30.6 13 39.67 39.7 39.69 38.41 39.93 40.0 39.39 38.7 14 38.25 38.3 38.37 39.81 38.22 38.3 37.47 37.7 15 32.27 32.4 32.33 32.48 32.21 32.8 30.07 32.4 16 35.90 36.0 36.08 36.25 35.85 36.0 35.12 34.9 17 29.95 30.0 30.02 30.13 30.50 29.8 43.91 47.7 18 42.78 42.8 42.82 43.05 41.84 42.0 44.53 36.4 19 35.28 35.3 35.36 35.39 30.57 30.6 36.20 35.4 20 28.13 28.1 28.17 28.22 33.09 33.2 26.80 28.3 21 32.73 32.7 32.81 33.00 27.77 29.9 28.96 32.4 22 39.23 37.2 39.28 39.36 39.48 39.6 26.19 28.8 23 6.81 6.8 11.61 11.59 6.81 6.8 6.77 6.9 24 14.59 14.4 16.38 15.90 14.64 14.7 14.64 14.6 25 17.91 17.9 18.23 18.29 17.86 17.9 16.12 17.2 26 18.63 18.6 18.64 18.62 18.43 18.4 18.92 20.0 27 20.21 20.1 20.11 20.13 20.74 20.8 18.58 18.8 28 32.05 32.1 32.08 32.16 32.06 32.1 205.47 210.0 29 31.73 31.8 31.78 31.84 74.79 74.8 32.74 34.5 30 34.98 35.0 35.02 35.01 25.79 25.9 26.80 29.4
* 13C NMR (75 MHz, CDCl3) data of 3-oxofriedooleanane (Mahato and Kundu, 1994)
** 13C NMR (75 MHz, CDCl3) data of 3α-hydroxyfriedooleanane (Mahato and Kundu, 1994)
*** 13C NMR (75 MHz, CDCl3) data of 3-oxofriedoolean-29-ol (Olmedo et al., 2008)
**** 13C NMR (75 MHz, CDCl3) data of 3-oxofriedoolean-28-al (Abbas et al., 2007)

84
Table 20: 1HNMR (360 MHz) of compounds 44, 106, 108 and 45 (δH, mult, J in
Hz)
Carbon CPD 44 CPD 106 CPD 108 CPD 45 2 1.34 dd (3.6, 1.8), 2.25 m 1.45 m, 0.96 m 2.40 m 2.26 m, 2.38 m 3 - 3.73 d (2.2) - - 4 2.22 d (3.6) 1.26 m 2.36 m 2.23 q (6.7) 23 0.86 d (7.0) 0.94 d (7.0) 0.87 d (6.6) 0.88 d (6.5) 24 0.70 s 0.94 s 0.72 s 0.70 s 25 0.84 s 0.88 s 0.86 s 0.85 s 26 1.04 s 0.99 s 1.02 s 0.87 s 27 0.98 s 1.00 s 1.25 s 0.91 28 0.97 s 1.01 s 1.04 s 9.39 s 29 1.16 s 1.17 s 1.21 s 1.09 s 30 0.92 s 0.96 s 3.26 s 0.89 s
α-Amyrin [107]
Compound 107 was isolated as white crystals from 5%
MeOH in CH2Cl2 and had Rf value of 0.32 (n-hexane: ethyl
acetate 4:1), mp 180-181 °C and [α]D +83° (MeOH, c, 1.12). The
ESI-MS spectrum of 107 gave a quasi-molecular ion peak at m/z
449 [M+Na]+ corresponding to a molecular weight of 426 and
molecular formula C30H50O and was supported by 13C NMR and
DEPT spectra (Appendix 22) which showed a total of 30 carbon peaks attributed to eight methyl,
nine methylene, seven methine and six quaternary carbon atoms.
The 1H and 13C NMR data (Table 21) were similar to those previously reported for α-
amyrin (Seo et al., 1975; Morris and Mansor, 1991; Mahato and Kundu, 1994). The 13C NMR
spectrum showed the presence of a carbon-carbon double bond (δ 139.84 and 124.42), an
oxymethine carbon (δ 79.06) and eight methyl carbon atoms consisting of six tertiary (15.61,
15.67, 16.86, 23.26, 28.10, 28.73) and two secondary (δ 17.46, 21.35) methyl carbon atoms (Seo
et al., 1975; Morris and Mansor, 1991; Mahato and Kundu, 1994). The 1H NMR spectrum
(Appendix 22) gave olefinic peak at δ 5.12 t (J = 3.5 Hz) and an oxymethine peak at δ 3.22 dd (J
= 11.5, 4.5 Hz) thus further confirming the presence of the carbon-carbon double bond at C-12
HO
107
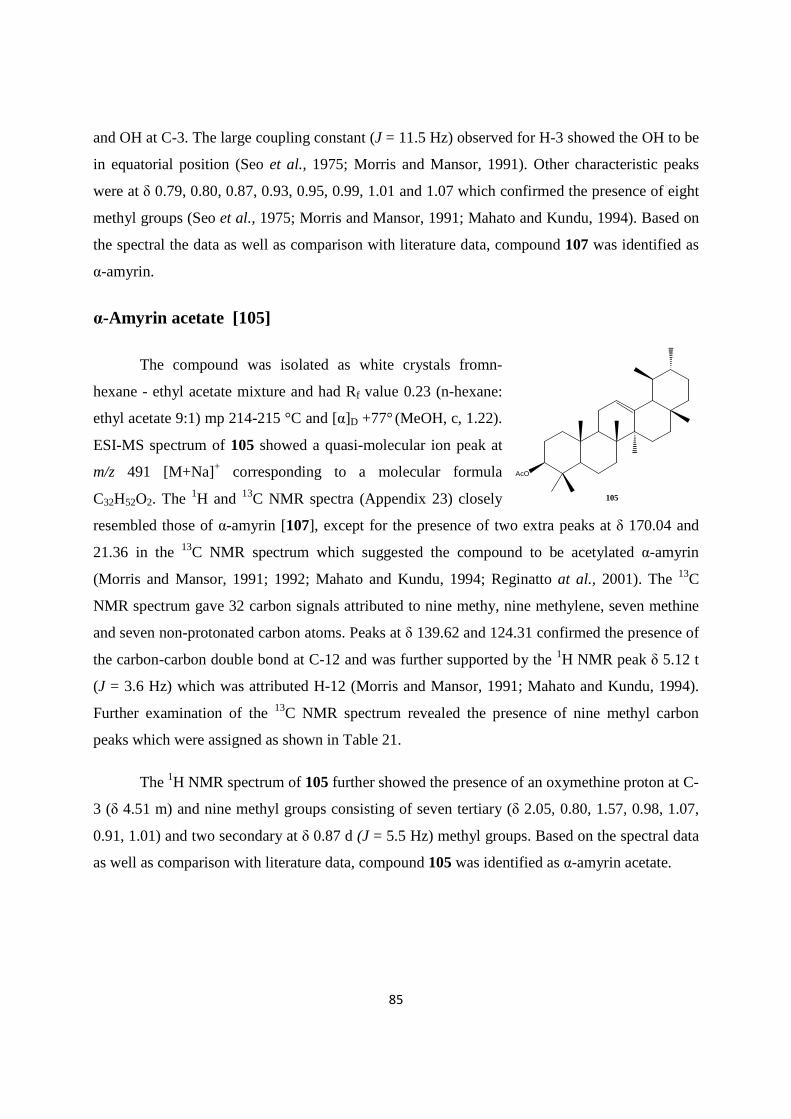
85
and OH at C-3. The large coupling constant (J = 11.5 Hz) observed for H-3 showed the OH to be
in equatorial position (Seo et al., 1975; Morris and Mansor, 1991). Other characteristic peaks
were at δ 0.79, 0.80, 0.87, 0.93, 0.95, 0.99, 1.01 and 1.07 which confirmed the presence of eight
methyl groups (Seo et al., 1975; Morris and Mansor, 1991; Mahato and Kundu, 1994). Based on
the spectral the data as well as comparison with literature data, compound 107 was identified as
α-amyrin.
α-Amyrin acetate [105]
The compound was isolated as white crystals fromn-
hexane - ethyl acetate mixture and had Rf value 0.23 (n-hexane:
ethyl acetate 9:1) mp 214-215 °C and [α]D +77° (MeOH, c, 1.22).
ESI-MS spectrum of 105 showed a quasi-molecular ion peak at
m/z 491 [M+Na]+ corresponding to a molecular formula
C32H52O2. The 1H and 13C NMR spectra (Appendix 23) closely
resembled those of α-amyrin [107], except for the presence of two extra peaks at δ 170.04 and
21.36 in the 13C NMR spectrum which suggested the compound to be acetylated α-amyrin
(Morris and Mansor, 1991; 1992; Mahato and Kundu, 1994; Reginatto at al., 2001). The 13C
NMR spectrum gave 32 carbon signals attributed to nine methy, nine methylene, seven methine
and seven non-protonated carbon atoms. Peaks at δ 139.62 and 124.31 confirmed the presence of
the carbon-carbon double bond at C-12 and was further supported by the 1H NMR peak δ 5.12 t
(J = 3.6 Hz) which was attributed H-12 (Morris and Mansor, 1991; Mahato and Kundu, 1994).
Further examination of the 13C NMR spectrum revealed the presence of nine methyl carbon
peaks which were assigned as shown in Table 21.
The 1H NMR spectrum of 105 further showed the presence of an oxymethine proton at C-
3 (δ 4.51 m) and nine methyl groups consisting of seven tertiary (δ 2.05, 0.80, 1.57, 0.98, 1.07,
0.91, 1.01) and two secondary at δ 0.87 d (J = 5.5 Hz) methyl groups. Based on the spectral data
as well as comparison with literature data, compound 105 was identified as α-amyrin acetate.
AcO
105
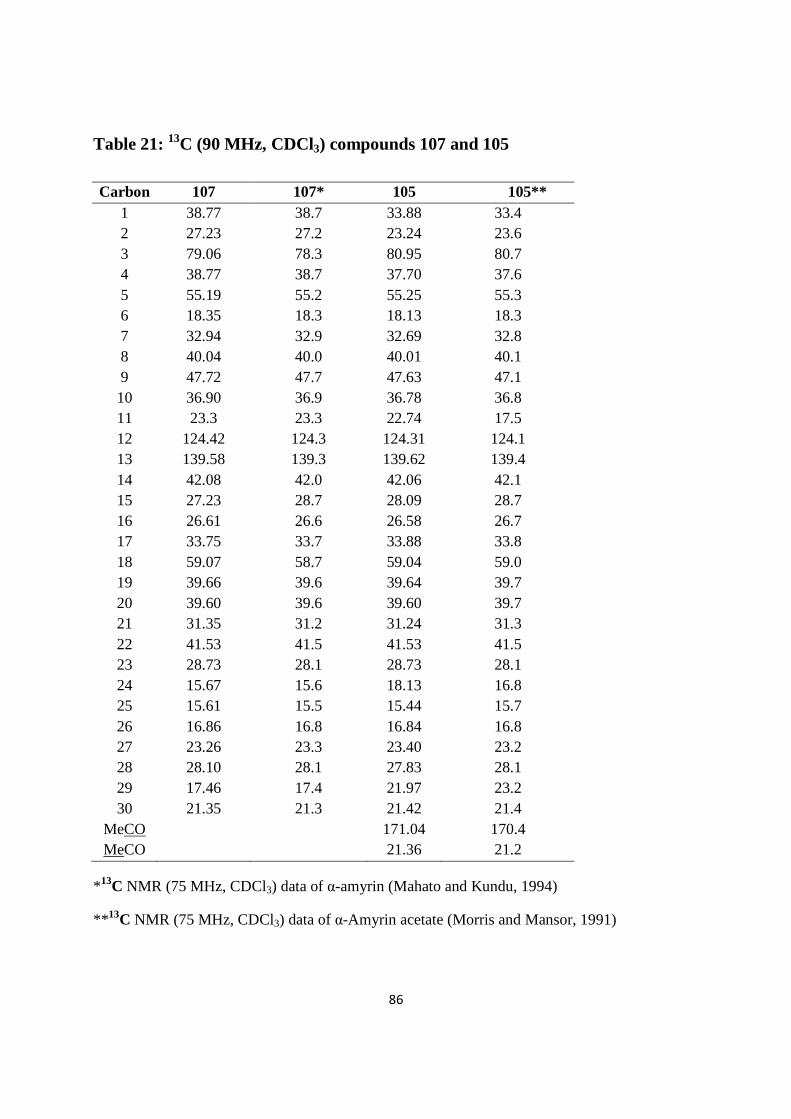
86
Table 21: 13C (90 MHz, CDCl3) compounds 107 and 105
Carbon 107 107* 105 105** 1 38.77 38.7 33.88 33.4 2 27.23 27.2 23.24 23.6 3 79.06 78.3 80.95 80.7 4 38.77 38.7 37.70 37.6 5 55.19 55.2 55.25 55.3 6 18.35 18.3 18.13 18.3 7 32.94 32.9 32.69 32.8 8 40.04 40.0 40.01 40.1 9 47.72 47.7 47.63 47.1 10 36.90 36.9 36.78 36.8 11 23.3 23.3 22.74 17.5 12 124.42 124.3 124.31 124.1 13 139.58 139.3 139.62 139.4 14 42.08 42.0 42.06 42.1 15 27.23 28.7 28.09 28.7 16 26.61 26.6 26.58 26.7 17 33.75 33.7 33.88 33.8 18 59.07 58.7 59.04 59.0 19 39.66 39.6 39.64 39.7 20 39.60 39.6 39.60 39.7 21 31.35 31.2 31.24 31.3 22 41.53 41.5 41.53 41.5 23 28.73 28.1 28.73 28.1 24 15.67 15.6 18.13 16.8 25 15.61 15.5 15.44 15.7 26 16.86 16.8 16.84 16.8 27 23.26 23.3 23.40 23.2 28 28.10 28.1 27.83 28.1 29 17.46 17.4 21.97 23.2 30 21.35 21.3 21.42 21.4
MeCO 171.04 170.4 MeCO 21.36 21.2
* 13C NMR (75 MHz, CDCl3) data of α-amyrin (Mahato and Kundu, 1994)
** 13C NMR (75 MHz, CDCl3) data of α-Amyrin acetate (Morris and Mansor, 1991)
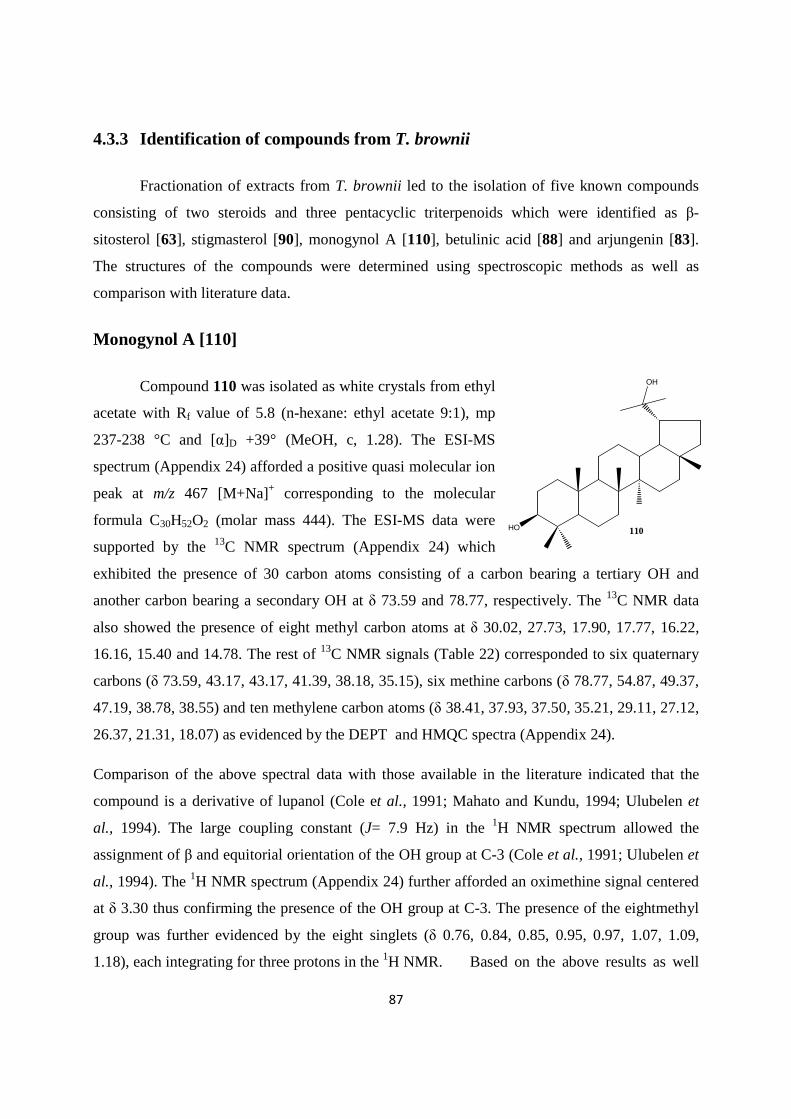
87
4.3.3 Identification of compounds from T. brownii
Fractionation of extracts from T. brownii led to the isolation of five known compounds
consisting of two steroids and three pentacyclic triterpenoids which were identified as β-
sitosterol [63], stigmasterol [90], monogynol A [110], betulinic acid [88] and arjungenin [83].
The structures of the compounds were determined using spectroscopic methods as well as
comparison with literature data.
Monogynol A [110]
Compound 110 was isolated as white crystals from ethyl
acetate with Rf value of 5.8 (n-hexane: ethyl acetate 9:1), mp
237-238 °C and [α]D +39° (MeOH, c, 1.28). The ESI-MS
spectrum (Appendix 24) afforded a positive quasi molecular ion
peak at m/z 467 [M+Na]+ corresponding to the molecular
formula C30H52O2 (molar mass 444). The ESI-MS data were
supported by the 13C NMR spectrum (Appendix 24) which
exhibited the presence of 30 carbon atoms consisting of a carbon bearing a tertiary OH and
another carbon bearing a secondary OH at δ 73.59 and 78.77, respectively. The 13C NMR data
also showed the presence of eight methyl carbon atoms at δ 30.02, 27.73, 17.90, 17.77, 16.22,
16.16, 15.40 and 14.78. The rest of 13C NMR signals (Table 22) corresponded to six quaternary
carbons (δ 73.59, 43.17, 43.17, 41.39, 38.18, 35.15), six methine carbons (δ 78.77, 54.87, 49.37,
47.19, 38.78, 38.55) and ten methylene carbon atoms (δ 38.41, 37.93, 37.50, 35.21, 29.11, 27.12,
26.37, 21.31, 18.07) as evidenced by the DEPT and HMQC spectra (Appendix 24).
Comparison of the above spectral data with those available in the literature indicated that the
compound is a derivative of lupanol (Cole et al., 1991; Mahato and Kundu, 1994; Ulubelen et
al., 1994). The large coupling constant (J= 7.9 Hz) in the 1H NMR spectrum allowed the
assignment of β and equitorial orientation of the OH group at C-3 (Cole et al., 1991; Ulubelen et
al., 1994). The 1H NMR spectrum (Appendix 24) further afforded an oximethine signal centered
at δ 3.30 thus confirming the presence of the OH group at C-3. The presence of the eightmethyl
group was further evidenced by the eight singlets (δ 0.76, 0.84, 0.85, 0.95, 0.97, 1.07, 1.09,
1.18), each integrating for three protons in the 1H NMR. Based on the above results as well
HO
OH
110

88
as comparison with literature data, compound 110 was identified as lupan-3β, 20-diol
(monogynol A).
Betulinic acid [88]
Compound 88, Rf value 0.18 (n-hexane: ethyl
acetate 7:3) was isolated as white crystals from methanol
and had mp 280-282 °C and [α]D +10° (MeOH, c, 1.0).
The IR spectrum showed the presence of OH (3455 cm-1),
an exomethylene (3072 cm-1) and a carbonyl (1687 cm-1).
The EIMS spectrum (Appendix 25) gave a molecular ion
peak at m/z 456 corresponding to the molecular formula
C30H48O3 and was supported by the 13C NMR spectrum
(Appendix 25) which exhibited 30 non-equivalent carbon
atoms and among them were the carbonyl carbon (δ 180.0), a quaternary vinyl carbon (δ 150.40),
a terminal methylene carbon (δ 109.67) and a carbon holding a secondary alcohol (δ 79.11). The
other 13C NMR signals corresponded to five quaternary carbons (δ 56.95, 42.59, 40.89, 38.56,
37.36), ten methylene carbons (δ 39.89, 37.09, 34.52, 32.28, 30.73, 29.81, 27.54, 25.68, 21.00,
18.40), five methine carbons (δ 55.56, 50.72, 49.51, 46.99, 38.95) and six methyl carbons (δ
28.06, 19.45, 16.14,16.14, 15.35, 14.77) as evidenced by DEPT and HMQC spectrum
(Appendix 25).
The 1H NMR spectrum of 88 (Appendix 25) afforded two singlets at δ 4.73 and 4.60
corresponding to two protons of a terminal vinyl methylene group while the while the vinyl
methyl group was centered at δ 1.69. Comparison of these data with those available in the
literature indicated that 88 is either α- or β-betulinic acid (Mahato and Kundu, 1994; Hague et
al., 2006) Table 22. The large coupling constant (J= 8.1, 6.0 Hz) in the 1H NMR spectrum
allowed the assignment of β and equatorial orientation of the OH group at C-3 (Peng et al.,
1989).The 1H NMR data together the EIMS diagnostic peaks at m/z 456 [M]+, 438 [M-H2O]+,
423 [M-Me-H2O]+, 411 [M-45]+, 248 [A]+, 207 [B]+, 219 [C]+, 203 [D]+ and 189 [E]+ (Fig. 5)
confirmed the compound to be lup-20(29)-ene type and the position of the carbonyl group was in
HO
CO2H
88

89
ring D/E at C-17 (Budzikiewics et al., 1963; Kwon et al., 2003; Chaiyade, 2004; Haque et al.,
2006). Based on these results compound 88 was concluded to be -betulinic acid.
CO2H OHCH2
CO2H
A: m/z 248B: m/z 207 C: m/z 219
- H2O- CO2H
D: m/z 203E: m/z 189
+
+
Fig. 5: Proposed EIMS fragmentation pattern of compound 88
Arjungenin [83]
Compound 83 Rf value of 0.32 (n-hexane: ethyl acetate
1:1), mp. 293-295 °C, [α]D +29° (MeOH, c, 2.0), was
isolated as white amorphous solid from methanol. The IR
spectrum of the compound showed the presence of OH
(3404 cm-1), carbonyl (1705 cm-1) and C-C double bond
(1640 cm-1). The ESI-MS spectrum gave a positive quasi-
molecular ion peak at m/z 527 [M+Na]+ corresponding to
the molecular formula C30H48O6.
The 13C NMR spectrum of 83 (Appendix 26) exhibited 30 non-equivalent carbon atoms
which indicated the presence of a carbonyl carbon (δ 179.72), three carbon atoms bearing
secondary OH groups (δ 84.52, 79.76, 67.40), a carbon atom bearing a primary OH group (δ
63.82), a quaternary vinyl carbon (δ 144.13) and a methine vinyl carbon (δ 122.06) (Mahato and
Kundu, 1994; Reddy et al., 1994; Singh et al., 2004; Garcez et al., 2006; Xu et al., 2009b). The
rest of the 13C NMR signals (Table 22) corresponded to six quaternary carbons (δ 43.78, 41.69,
CH2OH
HO
CO2H
HO
HO
83

90
39.37, 39.24, 38.22, 35.49), three methine carbons (δ 43.13, 47.37, 55.48), eight methylene
carbons (δ 18.87, 23.39, 27.15, 27.86, 28.41, 32.29, 32.80, 46.80) and six methyl carbon atoms
(δ 16.37, 16.59, 23.33, 24.03, 24.67, 28.08) (Mahato and Kundu, 1994; Xu et al., 2009b).
Table 22: 13C NMR (90 MHz, CDCl3) data of 110, 88 and 83
Carbon 110 88 88* 83 83** 1 37.50 38.89 39.0 46.80 47.4 2 26.63 27.54 27.6 67.40 68.9 3 78.77 79.11 78.2 70.76 78.4 4 37.93 38.56 39.0 39.37 43.6 5 54.87 55.56 55.5 55.48 48.2 6 18.32 18.40 18.4 18.87 18.8 7 35.14 34.52 34.5 32.80 33.6 8 41.39 40.89 40.8 39.24 40.1 9 49.37 50.72 50.7 47.37 48.5 10 38.18 37.36 37.3 38.22 38.6 11 21.56 21.00 21.0 27.86 28.8 12 27.37 25.68 25.6 122.06 123.5 13 38.55 38.95 38.2 144.13 144.9 14 38.72 42.57 42.5 41.69 42.2 15 29.36 29.81 30.4 28.41 29.2 16 35.21 32.28 32.6 23.39 24.3 17 43.17 56.95 56.3 43.78 46.0 18 43.17 46.99 47.1 43.13 44.8 19 47.19 49.51 49.4 84.52 81.3 20 73.59 150.40 150 35.49 35.7 21 34.48 30.73 29.9 27.15 28.4 22 38.41 37.07 27.3 32.29 33.1 23 17.90 28.06 27.9 63.82 66.8 24 17.77 15.35 15.4 16.37 14.2 25 16.16 16.14 16.2 23.33 17.7 26 16.22 16.14 16.3 16.59 17.3 27 15.40 14.77 14.6 24.67 24.9 28 14.78 180.00 180.6 179.72 180.8 29 27.73 109.67 108.8 28.08 29.2 30 30.02 19.45 19.6 24.03 24.9
* 13C NMR data (75 MHz, CDCl3) of betulinic acid (Haque et al., 2006)
** 13C NMR data (75 MHz, CDCl3) of arjungenin (Mahato and Kundu, 1994)

91
The 1H NMR spectrum of compound 83 (Appendix 26) showed the presence of a vinyl proton (δ
5.22 br. S), five protons on carbon atoms bearing hydroxyl groups at δ 4.48 d (J = 8.1 Hz), 4.01
m, 3.75 d (J = 10.1 Hz), 3.36 d (J = 10.0 Hz) and 3.33 m (Reddy et al., 1994; Singh et al., 2004;
Xu et al., 2009b). Other diagnostic peaks in the 1H NMR spectrum were the six singlets, each
integrating for three protons observed at δ 1.27, 1.08, 0.89, 0.87, 0.83 and 0.64. Based on the
spectral data as well as comparison with literature data, compound 83 was concluded to be 2α,
3β, 19α, 23-tetrahydroxyolean-12-ene-28-oic acid (arjungenin).
4.4 Results from antifungal and antibacterial assays
4.4.1 Antifungal activity of crude extracts and isolates
Methanol, ethyl acetate and n-hexane extracts of W. ugandensis, E. schweinfurthianum
and T. brownii were tested for antifungal activity against Alternaria spp, A. niger, F. oxysporum,
F. solanum and R. stolonifer which infect sweet potato. Results from the in vitro antifungal assay
(Table 23) revealed that all the extracts exhibited inhibitory effect against at least one or more of
the fungi tested. Methanol, ethyl acetate and n-hexane extracts of W. ugandensis and E.
schweifurthianum were active against all the five fungi. Methanol and ethyl acetate extracts of T.
brownii inhibited the growth of Alternaria spp, A. niger and F. oxysporum while n-hexane
extract of the plant was actve against A. niger and F. solani but had no effect on the growth of F.
oxysporum and R. stolonifer. Methanol extract of W. ugandensis showed the highest inhibitory
effects against Alternaria spp, A. niger, F. oxysporum and R. stolonifer followed by methanol
extracts of E. schweifurthianu. Methanol extract of E. schweifurthianum was the most active
against F. solani, followed by methanol extract of W. ugandensis. Inhibition of growth of test
fungi varied with plant species and extraction solvent. For example, in the antifungal test against
Alternaria spp, extracts from W. ugandensis caused the highest inhibition to the growth of the
fungi followed by extracts from E. schweifurthianum (Table 23 and Fig. 6). Methanol extracts of
the three medicinal plants exhibited significantly (P≤ 0.05) high inhibitory effects against the
tested fingi, followed by ethyl acetate extracts while n-hexane extracts showed the least
inhibitory effect. Crude extracts from the three plants exhibited lower antifungal activity
compared to Blitox and Dithane M-5 which were used as standards (Fig. 7).

92
Table 23: Antifungal activity of crude extracts against sweet potato fungi
Diameter of zone of growth inhibition in mm* Extracts** Controls
Fungi Plant MeOH EtOAc n-Hex Mean Blitox Dithane M-5
Alternaria spp W.ugandensis 17.10 14.07 5.43 12.20 22.1 19.6 E. schweinfurthianum 12.07 8.43 2.10 7.53 T. brownii 8.07 4.03 0.00 4.03 Mean extract 12.41 8.40 2.51 CV (%) 1.56 LSD, P≤ 0.05 0.25 0.25 A. niger W.ugandensis 21.07 11.53 3.07 11.89 28.0 24.3 E. Schweinfurthianum 16.43 13.43 6.00 11.96 T. brownii 10.53 5.08 1.47 5.68 Mean extract 16.01 10.00 3.51 CV (%) 0.93 LSD, P≤ 0.05 0.18 0.18 F. oxysporum W.ugandensis 13.43 8.07 1.00 7.50 16.9 19.1 E. Schweinfurthianum 8.07 3.43 0.63 4.04 T. brownii 0.00 0.00 0.00 0.00 Mean extract 7.17 3.88 0.54 CV (%) 2.98 LSD, P≤ 0.05 0.23 0.23 F. solani W.ugandensis 9.43 4.00 2.52 5.34 25.1 14.8 E. Schweinfurthianum 10.43 6.10 0.87 5.80 T. brownii 5.80 2.20 1.17 3.06 Mean extract 8.56 4.12 1.52 CV (%) 2.83 LSD, P≤ 0.05 0..27 0.27 R. stolonifer W.ugandensis 24.50 13.73 5.63 14.62 18.3 16.3 E. Schweinfuthianum 9.33 4.37 3.10 5.60 T. brownii 0.00 0.00 0.00 0.00 Mean extract 11.28 6.03 9.91 CV (%) 1.41 LSD, P≤ 0.05 0.19 0.19
*Values are means of three replicates; ** Conc. = 5 mg/ml.
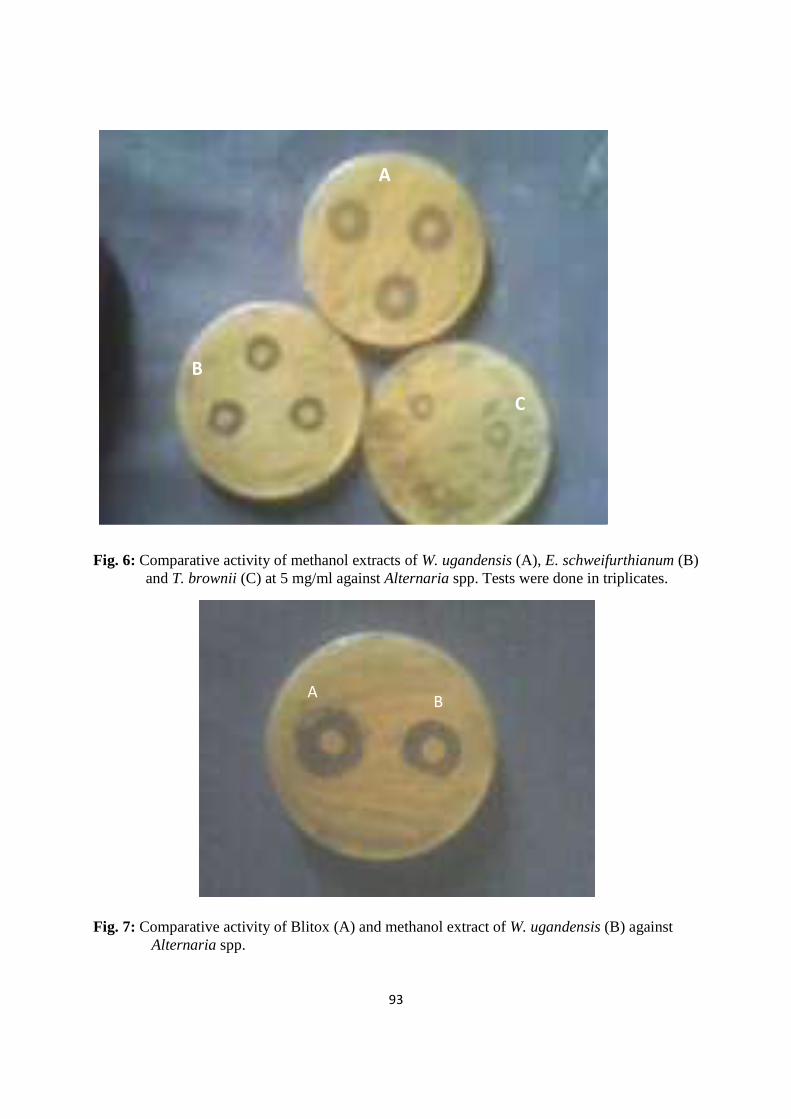
93
A
B
C
Fig. 6: Comparative activity of methanol extracts of W. ugandensis (A), E. schweifurthianum (B) and T. brownii (C) at 5 mg/ml against Alternaria spp. Tests were done in triplicates.
AB
Fig. 7: Comparative activity of Blitox (A) and methanol extract of W. ugandensis (B) against Alternaria spp.

94
Compounds isolated from W. ugandensis, E. scweinfurthianum and T. brownii which
were identified as polygodial [13], warburganal [14], mukaadial [15], ugandensidial [16],
muzigadial [22], 6α-hydroxymuzigadial [23], 9-deoxymuzigadial [101], ugandensolide [20], 7α-
acetoxyugandensolide [104], deacetoxyugandensolide [21], cinnamolide [17], 3β-
acetoxycinnamolide [19], bemadienolide [102], drimenin [103], β-sitosterol [63], stigmasterol
[90], lanosterol [109], 3-oxofriedooleanane [44], 3α-hydroxyfriedooleanane [106], 3-
oxofriedoolean-29-ol [108], 3-oxofriedoolean-28-al [45], α-amyrin [107], α-amyrin acetate [105]
monogynol A [110], betulinic acid [88] and arjungenin [83] were subjected to antifungal activity
studies against Alternaria spp, A. niger, F. oxysporum, F. solanum and R. stolonifer at varying
concentrations. Sixteen out of the 26 compounds (13-16, 22, 23, 20, 21, 17, 63, 90, 44, 106, 107,
88 and 83) were active against one or more of the fungi tested at concentrations ≤ 200 µg/ml
while nine were not (Table 24).
Compound 13 – 16, 20 and 21 exhibited comparable antifungal activity against all or
most of the fungi tested (MIC ≤50 µg/ml) with reference to blitox and dithane M-5 which are
standard fungicides while the rest of the active compounds had MIC values ≤200 µg/ml against
one or more of the tested fingi. Compounds 13 and 15 were the most effective against Alternaria
spp (MIC = 25 µg/m) while compound 14 and 15 were the most effective against A. niger (MIC
= 12.5 µg/ml). Compounds 14 and 22 were the most effective against F. oxysporum (MIC = 25
µg/m) while compound 13 and 14 were the most effective against F. solani (MIC = 12.5 µg/ml).
R. stolonifer was most susceptible to compounds 13 and 14 (MIC = 12.5 µg/ml).

95
Table 24: MIC (µg/ml) of isolated compounds against sweet potato fungi
Compound
MIC, µg/ml of isolated compounds
Alternaria spp A. niger F. oxysporum F. solani R. stolonifer
Polygodial [13] 25 50 50 12.5 50
Warburganal [14] 50 12.5 25 12.5 25
Mukaadial [15] 25 12.5 100 25 50
Ugandensidial [16] 50 25 50 100 25
Muzigadial [22] 50 50 25 100 50
6α-Hydroxymuzigadial [23] 200 >200 100 >200 >200
9-Deoxymuzigadial[101] >200 >200 >200 >200 >200
Ugandensolide [20] 50 50 100 200 100
7α-Acetoxyugandensolide [104] >200 >200 >200 >200 >200
Deacetoxyugandensolide [21] 50 >200 >200 100 200
Cinnamolide [17] 100 100 >200 200 >200
3β-Acetoxycinnamolide [19] >200 >200 >200 >200 >200
Bemadienolide [102] >200 >200 >200 >200 >200
Drimenin [103] >200 >200 >200 >200 >200
β-Sitosterol [63] 100 >200 >200 100 200
Stigmasterol [90] 100 >200 200 200 >200
Lanosterol [109] >200 >200 >200 >200 >200
3-Oxofriedooleanane [44] 100 100 200 200 >200
3α-Hydroxyfriedooleanane [106] 200 200 200 >200 200
3-Oxofriedoolean-29-ol [108] >200 >200 >200 >200 >200
3-Oxofriedoolean-28-al [45] >200 >200 >200 >200 >200
α-Amyrin [107] 200 200 200 >200 200
α-Amyrin acetate [105] >200 >200 >200 >200 200
Monogynol A [110] >200 >200 >200 >200 >200
Betulinic acid [88] 100 >200 >200 100 100
Arjungenin [83] 100 100 >200 200 >200
Blitox 50 6.25 12.5 6.25 12.5
Dithan M-5 25 12.5 6.25 6.25 25
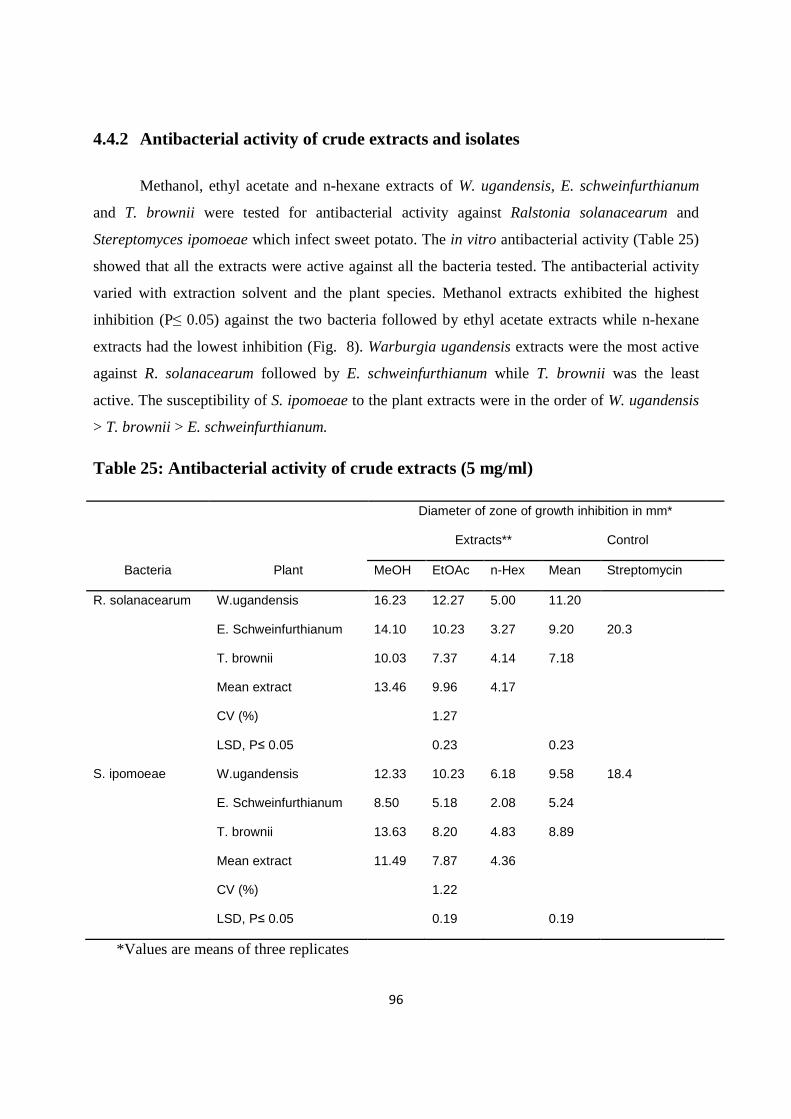
96
4.4.2 Antibacterial activity of crude extracts and isolates
Methanol, ethyl acetate and n-hexane extracts of W. ugandensis, E. schweinfurthianum
and T. brownii were tested for antibacterial activity against Ralstonia solanacearum and
Stereptomyces ipomoeae which infect sweet potato. The in vitro antibacterial activity (Table 25)
showed that all the extracts were active against all the bacteria tested. The antibacterial activity
varied with extraction solvent and the plant species. Methanol extracts exhibited the highest
inhibition (P≤ 0.05) against the two bacteria followed by ethyl acetate extracts while n-hexane
extracts had the lowest inhibition (Fig. 8). Warburgia ugandensis extracts were the most active
against R. solanacearum followed by E. schweinfurthianum while T. brownii was the least
active. The susceptibility of S. ipomoeae to the plant extracts were in the order of W. ugandensis
> T. brownii > E. schweinfurthianum.
Table 25: Antibacterial activity of crude extracts (5 mg/ml)
Bacteria Plant
Diameter of zone of growth inhibition in mm*
Extracts** Control
MeOH EtOAc n-Hex Mean Streptomycin
R. solanacearum W.ugandensis 16.23 12.27 5.00 11.20
E. Schweinfurthianum 14.10 10.23 3.27 9.20 20.3
T. brownii 10.03 7.37 4.14 7.18
Mean extract 13.46 9.96 4.17
CV (%) 1.27
LSD, P≤ 0.05 0.23 0.23
S. ipomoeae W.ugandensis 12.33 10.23 6.18 9.58 18.4
E. Schweinfurthianum 8.50 5.18 2.08 5.24
T. brownii 13.63 8.20 4.83 8.89
Mean extract 11.49 7.87 4.36
CV (%) 1.22
LSD, P≤ 0.05 0.19 0.19
*Values are means of three replicates

97
Fig. 8: Comparative antibacterial activity of E. schweinfurthianum methanol (A), ethyl acetate
(B) and n-hexane (C) extracts at 5 mg/ml against Streptomyces ipomoea.

98
The compounds isolated from W. ugandensis, E. schweifurthianum and T. brownii were
subjected to antibacterial activity against R. solanacearum and S. ipomoeae. Out of the 26
compounds tested, 17 inhibited the growth of one or both bacteria at concentrations ≤ 200 µg/ml
while nine did not (Table 26). Compounds 13, 14, 15, 16, 22, 23, 104, 21, 63, 109, 45 and 88
were active against R. solanacearum while compounds 13, 14, 15, 16, 22, 20, 21, 102, 44, 105
and 88 were active against S. ipomoeae at concentrations ≤ 200 µg/ml . R. solanacearum was
most susceptible to compounds 13, 15 and 22 while S. ipomoeae was most susceptible to
compound 16 (MIC = 25 µg/ml). Antibacterial activities of compounds 13 -16, 22 and 23 were
comparable to those of streptomycin sulphate which is a standard antimicrobial drug (MIC ≤ 50
µg/ml).
Several fungal and bacteria cause losses in sweet potato production (Clark, 1987;
Clarence and Leaton, 1990; Skuglund et al., 1990; Ristaino, 1993; Clark and Hoy, 1994;
Skuglund and Smith, 1994; Carey et al., 1996; Clark et al., 1998; Onuegbu, 2002; Oywale,
2006). In this study, susceptibility of similar fungi and bacteria were identified from decayed
sweet potato were tested. In most cases, these pathogens gain entry into sweet potato roots through
natural openings and wounds created during harvesting, transportation and handling. However, at
times sweet potato roots may already be infected by pathogens derived from disease foliage, roots
or mother roots (Okigbo and Nmeka, 2005).
The World Health Organization (WHO) banned many agriculturally important pesticides
due to their wide range of toxicity against non-targeted organisms and their persistence in the
environment which leads to pollution (Barnard et al., 1997). Plants produce economically
important organic compounds, pharmaceuticals and pesticides but little work has been done to
investigate the use of natural plant products as pesticides for control of storage rot diseases of sweet
potato.

99
Table 26: MIC (µg/ml) of isolated compounds against sweet potato bacteria
Isolated compound
MIC, µg/ml of isolated compounds
R. solanacearum S. ipomoeae
Polygodial [13] 25 50
Warburganal [14] 50 50
Mukaadial [15] 25 50
Ugandensidial [16] 100 25
Muzigadial [22] 25 50
6α-Hydroxymuzigadial [23] 100 >200
9-Deoxymuzigadial[101] >200 >200
Ugandensolide [20] >200 100
7α-Acetoxyugandensolide [104] 200 >200
Deacetoxyugandensolide [21] 100 200
Cinnamolide [17] >200 >200
3β-Acetoxycinnamolide [19] >200 >200
Bemadienolide [102] >200 100
Drimenin [103] >200 >200
β-Sitosterol [63] 100 >200
Stigmasterol [90] >200 >200
Lanosterol [109] 200 >200
3-Oxofriedooleanane [44] >200 200
3α-Hydroxyfriedooleanane [106] >200 >200
3-Oxofriedoolean-29-ol [108] >200 >200
3-Oxofriedoolean-28-al [45] 200 >200
α-Amyrin [107] >200 >200
α-Amyrin acetate [105] >200 200
Monogynol A [110] >200 >200
Betulinic acid [88] 100 100
Arjungenin [83] 200 >200
Steptromycin sulphate 25 12.5

100
This study revealed that extracts of W. ugandensis, E. schweifurthianum and T. brownii
have antifungal activity against F. oxysporum, F. solani, Alternaria spp, R. stolonifer. A. niger
(fungi), R. solanacearum and S. ipomoeae (bacteria) which cause disease in sweet potato. This
was in agreement with previous reports that pathogens which infect crop can be managed using
herbal extract (Avgelis and Morios, 1989; Khanna et al., 1989; Udo et al., 2001; Okigbo and
Nmeka, 2005). Methanol extracts of the plants were the most effective inhibitors of growth of all
the fungi and bacteria followed by ethyl acetate extracts. This observation suggests that the
antifungal principles from the plants are polar compounds and could be extracted using polar
solvents such as water, methanol, ethanol and acetone.
Extracts from W. ugandensis, E. schweifurthianum and T. brownii were active against
most of the sweet potato fungi and bacterial (Gram positive and gram negative) tested, thus
suggesting that the antimicrobial principles in the three plants have broad antifungal activity. The
antimicrobial activity of W. ugandensis was previously demonstrated (Kubo and Nakanishi,
1979; Olila et al., 2001; 2002; Wube et al., 2005; Rugutt et al., 2006; Clarkson et al., 2007;
Mbwambo et al., 2009). The antimicrobial activity of T. brownii reported in this study is in
agreement with earlier findings where methanol and water extracts of the plant inhibited the
growth of Candida albicans and Cryptococcus neoformans (Mbwambo et al., 2007).
The antimicrobial compounds from W. ugandensis are polygodial [13], warbuganal [14],
mukaadial [15], ugandensidial [16], cinnamolide [17], ugandensolide [20],
deacetoxyugandensolide [21], muzigadial [22] and 6α-hydroxymuzigadial [23]; those from E.
schweifurthianum are stigmasterol [90], β-sitosterol [63], 3-oxofriedooleanane [44] 3α-
hydroxyfriedooleanane [106] and α-amyrin [107] while those from T. brownii are stigmasterol
[90], β-sitosterol [63], arjungenin [83] and betulinic acid [88] at concentrations ≤200 µg/ml.

101
CHAPTER FIVE
5.0 SUMMARY, CONCLUSIONS AND RECOMMENDATIONS
5.1 Summary
� SPFMV, SPCSV, SPMMV, SPCFV and CMV were detected in symptomatic sweet
potato in western Kenya. Out of the 327 samples tested, 89% were infected while 11%
were not. In single infections, SPFMV had the highest frequency of detection while a
combination of SPFMV and SPCSV was the most frequently detected dual infection.
SPFMV, SPCSV, SPMMV and SPCFV were previously reported (Ateka et al., 2004;
Miano et al., 2006; Nyaboga et al., 2008). CMV was detected in sweet potato in Kenya
for the first time.
� A rapid and efficient multiplex PCR protocol that simultaneously detects SPFMV and
SPCSV was developed. The cDNA from sweet potato samples with dual infection of the
two viruses were amplified using two sets of primers specific to viruses using the
following parameters: one cycle at 95 ºC for 5 min followed by 35 cycles 96 ºC, 5 sec for
denaturation; 63 ºC, 5 sec for primer annealing and 72 ºC, 30 sec for extension and a final
extension at 72 ºC for 10 min.
� n-Hexane, ethyl acetate and methanol extracts from W. ugandensis, E. schweifurthianum
and T. brownii, were tested for antimicrobial activity against sweet potato fungal and
bacterial infections caused by F. oxysporum, F. solani, Alternaria spp, R. stolonifer, A.
niger, R. solanacearum and S. ipomoeae. All the extracts were active against one or more
of the microorganisms. The activities varied with plant species and the extraction solvent.
Of the three medicinal plants, extracts from W. ugandensis exhibited the highest activity
while methanol extracts gave the best activities compared to ethyl acetate and n-hexane
extracts.
� W. ugandensis, E. scweinfurthianum and T. brownii afforded fourteen, nine and five
compounds, respectively The compounds were identified as polygodial [13], warburganal
[14], mukaadial [15], ugandensidial [16], muzigadial [22], 6α-hydroxymuzigadial [23], 9-
deoxymuzigadial [101], ugandensolide [20], 7α-acetoxyugandensolide [104],
deacetoxyugandensolide [21], cinnamolide [17], 3β-acetoxycinnamolide [19],
102
bemadienolide [102], drimenin [103], β-sitosterol [63], stigmasterol [90], lanosterol
[109], 3-oxofriedooleanane [44], 3α-hydroxyfriedooleanane [106], 3-oxofriedoolean-29-
ol [108], 3-oxofriedoolean-28-al [45], α-amyrin [107], α-amyrin acetate [105] monogynol
A [110], betulinic acid [88] and arjungenin [83]. Compound 104 is new while compound
103 was isolated from W. ugandensis for the first time.
� Out of the twenty six isolates from the three plants, eighteen isolates were active against
one or more of the fungi and bacteria tested (MIC≤ 200 µg/ml). Polygodial [13],
warburganal [14], mukaadial [15], ugandensidial [16], ugandensolide [20],
deacetoxyugandensolide [21] and muzigadial [22] were the most active isolates (MIC≤
50 µg/ml).

103
5.2 Conclusion
� Five viruses namely SPFMV, SPCSV, SPMMV, SPCFV and CMV infect sweet potato in
western Kenya. SPFMV is the most widespread followed by SPCSV. Viruses infect sweet
potato in multiples. The most common dual viral infection is SPCSV+SPCSV. This is the
first report of CMV detection in Kenya.
� An mPCR protocol was successfully developed for the simultaneously detection of SPFMV
and SPCSV. The best amplification was obtained with 2.0 µg of cDNA template with 35
cycles at 63°C (annealing temperature).
� Extracts from W. ugandensis, E. schweifurthianum and T. brownii, have the potential for
managing sweet potato fungal and bacterial infections caused by F. oxysporum, F. solani,
Alternaria spp, R. stolonifer, A. niger, R. solanacearum and S. ipomoeae. Methanol
extracts from the three plants are more active than ethyl acetate and n-hexane extracts.
� Phytochemical analysis of W. ugandensis, E. schweinfurthianum and T. brownii, yielded 26
compounds consisting of 25 known and one reported for the first time from W. ugandensis.
The new compound was named as 7α-acetylugandensolide [104]. This is the first report of
drimenin [103] from W. ugandensis.
� The antimicrobial principles from W. ugandensis are polygodial [13], warbuganal [14],
mukaadial [15], ugandensidial [16], muzigadial [22], 6α-hydroxymuzigadial [23],
ugandensolide [20], deacetoxyugandensolide [21] and cinnamolide [17]; those from E.
schweifurthianum are β-sitosterol [63], stigmasterol [90], 3-oxofriedooleanane [44] 3α-
hydroxyfriedooleanane [106] and α-amyrin [107] while those from T. brownii are β-
sitosterol [63], stigmasterol [90], betulinic acid [88] and arjungenin [83].

104
5.3 Recommendation
� Due to the high frequency of viruses infection in sweet potato there is a need to develop a
virus-free seed production program in Kenya, from which farmers could obtain clean
planting materials. To prevent introduction of new viruses other than the ones already
reported in the country, it is necessary to establish quarantine stations at the borders to
ensure that only clean sweet potato planting materials get in.
� Since the developed protocol is rapid and enables simultaneously detection of SPFMV and
SPCSV (the most common and economically important viruses), we recommend it for
employment in screening sweet potato germplasm and cultivars for freedom of virus.
� Since extracts from W. ugandensis, E. chweinfurthianum and T. brownii have antifungal
activity against sweet potato pathogens, they may provide an alternative way of controlling
infections by farmers as it is less expensive and environmentally safe.
� Polygodial [13], warburganal [14], mukaadial [15], ugandensidial [16], ugandensolide [20],
deacetoxyugandensolide [21] and muzigadial [22] exhibited low MIC comparable to the
positive standards in the antimicrobial tests (MIC ≤ 50 µg/ml) and are recommended as
antimicrobial agents.

105
5.4 Suggestions for further studies
� Since some of the symptomatic sweet potato samples did not test positive to any of the ten
viruses tested in this study, there is a need for further investigation to identify the unknown
viral infections. In order to find a lasting solution to viral infections in sweet potato, which
often occur in multiples, there is a need to search for antiviral agents which can manage
multiple viral infections of the crop.
� Further search into methods of multiple PCR detection techniques which can
simultaneously detect SPFMV, SPCSV, SPMMV, SPCFV and CMV which were detected
in this study are necessary.
� Methanol extracts from the medicinal plants exhibited the highest activity against the fungi
abd bacteria hat were tested in this study. However, attampts to isolate antimicrobial
compounds from the extracts failed. Further phytochemical work on the extracts is
necessary.
� Further in vivo antibacterial and antifungal assays with the crude extracts and pure isolates
from W. ugandensis, E. chweinfurthianum and T. brownii are nessessary to establish doses
that can effectively protect sweet potato from the pathogens.
� It is necessary to carry out synergistic and antagonist studies of the pure isolates in order to
determine which combinations have the best antimicrobial activity. The active pure isolates
are recommended as candidates for further search for safe antimicrobial agents.

106
REFERENCES
Abbas F.A., Al-Massarany S.M., Khan S., Al-Howiriny T.A., Mossa J.S., Abouashed E.A.
(2007). Phytochemical and biological studies on Saudi Commiphora opobalsamum L.
Natural Products Research, 21, 383-391
Abu-Mustafa E., Fayez M., Gad A., Osman F. (1960). Isolation of β-Sitosterol from Chufa
(Cyperus esculentus L.)Tubers. Organic Chemistry. 25, 1269-1270.
Agnew A.D.Q., Agnew S. (1994). Upland Kenya Flowers; A flora of the Ferns and Herbaceous
Flowering Plants of Upland Kenya, 2nd ed., East Africa Natural History Society, Nairobi, p
152.
Ainsworth G.C., Sparrow F.K., Sussman S. (1973). The Fungi Vol. IVA. A Taxonmic Review
with Keys: Ascomycetes and Fungi Imperfection. Academic Press, London, pp: 375.
Akita H., Nozawa M., Mitsuda A., Ohsawa H. (2000). A convenient synthesis of (+)-albicanol
based on enzymatic function: total syntheses of (+)-albicanyl acetate, (-)-albicanyl 3, 4-
dihydroxycinnamate, (-)-drimenol, (-)-drimenin and (-)-ambrox. Tetrahedron, 11, 1375-
1388.
Al-Said M.S., El-Khawaja S.M., El-Feraly F.S., Hufford, C.D. (1990). 9-Deoxy drimane
sesquiterpenes from Canella winterana. Phytochemistry, 29, 975-977.
Amadioha A.C. (2003). Evaluation of some plant leaf extracts against Colletotrichum
lindemuthianum in cowpea. Acta Phytopathology and Entomology, 38, 259-265.
Amienyo C.A., Ataga A.E. (2007). Use of indigenous plant extracts for the protection of
mechanically injured sweet potato [Ipomoea batatas (L.). Scientific Research Essay, 2 (5),
167-170.
Anastasiah N.A., Ndalut P.K. (2005). Evaluation of natural products as possible alternatives to
methyl bromide in soil fumigation. Journal of Agriculture, Science and Technology, 7, 45-
51.
Anjaneyulu A.S.R., Rama Prasad A.V. (1982). Chemical examination of the roots of Terminalia
arjuna – the structures of arjunoside III and arjunoside IV, two new triterpenoids
glucosides. Phytochemistry, 21, 2057–2060.
Anjaneyulu A.S.R., Rao N.M. (1980a). Elaeodendrol and elaeodendradiol, new nor-triterpenes
from Elaeodendron glaucum. Phytochemistry, 19, 1163-1169.

107
Anjaneyulu A.S.R., Rao N.M. (1980b). Elaeodendroside-B, a novel cardiac glycoside from
Elaeodendron glaucum Pers. Indian Journal of Chemistry, 19, 944-949.
Aritua V., Alicai T., Adipala E., Carey E.E., Gibson R.W. (1998). Aspects of resistance to sweet
potato virus disease in sweet potato. Annal of Appllied Biology, 132, 387-398.
Aritua V., Barg E., Adipala E., Vetten H.J. (2007). Sequence analysis of the entire RNA genome
of a Sweet potato chlorotic fleck virus isolate reveals that it belongs to a distinct carlavirus
species. Archives of Virology, 152, 813-818.
Ateka E.M. (2004). Characterization of potyviruses infecting sweet potato in Africa. Ph.D.
Thesis. University of Nairobi, Nairobi Kenya.
Ateka E.M., Njeru R.W., Kibaru A.G., Kimenju J.W., Barg E., Gibson R.W., Vetten H.J. (2004).
Identification of viruses infecting sweet potato in Kenya. Annal of Applied Biology, 144,
371-379.
Avgelis A.D., Marios V.I. (1989). Elimination of tomato mosaic virus by composting tomato
residue. Plant Pathology, 95(3), 167-170.
Ayer W.A., Talamas F.X. (1988). The transformation of levopimaric acid into warburganal.
Canadian Journal of Chemistry, 66,1675-1685.
Barnard C., Padgitt M., Uri N.D. (1997). Pesticide use and its measurement. International Pest
Control, 39, 161-164.
Barrero A.F., Manzaneda E.A., Altarejos J., Salido S., Ramos J.M., Simmonds M.S.J., Blaney
W.M. (1995). Synthesis of biologically active drimanes and homodrimanes from (-)-
sclareol. Tetrahedron, 51, 7435-7450.
Barry A.L., Coyle M.B., Gerlach E.H., Haw-Kinson R.W., Thornberry C. (1979). Methods of
measuring zones of inhibition with the Baver-Kirby disc susceptibility test. Clinical
Microbialogy, 10, 885-889.
Barton D., Smith J.J., Kinyua Z.M. (1997). Socio-economic inputs to biological control of
bacterial wilt disease of potato in Kenya. ODA RNRRS Crop Protection Project R6629. NR
International, United Kingdom.

108
Bertolini E., Olmos A., Martinez M.C., Gorris M.T., Cambra M. (2001). Single-step multiplex
RT-PCR for simultaneous and colourimetric detection of six RNA viruses in olive trees.
Virology Methods, 96, 33-41.
Bhat A.I., Siju S. (2007). Development of a single-tube multiplex PT-PCR for the simultaneous
detection of Cucumber mosaic virus and Piper yellow mottle virus associated with stunt
disease of black pepper. Current Science, 93, 973-976.
Bishop C.D. (1995). Antiviral activity of the essential oil of Melaleuca alternifolia against
Tobacco Mosaic Virus. Essential Oil Reseasrch, 7, 641-645.
Boller T. (1987). Hydroli enzymes in plant disease resistance. In: Plant-microbe interactions,
molecular and genetic perspectives, esd Kosuge T., Nester E.W., 2: 385-413, Macmillan,
New York.
Brooks C.J.W., Draffan G.H. (1969a). Sesquiterpenoids of Warburgia species-I- warburgin and
warburgiadione. Tetrahedron, 25, 2865-2885.
Brooks C.J.W., Draffan G.H. (1969b). Sesquiterpenoids of Warburgia species-II ugandensolide
and ugandansidial (cinnamodial). Tetrahedron, 25, 2887-2898.
Budzikiewics J.M., Djerassi C., Wilson J.M. (1963). Mass spectroscopy in structural and
stereochemical problems XXXII. Pentacyclic triterpenes. American Society Journal, 12,
3699-3704.
Cameron H.J., Julian G.R. (1984). The effects of four commonly used fungicides on the growth
of cyanobacteria. Plant Soil, 78, 409-415.
Canonica L., Corbella A., Gariboldi P., Jommi G., Krepinsky J. (1969a). The structure of
cinnamolide, cinnamosmolide and cinnamodial. Tetrahedron Letters, 23, 2137-2141.
Canonica L., Corbella A., Gariboldi P., Jommi G., Krepinsky J., Ferrari L., Casagrande C.
(1969b). Sesquiterpenoids of Cinnamosma fragrans Baillon. Tetrahedron, 25, 3895-3902.
Cao S., Brodie P.J., Callmander M., Randrianaivo R., Rakotobe E. (2010). Saponins and a lignan
derivative of Terminalia tropophylla from the Madagascar Dry Forest. Phytochemistry, 71,
95-99.
Carey E.E., Gichuki S.T., Ndolo P.J., Turyamureeba G., Kapinga R., Lutaladio N.B. (1997).
Sweet potato breeding for Eastern, Central and Southern Africa: An Overview. In:

109
Proceedings of the 4th Triennial Congress of the African Potato Association. Pretoria South
Africa 23-28 Feb, 1997. pp 89-93.
Carey E.E., Mwanga R.O.M., Fuentes S., Kasule S., Macharia C., Gichuki S.T., Gibson R.W.
(1996). Sweet potato viruses in Uganda and Kenya: Results of a survey. Proceedings of the
6th Triennial Symposium of the International Sociaty of Tropical Root Crops – Africa
Branch (ISTRC-AB), Oct. 22-28, 1995, Lilongwe, Malawi,pp 457-461.
Carr J.D., Klessig D.F. (1989). The pathogenesis-related proteins of plants. In: Genetic
engineering principles and methods, ed Sellow J.K., 65-109. Plenum Press, New York and
London.
Chaiyade K. (2004). Bioactive constituents from the twigs of Sonneratia alba. Science and
Technology, 1, 15-22.
Chen F.D., Zhang X.S., Wang K.H., Zhang Y.S., Sun Q.Z., Cosentine L.M., Lee K.H. (1999).
Novel anti-HIV lancilactone C and related triterpens from Kadsura lancilimba, Natural
Products, 62, 94-99.
CIP. (1995). Vines to roots: sweet potato breeding for impact. International Potato Center, Lima,
Peru. pp 6-10.
CIP. (1996). Global sector commodity analysis and impact assessment for sweet potato.
International Potato Center, Lima, Peru. pp 5-9.
CIP. (1998). Annual Report. International Potato Center (CIP). pp 8-9.
Clarence E.S., Leaton J.K. (1990). Sweet potato culture and diseases. Agricultural Handbook.
No. 388 pp 38-40. Agricultural Research Service USDA.
Clark C.A. (1987). Principle bacterial and fungal disease of sweet potato and their control. Pp
275-289. In: Exploration, maintanance and utilization of sweet potato genetic resources.
Report of the first sweet potato planning conference, Feb. 1987. CIP Lima, Peru.
Clark C.A., Chen C., Ward-Reiney N. Pettis G.S. (1998). Diversity within Streptomyces
ipomoeae based on inhibitory interactions, rep-PCR and plasmid profiles. Phytopathology,
88, 1179-1186.

110
Clark C.A., Hoy M.W. (1994). Identification of Resistances in sweet potato to Rhizopus soft rot
using two inoculation methods. Plant Disease, 78, 1078-1081.
Clark C.A., Moyer J.W. (1988). Compendium of Sweet Potato Diseases. The American
Phytopathological Society, St. Paul, MN.
Clarkson C., Madikane E.V., Hansen S.H., Smith P.J., Jaroszewski J.W. (2007). HPLC-SPE-
NMR characterization of sesquiterpenes in an antimycobacterial fraction from Warburgia
salutaris. Planta Medica, 73(6), 578-584.
Clatyton R.B., Bloch K. (1955). Biological synthesis of lanosterol and agnosterol. www.jbc.org.
Accessed on 7th November, 2010.
Cohen J., Loebenstein G., Spiegel S. (1988). Infection of sweet potato by cucumber mosaic virus
depends on the presence of Sweet potato feathery mottle virus. Plant Disease, 72, 583-585.
Cole B.J.W., Bentley M.D., Hua Y., Bu L. (1991). Triterpenoid constituents in the outer bark of
Butula alleghaniensis (Yellow birch). Wood Chemistry and Technology, 11(2), 209-223.
Conrad J., Vogler B., Klaiber I., Roos G., Walter U., Kraus W. (1998). Two triterpene esters
from Terminalia macroptera bark. Phytochemistry, 48, 647-650.
Costa P.M.D., Carvalho M.G.D. (2003). New triterpene isolated from Eschweilera longipes.
Annals of Brazillian Academy of Science, 75, 41-48.
De Lampasona M.E., Catalan C.A.N., Gedris T.E., Werner H. (1998). Oleanolic and ursolinic
acid derivatives from Polyepis australis. Phytochemistry. 49, 123-126.
Dean R.A., Kuc J. (1987). Immunization against diseases: the plant fights back. In: Fungal
infections of plants, eds Pegg G.F., Ayers P.G., 383-410. Cambridge University Press,
Cambridge.
Deans S.G., Waterman P.G. (1993). Biological activity of volatile oils, in: Volatile oil crops,
Hay, R.K.M. Waterman, P.G. Longman Scientific and Technical pp. 97.
Dent R.D. (1995). Integrated pest management, Chapman and Hall, London, UK, pp 356.
Dhetchuvi M., Lejoly J. (1990). Contribution a' la connaissance ds plantes me'dicinales du Nord-
Est du Zaire. Mitt Inst Allg Bot Hamburg, 23, 991-1006.
Dwivedi S., Udupa N. (1989). Terminalia arjuna: pharmacognosy, phytochemistry, harmacology
and clinical use. A review, Fitoterapia, 60, 413-420.

111
El- Feraly F.S, McPhail A.T., Onan K.D. (1978). X-ray crystal structure of canellal, a novel
antimicrobial sesquiterpene from Canella winterana. Chemical Society, Chemical
Communications, 45, 75-78.
El Lahlou H., Hirai N., Tsuda M., Ohigash H. (1999). Triterpene phytoalexins from nectarine
fruits. Phytochemistry, 52, 623-629.
FAO (2002). The state of food insecurity in the world.
FAO (2003). The state of food insecurity in the world.
Farnsworth N.R. (1984). The role of medicinal plants in drug development. In: Natural Products
and Drug Development, eds Krogsgaard-Larsen P., Christensen S.B., Kofod H., 8-98.
Balliera, Tindall and Cox, London.
Farnsworth N.R., Akerele O., Bingei A.S. (1986). Medicinal plants in therapy. Bull World
Health Organization, 63, 965-971.
Farnswoth N.R., Morris R.W. (1976). Higher plants: the sleeping giants of drug development.
American Journal of Pharmacy, 148, 46-52.
Fayez E.K., Mahmoud I.N. (1998). A tannin anticancer promoter from Terminalia arjuna.
Phytochemistry, 47, 1567-1568.
Forgo F., Kover K. (2003). Gradient enhanced selective experiments in the 1H NMR chemical
shift environment of the skeleton and side chain resonance of stigmasterol, a phytosterol
derivative. Steroids, 69, 53-56.
Fukuyama Y., Sato T., Asakawa Y., Takemoto T. (1982). A potent cytotoxic warbuganal and
related drimane-type sesquiterpenes from Polygonum hydropiper. Phytochemistry, 21,
2895-2898.
Fukuyama Y., Sato T., Miura I., Asakawa Y. (1985). Drimane-type sesqui- and
norsesquirterpenoids from Polygonum hydropiper. Phytochemistry, 24, 1521-1524.
Fyhrquist P., Mwasumbi L., Haeggstrom C.A., Vuorela H., Hiltunen R., Vuorela P. (2002).
Ethnobotanical and antimicrobial investigation on some species of Terminalia and
Combretum (Combretaceae) growing in Tanzania. Ethnopharmacology, 79, 169-177.
Garcez F.R., Garcez W.S., Santana A.L.B.D., Alves M.M., Matos M.F.C., Scaliante A.M.
(2006). Bioactive flavonoids and triterpenes from Terminalia fogifoli.a (Combretaceae).
Brazillian Chemical Society, 17, 1223-1228.

112
Geddes A.M.W. (1990). The relative importance of crop pests in sub-Saharan Africa, Natural
Resources Institute Bulletin No 36, NRI, Kent, UK. Pp 69.
Ghosh D.K., Aglave B. (2007). Simultaneous detection of one RNA and one DNA viruses from
naturally infected citrus plants using duplex PCR technique. Current Science 94, 1314-1319.
Gibb K.S., Padovan A.C. (1993). Detection of sweet-potato feathery mottle potyvirus in sweet
potato grown in northern Australia using an efficient and simple assay. International Pest
Management, 39, 223-228.
Gibson R.W., Aritua A. (2002). The perspective of Sweet potato chlorotic stunt virus in sweet
potato production in Africa: A Review, African Crop Science, 10, 281-310.
Gibson R.W., Mpembe I., Alicai T., Carey E.E., Mwanga R.O.M., Seal S.E., Vetten H.J. (1998).
Symptoms, etiology and serological analysis of sweet potato virus disease in Uganda. Plant
Pathology, 47, 95-105.
Gibson R.W., Mwanga R.O.M., Kasule S., Mpembe I., Carey E.E. (1997). Apparent absence of
viruses in most symptomless field-grown sweet potato in Uganda. Annals of Applied
Biology, 130, 481-490.
Goldstein S.W., Jenkins G.L. (2006). A chemical study of the fixed oil of poke root.
DOI: 10.1002/jps.3080250716.
Grayer, R.J., Harbone J.B., Kimmins F.M., Stevenson P.C., Wijayagunasekera H.N.P. (1994).
Phenolics in rice phloem sap as suching deterrents to the brown plant hopper, Nilaparvata
lugens. Acta Horticulture, 831, 691-694.
Gupta D., Sing J. (1989). Pentacyclic triterpenoids. Phytochemistry, 28, 1197-1199.
Gutierrez D.L., Fuentes S., Salazar L.F. (2003). Sweet potato virus disease (SPVD): Distribution,
incidence and effect on sweet potato yield in Peru. Plant Disease, 87, 297-302.
Hammerschimidt R., Nuckles E., Kuc J. (1982). Association of peroxidase activity with induced
systemicresistance in cucumber to Colletotrichum lagenarium. Physiology, Plant
Pathology, 20, 73-82.

113
Haque M.D, Shekhar H.U., Mohamad A.U., Rahman H., Islam A.M., Hossain M.S. (2006).
Triterpenoids from the Stem Bark of Avicennia officinalis. Dhaka Univiversity
Pharmacological Science Journal, 5, 53-57.
Haque M.Z., As Saki M.A., Ali M.U., Ali M.Y., Al-Maruf M.A. (2008). Investigations on
Terminalia arjuna Fruits: Part 1- Isolation of Compounds from Petroleum Ether Fractions.
Bangladesh Journal of Science and Research, 43, 123-130.
Harbone J.B. (1994). Biochemistry of Phenolic compounds. Academic Press. London.
Heine B, Brenzinger M. (1988). Plant concepts and plant use. Part IV. Plants of the Borana
(Ethiopia and Kenya). pp 296.
Heine B., Heine I. (1988). Plant concepts and Plant use. An ethnomedical survey of the semi-arid
and arid lands of East Africa. Part 1. Plants of the Chamus (Kenya). pp 104.
Honda T., Murae T., Tsuyuki T. (1976a). Arjungenin, arjunglucoside I and arjunglucoside II. A
new triterpenes glucoside from Terminalia arjuna. Japanese Chemical Society Bulletin, 49,
3213-3218.
Honda T., Murae T., Tsuyuki T., Takahashi T. (1976b). The structure of arjungenin: A new
sapogenin from Terminalia arjuna. Chemical Pharmacology Bulletin, 24, 178-180.
http://en.wikipedia.org/wiki/Sweet_potato (Accessed: 5th June, 2010).
Is Hak J.A., Kreuze J.F., Johansson A., Mukasa S.B., Tairo F., Abo El-Abbas F.M., Valkonen
J.P.T. (2003). Some molecular characteristics of three viruses from SPVD-affected sweet
potato plants in Egypt. Archives of Virology, 148, 2449-2460.
Jabeen R., Shahid M., Jamil A., Ashraf M. (2008). Microscopic evaluation of the Antimicrobial
activity of seed extracts of Moringa oleifera. Pakistan Journal of Botany, 40, 1349-1358.
Jansen J.M.B., Sengers H.W.J.M.H., Bos J.T.K., Grout A.D. (1988). A new stereoactive
approach to the total synthesis of (±)-isotadeonal, (±)-polygodial, (±)-warburganal and (±)-
muzigadial. Organic Chemistry, 53, 855-859.
Kapinga R.E., Ewell P.T., Jeremiah S.C., Kileo R. (1995). Sweet potato in Tanzanian Farming
and Food Systems. Implications for Research. International Potato Center (CIP) Sub-
Saharan Africa Regional Office, Nairobi, Kenya, and Ministry of Agriculture, Dar-es-
Salaam, Tanzania. p. 47

114
Kariba R.M., Siboe G.M., Dossaji S.F. (2001). In-vitro antifungal activity of Schizozygia
coffaeoides Bail. (Apocynaceae) extracts. Ethnopharmacology, 74, 41-44.
Kariuki P.M., Simiyu S. (2005). CBCMP Technical report on the Conservation Assessement and
Management Planning (CAMP) Workshop, 3rd to 5th April 2005 Machakos District, Kenya.
Report, IDRC/National Museums of Kenya, Nairobi. p.34
Karyeija R.F., Gibson R.W., Valkonen J.P.T. (1998). Resistance to sweet potato virus disease
(SPVD) in the wild East African Ipomoea spp. Annals of Applied Biology, 133, 39-44.
Karyeija R.F., Kreuze J.F., Gibson R.W., Valkonen J.P.T., 2000. Synergistic interactions of
potyvirus and phloem limited crinivirus in sweet potato plants. Virology, 269, 26-36.
Khanna R.K., Sharma O.S., Singh A., Battacharya S.C., Sen N., Sethi K.L. (1989). The essential
oil from leaves of Dacus carota Linn. Proceedings of 11th International Congress of
essential oils, fragrances and flavours. New Delhi India, Nov. 12-16, 1989 Vol 4 Chemistry
analysis and structure 1990, 173-176.
Ki R.H., Sun C.H. (2002). Molecular detection and analysis of Sweet potato feathery mottle virus
from root and leaf tissues of cultivated sweet potato plants. Plant Pathology, 18, 12-17.
Kim, J.H., Woo E.R., Shin C.G., Park V. (1998). Acer okamotoanum and its inhibitory activity
against HIV-1 integrase. Natural Products, 61, 145-147.
Kioko J., Baxter D., Berjak P. (2005). Tolerance to desiccation and storability of Warburgia
salutaris (ugandensis) seeds from Kenya. International Plant Genetic Resources Institute
(IPGRI).
Kioy D., Gray A.I., Waterman P.G. (1989). Further drimane sesquiterpenes from the stem bark
of Canella winterana. Natural Products, 52, 174-177.
Kioy D., Gray A.I., Waterman P.G. (1990a). A comparative study of the stem bark of drimane
sesquiterpenes and leaf volatile oils of Warburgia ugandensis and W. stuhlmannii.
Phytochemistry, 11, 3535-3538.
Kioy D., Gray A.I., Waterman P.G. (1990b). 3β, 9α-Dihydroxycinnamolide: a further novel
drimane sesquiterpenes from the stem bark of Canella winterana. Natural Products, 53,
1372-1375.

115
Kokkinos C.D., Clark C.A. (2006). Real-time PCR assays for detection and quantification of
sweet potato viruses. Plant Disease, 90, 783-700.
Kokwaro, J.O. (2009). Medicinal Plants of East Africa. University of Nairobi Press,Nairobi,
Kenya, pp. 276.
Kong F.E., King T.J., Ross J.M. (1954). The chemistry of extractives from hardwood. The
constituents of arjunolic acid, a triterpene from Terminalia arjuna. Chemical Society, 17,
3995- 4003.
Kubo I., Fukuhara K. (1990). Elabunin, a new cytotoxic triterpene from an East African
medicinal plant, Elaeodendron buchananii. Natural Products, 54, 968-971.
Kubo I., Lee Y.W., Pettei, M.J., Pilkiewicz F., Nakanishi K. (1976). Potent army worm
antifeedants from the East African Warburgia plants. Chemical Communications, 24, 1013-
1014.
Kubo I., Matsumoto T., Kakooko A.B., Mubiru N.K. (1983). Structure of mukaadial, a
molluscicidal from the Warburgia plants. Chemistry Letters, 12, 979-980.
Kubo I., Miura I., Petteri M.J., Lee Y.W., Pilkiewicz F., Nakanishi K. (1977). Muzigadial and
warbuganal, potent antifungal and antiyeast, and African army worm antifeedant agent.
Tetrahedron Letters 18, 4553-4556.
Kubo I., Nakanishi K. (1979), Advances in pesticide Science (Geissbuhler, H, ed), p 284.
Paragon Press, New York.
Kuc J. (1985). Increasing crop productivity and value by increasing disease resistance through
non-genetic techniques. In: Forest potentials: Productivity and value, ed Ballard R., 147-
190. Weyerhaeuser Compony Press, Certralia.
Kuc J. (1990). Compounds from plants that regulate o participate in disease resistance. Bioactive
compounds from plants. Wlley Chichester (Ciba Foundation Symposium 154), pp 213-228.
Kupchan S.M., Uchida I., Shimanda K., Yu Fei B., Stevens D.M., Sneden A.T., Miller R.W.,
Bryan R.F. (1977). Elaeodendroside A: a novel cytitoxic cardiac glycoside from
Elaeodendron glaucum. Chemical Society, Chemical Communication. 12, 255-256.
Kwon H.C., Bang E.J., Chong S.L., Young D.M., Kang R.L. (2003). A new glycosylsterol from
Quisqualis fructus. Archives of Pharmacology Research, 26, 275-575.
Lemanga B., Hakiza J.J., Alacho F.O., Kakuhenzire R. (1997). Effort of source of mother plant,
variety and growing conditions on the production of stem cuttings and subsequent yields of

116
mimi-tubers in Kenyan programme. Proceedings of the Forth Triennial Congress of the
African Potato Association, Pretoria, South Africa.
Lenne J.M. (1991). Diseases and pests of sweet potatoes: South East Asia, The Pacific and East
Africa. National Research Institute Bulletin. No.46.
Lindsay R.S., Hepper F.N. (1978). Medical plants of Marakwet, Kenya. Kew, Royal Botanic
Gardens, United Kingdom pp 49.
Lozoya S.H., Dawson O., Murashige T. (1984). Effect of ribavirin and adenine arabinoside on
tobacco mosaic virus in Nicotiana tabacum L. var. xanthim tissue cultures. Plant Cell Tissue
Organic Cultivation 3, 41-48.
Madikane V.E., Bhakta S., Russell A.J., Campbell W.E., Claridge T.D.W., Elisha G., Davies
S.G.D., Smith P., Sim E. (2007). Inhibition of mycobacterial arylamine N-acetyltransferase
contributes to anti-mycobacterial activity of Warburgia salutaris. Bioorganic Medical
Chemistry, 15, 3579-3586.
Mahato S.B., Kundu A.P. (1994). 13C NMR spectra of pentacyclic triterpenoids. A compilation
and some silent features. Phytochemistry. 37, 1517-1575.
Manguro L.O.A., Ugi I., Hermann R., Lemmen P. (2003b). Flavonol and drimane-type
sesquiterpene glycosides of Warburgia stuhlmannii leaves. Phytochemistry , 63, 497-502.
Manguro L.O.A., Ugi I., Lemmen P., Hermann R. (2003a). Flavonol glycosides of Warburgia
ugandensis leaves. Phytochemistry, 64, 891-896.
Manifra A., Hadidi A. (1994). Sensitive detection of grapevine virus A, B or leafroll-associated
virus II from viruliferous mealybugs and infected tissue. Virology Methods, 47, 175-187.
Mashimbye M.J., Maumela M.C., Drewes S.E. (1999). A drimane sesquiterpenoid lactone from
Warburgia salutaris. Phytochemistry, 51, 435-438.
Masuduzzaman S., Meah M.B., Rashid M.M. (2008). Determination of inhibitory action of
Allamanda leaf extracts against some important plant pathogens. Agriculture and Rural
Development. 6, 107-112.
Mbuya L.P., Msanga H.P., Ruffo C.K., Birnie A., Tengnäs B. (1994). The useful trees, shrubs
for Tanzania. Identification, propagation and management for agricultural and pastoral
communities. Technical Handbook No 6. p. 540.

117
Mbwambo Z.H., Erasto P., Innocent E., Masimba P.J. (2009). Antimicrobial and cytotoxic
activities of fresh leaf extracts of Warburgia ugandensis. Tanzanian Journal of Health
Research, 11, 75-78.
Mbwambo Z.H., Moshi M.J., Masimba P.J., Kapingu M.C., Nondo R.S.O. (2007). Antimicrobial
activity and brine shrimp toxicity of extracts of Terminalia brownii roots and stem. BMC
Compementary Alternative Medicine, 7, 9-11.
Mekbib, S.B., Regnier T.J.C., Zeeman C.A.M., Korsten L. (2007). In-vitro antimicrobial assay of
some medicinal plants from Ethiopia against plant and food-borne pathogens. University of
Pretoria ed, Mekbib, S.B., 2007.
Meunier A., Schmit J., Stas A., Kutluk N., Bragard C. (2003). Multiplex reverse transcription-
PCR for the simultaneous detection of Beet necrotic yellow vein virus, Beet soilborne virus
and Beet virus Q and their vector Polymyxa betae KESKIN on sugar beet. Appl. Environ.
Microbiology, 69, 2356-2360.
Meyer J.J.M., Afoloyan A.J., Taylor M.B., Erasmus D. (1997). Antiviral activity of galangin
isolated from Helichrysum aureonitens. Ethnopharmacology, 56, 165-167.
Miano D.W., LaBonte D.R., Clark C.A., Valverde R.A., Hoy M.W., Hurtt S., Li R. (2006). First
report of a begomovirus infecting sweet potato in Kenya. Plant Disease, 90, 832-837.
MOA. (1999). Annual Report. Ministry of Agriculture, Nairobi, Kenya.
Mohanlall V., Odhiv B. (2009). Furans and Furanones with antimycotoxigenic activity isolated
from Warburgia salutaris (Canellaceae). Medicinal Plant Research, 3, 231-240.
Morris M.D., Mansor H. (1991). Analysis of the non-rubber constituents of latex from alstonia
angustiloba. Tropical Forest Science, 4, 225-232.
Moshi M.J., Mbwambo Z.H. (2005). Some pharmacological properties of extracts of Terminalia
sericea roots. Ethnopharmacoogy, 97, 43-47.
Moyer J.W., Salazar L.F. (1989). Viruses and virus-like diseases of sweet potato. Plant Disease,
73, 451-455.
Mukasa S.B., Rubaihayo P.R., Valkonen J.P.T. (2003). Incidence of viruses and virus like
disease of sweet potato in Uganda. Plant Disease, 87, 329-335.

118
Müller J. (2002). Analytik von freien Sterolen Und Entwicklung einer Screening-Methode zur
Charakterisierung des Inhibitionsverhaltens neuer Sterol biosynthese inhibitoren. PhD thesis
Universität München, pp96 97-99.
Nagwa E.A. (2000). Biologically active steroid from green alga Ulva lactuca. Phytoether
Research, 14, 641-643.
Nie X., Singh R.P. (2000). Detection of multiple potato viruses using oligo (dT) as a common
cDNA primer in multiplex RT-PCR. Virology Methods, 86, 179-185.
Nishiguchi M., Mori M., Suzuki F., Nagata R., Morishita T., Sakai J., Hanada K., Usugi. (1995).
Specific detection of a severe strain of sweet potato feathery mottle virus (SPFMVS) by
Reverse Transcription and Polymerase Chain Reaction (RT-PCR). Annals of
Phytopatholology Society, 61, 119-122.
Nyaboga E.N., Ateka E.M., Bulimo W.D., 2008. Serological detection of virus diseases of sweet
potato in Kenya. Applied Biosciences, 7: 222-229.
Obagwu J., Emechebe A.M., Adeoti A.A. (1997). Effects of extract of Garlic Allium sativum
Bulb and Neem Azadiracha indica Juss Seed on Mycelial growth and sporulation of
Collectotrichum capsicisyde Butler and Bixby. Agricultral Technology, 5, 51-55.
Okigbo R.N. (2003). Fungi associated with peels of post harvest yams in storage. Pure and
Applied Science, 9, 19-23.
Okigbo R.N. (2004). A review of biological control methods for post harvest yams Dioscorea
spp.) in storage in South Eastern Nigeria. KMITL Science, 4, 207-215.
Okigbo R.N. (2005). Biological control of postharvest fungal rot of yams Dioscorea spp with
Bacillus Subitlis. Mycopathologia 159, 307-314.
Okigbo R.N., Emoghene A.O. (2004). Antifungal activity of leaf extracts of some plants species
on Mycopharerella fiji eds Morelet, the causal organism of black Sigatoka disease in banana
(Musa acuminata) KMITL. Science, 4, 20-31.
Okigbo R.N., Ikediugwu F.E.O. (2000). Studies on biological control of post harvest rot of yams
(Dioscorea. spp.) with Trichoderma viride. Phytopathology, 148, 351-355.
Okigbo R.N., Nmeka I.A. (2005). Control of yam tuber rot with leaf extracts of Xylopia
aethiopica and Zingiber officinale. African Journal of Biotechnology, 4, 804-807.

119
Okigbo R.N., Ogbonnaya U.O. (2006). Antifungal effects of two tropical plant leaf extracts
(Ocimum gratissimum and Aframomum melegueta) on post harvest yam (Dioscorea spp.)
rot. African Journal of Biotechnology 5, 727-731.
Olila D., Olwa-Odyek, Opuda-Asibo J. (2001). Bioassay-guided studies on the cytotoxic and in-
vitro trypanocidal activities of a sesquiterpene (Muzigadial) derived from a Ugandan
medicinal plant (Warburgia ugandensis). African Health Science, 1,12-15.
Olila D., Olwa-Odyek, Opuda-Asibo J. (2002). Screening extracts of Zanthoxylum chalybeum
and Warburgia ugandensis for activity against measles virus (Swartz and Edmonston
strains) in vitro. African Health Science, 5, 25-33.
Olmedo D.A., López-Pérez J.L., del Olmo E., Vásquez Y., Feliciano A.S., Gupta M.P. (2008). A
new cytotoxic friedelane acid – pluricostatic acid – and other compounds from the leaves of
Marila pluricostata Dionisio. Molecules, 13, 2915-2924.
Onuegbu B.A. (2002). Fundamentals of Crop Protection. Agro-science consult and Extension
Unit, RSUT. p. 237-242.
Onwueme I.C. (1978). The tropical root and tuber crops; yam, cassava, sweet potato and
cocoyam. J. Wiley and sons Ltd, London. pp 144-153.
Osiru M., Adipala E., Olanya O.M., Lemega B., Kapinga R. (2007). Occurrence and distribution
of Alternaria leaf petiole and stem blight on sweet potato in Uganda. Plant Pathology, 6,
112-119.
Osman K.A., Al-Rehiayam S. (2003). Risk assessment of pesticide to human and the
environment. Saudi Journal of Biological Science, 10, 81-106.
Otim-Nape G.W., Maruthi M.N., Thresh J.M. (2000). The incidence and severity of cassava
mosaic disease in Uganda. 1990-1992. Tropical Science, 38, 25-37.
Oyewale M.O. (2006). Fungal diseases of sweet potatoes (Ipomoea batatas). http: 11acs-
confex.Com/acs/greeno6/techprogram /p26999. HTM. (Accessed on 20th July, 2009).
Peng C., Bodenhausen G., Farnworth N.R., Fong H.H.S., Yuan S., Qui S., Zheng C. (1989).
Computer-assisted structure elucidation: Application of CISOC-SES to the resonance
assignment and structure generation of betulinic acid. Magnetic Resonance, 36, 267-278.
Perez C., Agnese A.M., Cabrere J.L. (1999). The essential oil of Senecio graveoleus: chemical
composition and antimicrobial activity test, Essential Oil Research, 66, 91-94.

120
Periasamy M., Niazi F.R., Malathi V.G. (2006). Multiplex RT-PCR, a novel technique for the
simultaneous detection of the DNA and RNA viruses causing rice tungro disease. J.
Virology Methods, 134, 230-236.
Person L.H., Martin W.J. (1940). Soil rot of sweet potato in Louisiana. Phytopatholology. 30,
913-926.
Pettit G.R., Hoard M.S., Doubek D.L. (1996). Antineoplastic agents 338: The cancer cell growth
inhibitory constituents of Terminalia arjuna (Combretaceae). Ethanopharmacolgy. 53, 57-
63.
Prachayasittikul S., Saraban S., Cherdtrakulkiat R., Ruchirawat S., Prachayasittikul V. (2010).
New bioactive triterpenoids and antimalarial activity of rubra lec. EXCLI Journal 9, 1-10.
Prasad H.P., Shankar U.A., Kumar B.H., Shetty S.H., Pakrash H.S. (2007). Management of bean
common mosaic virus in cowpea using plant extracts. Phytopathology, 40 (2), 139-147.
Qiagen (2002). TaqPCR Master Mix Handbook.
Qiagen (2004). Omniscript Reverse Transcription Handbook.
Qiagen (2006). Rneasy Mini Handbook.
Rabe T., Staden J.V. (2000). Isolation of an antibacterial sesquiterpenoid from Warburgia
salutaris. Ethnopharmacology, 73, 171-174.
Rao N., Kuc J. (1990). Induced systematic resistance in plants. I.: the fungal spore and disease
initiation in plants and animals, G.T. Cole, H.C. Hoch. Plenum Press, New York.
Reddy B.M., Rao N.K., Ramesh M., Appa Rao A.V.N, Lin L.J., Lin L.Z., Cordell G.A. (1994).
Chemical investigation of the fruits of Terminalia cheluba. Pharmaceutical Biology, 32,
352-356.
Reginatto H.F., Gosmann G., Guillaume D., Kauffmann C., Schenkel P.E., Schripsema J. (2001).
Steroidal and triterpenoidal glucosides from Passiflora alata. Brazillian Chemical Society, 12,
32-36.
Reiner R. (1982). Combination of antibiotic, bactericidal and bactetiostatic antibiotics. Roche
Science Services, 8, 86-87.
Ristaino J.B. (1993). Infection of sweet potato fibrous roots by Streptomyces ipomoeae:
Influence of soil water potential. Soil Biology and Biochemistry, 25, 185-192.

121
Row L.R., Murty P.S., Subba Raw G.S.R. (1970). Chemical examination of Terminalia species:
Part XII – Isolation and structure determination of arjunic acid, a new rihydroxytriterpene
carboxylic acid from Terminalia arjuna bark. Indian Journal of Chemistry, 8, 716-721.
Rugutt J.K., Ngigi A.N., Ndalut P.K. (2006). Native Kenyan plants as alternatives to Methyl
bromide in soil fumigation. Phytomedicine, 13, 576-583.
Sakai J., Mori M., Morishita T., Tanaka M., Hanada K., Usugi T., Nishiguchi M. (1997).
Complete nucleotide sequence and genome organization of sweet potato feathery mottle
virus (S-strain) genomic RNA: the large coding region of the P1 gene. Archives of Virology,
142, 1553-1562.
Salazar E.L., Fuentes S. (2001). Current Status of major virus diseases of sweet potatoes. In:
Proc. Int. Workshop Sweet Potato Cultivars Decline Study. Y. Nakazawa and K. Ishiguko
eds. Kyushu Natational Agricultural Experimental Station/ Miyakonojo, Japan. pp. 14-19
Seo S., Tomiata Y., Tori K. (1975). Carbon-13-NMR spectra of urs-12-enes and application to
structural assignments of compounds of Isodon Japonicas tissue cultures. Tettrahedron
Letters, 1, 7-11.
Shameel S., Usmanghani K., Ali M.S., Ahmad V.U. (1996). Chemical constituents from the
seeds of Pongamia pinnata (l.) Pierre. Pakistan Journal of Pharmaceutical Sciences, 9(1),
11-20.
Sharma P.N., Shoeb A., Kapil R.S., Popli .S.P. (1982). Arjunolone - a new flavone from stem
bark of Terminalia arjuna. Indian Journal of Chemistry, 21, 263-264.
Shimada K., Kyuno T., Nambara T., Uchada I. (1982). Isolation and characterization of cardiac
steroids from seeds of Elaeodendron glaucum Pers. Structures of elaeodendrosides A, D, E,
H, I, J and elaeodendrogenin. Chemical Pharmacology Bulletin, 30, 4075-4081.
Shimada K., Kyuno T., Nambara T., Uchada I. (1985). Structures of elaeodendrosides B, C, F,
G, K and L, a series of cardiac glycosides isolated from Elaeodendron glaucum.
Phytochemistry, 24, 1345-1350.
Siddiqui S., Begum S., hafeez F., Siddiqui B.S. (1989). Two triterpenes from the leaves of Nerium
oleander. Phytochemistry, 38, 1187-1192.
Sikaro J.E. (1995). Field and storage diseases of sweet potato. (www.aces.edu/pubs/docs/A/ANR).

122
Silverstain R.M., Bassler G.C., Morill T.C. (1981). Spectroscopic identification of organic
compounds, 6th edition, John Willey and Sons, New York pp 172-184.
Singh D. V., Gupta M. M., Tripathi A. K., Prajapati V., Kumar S. (2004). Arjunetin from
Terminalia arjuna as an insect feeding-deterrent and growth inhibitor. Phytotherapy.
Research. 18, 131–134.
Singh D.V., Gupta M.M., Kumar T.R.S., Saikia D., Khanuja S.P.S. (2008). Antibacterial principles
from the bark of Terminalia arjuna. Current Science, 94 (1), 10.
Siva N., Ganesan S., Banumathy N., Muthuchelian. (2008). Antifungal effect of leaf extract of
some medicinal plants against Fusarium oxysporum causing wilt disease of Solanum
melogena L. Ethnobotany, 12, 156-163.
Sivropou A., Nikolaou K.E., Kokkini S.L., Arsenalics M. (1997). Antimicrobial, cytotoxic and
antiviral activities of Saliva fructicosa essential oil. Agriculture and Food Chemistry, 45,
3197-3201.
Skoglund L.G., Smith N.E.J.M. (1994). Major diseases and pests of sweet potato in Eastern
Africa. CIP. pp 67-69.
Skuglund L.G., Gatumbi R.W., Kihurani A.W. (1990). Non-viral foliar pathogens and disorders
of sweet potato in Kenya. Pest Management, 39, 452-458.
Snowdon A. (1991). A Colour Atlas of Post-harvest Diseases and Disorders of Fruits and
Vegetables Vol. 1 Wolfe Scientific Ltd. London. p. 302.
Sod M., Chatchanok L., Narong N., Wilart P. (2009). Identification and antiproliferative activity
evaluation of a series of triterpenoids isolated from Flueggea virosa (Roxb. ex Willd.).
American Journal of Applied Sciences, 6 (10), 1800-1806.
Stermer B.A., Hammerschimidt R. (1987). Association of heat shock induced resistance to
disease with increased accumulation of insoluble extesin and ethylene synthesis.
Physiological and Mollecular Plant Pathology, 31, 453-461.
Sukurai N., Yaguchi Y., Inove T. (1972). Natural pentacyclic triterpenes. Phytochemistry, 26, 217-
220.
Suzuki T., Tanemura M., Kato T., Kitahara Y. (1970). Synthesis of ciannamolide. Japanese
Chemical Society Bulletin, 43, 1268-1269.

123
Tairo F., Kullaya A., Valkonen J.P.T. (2004). Incidence of viruses infecting sweet potato in
Tanzania. Plant Disease, 88, 916-920.
Thottappilly G., Dahal G., Lockhart B.E.L. (1993). Viruses and virus diseases of maize in
tropical Africa. Plant Pathology, 42, 492-509.
Timberlake J.R. (1987). Ethnobotany of the Pokot of Nothern Kenya. East Africa Herbarium. p.
106.
Tsanou M.K., Hassanali A, Jondiko I.J.O., Torto B. (1993). Mutangin, a dihydroagarofuranoid
sesquiterpene insect antifeedant from Elaeodendron buchananii . Phytochemistry, 34 (3), 665-
447.
Tsuyuki T., Hamada Y., Honda T. (1979). A new triterpenes glucoside from Terminalia arjuna -
arjunglucoside II. Japanese Chemical Society Bulletin, 52, 3127-3128.
Tushemereirwe W.K., Kangire A., Kubiriba J., Nakyanzi M., Gold C.S. (2004). First report of
Xanthomonas campestris pv. Musacearum on banana in Uganda. Plant Pathology, 53, 802-
807.
Tyler V.E. (1997). Ratinal phytotherapy. 3rd edition. Springer-Verlag, Berlin, Heidelberg, New
York.
Udo S.E., Madunagu B.E., Isemin C.D. (2001). Inhibition of growth and sporulation of fungal
pathogens on Sweet potato and yam by Garlic extract. Nigeria Journal of Botany, 14, 35-39.
Ulubelen V., Topcu G., Lotter H., Wagner H., Eri C. (1994). Triterpenoids from the aerial parts
of Salvia montbretii. Phytochemistry. 36 (2), 413-41.
Weeratunga G., Bohlin G., Verpoorte R., Kumar V. (1985). Flavovoids from Elaeodendron
balae root bark. Phytochemistry, 24 (9), 2093-2095.
Weeratunga G., Kumar V. (1985). D:B-Friedoolean-5-ene-3β,29-diol, an angular methyl
oxygenated D:B-friedooleanene from Elaeodendron balae. Phytochemistry, 24, 2369-2372.
Weeratunga G., Kumar V., Sultanbawa M.U. (1983). Friedooleananes from Elaeodendron
glaucum. Australian Journal of Chemistry, 36, 1067-1072.
Weeratunga G., Kumar V., Sultanbawa M.U.S. (1982). Two new angular methyl deoxygenated
D:A-friedooleananes. Tetrahedron Letters 23, 2031-2032.

124
Wenkert E., Strike D.P. (1964). Synthesis of some drimanic sesquiterpenes. American Chemical
Society. 86, 2044 -2050.
Wilson R.T., Woldo G.M. (1979). Medicine and magic in Central Tigre: A contribution to the
ethnobotany of the Ethiopian plateau. Economic Botany, 33(1), 29-34.
Woolfe A.J. (1992). Sweet potato: An untapped food resource. Cambridge University Press.
New York, U.S.A. pp 352.
Wube A.A., Franz B., Gibbons S., Asres K. (2005). Sesquiterpenes from Warburgia ugandensis
and their antimycobacterial activity. Phytochemistry, 66, 2309-2315.
www Worldagroforetsrycentre.org/sea/products/AFDbases/af/asp/SpeciesInfo. (Accessed on 12th
June, 2010).
www.cipotato.org/sasha/07Exploiting_sweetpotato_East_Africa. (Accessed on 11th August,
2010).
www.florahealth.com/flora/home/Canada/HealthInformation/Encyclopedias/Quercetin.htm.
(Accessed on 10th August, 2010).
www.herbalextractsplus.com/quercetin.cfm (Accessed on 14th July, 2010).
www.recipes4us.co.uk/.../Sweet Potatoes Origin, Uses, Recipes.htm (Accesesd: 12th July, 2010).
Wylie S., Wilson C.R., Jones R.A.C, Jones M.G.K. (1993). A polymerase chain reaction assay
for cucumber mosaic virus in lupin seeds. Australian Journal of Agricultre and. Research,
44, 41-51.
Xu M., Litaudon M., Krief S., Martin M.T., Kasenene J., Kiremire B., Dumontet B., Guéritte F.
(2009a). Ugandenial A, a new drimane-type desquiterpenoid from Warburgia ugandensis.
Molecules 14, 3844-3850.
Xu Q., Zhang D., Dang L., Li K. (2009b). Triterpene Acids from Cynoglossum amabile.
Chemisty Research, Chinese Universities, 25(3), 404-406
Yasuko T., Jondiko I.J.O., Hiroyuki T., Takane F., Mori K. (1995). Buchananoside, a steroidal
glycoside from Elaeodendron buchananii. Phytochemistry, 40 (3), 753-756.
Ying B.P., Peiser G., Ji Y.Y., Mathias K., Tutko D., Hwang Y.S. (1995). Phytotoxic
sesquiterpenoids from Canella winterana. Phytochemistry, 38, 909-915.

125
Zhonghua M.A., Michailides T.J. (2005). Advances in understanding molecular mechanisms of
fungicide resistance and molecular detection of resistant genotypes in phytopathogenic
fungi. Crop Protection, 24, 853-863.

126
APPENDIX A: Publications for this study
1. Opiyo S.A., Ateka E.M., Owuor P.O., Manguro L.O.A., Miano D.W. (2010).
Development of a multiplex PCR technique for simultaneous detection of Sweet potato
feathery mottle virus and Sweet potato chlorotic stunt virus. Plant Pathology, 92(2) 353-
356.
2. Opiyo S.A., Ateka E.M., Owuor P.O., Manguro L.O.A., Karuri H.W. (2010). Survey of
sweet potato viruses and detection of Cucumber mosaic virus in western Kenya. Plant
Pathology, 92(3) 795-799.
3. Opiyo S.A., Manguro L.O.A., Owuor P.O., Ateka E.M., Lemmen P. (2011). 7α-
Acetylugandensolide and antimicrobial properties of Warburgia ugandensis extracts and
isolates against sweet potato pathogens. Phytochemistry letters,
doi:10.1016/j.phytol.2011.02.007.
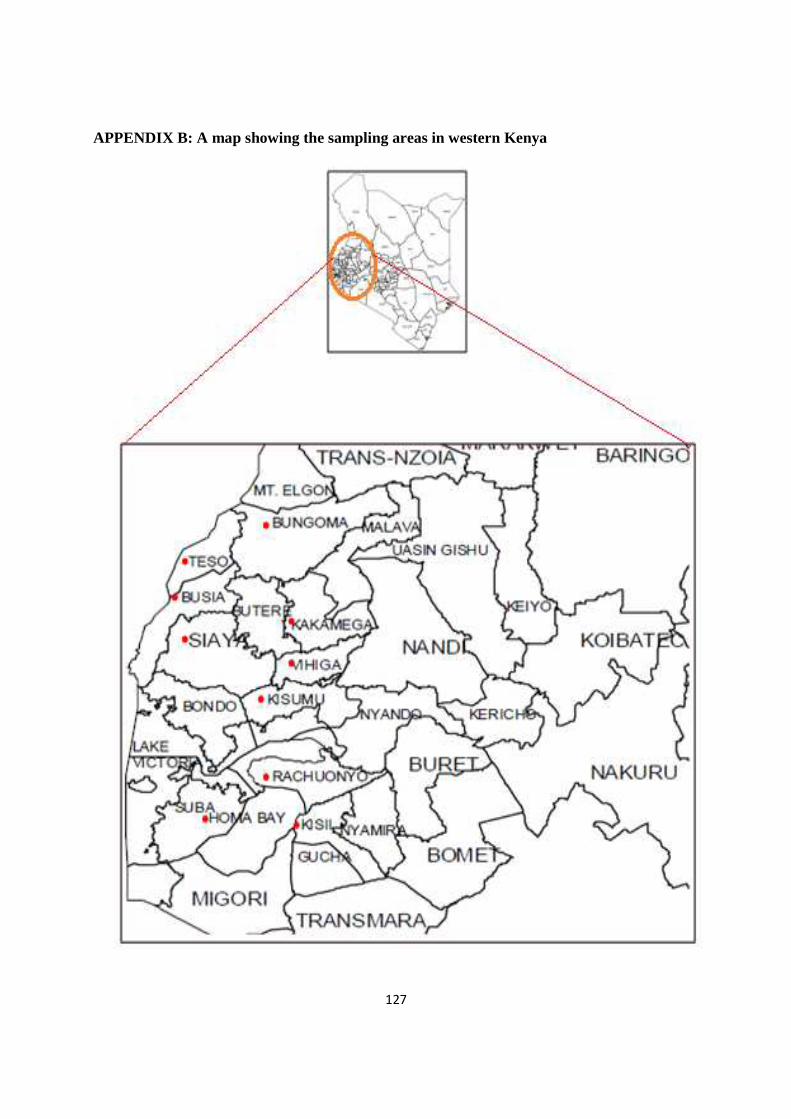
127
APPENDIX B: A map showing the sampling areas in western Kenya

128
APPENDIX C: BUFFERS FOR NCM-ELISA
1. TBS pH 7.5 (2 L)
0.02 M Tris base = 4.84 g
0.50 M Nacl = 58.44 g
5.0 ml HCl (18.5%)
2. Extraction buffer (500 ml)
500 ml TBS pH 7.5
1.0 g Sodium sulfite
3. Antibody buffer
600 ml TBS pH 7.5
12.0 g Powdered cow milk
4. Blocking solution
300 ml Antibody buffer
6.0 ml Triton
5. T-TBS (2 L)
2Litres TBS pH 7.5
2 ml Tween-20
6. Conjugate buffer (300 ml)
300 ml TBS pH 7.5
Powdered cow milk 6.0 g
7. Substrate buffer pH 9.5 (250 ml)

129
3.03 g Tris base
1.45 g NaCl
0.25 g MgCl.6H2O
0.5 ml HCl
250 ml Distilled water
8. Substrate solution
(a) NBT stock solution
NBT 25 mg
N,N-dimethyl formaldehyde (70%) 1 ml
Mix well and store at 4°C protect from light
(b) BCIP stock solution
BCIP 12.5 mg
N,N-dimethyl formaldehyde (100%) 1 ml
Mix well and store at 4°C protect from light
(c) Preparation of substrate solution
250 ml substrate buffer
1 ml NBT stock solution
1.0 ml BCIP stock solution

130
APPENDIX D: Statistical analysis of antimicrobial activity Data file: SYLVIA Title: Antifungal Function: FACTOR Experiment Model Number 8: Two Factor Randomized Complete Block Design Data case no. 1 to 27. Factorial ANOVA for the factors: Replication (Var 1: Replication 1= Rep One, 2= Two, 3= Three) with values from 1 to 3 Factor A (Var 2: Plant 1= W. ugandensis, 2= E. scweifurthianum, 3= T.brownii) with values from 1 to 3 Factor B (Var 3: Extract 1= Methanol, 2= Ethyl acetate, 3= n-Hexane) with values from 1 to 3 Variable 4: Alternaria spp Grand Mean = 7.922 Grand Sum = 213.900 Total Count = 27 T A B L E O F M E A N S 1 2 3 4 Total ------------------------------------------------------- 1 * * 7.889 71.000 2 * * 7.933 71.400 3 * * 7.944 71.500 ------------------------------------------------------- * 1 * 12.200 109.800 * 2 * 7.533 67.800 * 3 * 4.033 36.300 ------------------------------------------------------- * * 1 12.411 111.700 * * 2 8.844 79.600 * * 3 2.511 22.600 ------------------------------------------------------- * 1 1 17.100 51.300 * 1 2 14.067 42.200 * 1 3 5.433 16.300 * 2 1 12.067 36.200 * 2 2 8.433 25.300 * 2 3 2.100 6.300 * 3 1 8.067 24.200 * 3 2 4.033 12.100 * 3 3 0.000 0.000 ------------------------------------------------------- A N A L Y S I S O F V A R I A N C E T A B L E K Degrees of Sum of Mean F Value Source Freedom Squares Square Value Prob ----------------------------------------------------------------------------- 1 Replication 2 0.016 0.008 0.5091 2 Factor A 2 302.167 151.083 9889.1128 0.0000 4 Factor B 2 452.527 226.263 14809.9963 0.0000 6 AB 4 17.573 4.393 287.5643 0.0000

131
-7 Error 16 0.244 0.015 ----------------------------------------------------------------------------- Total 26 772.527 ---------------------------------------------------------------------------- Coefficient of Variation: 1.56% s_ for means group 1: 0.0412 Number of Observations: 9 y s_ for means group 2: 0.0412 Number of Observations: 9 y s_ for means group 4: 0.0412 Number of Observations: 9 y s_ for means group 6: 0.0714 Number of Observations: 3 y ============================================================================ Variable 5: A. niger Grand Mean = 9.841 Grand Sum = 265.700 Total Count = 27 T A B L E O F M E A N S 1 2 3 5 Total ------------------------------------------------------- 1 * * 9.844 88.600 2 * * 9.833 88.500 3 * * 9.844 88.600 ------------------------------------------------------- * 1 * 11.889 107.000 * 2 * 11.956 107.600 * 3 * 5.678 51.100 ------------------------------------------------------- * * 1 16.011 144.100 * * 2 10.000 90.000 * * 3 3.511 31.600 ------------------------------------------------------- * 1 1 21.067 63.200 * 1 2 11.533 34.600 * 1 3 3.067 9.200 * 2 1 16.433 49.300 * 2 2 13.433 40.300 * 2 3 6.000 18.000 * 3 1 10.533 31.600 * 3 2 5.033 15.100 * 3 3 1.467 4.400 ------------------------------------------------------- A N A L Y S I S O F V A R I A N C E T A B L E K Degrees of Sum of Mean F Value Source Freedom Squares Square Value Prob ----------------------------------------------------------------------------- 1 Replication 2 0.001 0.000 0.0447

132
2 Factor A 2 233.979 116.989 14117.0913 0.0000 4 Factor B 2 703.467 351.734 42443.6984 0.0000 6 AB 4 81.386 20.346 2455.2096 0.0000 -7 Error 16 0.133 0.008 ----------------------------------------------------------------------------- Total 26 1018.965 ---------------------------------------------------------------------------- Coefficient of Variation: 0.93% s_ for means group 1: 0.0303 Number of Observations: 9 y s_ for means group 2: 0.0303 Number of Observations: 9 y s_ for means group 4: 0.0303 Number of Observations: 9 y s_ for means group 6: 0.0526 Number of Observations: 3 ============================================================================ Variable 6: F. oxysporum Grand Mean = 3.848 Grand Sum = 103.900 Total Count = 27 T A B L E O F M E A N S 1 2 3 6 Total ------------------------------------------------------- 1 * * 3.833 34.500 2 * * 3.856 34.700 3 * * 3.856 34.700 ------------------------------------------------------- * 1 * 7.500 67.500 * 2 * 4.044 36.400 * 3 * 0.000 0.000 ------------------------------------------------------- * * 1 7.167 64.500 * * 2 3.833 34.500 * * 3 0.544 4.900 ------------------------------------------------------- * 1 1 13.433 40.300 * 1 2 8.067 24.200 * 1 3 1.000 3.000 * 2 1 8.067 24.200 * 2 2 3.433 10.300 * 2 3 0.633 1.900 * 3 1 0.000 0.000 * 3 2 0.000 0.000 * 3 3 0.000 0.000 ------------------------------------------------------- A N A L Y S I S O F V A R I A N C E T A B L E K Degrees of Sum of Mean F

133
Value Source Freedom Squares Square Value Prob ----------------------------------------------------------------------------- 1 Replication 2 0.003 0.001 0.1127 2 Factor A 2 253.645 126.823 9645.6688 0.0000 4 Factor B 2 197.345 98.673 7504.6814 0.0000 6 AB 4 120.544 30.136 2292.0298 0.0000 -7 Error 16 0.210 0.013 ----------------------------------------------------------------------------- Total 26 571.747 ---------------------------------------------------------------------------- Coefficient of Variation: 2.98% s_ for means group 1: 0.0382 Number of Observations: 9 y s_ for means group 2: 0.0382 Number of Observations: 9 y s_ for means group 4: 0.0382 Number of Observations: 9 y s_ for means group 6: 0.0662 Number of Observations: 3 y ============================================================================= Variable 7: F. solani Grand Mean = 4.733 Grand Sum = 127.800 Total Count = 27 T A B L E O F M E A N S 1 2 3 7 Total ------------------------------------------------------- 1 * * 4.711 42.400 2 * * 4.722 42.500 3 * * 4.767 42.900 ------------------------------------------------------- * 1 * 5.344 48.100 * 2 * 5.800 52.200 * 3 * 3.056 27.500 ------------------------------------------------------- * * 1 8.556 77.000 * * 2 4.122 37.100 * * 3 1.522 13.700 ------------------------------------------------------- * 1 1 9.433 28.300 * 1 2 4.067 12.200 * 1 3 2.533 7.600 * 2 1 10.433 31.300 * 2 2 6.100 18.300 * 2 3 0.867 2.600 * 3 1 5.800 17.400 * 3 2 2.200 6.600 * 3 3 1.167 3.500 -------------------------------------------------------

134
A N A L Y S I S O F V A R I A N C E T A B L E K Degrees of Sum of Mean F Value Source Freedom Squares Square Value Prob ----------------------------------------------------------------------------- 1 Replication 2 0.016 0.008 0.4375 2 Factor A 2 38.936 19.468 1095.0633 0.0000 4 Factor B 2 227.647 113.823 6402.5675 0.0000 6 AB 4 24.298 6.074 341.6877 0.0000 -7 Error 16 0.284 0.018 ----------------------------------------------------------------------------- Total 26 291.180 ----------------------------------------------------------------------------- Coefficient of Variation: 2.82% s_ for means group 1: 0.0444 Number of Observations: 9 y s_ for means group 2: 0.0444 Number of Observations: 9 y s_ for means group 4: 0.0444 Number of Observations: 9 y s_ for means group 6: 0.0770 Number of Observations: 3 y ============================================================================= Variable 8: R. stolonifer Grand Mean = 6.741 Grand Sum = 182.000 Total Count = 27 T A B L E O F M E A N S 1 2 3 8 Total ------------------------------------------------------- 1 * * 6.756 60.800 2 * * 6.733 60.600 3 * * 6.733 60.600 ------------------------------------------------------- * 1 * 14.622 131.600 * 2 * 5.600 50.400 * 3 * 0.000 0.000 ------------------------------------------------------- * * 1 11.278 101.500 * * 2 6.033 54.300 * * 3 2.911 26.200 ------------------------------------------------------- * 1 1 24.500 73.500 * 1 2 13.733 41.200 * 1 3 5.633 16.900 * 2 1 9.333 28.000 * 2 2 4.367 13.100 * 2 3 3.100 9.300 * 3 1 0.000 0.000

135
* 3 2 0.000 0.000 * 3 3 0.000 0.000 ------------------------------------------------------- A N A L Y S I S O F V A R I A N C E T A B L E K Degrees of Sum of Mean F Value Source Freedom Squares Square Value Prob ----------------------------------------------------------------------------- 1 Replication 2 0.003 0.001 0.1649 2 Factor A 2 979.710 489.855 54540.3875 0.0000 4 Factor B 2 321.761 160.880 17912.4046 0.0000 6 AB 4 280.848 70.212 7817.4012 0.0000 -7 Error 16 0.144 0.009 ----------------------------------------------------------------------------- Total 26 1582.465 ----------------------------------------------------------------------------- Coefficient of Variation: 1.41% s_ for means group 1: 0.0316 Number of Observations: 9 y s_ for means group 2: 0.0316 Number of Observations: 9 y s_ for means group 4: 0.0316 Number of Observations: 9 y s_ for means group 6: 0.0547 Number of Observations: 3 y

136
APPENDICES 1-26
SPECTRA OF ISOLLATED COMPOUNDS