Detection of PerfluorooctanesulfonicAcid in Soil Samples · Detection of...
20
Detection of Perfluorooctanesulfonic Acid in Soil Samples Brenna Arlyce Brown, PhD Paracel Laboratories Ltd. Calgary, AB
Transcript of Detection of PerfluorooctanesulfonicAcid in Soil Samples · Detection of...

Detection of Perfluorooctanesulfonic Acid in Soil Samples
Brenna Arlyce Brown, PhDParacel Laboratories Ltd.
Calgary, AB

Outline• Introduction to Perfluoronated compounds
• Environmental Concerns• Health Concerns
• Introduction to DART‐MS
• PFOS by DART‐MS
• Conclusions

Perfluoronated Compounds
S
F
F
F
F F
FF
F F
FF
F F
FF
F F
O
O
OH
Perfluorooctanesulfonic acid – PFOS
Perfluorohexanesulfonic acid – PFHS
Perfluorooctanoic acid – PFOA
Environ. Sci. Technol. 2001, 35, 1339‐1342

Perfluoronated Compounds
S
F
F
F
F F
FF
F F
FF
F F
FF
F F
O
O
OH
C–F = 116 kcal/molC–H = 100 kcal/mol
• Hydrophobic and lipophobic• Strength of C–F bond• Fully oxidised, chemically stable• Used in:
• Surfactants• Insecticides• Textiles• Aqueous fire fighting foams
Environment International, 2012, 39, 19‐26

Perfluoronated Compounds – Persistent Organic Pollutants
• Produced since 1950s• 2009 Stockholm Convention, PFOS listed as POP• 1999 3M phase out PFOS from Scotchguard• 2003 – 3M now uses perfluorobutanesulfonic acid
S
O
OOH
FF
F F
F F
F
FF
PFCs and Health Concerns
• Bioaccumulate in proteinaceous tissue• Indicated carcinogenicity• Impact:
• Liver function• Cell organelles• Immune system• Neuroendocrine system
S
F
F
F
F F
FF
F F
FF
F F
FF
F F
O
O
OH
S
O
OOH
FF
F F
F F
F
FF
Half life in humans = 5.4 yrs
Half life in humans = 1 month

Direct Analysis in Real Time – DART

DART Principles
M* + S S+• + M + e‐Where M is excited Helium (‘positive’ mode):
He(23s) + H2O H2O+• + He(11s) + e‐H2O+• + H2O H3O+ + OH•
H3O+ + nH2O [(H2O)nH]+[(H2O)nH]+ + S SH+ + nH2O
Cody, R.B.; Laramée, J.A.; Durst, H.D.. Anal. Chem., 2005, 77(8): 2297‐2302.
Song, L.; Dykstra, A.B.; Yao, H.; Bartmess, J.E. J. Am. Soc. Mass Spec. 2009, 20(1): 42‐50.
• Open air method – chemical ionisation• Water present in the air is what ionizes sample

Advantages of DART
• Gases, liquids, solids• Materials analysed directly on surfaces• Raw, unprocessed body fluids• Internal standards for quantification• Samples do not have to be thermally stable or volatile• Little to no fragmentation

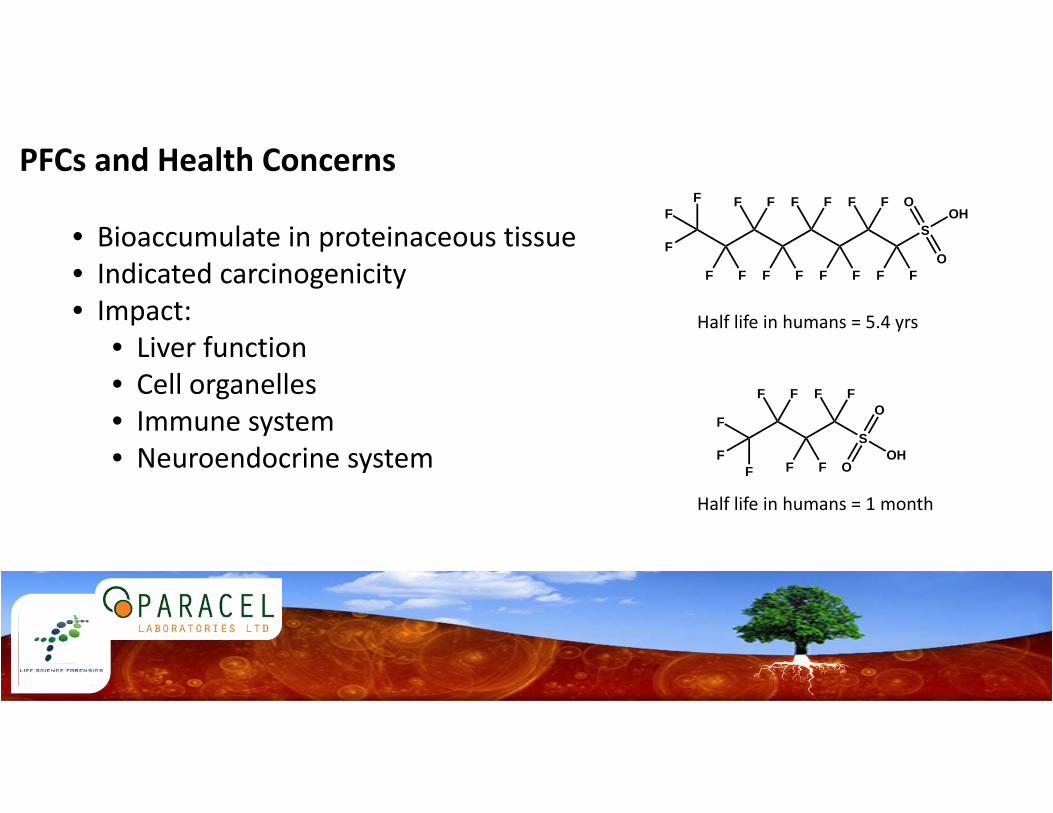
Analyses Performed• Four samples were analysed: 3 soil samples (extracted), one spike• Temperature profile was obtained for the blank spiked sample to determine the optimal desorption temperature
• Additional testing of the samples was performed using the optimal temperature
• Samples were analyzed using QuickStrip cards and SPME (C18, C18/SCX (strong cation exchange), PDMS/DVB)
• Limit of detection was evaluated by performing a serial dilution of the stock blank spiked sample

QuickStrip Cards
Stainless steel mesh – with 3 µL aliquot of liquid

SPME C18
Temperature Profile Blank Spike300°C 350°C 400°C 450°C
0.0 0.5 1.0 1.5 2.0 2.5 3.0 3.5 4.0 4.5 5.0 5.5 6.0Time (min)
0
10
20
30
40
50
60
70
80
90
100
Rel
ativ
e A
bund
ance
4.115.80
5.51
2.183.79
0.99 2.490.68
5.324.693.363.110.06 2.00
EIC of m/z 498.92 (PFOS)
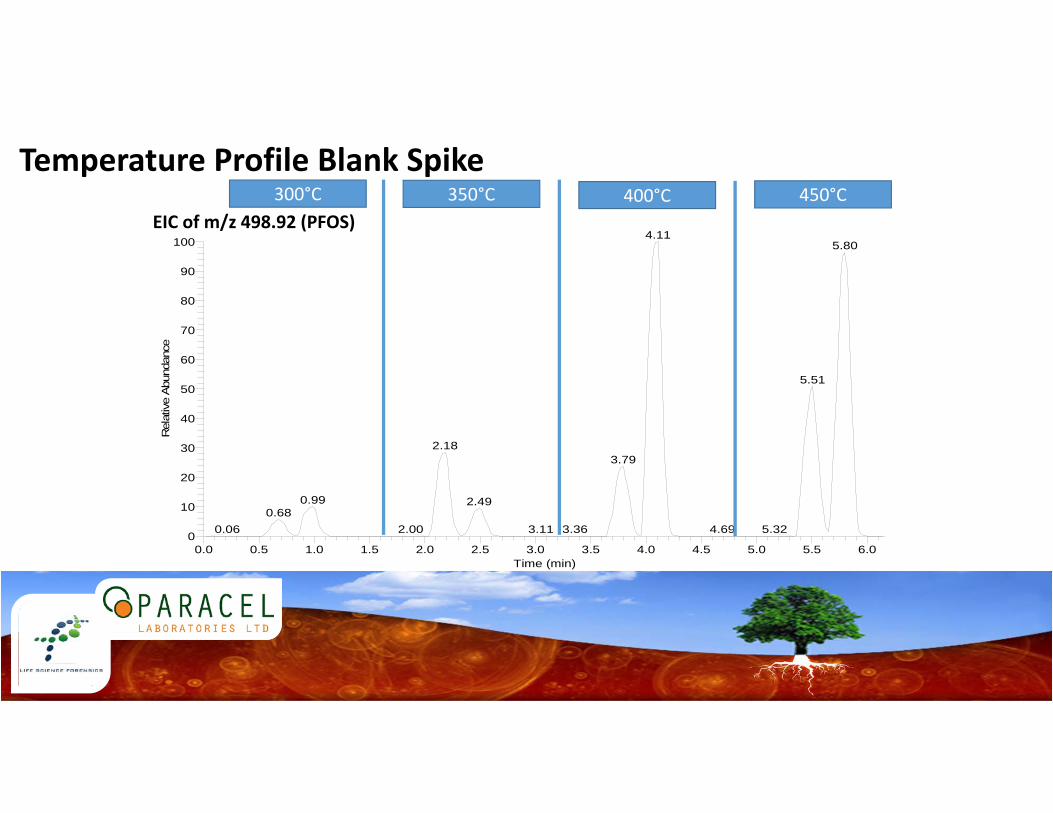
Temperature Profile on Spiked Sample
100 200 300 400 500 600 700 800 900 1000m/z
0
50
1000
50
1000
50
100
Rel
ativ
e A
bund
ance 0
50
100 121.0275
143.1058 498.9285264.1594 390.9147 992.5250788.5820635.8720
121.0275
498.9286143.1058
283.2633 369.3240 998.8686583.8857 857.7754715.6453121.0276
498.9288
143.1059 283.2634 479.9310 998.8656569.8827 658.9206 750.9956121.0277
498.9291
143.1062 569.8834283.2636 658.9218479.9314 998.8678881.3547
300C
350C
400C
450C
PFOS[M‐H]‐

Samples Analysed with QuickStrip
100 200 300 400 500 600 700 800 900 1000m/z
0
50
1000
50
100
Rel
ativ
e A
bund
ance
0
50
100 121.0277
143.1059255.2323 390.9153 482.8561 661.9179 919.8028833.2292
121.0277
143.1060255.2323 390.9153 482.8563 629.6019 818.8300700.9880 911.9406
121.0276
143.1059255.2322 390.9149 482.8561 642.0997 833.5205750.0308 908.5294
Sample 1
Sample 2
Sample 3
3 µL spotted on QuickStrip cards and analyzed at 400°C
m/z 498.92 (PFOS)

PDMS‐DVB and C18 SPME
0.0 0.5 1.0 1.5 2.0 2.5 3.0 3.5 4.0 4.5 5.0Time (min)
0
10
20
30
40
50
60
70
80
90
100R
elat
ive
Abu
ndan
ce1.05
0.651.83 2.54 2.85 4.423.60 3.922.14 3.131.65 4.77
C18
PDMS‐DVB
Blank Spiked Sample 1 Sample 2 Sample 3
C18PDMS‐DVB C18PDMS‐
DVB C18PDMS‐DVB
EIC of m/z 498.92 (PFOS)

Limits of Detection – QuickStrip
0.0 0.5 1.0 1.5 2.0 2.5 3.0 3.5 4.0 4.5 5.0 5.5 6.0Time (min)
0
10
20
30
40
50
60
70
80
90
100
Rel
ativ
e A
bund
ance
3.17
3.153.19
3.13
3.212.822.80
2.783.23
2.76
3.252.742.102.08 2.12
2.021.72 4.36
1000x 100x 10x
3 µL spotted on QuickStrip cards and analyzed at 400°C
EIC of m/z 498.92 (PFOS)
Serial dilution of the blank spiked sample

Limits of Detection – SPME C18
RT: 0.00 - 3.41 SM: 7B
0.0 0.2 0.4 0.6 0.8 1.0 1.2 1.4 1.6 1.8 2.0 2.2 2.4 2.6 2.8 3.0 3.2Time (min)
0
10
20
30
40
50
60
70
80
90
100R
elat
ive
Abun
danc
e2.37
1.52
0.720.400.350.25 2.851.38 2.952.752.591.74 2.161.000.57 1.260.94 2.10 3.11
100 200 300 400 500 600 700 800 900 1000m/z
0
50
1000
50
100
Rel
ativ
e Ab
unda
nce 0
50
100 121.0277
171.1376 255.2325199.1692 320.9775 390.9154 498.9294 539.5050 908.3072729.5848 845.3829 990.5949783.8218621.6522498.9293
121.0278
255.2325171.1376320.9773 390.9153 446.8798 516.8172 998.8660574.8438 850.6558650.5489 925.0929751.7753
498.9295
255.2325115.0747220.1460 390.9152320.9772 428.8876 511.4749 998.8662567.5324 887.2050654.6624 712.1822 798.8496
NL: 4.12E6Blank SpikedSPME 07222- p NSI Full m
NL: 3.72E6Blank SpikedSPME 07222FTMS - p NS
NL: 6.76E6Blank SpikedSPME 07222FTMS - p NS
1000x 100x 10x
Desorbed at 400°C
Serial dilution of blank spiked sample

Conclusions
• PFOS can be ionized by DART• C18 SPME fibers was most effective in recovering PFOS• PFOS was not found in any of the samples• Limits of detection dependent on mass analyser rather than DART ionizer
• Possible to get low ppb detection limits

Acknowledgements
• Joseph LaPointe – Ionsense
• Ionsense analysis team
• Paracel and Life Science Forensics analysts