Detection Of Atrazine, Simazine, And Their … DETECTION OF ATRAZINE, SIMAZINE, AND THEIR BREAKDOWN...
31
1 DETECTION OF ATRAZINE, SIMAZINE, AND THEIR BREAKDOWN PRODUCTS IN PUBLIC WATER SUPPLY WELLS By Craig Nordmark Environmental Scientist John Troiano Research Scientist III California Environmental Protection Agency Department of Pesticide Regulation 1001 I Street, Sacramento, California 95814 Report number: EH 07-02
Transcript of Detection Of Atrazine, Simazine, And Their … DETECTION OF ATRAZINE, SIMAZINE, AND THEIR BREAKDOWN...

1
DETECTION OF ATRAZINE SIMAZINE ANDTHEIR BREAKDOWN PRODUCTS IN
PUBLIC WATER SUPPLY WELLS
By
Craig Nordmark Environmental Scientist
John Troiano Research Scientist III
California Environmental Protection Agency Department of Pesticide Regulation
1001 I Street Sacramento California 95814
Report number EH 07-02
ABSTRACT
Atrazine and simazine are pre-emergence herbicides that are known to contaminate ground water from normal agricultural use According to a recent US Environmental Protection Agency (EPA) re-registration eligibility decision for atrazine the breakdown products of atrazine and simazine were determined to be as toxic as the parent chemical Consequently EPA concluded that the concentrations of parent and breakdown triazine residues in a well sample should be summed and that value compared to established health standards Atrazine simazine and their breakdown products have been frequently detected in wells sampled by the Environmental Monitoring Branch Department of Pesticide Regulation (DPR) California EPA Most wells sampled by DPR staff were domestic single family wells but some small public water supply (PWS) wells have also been sampled and found to contain triazine residues The California Department of Public Health (CDPH) requires public water agencies to include atrazine and simazine in their sampling schedule because they are state and federally regulated potential contaminants Public water agencies are not required to sample for the triazine breakdown products because they have not yet been included in established health standards DPR conducted this study to compare the presence of parent atrazine and simazine residues to breakdown product residues in PWS wells DPR sampled PWS wells that had previous detections of dibromochloropropane (DBCP) in areas of high simazine use DBCP is a banned agricultural soil fumigant that was widely detected in drinking water wells beginning in 1977 Residues of atrazine simazine or their breakdown products deethyl-atrazine (DEA) deethylshysimazine (ACET) or diamino chlorotriazine (DACT) were detected in 15 of 49 PWS wells sampled in eastern Fresno and Tulare Counties Parent residues were present in 3 of the 15 wells whereas the breakdown products were detected in all of the 15 wells When compared to previous results from domestic wells the breakdown products occurred more frequently in the absence of parent chemical in the PWS wells The higher detection frequency is likely due to the deeper depth of PWS wells in comparison to domestic wells The greater travel time for residues to reach these water supply wells facilitates conversion of the parent to breakdown products With respect to established health standards for triazine herbicides the total residue detected in each well was below Californiarsquos current atrazine maximum contaminant level (MCL) of one microgram per liter (μgL) Although this study surveyed only a small sample of the PWS wells in the Fresno and Tulare county area factors that contributed to a greater chance of detecting residues in a well were location in areas with greater reported use of simazine previous detection of DBCP at relatively high concentrations and sampling of PWS wells that were shallower in total borehole depth Sampling over time will be required to establish potential temporal trends in concentrations especially with respect to the concentration of the breakdown products
1
ACKNOWLEDGEMENTS
The authors would like to thank to the following water suppliers for their cooperation in this study
bull California Water Service Company Selma DistrictmdashTim Erickson bull California Water Service Company Visalia DistrictmdashSteve Johnson bull City of DelanomdashCraig Wilson bull City of Dinuba Public WorksmdashMonte Sylvester bull City of ExetermdashFelix Ortiz bull City of FresnomdashRobert C Little bull City of LindseymdashDarron Dillard bull City of MalagamdashRichard Ochoa bull City of ParliermdashJohn Hiachi bull City of PortervillemdashRichard Bartlett bull City of ReedleymdashTex Shehan bull City of SangermdashFrank Sani bull City of TularemdashDan Boggs bull Cutler Public Utility DistrictmdashDionicio Rodriguez Jr bull Del Rey Community Services DistrictmdashGilbert Romero bull Ivanhoe Public Utility DistrictmdashGordon Ponder bull Orosi Public Utility DistrictmdashFred Boyles bull Richgrove Community Service DistrictmdashCarlos Ramerez bull Terra Bella Irrigation DistrictmdashTom Day
Additionally the authors would like to thank Mr Jeff Schuette California Department of Water Resources and Mr Murray Clayton DPR for their help in conducting the field sampling Dr Bruce Johnson DPR for his assistance with the statistical analysis and Ms Carissa Ganapathy DPR for her work as the Laboratory Liaison Finally we would like to thank Cathy Cooper Hsiao Feng Suzanne Matsumoto and Teresa Woroniecka of the California Department of Food and Agriculture (CDFA) Center of Analytical Chemistry for their work in this study
2
DISCLAIMER
The mention of commercial products their source or use in connection with material reported herein is not to be construed as an actual or implied endorsement of such product
3
TABLE OF CONTENTS
ABSTRACT 1 ACKNOWLEDGEMENTS 2 DISCLAIMER 3 TABLE OF CONTENTS 4LIST OF TABLES 5 LIST OF FIGURES 6 INTRODUCTION 7 MATERIALS AND METHODS 8 RESULTS 11 DISCUSSION 13 CONCLUSIONS 15 REFERENCES 16 TABLES 18 FIGURES 26
4
LIST OF TABLES
Table 1 Summary of the total use of simazine summed from 1993 to 2002 for the top five counties in California the number of PWS wells containing DBCP residues and the number of wells sampled by DPR with residues of simazine or its breakdown products ACET or DACThelliphelliphelliphelliphelliphelliphelliphelliphelliphelliphelliphelliphelliphelliphelliphelliphelliphelliphelliphelliphelliphelliphelliphelliphelliphelliphelliphelliphelliphelliphelliphelliphelliphellip18
Table 2 Analytical results for upper control limit (UCL) upper warning limit (UWL) lower warning limit (LWL) and lower control limit (LCL) and selected blind spiked samples submitted to the laboratory Blind samples were randomly submitted during the study at varied spike levelshelliphelliphelliphelliphelliphelliphelliphelliphelliphelliphelliphelliphelliphelliphelliphelliphelliphelliphelliphelliphelliphelliphelliphelliphelliphelliphelliphelliphelliphelliphelliphelliphelliphellip19
Table 3 Results for continuing duplicate spiked samples added with each extraction set Each analyte was spiked at 02 μgLhelliphelliphelliphelliphelliphelliphelliphelliphelliphelliphelliphelliphelliphelliphelliphelliphelliphelliphelliphelliphelliphelliphellip20
Table 4 Analytical results for sampled PWS wells where ND means nondetected at a reporting limit of 005 μgLhelliphelliphelliphelliphelliphelliphelliphelliphelliphelliphelliphelliphelliphelliphelliphelliphelliphelliphelliphelliphelliphelliphelliphelliphelliphelliphelliphelliphellip21
Table 5 Data used for the statistical analyses relating explanatory variables to detections of simazine ACET andor DACT in a PWS wellhelliphelliphelliphelliphelliphelliphelliphelliphelliphelliphelliphelliphelliphelliphelliphelliphelliphellip22
Table 6 Logistic regression analysis using the score option to test the relationship between frequency of detection in wells and explanatory variables For explanatory variables Pwsdepth is the borehole depth of the PWS well simapp is the cumulative lbs of simazine applied in the sampled section and eight surrounding sections dbcphigh is the highest DBCP concentration reported in the PWS well and gwdepth is the sectional averaged depth to ground waterhelliphelliphellip23
Table 7 Logistic model solution for the best 1 through 4 variable models as indicated in Table 6helliphelliphelliphelliphelliphelliphelliphelliphelliphelliphelliphelliphelliphelliphelliphelliphelliphelliphelliphelliphelliphelliphelliphelliphelliphelliphelliphelliphelliphelliphelliphelliphellip24
Table 8 Association of predicted probabilities and observed responses and model fit statistics presented for the best models containing 1 through 4 variables in Table 6helliphelliphelliphelliphelliphelliphelliphellip25
5
LIST OF FIGURES
Figure 1 Breakdown products for atrazine and simazinehelliphelliphelliphelliphelliphelliphelliphelliphelliphelliphelliphelliphelliphelliphellip26
Figure 2 Spatial relationship between areas of simazine use (colored squares) and previous DBCP detections in PWS wells (circles) in the Fresno Tulare and Kern county areashelliphellip27
Figure 3 Spatial relationship between results of PWS wells sampled in this study (triangles) to simazine use (colored squares) and to wells with previous reported detections of simazine and or breakdown products (circles)helliphelliphelliphelliphelliphelliphelliphelliphelliphelliphelliphelliphelliphelliphelliphelliphelliphelliphelliphelliphelliphelliphelliphelliphellip28
Figure 4 Relationship of ACET and DACT concentrations measured in wells where graph A is the relationship of the raw data and graph B is DACT concentration expressed in equivalent ACET unitshelliphelliphelliphelliphelliphelliphelliphelliphelliphelliphelliphelliphelliphelliphelliphelliphelliphelliphelliphelliphelliphelliphelliphelliphelliphelliphelliphelliphelliphelliphellip29
Figure 5 Scatter plot of the relationship between total simazine concentration in a well and the A) average sectional depth to ground water B) reported depth of the PWS well C) cumulative simazine in the sampled section and eight surrounding sections and D) maximum DBCP concentration reported in the PWS wellhelliphelliphelliphelliphelliphelliphelliphelliphelliphelliphelliphelliphelliphelliphelliphelliphelliphelliphelliphelliphellip30
6
INTRODUCTION
The US EPA completed an intermediate registration eligibility decision for atrazine in 2003 (US EPA 2003a and b) Atrazine is a widely used pre-emergence herbicide In that decision US EPA determined that toxicity of the chlorinated breakdown products was equivalent to the parent chemicals Owing to the similarity in toxicity the US EPA recommended summing the concentrations of all detected triazine residues in a water sample and comparing the summed value to established health standards Federal and state drinking water standards only apply to individual triazine herbicide parent compounds To regulate triazine residues collectively including breakdown products requires formal rulemaking by either the U S EPA or the CDPH Inclusion of pesticide breakdown products in a health level is not unprecedented For example aldicarb and its breakdown products aldicarb sulfoxide and aldicarb sulfone each have an MCL of three four and two μgL respectively When detected in any combination in a water sample the MCL is 7 μgL because of similar modes of action (US EPA 2006) Troiano and Nordmark (2002) analyzed the concentration distribution of total triazine residues detected in previous California well water samples and compared the results to California MCLs for atrazine and simazine Total triazine residues include the parent compounds and their degradation products deethyl-atrazine (DEA) deethyl-simazine (ACET) and diamino chlorotriazine (DACT) The degradation of atrazine and simazine produces common breakdown products (Figure 1) ACET is the first product formed upon degradation of either atrazine or simazine parent products Further degradation of ACET produces DACT DACT can also be produced through the degradation of DEA which is another breakdown product of atrazine Well data analyzed by Troiano and Nordmark were mostly derived from sampling of shallow domestic wells where 131 wells had detections of triazine residues Although the concentrations of atrazine and simazine did not exceed their respective MCLs of one μgL and four μgL respectively the total triazine residues exceeded the MCL for atrazine 1 μgL in approximately 31 of the wells and the MCL for simazine 4 μgL in 5 of the wells
DPR samples drinking water wells to monitor the spatial distribution and the concentration of pesticide residues in Californiarsquos ground water (Schuette et al 2005) These studies are targeted to areas of high pesticide use or to areas where pesticide residues had previously been reported in well water samples DPRrsquos monitoring program focuses on domestic wells because they draw water from shallow ground water aquifers where the probability of contamination is greatest In contrast data reported to DPR by CDPH are from samples taken from PWS wells Since these wells require a higher yield of water to supply a larger population they are drilled deeper than domestic wells to draw water from deeper aquifers Screened areas within PWS wells can also be larger so water is also collected throughout the screened distance Since deeper aquifer water is older than water in shallow aquifers contamination is assumed to be less likely in PWS wells than in domestic wells Thus data obtained from domestic wells that draw water from shallower aquifers and from a narrower range of aquifers may not be representative of the potential detection frequency and concentration in PWS wells Since July 1996 data submitted to DPR by CDPH contained no atrazine detections and only two wells were reported with simazine residues In addition reporting limits (lowest detectable concentrations) for chemical analyses required by CDPH are higher than for DPR well sampling studies For example CDPH reporting limits are 05 μgL for atrazine and 10 μgL for simazine whereas the DPR reporting limit is lower at 005 μgL for both chemicals Lastly the triazine breakdown products are not included in the standard chemical analysis required by CDPH for PWS wells
7
Pre-emergence herbicide residues such as atrazine and simazine have been detected in wells sampled throughout a large contiguous area in Fresno and Tulare Counties (Troiano et al 2001) DPR well sampling has occasionally included PWS wells but usually only when shallow domestic wells were not available to accomplish the required monitoring or in response to a reported detection of pesticide residues in a PWS well Prior to this study data in DPRrsquos well inventory data base indicated that DPR well sampling resulted in the detection of triazine parent and breakdown products in 7 of 19 PWS wells sampled in Fresno Tulare and Kern counties Three PWS wells sampled by DPR in the Sanger area contained simazine and DEA or ACET residues DACT was not reported because the samples were taken prior to its inclusion on the chemical analytical screen in 1996 Two of these three wells were also reported by CDPH to contain dibromochloropropane (DBCP) residues as recently as 2003 CDPH continues to detect DBCP in numerous wells throughout the state even though DBCP use was banned in California in the late 1970rsquos California growers used DBCP as a soil fumigant for nematode control in vineyards orchards and annual crops and its use resulted in widespread contamination of ground water in both domestic and PWS wells
The primary objectives of this study were to sample for the parent and breakdown products of atrazine and simazine residues in PWS systems that draw from deeper ground water aquifers and to compare to the PWS detection frequency and concentrations to historical results for domestic wells PWS wells were selected that had a recent history of DBCP contamination because presence of DBCP residues indicated impacts from agricultural sources In addition the candidate PWS wells were located in areas where simazine had been used and where triazine residues had been previously detected in nearby wells Another study objective was to correlate detections in the PWS wells with the factors used to identify sampling locations
MATERIALS AND METHODS
Study Area The study area encompassed central Fresno County through northern Kern County (Figure 2) The study area is underlain with a shallow ground water aquifer that is vulnerable to contamination (Troiano et al 2000 Marade and Troiano 2003) Previous DBCP sampling indicated its presence in both domestic and PWS wells throughout the study area (Figure 2) Simazine is used on many crops (Table 1) and has been found in addition to its breakdown products in numerous domestic wells in the study area (Figure 3)
Well Selection PWS wells were chosen for sampling based on three criteria 1 Previous report of DBCP detection by CDPH since 2000 2 Proximity to wells with previous detections of triazine residues 3 Amount of cumulative simazine use 19932002 in surrounding sections of land
The presence of DBCP was chosen as an indicator that the well could be impacted by the application of agricultural chemicals Total simazine use was determined for the period 19932003 for each section of land in which a PWS well was located and for the eight
8
surrounding sections A section of land is approximately a 1-mile square area as defined by the Public Land Survey coordinate system (Davis and Foote 1966) Pesticide use is reported to DPR by section location
Based on cumulative simazine reports from 19932002 use occurred throughout the study area with heaviest applications located along the eastern boundary (Figure 2) Atrazine is used primarily on corn and soybeans Since these crops are not predominant in the study area atrazine use for the same period was low Even though reported use was low several wells with atrazine residue have been reported in the study area Since 1985 DPR has detected triazine residues in over 500 wells in this area Since 2000 CDPH has reported detections of DBCP residues in 200 PWS wells in this same area
DPR contacted well operators to seek permission to sample from targeted wells If a selected well was unavailable another well situated nearby was substituted In a few cases the substituted well did not have a reported detection of DBCP Information for each sampled well was recorded from documents provided by the well operator when possible or from verbal statements from the owner or representative providing access to the well We sought the depth-to-water borehole depth pumping depth casing perforations and screened intervals for each well Some information was obtained for all wells However not all wells provided the full set of information We were able to obtain the borehole depth for all but one of the wells (L08) Depth for well L08 was estimated based on the depths of nearby municipal wells with similar levels of water pumping Additional information was taken from sampling staff observations and measurements including casing size and the condition of the well pad and seal
Well Sampling Wells were sampled according to the standard DPR well sampling protocols (Marade 1996 Marade 1998) Most of the wells were operational and had been running prior to the time of sampling However some wells were not operational (L06 L12 L34 L21 L22) due to known water contamination These wells were kept in reserve by water purveyors for emergencies or until a suitable source of mixing water was operational such as another well with no DBCP contamination Most wells had a faucet on the discharge pipe for collecting samples prior to any water treatment One primary sample two backup samples and one field blank were collected from each well in one-liter amber bottles Samples were stored on wet ice for transport and were refrigerated until analysis
This study was conducted in two phases The initial phase began in early October 2004 when 12 wells were sampled Wells for this first phase were selected from a graphical overlay of sectional use for simazine and location of PWS wells with previous DBCP detections Well sampling sites were visually selected from areas of overlap of the greatest magnitude for each variable Results from these 12 wells had a high number of detections so a second phase of sampling (Phase II) was conducted The sites chosen for sampling were not restricted to the overlap of the greatest magnitude of each variable Phase II was conducted from November through December 2004
9
Chemical Analysis and Quality Control The Center for Analytical Chemistry Environmental Monitoring Section California Department of Food and Agriculture (CDFA) (Sacramento CA) performed the laboratory analyses The laboratory method was originally developed by ALTA Analytical Laboratory (El Dorado Hills CA) in 1993 to provide simultaneous measurement for selective triazine parent and breakdown products but it also included analysis of other herbicide residues CDFArsquos method utilized liquid chromatography for separation that was coupled to an atmospheric pressure chemical ionization ion trap tandem mass spectrometer (APCIMSMS) for detection The method is CDPR reference number 245 and it is available upon request The method measures concentrations in well water for atrazine simazine and their breakdown products DEA ACET and DACT Additional pesticides included in the method were diuron prometon bromacil hexazinone norflurazon and the norflurazon breakdown product desmethyl norflurazon The reporting limit was 005 μgL for all analytes
Quality control (QC) was conducted according to the standard operating procedure for chemistry laboratory quality control (Segawa 1995) When pesticide residue was detected in a primary sample the corresponding field blank was submitted for analysis None of the field blank samples submitted contained detectable residues Samples containing known amounts of pesticides were disguised as field samples (blind spiked samples) and they were randomly submitted to the laboratory Except for the DEA blind spike sample on November 8 all recoveries were within their respective control limits (Table 2) The DEA result exceeded the upper warning limit (UWL)
Continuing QC was based on a set of duplicate laboratory-spiked samples included with each extraction set (Table 3) All analytes in these samples were spiked at 02 μgL and subjected to the extraction procedure Some of the analyses exceeded the UWL with a few sporadic exceedances of the upper control limit When these values are exceeded the laboratory is to evaluate the accuracy of the results and the need for adjusting the procedure
Data Analysis The data analysis for this report was generated using SASSTATreg software Version 91 of the SAS System for Windows 50 Copyright (c) 2002-2003 by SAS Institute Inc SAS and all other SAS Institute Inc product or service names are registered trademarks or trademarks of SAS Institute Inc Cary NC
Since simazine applications and detections dominated the data statistical analysis focused on the relationship between explanatory variables and the detection of simazine or its breakdown products ACET or DACT The explanatory variables were the two used to select sampling sites which were cumulative simazine use in the sampled section and eight surrounding sections and the maximum concentration of DBCP previously reported in a PWS well Two additional potential explanatory variables were derived after sampling One was the borehole depth of the PWS well that was obtained during sampling and the other was the average depth to ground water in the section in which the well was sampled The depth to ground water is a variable that was derived for the determination of vulnerable areas in California (Spurlock 2000 Troiano et al 2000)
10
All variables were tested for conformity to assumptions of normality using PROC CAPABILITY For each variable this procedure reports simple statistics histograms of the distribution and four tests of fit for normality assumption which are Shapiro-Wilk W statistic Kolmogorov-Smirnov D statistic Cramer-von Mises W-sq statistic and Anderson-Darling A-sq statistic All statistics indicated the distributions were not normally distributed which was due to numerous values at or below the reporting limit coupled with the presence of tailing caused by sporadic high values Due to the lack of normality nonparametric analysis was conducted Analyses for detections of simazine and its breakdown products were conducted with the detections derived as a binary variable where wells were assigned a value of one when a well sample contained detections of simazine ACET or DACT otherwise they were assigned a 0 value For the binary categorical analysis the PROC LOGISTIC procedure was used with the model selection option of score This option uses the branch and bound algorithm of Furnival and Wilson (1974) to find a specified number of models with the highest likelihood score (Chi-square) statistic for all possible model sizes from 1 2 and 3 effect models and so on up to the single model containing all of the explanatory effects
RESULTS
Residues in PWS Wells In the initial sampling conducted in October 2004 12 PWS wells were sampled that were located in the areas of highest simazine use and where DBCP was measured in the PWS well (Figure 2) These wells are labeled as L01 through L12 in the Tables Ten of the wells contained pesticide residues Simazine was detected in two wells DACT was detected in ten wells ACET was detected in eight wells bromacil was detected in five wells and diuron was detected in four wells (Table 4) Atrazine and DEA residues were detected in one well (L4) that had previously been sampled by DPR in 1994 and found to contain atrazine and DEA residues Eight of the ten wells had three or more residues of various combinations of parent and breakdown products
The high pesticide detection rate during the first phase of this study at 83 of sampled wells prompted a second phase in which an additional 37 PWS wells were sampled during November and December 2004 These wells are identified as L13 through L49 in the tables Triazine residues were detected in five of these wells DACT was found in four wells and ACET in three wells (Table 4) Diuron residues were found in two wells and bromacil in one well Three well samples had two pesticide residues present The rate of detection in this second phase was lower than in the initial sampling and may be due to targeting of wells in areas with lower pesticide use and lower maximum DBCP concentrations
Overall 17 (35) of the 49 wells sampled contained pesticide residues With respect to triazine residues parent residues were detected in 3 (6) of the 49 wells whereas the breakdown products were detected in 15 (31) wells With respect to the pattern of detection of breakdown products in relation to parent chemical DEA is a major breakdown product that is associated with atrazine and not simazine (Figure 1) DEA was only found in the well where atrazine was detected ACET and DACT are also breakdown products of atrazine and they were detected in that well ACET and DACT were detected in both wells that contained the parent simazine with no associated detection of DEA Since the remaining wells that contained ACET DACT or both
11
had no DEA residues this pattern indicated that the source was from application of simazine the predominant triazine herbicide applied in this geographical area
The relationship between raw ACET and DACT concentrations in well water is illustrated in Figure 4A There were three wells that contained only DACT residues and two wells that contained only ACET residue In the ten remaining wells where both residues were measured the concentrations were highly correlated but with a slight bias towards higher DACT concentrations Since DACT is a further breakdown product of ACET its molecular weight is lower at 1457 gmol as compared ACET at 1737 gmol When DACT concentrations were corrected to represent a molar comparison the comparative values fall more closely to the 11 line (Figure 4B) Comparisons based on the molecular relationships could be important when attempting to derive specific travel times to ground water and when deriving hypothesis to explain differences in concentration
With respect to comparisons to current health levels all individual atrazine and simazine concentrations and the summed values for all triazine residues in each well sample were below Californiarsquos MCL of 10 μgL for atrazine
Relationship of Detections to Explanatory Variables DPR selected PWS wells for sampling based on the total cumulative reported simazine use for the section containing the PWS well and the eight surrounding sections and on previous detection of DBCP in the wells During sampling the borehole depth of the PWS well sampled was obtained from the well operators and the average sectional depth to ground water was obtained from previous determination of vulnerable areas of California Scatter plots of each explanatory variable against the total simazine residue (TSR) in a well are illustrated in Figure 5 TSR was determined as the addition of simazine ACET and DACT residues in each well sample For each of the plots there are low to nondetections throughout the range of each explanatory variable Logistic regression analysis was conducted to determine the relative contribution of each variable to occurrence of detections The data set used in the SAS procedures to relate the explanatory variables to the TSR detections is given in Table 5 where for computing purposes non-detected values were assigned a 0 value
Table 6 gives the chi-square values sorted by magnitude for each model at 1 through 4 variable combinations Table 7 contains the solution for the model with the highest chi-square value at each of the 1 through 4 variable combinations The chi-square value for each of the best models was significant The two-variable combination of borehole depth of the PWS well and cumulative simazine use increased the chi-square value by nearly two-fold when compared to the best single-variable model with shallower borehole depth and higher simazine use correlated with more frequent detections The 3-variable model added the term for the maximum DBCP concentration in a PWS well Addition of DBCP concentration increased the significance level for simazine application from p=007 to p=002 with higher DBCP concentrations correlated with more frequent detections (Table 7) For the 1-variable model with PWS borehole depth the rate of concordant predictions which measures the agreement between the model estimate and observed data was relatively high at 71 This value increased to 79 for the 2-variable model and to 83 for the 3-variable model (Table 8) The full 4-variable model provided no further increase in concordant percentage indicating that depth to ground water did not correlate with
12
detections Criteria that judged the performance of the model fit in relation to the number of variables are provided in Table 8 where AIC is the Akaike Information Criterion SC is the Schwarz Criterion and ndash2 Log L is the ndash2 Log Likelihood criterion The AIC and SC provide two methods to adjust the ndash2 Log L for the number of terms in the model and the number of observations used Lower values of each statistic indicate a more desirable model The 3-variable model provided the lowest AIC and SC criterion values
DISCUSSION
The first objective was to determine the presence and concentration of triazine residues in PWS systems that typically draw from deep ground water aquifers Triazine residues were detected in 15 of 49 PWS wells sampled Three wells contained residues for the parent atrazine and simazine chemicals whereas all 15 of the wells contained residues of the breakdown products In a previous analysis of the distribution of triazine residues in wells with samples taken from predominantly shallow domestic wells Troiano and Nordmark (2002) reported detection of parent simazine in 77 (75 of 98) of wells that contained residues for simazine ACET andor DACT Although the sample size for positive wells was lower for the deeper PWS wells the frequency for detection of parent was lower at only 20 (3 of 15) of wells with detections This comparison indicates a lower probability for detecting parent residues in relation to breakdown products in PWS wells Spurlock et al (2000) used a chlorofluorocarbon technique to provide an estimate of the travel time for residues to reach domestic wells after pesticide application to the surface The estimated median travel time was 7 to 9 years for wells drawing water from shallow aquifer depths that were located from 15 to 80 feet below the surface The screened intervals for PWS wells in this survey were deeper than the wells reported by Spurlock et al (2000) Thus the longer travel time for recharge water to reach the well facilitates the complete conversion of parent chemical into breakdown products
The current California MCL for atrazine is 1 μgL When all triazine residue concentrations were added together for each well sample none exceeded MCL This study only provided a snapshot of potential concentrations it did not provide any indication of decreasing or increasing trends in concentration PWS wells tap water from a broad distance mixing water from a number of aquifers so concentrations could remain below MCL due to mixing of water from many aquifers On the other hand water migrating from the shallower contaminated aquifers could be a source of contamination to the deeper aquifers and result in increased concentrations in PWS wells Monitoring of these wells over time will determine if the potential for contamination is increasing over time
A second objective was to affirm the usefulness of spatial information in identifying sampling sites with a higher probability for detection of residues Identifying the areas of highest overlap between simazine applications and a history of DBCP detections in a PWS well resulted in a high rate of detection for the first 12 wells sampled residues were detected in 83 (10 of 12) of the wells sampled in this first cut In the second phase the sampling sites included more variability in the amount of simazine applied and the historical DBCP concentrations detected which resulted in a much lower rate of detection with residues detected in 14 (5 of 37) of these additional wells This result qualitatively indicated that the frequency of detection was affected
13
as lower values of simazine use and DBCP concentration were included in order to provide for a greater number of sampling sites in Phase II
In addition to the two variables used to locate sampling sites logistic regression analysis also identified borehole depth of the PWS well as another significant explanatory factor The coefficients for the 3-variable model logically agreed with known processes whereby detections increased as simazine use and DBCP concentration increased and detections decreased as borehole depths became deeper The model was additive in nature but low values of one of the explanatory variables did not preclude a determination of non-detection For example even though well L11 had a relatively low maximum value for DBCP concentration at 004 μgL the borehole depth was shallow and the cumulative application of simazine was moderate (Table 6) Well L11 was predicted in the detection category and it did contain residues Well L02 on the other hand had a high maximum DBCP concentration at 33 μgL and a relatively shallow borehole but the total cumulative application of simazine was low This combination again predicted detection in that well and the well did contain residues With respect to the practical application of these results data for pesticide use and previous information on pesticide detections are available for pre-diagnosis of areas to sample In contrast data for the borehole depth of the well may not be known prior to sampling However this data when available would be an important addition to locating potential sampling sites with a high probability for detection
Six wells sampled for this study had previously been sampled in 1992 or 1994 by DPR (L04 L09 L11 L19 L20 and L24) and they provide a comparison to the results of this survey Data are comparable because the reporting limits were the same at 005 μgL for each chemical For three of the wells L19 L20 and L24 none had detections at the previous sampling and similarly residues were not detected in this study Based on the results of this study these wells were located in areas where detection probability was low due to deeper boreholes and relatively low cumulative simazine use
In contrast the location of Wells L04 L09 and L11 were projected to be in areas of higher probability for detection Residues were not previously detected in wells L09 and L11 but in this study well L09 contained bromacil at 005 μgL ACET at 009 μgL and DACT at 016 μgL The bromacil detection is at the previous reporting limit Neither ACET nor DACT were included in the analysis screen in the previous sampling in 1994 so this data is ambiguous regarding changes over time For well L11 diuron was detected at 010 μgL and simazine at 012 μgL indicating appearance of residues over time Lastly the previous sampling of Well L04 indicated atrazine at 012 μgL DEA at 011 μgL and simazine below the detection limit Fourteen years later in this current study the levels were similar with atrazine at 01 μgL DEA higher at 02 μgL and simazine still undetected The consistency in detection of the atrazine residues over the 14-year period indicates the potential longevity of residues once they contaminate ground water Data for well L11 could indicate a trend for increasing concentrations but more monitoring data would be required to provide an adequate basis for determining long-term trends in pesticide concentrations
14
CONCLUSIONS
1 Atrazine simazine and their breakdown products DEA ACET and DACT were detected in public water supply wells sampled in Fresno and Tulare counties
2 Breakdown products were detected more frequently and in higher concentration than the parent residues indicating that the greater travel time to ground water allowed for conversion from parent chemicals In light of the similar toxicity of the breakdown products they should be included in the normal sampling procedures associated with PWS wells
3 When compared to concentrations measured in shallower domestic wells the concentration of total triazine residues in these PWS samples was below the established California atrazine MCL at 1 μgL This sampling provided only a snapshot of the concentrations in wells so additional sampling over time will determine whether or not there is a tendency for the concentrations to increase over time as the shallower contaminated ground water eventually recharges the deeper aquifers
4 Spatial data on the magnitude of pesticide use and on the concentration of previous DBCP detections in a well proved to be effective explanatory variables for selecting sampling locations that resulted in a higher frequency of pesticide detections The observed depth of the PWS well which was obtained after the sampling was also shown to provide additional information If known well depth could be added as another factor to maximize the probability of detecting residues
15
REFERENCES
Davis RE and FF Foote 1966 ldquoChapter 23rdquo Surveying theory and practice Fifth edition New York NY
Furnival GM and Wilson RW (1974) ldquoRegressions by Leaps and Boundsrdquo Technometrics 16 499 - 511
Marade J 1996 Well Sampling Obtaining Permission to Sample Purging Collection Preservation Storage and Documentation Environmental Monitoring Branch Department of Pesticide Regulation California Environmental Protection Agency Sacramento CA SOP FSWA00100 Available at httpwwwcdprcagovdocsemonpubssopsfswa001pdf (Verified 15 January 2008)
Marade J 1998 Selection of a Suitable Well Site Environmental Monitoring Branch Department of Pesticide Regulation California Environmental Protection Agency Sacramento CA SOP FSWA006Available at httpwwwcdprcagovdocsemonpubssopsfswa006pdf (Verified 15 January 2008)
Marade J and J Troiano 2003 Update of Ground Water Protection Areas Environmental Monitoring Branch Department of Pesticide Regulation and California Environmental Protection Agency Sacramento CA EH 03-05 Available at httpwwwcdprcagovdocsgwpeh0305updatepdf (Verified 15 January 2008)
Schuette J D Weaver J Troiano and J Dias 2005 Update of the Well Inventory Database Environmental Monitoring Branch Department of Pesticide Regulation and California Department of Environmental Protection Sacramento CA EH 05-06 Available at httpwwwcdprcagovdocsemonpubsehaprepseh0404pdf (Verified 15 January 2008)
Segawa R 1995 Chemistry Laboratory Quality Control Environmental Monitoring Branch Department of Pesticide Regulation and California Environmental Protection Agency Sacramento CA SOP QAQC00100 Available at httpwwwcdprcagovdocsemonpubssopsqaqc001pdf (Verified 15 January 2008)
Spurlock F 2000 Procedures for developing a depth-to-ground water database Environmental Monitoring Branch Department of Pesticide Regulation and California Environmental Protection Agency Sacramento CA EH 00-02 Available at httpwwwcdprcagovdocsemonpubsehaprepseh0002pdf (Verified 15 January 2008)
Spurlock F K Burow N Dubrovsky 2000 Chlorofluorocarbon Dating of Herbicide-Containing Well Waters in Fresno and Tulare Counties California Journal of Environmental Quality Volume 29 no 2 Mar-Apr 2000 Available at httpwwwcdprcagovdocsemonpubsehaprefchlordatpdf (Verified 15 January 2008)
16
Troiano J and C Nordmark 2002 Revised 2004 Distribution of Triazine Residues in Wells in Relation to Current and Proposed Maximum Contaminant Levels (MCLs) Environmental Monitoring Branch Department of Pesticide Regulation and California Environmental Protection Agency Sacramento CA Available at httpwwwcdprcagovdocsemonpubsehapreps120402mpdf (Verified 15 January 2008)
Troiano J F Spurlock and J Marade 2000 Update of the California vulnerability soil analysis for movement of pesticides to ground water October 14 1999 Environmental Monitoring Branch Department of Pesticide Regulation California Environmental Protection Agency Sacramento CA EH 00-05 Available at httpwwwcdprcagovdocsemonpubsehaprepseh0005pdf (Verified 15 January 2008)
Troiano J D Weaver J Marade F Spurlock M Pepple C Nordmark D Bartkowiak 2001 Summary of Well Water Sampling in California to Detect Pesticide Residues Resulting from Nonpoint-Source Applications J Environmental Quality 30448-459 Available at httpwwwcdprcagovdocsemonpubsehaprefpestrs01pdf (Verified 15 January 2008)
US EPA 2003a Atrazine reregistration eligibility decision Available at httpwwwepagovoppsrrd1reregistrationatrazine (Verified 15 January 2008)
US EPA 2003b Interim Reregistration Eligibility Decision for Atrazine Case No 0062 Available at httpwwwepagovoppsrrd1REDsatrazine_iredpdf (Verified 15 January 2008)
US EPA 2006 2006 Edition of the Drinking Water Standards and Health Advisories Office of Water UE Environmental Protection Agency Washington DC EPA 822-R-06-013 Available at httpwwwepagovwatersciencecriteriadrinkingdwstandardspdf (Verified 15 January 2008)
17
TABLES
Table 1 Summary of the total use of simazine summed from 1993 to 2002 for the top five counties in California the number of PWS wells containing DBCP residues and the number of wells sampled by DPR with residues of simazine or its breakdown products ACET or DACT
County Cumulative Simazine Public Water Wells DPR Sampled Wells Use for 1993-2002 with Reported DBCP with Simazine or
Levels Since 1990 Breakdown Produce Residues Since 1990
---------lbs ai-----shy --------------------------------------------shyTulare 1856705 95 226 Fresno 1398145 252 179 Kern 788285 65 8 San Joaquin 529548 51 32 Madera 517840 8 7
18
Table 2 Analytical results for upper control limit (UCL) upper warning limit (UWL) lower warning limit (LWL) and lower control limit (LCL) and selected blind spiked samples submitted to the laboratory Blind samples were randomly submitted during the study at varied spike levels
Spike Analysis Percent Chemical UCL UWL LWL LCL Level Date Recovery
----------------------------------------shy --μgL-shy -----shyAtrazine 101 937 66 585 015 11102004 987 Simazine 111 101 645 553 020 1182004 1020 Diuron 117 108 692 596 035 1182004 920 Prometon 107 984 628 539 Bromacil 126 117 795 702 025 11102004 864 Hexazinone 112 106 84 785 Norflurazon 111 104 763 693 DEA 112 104 71 629 040 1182004 1090 ACET 120 111 735 642 020 11102004 1070 DACT 130 117 647 516 025 1182004 996 DMN 118 111 847 78 015 1182004 993 Propazine 104 974 694 624 Surrogate
19
Table 3 Results for continuing duplicate spiked samples added with each extraction set Each analyte was spiked at 02 μgL Recovery For
Date Extracted Spike ATR
AZI
NE
SIM
AZI
NE
DIU
RO
N
PRO
MET
ON
BR
OM
AC
IL
HEX
AZI
NO
NE
NO
RFL
UR
AZO
N
DEA
(DEE
THY
L)
AC
ET (D
EISO
)
DA
CT
Des
met
hyl N
orflu
razo
n
Prop
azin
e Su
rrog
ate
1 845 85 79 835 88 100 935 98 875 85 835 79 8272004 2 825 825 85 845 865 985 96 102 845 825 78 795
1 945 925 105 935 97 103 104 103 955 86 945 845 8272004 2 895 905 95 92 975 101 104 102 93 86 101 87
1 99 103 101 102 106 107 101 106 965 895 100 102 992005 2 925 985 96 935 103 101 109 100 99 89 109 96
1 775 785 81 78 835 94 91 85 865 84 81 775 9102005 2 825 795 895 835 87 95 95 85 86 88 93 785
1 102 106 106 100 110 100 110 105 104 975 107 96 10122004 2 955 995 985 955 100 100 103 101 97 98 102 96
1 98 103 98 985 114 103 108 106 113 97 107 995 10122004 2 935 965 965 99 102 945 106 94 96 825 99 935
1 985 975 985 101 110 102 106 101 102 985 103 95 1112004 2 96 102 995 100 107 107 107 101 103 100 109 94
1 915 96 99 915 102 975 107 112 115 91 103 103 1152004 2 955 114 116 105 116 103 114 112 104 98 117 104
1 905 109 101 101 119 105 765 965 110 101 115 101 1182004 2 104 93 90 103 108 105 109 103 106 97 105 95
1 955 96 97 895 99 104 975 98 102 985 106 965 1192004 2 104 102 97 99 108 103 109 111 113 105 110 102
1 925 94 103 905 104 107 105 92 945 905 108 935 11292004 2 895 905 92 875 92 95 935 855 95 865 98 88
1 922 915 975 101 100 665 855 865 785 101 117 93 1222004 2 73 755 101 915 97 106 73 107 115 101 104 67
1 94 955 94 93 955 94 101 955 955 92 109 915 12102004 2 82 905 87 895 95 935 925 93 87 87 935 86
1 88 845 92 835 91 100 96 90 82 845 865 82 12132004 2 985 985 99 101 100 102 108 112 99 95 935 965
1 895 945 97 65 98 955 104 98 105 925 98 885 1182005 2 835 104 935 88 94 100 956 89 915 84 98 885
Average Recovery 917 95 96 928 92 994 100 99 979 923 101 911 Standard Deviation 75 84 74 88 96 75 97 82 99 67 99 89
CV 82 887 775 94 104 756 971 831 101 724 983 976
20
Table 4 Analytical results for sampled PWS wells where ND means nondetected at a reporting limit of 005 μgL
Well Number Sample Date
Chemical Analyte and Concentration (ugL)
Atrazine DEA Simazine ACET DACT Diuron Bromacil
L01 1042004 ND ND ND ND ND ND ND L02 1042004 ND ND ND 023 026 011 008 L03 1042004 ND ND ND ND ND ND ND L04 1042004 01 02 ND 01 01 ND ND L05 1062004 ND ND 005 044 037 017 013 L06 1052004 ND ND ND 016 029 ND 024 L07 1052004 ND ND ND 022 026 ND 006 L08 1052004 ND ND ND 015 015 007 ND L09 1052004 ND ND ND 009 016 ND 005 L10 1052004 ND ND ND ND 008 ND ND L11 1052004 ND ND 012 017 021 01 ND L12 1052004 ND ND ND ND 008 ND ND L13 1122004 ND ND ND 009 013 ND ND L14 1122004 ND ND ND ND ND ND ND L15 1122004 ND ND ND 017 024 ND ND L16 1132004 ND ND ND ND ND ND ND L17 1132004 ND ND ND ND ND ND ND L18 1132004 ND ND ND ND ND ND ND L19 1132004 ND ND ND ND ND ND ND L20 1132004 ND ND ND ND ND ND ND L21 1132004 ND ND ND ND 007 ND ND L22 1132004 ND ND ND ND ND ND ND L23 1132004 ND ND ND ND ND ND ND L24 1132004 ND ND ND ND ND ND ND L25 1132004 ND ND ND ND ND ND ND L26 1142004 ND ND ND ND ND ND ND L27 1142004 ND ND ND ND ND ND ND L28 1142004 ND ND ND ND ND ND ND L29 11162004 ND ND ND ND ND ND ND L30 11162004 ND ND ND ND 006 ND ND L31 11162004 ND ND ND ND ND ND ND L32 11162004 ND ND ND ND ND ND ND L33 11172004 ND ND ND ND ND ND ND L34 11172004 ND ND ND 005 ND 009 ND L35 11172004 ND ND ND ND ND ND ND L36 11172004 ND ND ND ND ND ND ND L37 11172004 ND ND ND ND ND ND ND L38 11182004 ND ND ND ND ND ND 01 L39 11182004 ND ND ND ND ND 006 ND L40 11182004 ND ND ND ND ND ND ND L41 1272004 ND ND ND ND ND ND ND L42 1272004 ND ND ND ND ND ND ND L43 1272004 ND ND ND ND ND ND ND L44 1272004 ND ND ND ND ND ND ND L45 1282004 ND ND ND ND ND ND ND L46 1282004 ND ND ND ND ND ND ND L47 1282004 ND ND ND ND ND ND ND L48 1282004 ND ND ND ND ND ND ND L49 1282004 ND ND ND ND ND ND ND
21
Table 5 Data used for the statistical analyses relating explanatory variables to detections of simazine ACET andor DACT in a PWS well
Well Concentration Depth of Cumulative Amount Highest DBCP Identifier Simazine ACET DACT PWS well DGW of Simazine Applied Concentration
-------------------μgL-------------------shy ------------feet------------- ----lbs---- ----μgL----L01 000 000 000 379 31 5947 008 L02 000 023 026 216 31 6177 330 L03 000 000 000 192 33 8388 063 L04 000 010 010 198 31 8232 040 L05 005 044 037 425 49 18843 050 L06 000 016 029 300 49 18843 042 L07 000 022 026 296 42 21099 021 L08 000 015 015 300 37 10153 012 L09 000 009 016 234 62 41741 015 L10 000 000 008 537 62 41741 025 L11 012 017 021 273 58 24689 004 L12 000 000 008 276 62 41741 011 L13 000 009 013 250 60 1865 250 L14 000 000 000 700 59 4224 087 L15 000 017 024 260 61 5414 013 L16 000 000 000 270 62 8665 100 L17 000 000 000 700 54 7731 004 L18 000 000 000 374 41 8395 022 L19 000 000 000 616 54 7731 Not Available L20 000 000 000 500 54 7731 025 L21 000 000 007 400 50 5375 084 L22 000 000 000 392 48 11165 100 L23 000 000 000 615 24 16588 003 L24 000 000 000 560 39 9131 000 L25 000 000 000 502 35 8131 029 L26 000 000 000 500 43 21328 019 L27 000 000 000 540 43 21328 021 L28 000 000 000 400 43 15266 003 L29 000 000 000 390 37 5954 067 L30 000 000 006 640 39 5633 109 L31 000 000 000 651 40 3951 004 L32 000 000 000 572 40 3951 016 L33 000 000 000 715 61 2072 005 L34 000 005 000 430 58 1409 002 L35 000 000 000 200 76 961 040 L36 000 000 000 265 79 717 022 L37 000 000 000 345 90 5037 000 L38 000 000 000 720 111 30887 008 L39 000 000 000 735 81 3600 210 L40 000 000 000 240 81 3600 003 L41 000 000 000 582 31 10833 007 L42 000 000 000 299 30 6533 087 L43 000 000 000 560 30 6533 003 L44 000 000 000 300 30 4484 006 L45 000 000 000 552 46 34252 016 L46 000 000 000 1000 275 11303 060 L47 000 000 000 1000 66 676 008 L48 000 000 000 200 111 21482 006 L49 000 000 000 120 111 21482 Not Available
22
Table 6 Logistic regression analysis using the score option to test the relationship between frequency of detection in wells and explanatory variables For explanatory variables Pwsdepth is the borehole depth of the PWS well simapp is the cumulative lbs of simazine applied in the sampled section and eight surrounding sections dbcphigh is the highest DBCP concentration reported in the PWS well and gwdepth is the sectional averaged depth to ground water The top four scores for the 2-variable and 3-variable models are shown
Regression Models Selected by Score Criterion
Number of Score Variables Chi-Square Variables Included in Model
1 66879 pwsdepth
1 43221 simapp
1 27627 dbcphigh
1 07226 gwdepth
2 101943 pwsdepth simapp
2 92438 dbcphigh simapp
2 85531 pwsdepth dbcphigh
2 66909 pwsdepth gwdepth
3 137769 pwsdepth dbcphigh simapp
3 103148 gwdepth dbcphigh simapp
3 102158 pwsdepth gwdepth simapp
3 85531 pwsdepth gwdepth dbcphigh
4 138565 pwsdepth gwdepth dbcphigh simapp
23
Table 7 Logistic model solution for the best 1 through 4 variable models as indicated in Table 6
Analysis of Maximum Likelihood Estimates Standard WaldChi-
Parameter DF Estimate Error Square PrgtChiSq Best 1-variable model Intercept 1 11667 08527 18723 01712 pwsdepth 1 -000491 000212 53589 00206
Best 2-variable model Intercept 1 05059 09501 02836 05944 pwsdepth 1 -000516 000229 50699 00243 simapp 1 0000058 0000032 32996 00693
Best 3-variable model Intercept 1 -00974 11266 00075 09311 pwsdepth 1 -000594 00026 52261 00223 dbcphigh 1 13028 07717 28501 00914 simapp 1 0000089 0000038 54255 00198
Full 4-variable model Intercept 1 09479 16538 03286 05665 pwsdepth 1 -000624 000285 48119 00283 dbcphigh 1 13399 08183 26814 01015 simapp 1 0000096 000004 57509 00165 gwdepth 1 -00202 00206 09607 0327
24
Table 8 Association of predicted probabilities and observed responses and model fit statistics presented for the best models containing 1 through 4 variables in Table 6 AIC is the Akaike Information Criterion SC is the Schwarz Criterion and ndash2 Log L is the ndash2 Log Likelihood criterion Higher concordant values indicate better agreement between model predicted and observed values
Number of Classification Results Model Fit Statistics Variables in Percent Percent Percent
Modela Concordant Discordant Ties AIC SC -2 Log L
1 710 284 06 57328 61112 53328 2 790 208 02 55714 61389 49714 3 833 163 04 50325 57725 42325 4 833 167 00 51246 60497 41246
a From Table 6 specific variables in each model are 1-pwsdepth 2-pwsdepth simapp 3-pwsdepth simapp dbcphigh 4-pwsdepth simapp dbcphigh gwdepth
25
FIGURES
Figure 1 Breakdown products for atrazine and simazine
NN
N
Cl
N H
N H
C2H5 C2H5
Simazine
NN
N
Cl
N H
N H
C2H5 H
Deethyl simazine ndash DES or
Deisopropyl atrazine - DIPA or
ACET
H
NN
N
Cl
N H
N H
H
Diamino chlorotriazine - DACT
NN
N
Cl
N H
N H
C2H5 i - C3H7
Atrazine
H
NN
N
Cl
N H
N H
C3H7
Deethyl atrazine - DEA
NN
N
Cl
NH
NH
C2H5 C2H5
NN
N
Cl
NH
NH
C2H5 C2H5
Simazine
NN
N
Cl
NH
NH
C2H5 H
NN
N
Cl
NH
NH
C2H5 H
Deethyl simazine ndash DESor
Deisopropyl atrazine - DIPAor
ACET
H
NN
N
Cl
NH
NH
H
NN
N
Cl
NH
NH
H
Diamino chlorotriazine - DACT
NN
N
Cl
NH
NH
C2H5 i - C3H7
NN
N
Cl
NH
NH
C2H5 i - C3H7
Atrazine
H
NN
N
Cl
NH
NH
C3H7
Deethyl atrazine - DEA
26
Figure 2 Spatial relationship between areas of simazine use (colored squares) and previous DBCP detections in PWS wells (circles) in the Fresno Tulare and Kern county areas
27
Figure 3 Spatial relationship between results of PWS wells sampled in this study (triangles) to simazine use (colored squares) and to wells with previous reported detections of simazine and or breakdown products (circles)
28
Figure 4 Relationship of ACET and DACT concentrations measured in wells where graph A is the relationship of the raw data and graph B is DACT concentration expressed in equivalent ACET units
000
010
020
030
040
050
00 01 02 03 04 05
DA
CT
Con
cent
ratio
n (μ
gL
)
ACET Concentration (μgL)
11 Line
000
010
020
030
040
050
00 01 02 03 04 05
DA
CT
Con
cent
ratio
n (μ
gL
)
ACET Concentration (μgL)
11 Line
A
B
000
010
020
030
040
050
00 01 02 03 04 05
DA
CT
Con
cent
ratio
n as
AC
ET
Equ
ival
ent W
eigh
t (μg
L)
ACET Concentration (μgL)
11 Line
29
Figure 5 Scatter plot of the relationship between total simazine concentration in a well and the A) average sectional depth to ground water B) reported depth of the PWS well C) cumulative simazine use in the sampled section and eight surrounding sections and D) maximum DBCP concentration reported in PWS well
AA100100
080080
060060
040040
020020
000000
Tot
al S
imaz
ine
Res
idue
s (μg
L)
Tot
al S
imaz
ine
Res
idue
s (μg
L)
CC100100
080080
060060
040040
020020
000000
0 50 100 150 0 10000 20000 30000 40000 500000 50 100 150 0 10000 20000 30000 40000 50000Average Sectional Depth to Ground Water (feet) Cumulative Simazine Use (lbs)Average Sectional Depth to Ground Water (feet) Cumulative Simazine Use (lbs)
BB100100
080080
060060
040040
020020
000000
DD100100
080080
060060
040040
020020
0000000 300 600 900 1200 00 05 10 15 20 25 300 300 600 900 1200 00 05 10 15 20 25 30
PWS Well Depth (ft) Maximum DBCP Concentration (μgL)PWS Well Depth (ft) Maximum DBCP Concentration (μgL)
30
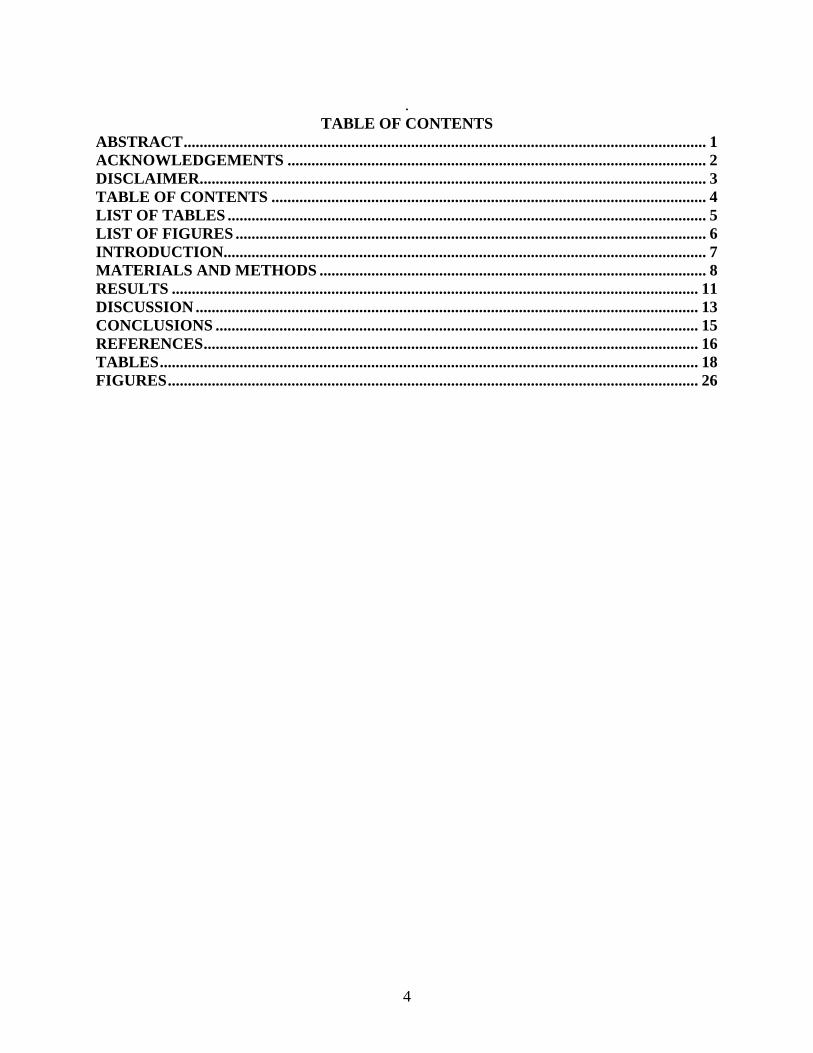
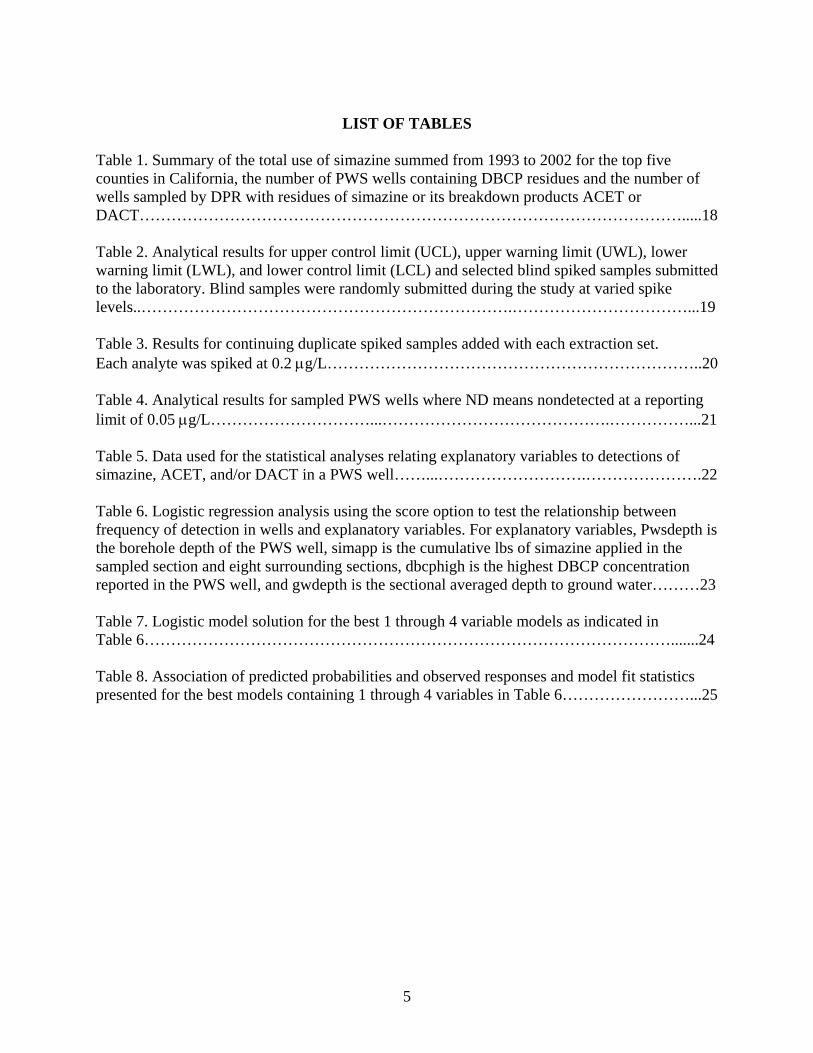
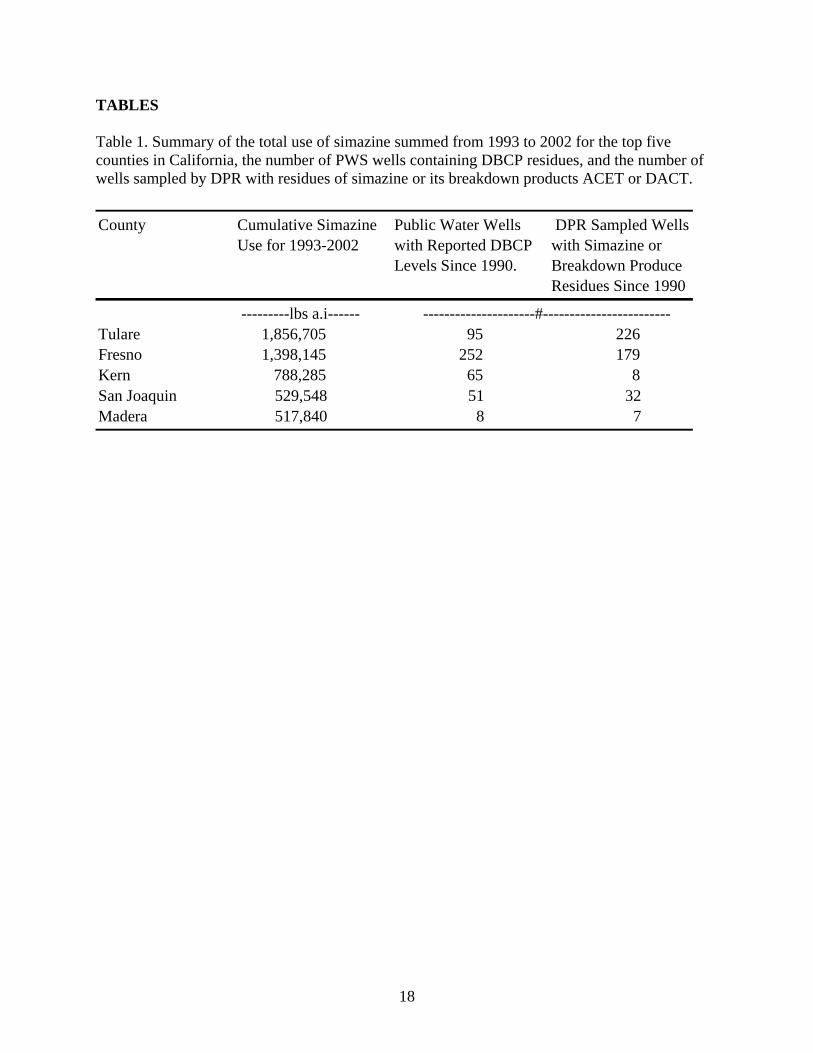
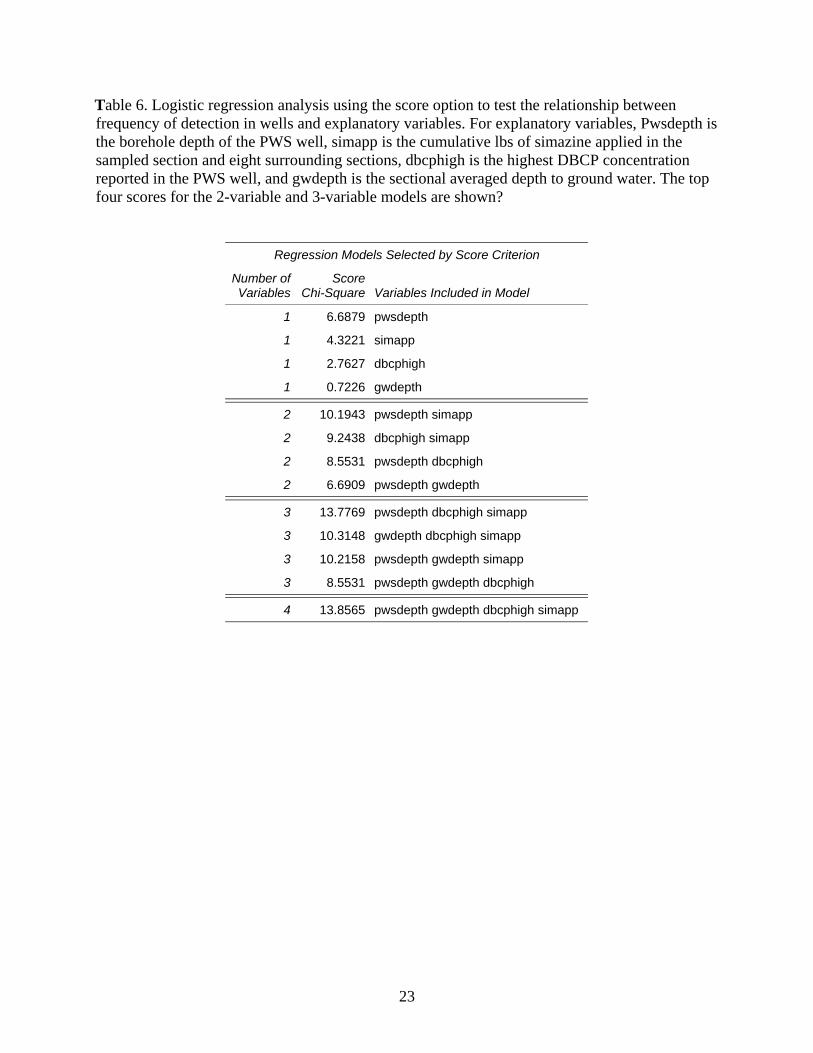
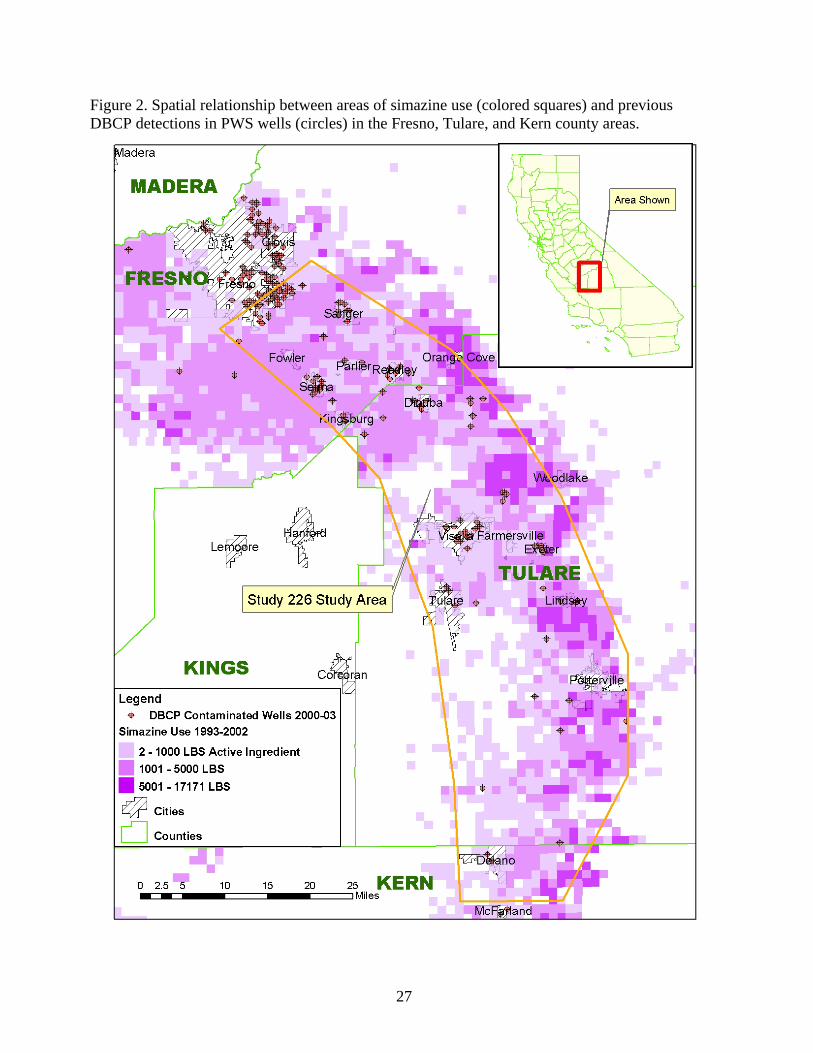
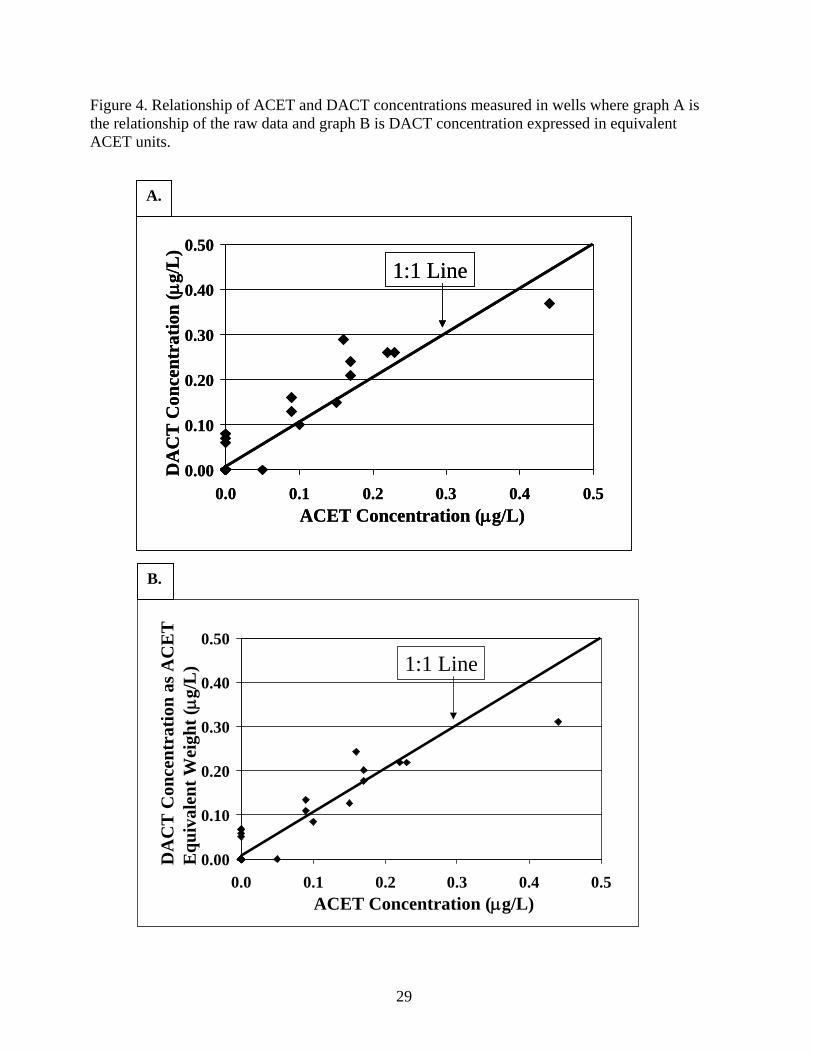