Detection of Architectural Distortion in Mammogram - JOIG · Detection of Architectural Distortion...
5
Detection of Architectural Distortion in Mammogram Rekha Lakshmanan and Shiji T. P Govt. Model Engineering College, Kochi, India Email: {rekha, shiji}@mec.ac.in Vinu Thomas Govt. College of Engineering Email: [email protected] Suma Mariam Jacob and TharaPratab Lakeshore Hospital, Kochi, India Email: [email protected], [email protected] Abstract—Amethod for the detection of the most commonly missed breast cancer anomaly, Architectural distortion, is proposed here. The distorted abnormal structures associated with Architectural distortion in suspicious regions are extracted using geometrical properties of edge features based on an energy model. Contours obtained from a modified Single Univalue Segment Assimilating Nucleus filtered mammogram, are employed for this purpose. A Pectoral muscle delineation technique is incorporated in the proposed method to reduce false positive rate.A ranking value of these potential regions based on linear and converging properties is computed to identify the probable origins of architectural distortion. Experimental analysis is performed on 100 images obtained from Lakeshore Hospital, India. The results are verified by expert radiologists. The proposed algorithm is successful in 94 mammograms and the results are found to be promising. Index Terms—mammograms, modified SUSAN filter, Energy model, shortest centroid distance, ranking metric, Architectural distortion I. INTRODUCTION About 25-31% of cancer occurrences in India are that of breast cancer [1], where it becomes one of the leading causes of fatality among women. Even though the incidence of breast cancer in India is lesser compared to developed countries like U.S and China, mortality is very high. According to the statistics in 2013 of World Health Organization (WHO), 70,218 women inIndia died due to breast cancer [2]. As per the statistics by WHO, one among two Indian women who are newly diagnosed with breast cancer has lost her life due to the cause. Architectural distortionis a major symptom of breast cancer. It is the considered as the most commonly missed abnormality during screening [3]. Around 12-45% of the cases of breast cancers missed in screening are found to have had Architectural distortion in the mammograms [3]. Manuscript received July 10, 2014; revised November 21, 2014. 48-60% of Architectural distortion cases biopsied are found to be cancerous and 80% of them are invasive in nature [4]. Architectural distortion is detected by identifying the distorted architecture of breast structure [3]. Distortion of architecture includes either radiating patterns with no mass visible or distortion at the edge of parenchyma [5]. The presence of normal breast parenchyma, dense tissues, and the subtle nature of abnormal structures obstruct the visibility of malignant structures. Usually architectural distortion is associated with other abnormalities such as calcifications or mass [6]. Computer aided methods (CAD) are very effective supporting tools for radiologists to analyze mammograms [7]. CAD detection of Architectural Distortion is a challenging research area due to the difficulty in identifying the presence of abnormal structure [8]. Most of the literature on detection of architectural distortion concentrates on the breast tissue pattern of mammograms [9]-[13]. Concentration index and morphological image processing were applied by Matsubara et al. [9] to obtain a sensitivity of 84%. Sampat et al. [10] applied Radon transform and a linear filter to yield a sensitivity of 80%. Etonsy et al. [11] detected architectural distortion by identifying points along concentric layers achieving a sensitivity of 93.1%. Guo et al. [12] achieved a classification accuracy of 72.5 % for architectural distortion using Hausdorff distance and Support Vector Machine. Rangayyan et al. [13] proposed a method for measuring the divergence of oriented patterns from normal patterns attaining 80% sensitivity. S. Banik succeeded in detecting the probable architectural distortion sites using a bank of Gabor filters, linear phase portrait modeling and different types of entropies [14]. The method proposed here narrows down the Region of Interests (ROIs) in the mammogram image using a modified version of SUSAN filtering [15]. Geometrical properties of extracted edge features from these ROIs are 123 ©2014 Engineering and Technology Publishing doi: 10.12720/joig.2.2.123-127 Journal of Image and Graphics, Volume 2, No.2, December 2014
Transcript of Detection of Architectural Distortion in Mammogram - JOIG · Detection of Architectural Distortion...

Detection of Architectural Distortion in
Mammogram
Rekha Lakshmanan and Shiji T. P Govt. Model Engineering College, Kochi, India
Email: {rekha, shiji}@mec.ac.in
Vinu Thomas Govt. College of Engineering
Email: [email protected]
Suma Mariam Jacob and TharaPratab Lakeshore Hospital, Kochi, India
Email: [email protected], [email protected]
Abstract—Amethod for the detection of the most commonly
missed breast cancer anomaly, Architectural distortion, is
proposed here. The distorted abnormal structures
associated with Architectural distortion in suspicious
regions are extracted using geometrical properties of edge
features based on an energy model. Contours obtained from
a modified Single Univalue Segment Assimilating Nucleus
filtered mammogram, are employed for this purpose. A
Pectoral muscle delineation technique is incorporated in the
proposed method to reduce false positive rate.A ranking
value of these potential regions based on linear and
converging properties is computed to identify the probable
origins of architectural distortion. Experimental analysis is
performed on 100 images obtained from Lakeshore Hospital,
India. The results are verified by expert radiologists. The
proposed algorithm is successful in 94 mammograms and
the results are found to be promising.
Index Terms—mammograms, modified SUSAN filter,
Energy model, shortest centroid distance, ranking metric,
Architectural distortion
I. INTRODUCTION
About 25-31% of cancer occurrences in India are that
of breast cancer [1], where it becomes one of the leading
causes of fatality among women. Even though the
incidence of breast cancer in India is lesser compared to
developed countries like U.S and China, mortality is very
high. According to the statistics in 2013 of World Health
Organization (WHO), 70,218 women inIndia died due to
breast cancer [2]. As per the statistics by WHO, one
among two Indian women who are newly diagnosed with
breast cancer has lost her life due to the cause.
Architectural distortionis a major symptom of breast
cancer. It is the considered as the most commonly missed
abnormality during screening [3]. Around 12-45% of the
cases of breast cancers missed in screening are found to
have had Architectural distortion in the mammograms [3].
Manuscript received July 10, 2014; revised November 21, 2014.
48-60% of Architectural distortion cases biopsied are
found to be cancerous and 80% of them are invasive in
nature [4].
Architectural distortion is detected by identifying the
distorted architecture of breast structure [3]. Distortion of
architecture includes either radiating patterns with no
mass visible or distortion at the edge of parenchyma [5].
The presence of normal breast parenchyma, dense tissues,
and the subtle nature of abnormal structures obstruct the
visibility of malignant structures. Usually architectural
distortion is associated with other abnormalities such as
calcifications or mass [6]. Computer aided methods
(CAD) are very effective supporting tools for radiologists
to analyze mammograms [7]. CAD detection of
Architectural Distortion is a challenging research area
due to the difficulty in identifying the presence of
abnormal structure [8].
Most of the literature on detection of architectural
distortion concentrates on the breast tissue pattern of
mammograms [9]-[13]. Concentration index and
morphological image processing were applied by
Matsubara et al. [9] to obtain a sensitivity of 84%.
Sampat et al. [10] applied Radon transform and a linear
filter to yield a sensitivity of 80%. Etonsy et al. [11]
detected architectural distortion by identifying points
along concentric layers achieving a sensitivity of 93.1%.
Guo et al. [12] achieved a classification accuracy of
72.5 % for architectural distortion using Hausdorff
distance and Support Vector Machine. Rangayyan et al.
[13] proposed a method for measuring the divergence of
oriented patterns from normal patterns attaining 80%
sensitivity. S. Banik succeeded in detecting the probable
architectural distortion sites using a bank of Gabor filters,
linear phase portrait modeling and different types of
entropies [14].
The method proposed here narrows down the Region
of Interests (ROIs) in the mammogram image using a
modified version of SUSAN filtering [15]. Geometrical
properties of extracted edge features from these ROIs are
123©2014 Engineering and Technology Publishingdoi: 10.12720/joig.2.2.123-127
Journal of Image and Graphics, Volume 2, No.2, December 2014
employed for detecting origin of architectural distortion.
The centroids of such identified regions with more
numberof linear converging tissue structures indicate the
origin of promising location for Architectural distortion.
The proposed method also reduces false positivesby
removing the pectoral muscle (PM) region.
II. PROPOSED METHOD
The two major properties of patterns in the abnormal
regions utilized by the proposed method for Architectural
distortion are listed below.
Abnormal patterns are linear in nature [16].
Distorted patterns concentrate towards the
distorted area whereas normal patterns concentrate
towards the nipple [6].
A preprocessing operation is performed to extract the
region of interest by removing unwanted artifacts such as
noise, labels and wedges as well as PM region. The
potential sites of architectural distortion are identified
using contours of the resultant image obtained after
filtering with a modified Single Univalue Segment
Assimilating Nucleus (SUSAN) filter. Edge features of
these regions are further geometrically analyzed to
remove normal tissue patterns.
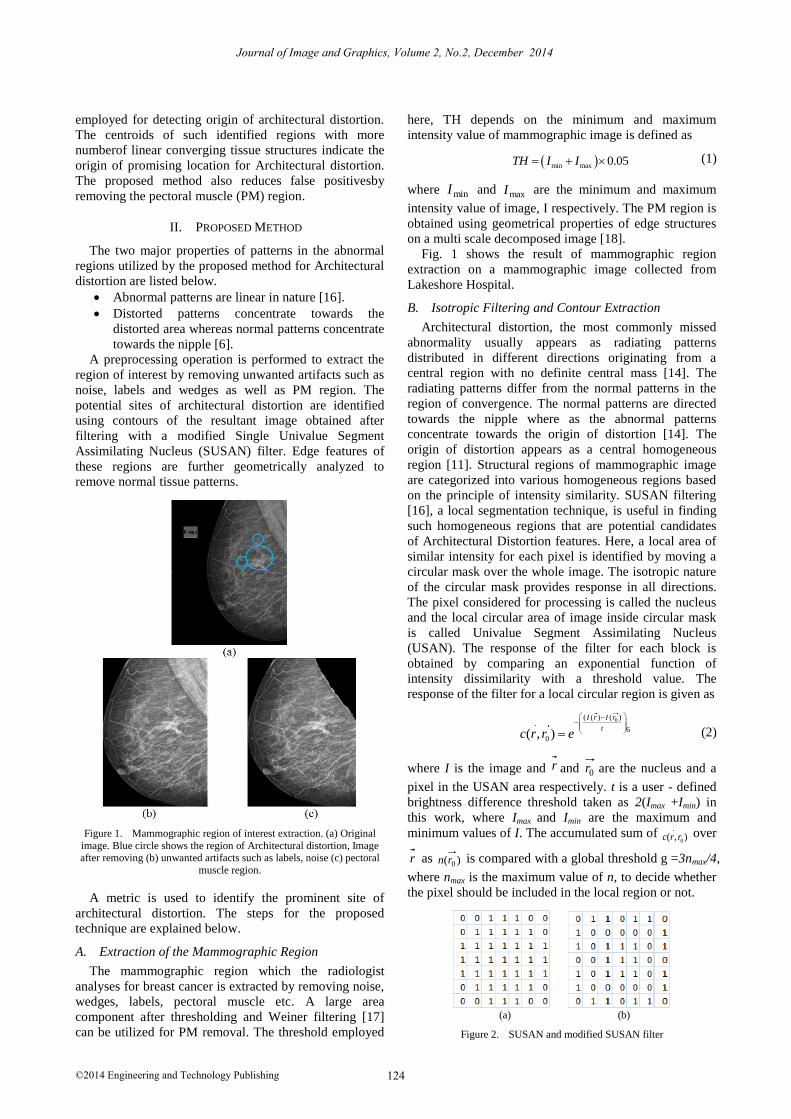
Figure 1. Mammographic region of interest extraction. (a) Original
image. Blue circle shows the region of Architectural distortion, Image after removing (b) unwanted artifacts such as labels, noise (c) pectoral
muscle region.
A metric is used to identify the prominent site of
architectural distortion. The steps for the proposed
technique are explained below.
A. Extraction of the Mammographic Region
The mammographic region which the radiologist
analyses for breast cancer is extracted by removing noise,
wedges, labels, pectoral muscle etc. A large area
component after thresholding and Weiner filtering [17]
can be utilized for PM removal. The threshold employed
here, TH depends on the minimum and maximum
intensity value of mammographic image is defined as
min max 0.05TH I I (1)
where minI and maxI are the minimum and maximum
intensity value of image, I respectively. The PM region is
obtained using geometrical properties of edge structures
on a multi scale decomposed image [18].
Fig. 1 shows the result of mammographic region
extraction on a mammographic image collected from
Lakeshore Hospital.
B. Isotropic Filtering and Contour Extraction
Architectural distortion, the most commonly missed
abnormality usually appears as radiating patterns
distributed in different directions originating from a
central region with no definite central mass [14]. The
radiating patterns differ from the normal patterns in the
region of convergence. The normal patterns are directed
towards the nipple where as the abnormal patterns
concentrate towards the origin of distortion [14]. The
origin of distortion appears as a central homogeneous
region [11]. Structural regions of mammographic image
are categorized into various homogeneous regions based
on the principle of intensity similarity. SUSAN filtering
[16], a local segmentation technique, is useful in finding
such homogeneous regions that are potential candidates
of Architectural Distortion features. Here, a local area of
similar intensity for each pixel is identified by moving a
circular mask over the whole image. The isotropic nature
of the circular mask provides response in all directions.
The pixel considered for processing is called the nucleus
and the local circular area of image inside circular mask
is called Univalue Segment Assimilating Nucleus
(USAN). The response of the filter for each block is
obtained by comparing an exponential function of
intensity dissimilarity with a threshold value. The
response of the filter for a local circular region is given as
0( ( ) ( )
6
0( , )
I r I r
tc r r e
(2)
where I is the image and r and 0r are the nucleus and a
pixel in the USAN area respectively. t is a user - defined
brightness difference threshold taken as 2(Imax +Imin) in
this work, where Imax and Imin are the maximum and
minimum values of I. The accumulated sum of 0( , )c r r
over
r as )( 0rn is compared with a global threshold g =3nmax/4,
where nmax is the maximum value of n, to decide whether
the pixel should be included in the local region or not.
(a) (b)
Figure 2. SUSAN and modified SUSAN filter
124©2014 Engineering and Technology Publishing
Journal of Image and Graphics, Volume 2, No.2, December 2014

In the proposed method, SUSAN filter is modified to
identify the central homogeneous regions along with
surrounding radiating patterns. Fig. 2 shows the SUSAN
filter and the modified SUSAN filter. The modified
SUSAN filter reduces the search area in the
mammographic image compared to SUSAN filter. It is
also able to search for radiating structures emanating
from a central homogeneous region, without missing any
of such central regions.
Contours of the reduced regions are identified. Fig. 3(c)
and 3(d) indicate the contour plots obtained from the
SUSAN filter output as shown in Fig. 3(a) and the
modified SUSAN filter output in Fig. 3(b). On
comparison, it is seen that the identified contours are far
less in number for that of the modified SUSAN filter.
This is true for all the images on which the algorithm has
been tried on. The regions identified using the modified
SUSAN filter does not miss out on the Architectural
Distortion features, as verified by the radiologist.
Centroids [19] of these contours represent the origin of
the potential site of architectural distortion. Centroids and
areas of closed polygons corresponding to each contour
are calculated using the contour coordinates as per
equations (3) – (5).
(a) (b)
(c) (d) (e)
Figure 3. Mammographic image after (a)SUSAN filtering (b) modified SUSAN filtering, contour extraction using (c)SUSAN filtering and (d) modified SUSAN filtering technique.Blue circle shows the boundary of
ground truth information
(a) (b) (c )
Figure 4. (a)Mammographic regions around detected centroids, (b) Edge features, (c) thinned edge features
The central originating point of architectural
distortionis found to be close to one of these centroids.
1
1 110
1
6
N
x i i i ii iiA
y yC x x x x
(3)
1
11 10
1
6
N
y i ii i i iiA
y y y yC x x
(4)
1
110
1
2
N
i ii ii
A y yx x
(5)
here xi and yiare the coordinates of the contour with i
ranging from 0 to N-1, N being the number of vertices in
the contour. Cx and Cyare the coordinates of contour
centroid and A is the contour area. Fig. 3(e) shows the
centroids as blue spots on contours of modified SUSAN
filtered mammographic image.
The further steps of the algorithm work on the
centroids identified at this stage.
C. Region of Interest Extraction
A mammographic region of size 200×200 around each
centroid is chosen for further processing. Fig. 4(a) shows
the selected mammographic regions around centroids
overlapped on modified SUSAN filtered image.
D. Edge Feature Extraction
Mammographic image consisting of various structures
can be identified using an energy based edge feature
extraction technique which in turn is based on an energy
model. According to this model, features can be extracted
from points where the frequency components are
maximally in phase [20]. The one dimensional phase
congruency is computed as
( )cos( ( ) ( ))| ( ) |
( )( ) ( )
n n
n
n n
n n
A x x xE x
PC xA x A x
(6)
where )(xAn is the length, )(xn is the phase angle of
each of n individual vectors of Fourier components at
location x, )(xE is the length(energy) and )(x is the
phase angle of the summed vectors. A group of log-
Gabor Wavelets at N different scales and M orientations
are used to extend the equation (6) in two dimensions to
compute phase congruency. The advantage of Log Gabor
transform for radial filtering is that it is Gaussian on a
logarithmic scale and hence has better high frequency
characteristics than the conventional Gabor transform
[20]. Such edge features obtained from the reduced
suspicious regions are thinned, based on the principle of
gradient magnitude maximization [21]. Fig. 4(b)
represents edge features of mammographic images using
the principle of phase congruency. Strong edge features
obtained using thinning method is shown in Fig. 4(c).
E.
Implementation of Geometrical Properties
In a mammogram, architectural distortion usually
appears as radiating patterns originating from a central
region
whereas the normal tissue structures directed
towards the nipple point. Fig.
5
shows the normal and
125©2014 Engineering and Technology Publishing
Journal of Image and Graphics, Volume 2, No.2, December 2014

abnormal patterns of tissue structure obtained from a
mammogram after filtering operation. The normal tissue
patterns of ducts, blood vessels, ligaments etc in the
affected region may affect the identification of abnormal
tissues associated with architectural distortion. The linear
and converging properties of abnormal patterns are
employed for removing the normal patterns in the
selected regions after contour extraction.
(a) (b)
Figure 5. Tissue structure pattern (a) normal region (b) abnormal region.
(a) (b) (c)
Figure 6. (a) Tissue structures after thinning (b) structures satisfying linearity property(c) structures satisfying converging property in one of
selected abnormal region.
(a) (b) (c)
Figure 7. (a) Tissue structures after thinning (b) structures satisfying
linearity property (c) structures satisfying converging property in one of selected normal region.
The linear radiating tissue structures in the processed
mammographic image are identified by applying the
eccentricity property [18]. In order to find the tissue
structures converging towards the origin of distorted
region, only linear tissue structures passing near to the
centroid of selected region are considered. Each linear
structure is extended to the boundary of selected region
for finding its proximity towards the centroid. A linear
structure satisfying a threshold criterion is retained and
the others are rejected. The results of thinned breast tissue
structuresafter applying the geometrical properties for a
normal and abnormal breast region are shown in Fig. 6
and Fig. 7 respectively. The total number of linear
converging structures as well as a normalized value is the
major factors for selecting a region as abnormal. The
normalized value in a selected region is obtained as the
ratio between number of linear converging lines and
number of linear lines in that region. On analysis, it is
seen that a region with a minimum 35 number of linear
converging lines and the ratio as 25 or above can be
considered as malignant region The proposed algorithm
was simulated on 100 mammographic images from
Lakeshore Hospital and the results obtained were verified
with clinical findings of the radiologists.
Figure 8.
Ranking values based on total number of linear lines
satisfying converging property along with its ratio with linear line. Blue
circle shows ground truth of information provided by radiologist.
Fig. 8 shows the result of ranking values in one of the
mammographic image collected from Lakeshore Hospital.
The ground truth is shown using blue circular plot and the
centroids obtained by the proposed method are shown as
red spots.
III. CONCLUSION
The proposed method is a promising technique for
detecting the most commonly missed abnormality,
Architectural distortion. The results obtained for this
method, utilizing the linearity and converging property of
abnormal patterns towards the distorted area is
encouraging. The proposed method successfully
identified 94 images out into 100 as normal and abnormal
classes and was verified with expert radiologists in
Lakeshore Hospital, Kochi, India. A classification
method with more features can be utilized as a future
work for analyzing the probable regions of Architectural
Distortion to increase the accuracy of the proposed
method.
ACKNOWLEDGMENT
The authors wish to thank the Lakeshore Hospital,
Kochi, India authorities for their support. This work was
supported by State Council for Science, Technology and
Environment (KSCSTE) and Technical Education
Quality Improvement Programme (TEQIP-II) of the
Ministry of Human Resources Development, Govt. of
India.
REFERENCES
[1]
Three Year Report of Population Based Cancer Registries 2009-
2011, National Cancer Registry Programme. Banglore, India: NCDIR, Indian Council of Medical Resaerch
(ICMR), 2013.
126©2014 Engineering and Technology Publishing
Journal of Image and Graphics, Volume 2, No.2, December 2014

[2] International Agency for Research on Cancer Fact sheet. [Online]. Available: http://www.globocan.iarc.fr/factsheet.asp
[3] A. M. Knutzen and J. J. Gisvold, “Likelihood of malignant disease
for various categories of mammographically detected, nonpalpable breast lesions,” in Proc. Mayo Clinic, no. 68, 1993, pp. 454-460.
[4] J. A. Johnston and C. Z. Clee, “Analysis of 308 localisation breast biopsies in a New Zealand hospital,” Australas Radio l., vol. 2, no.
35, pp. 148-51, May 1991.
[5] J. Tang, R. M. Rangayyan, J. Xu, I. E. Naqa, and Y. Yang, “Computeraided detection and diagnosis of breast cancer with
mammography: Recent advances,” IEEE Trans. Inf. Technol. Biomed, vol. 13, no. 2, pp. 236-251, 2009.
[6] M. P. Sampat, G. J. Whitman, M. K. Markey, and A. C. Bovik,
“Evidence-based detection of spiculated masses and architectural distortions,” in Proc. SPIE Medical Imaging: Image Processing,
San Diego, vol. 5747, 2005, pp. 26-37. [7] T. Matsubara, T. Ichikawa, T. Hara, H. Fujita, S. Kasai, T. Endo,
and T. Iwase, “Novel method for detecting mammographic
architectural distortion based on concentration of mammary gland,” in Proc. 18th International Congress and Exhibition on
Computer Assisted Radiology and Surgery, International Congress Series, Elsevier B.V., vol. 1268, 2004, pp. 867-871.
[8] J. A. Baker, E. L. Rosen, J. Y. Lo, E. I. Gimenez, R. Walsh, and M.
S. Soo, “Computer-Aided Detection (CAD) in screening mammography: Sensitivity of commercial CAD systems for
detecting architectural distortion,” Am J Roentgenol, vol. 181, pp. 1083-1088, 2003.
[9] T. Matsubara, T. Ichikawa, T. Hara, H. Fujita, S. Kasai, T. Endo,
and T. Iwase, “Automated detection methods for architectural distortions around skinline and within mammary gland on
mammograms,” CARS, pp. 950-955, 2003. [10] M. P. Sampat, G. J. Whitman, M. K. Markey, and A. C. Bovik,
“Evidence based detection of spiculated masses and architectural
distortion,” in Proc. SPIE Medical Imaging: Image Processing, San Diego, CA, vol. 5747, April 2005, pp. 26-37.
[11] N. Eltonsy, G. Tourassi, and A. Elmaghraby, “Investigating performance of a morphology based CAD scheme in detecting
architectural distortion in screening mammograms,” in Proc. 20th
International Congress and Exhibition on Computer Assisted Radiology and Surgery, 2006.
[12] Q. Guo, J. Shao, and V. Ruiz, “Investigation of support vector machine for the detection of architectural distortion in
mammographic images,” Journal of Physics: Conference Series,
vol. 15, pp. 88-94, 2005. [13] R. M. Rangayyan, S. Banik, J. Chakraborty, S. Mukhopadhyay,
and J. E. L. Desautels, “Measures of divergence of oriented patterns for the detection of architectural distortion in prior
mammograms,” Int J CARS, vol. 8, pp. 527-545, 2013.
[14] S. Banik, R. M. Rangayyan, and J. E. Leo Desautels, “Measures of angular spread and entropy for the detection of architectural
distortion in prior mammograms,” International Journal of Computer Assisted Radiology and Surgery, vol. 8, pp. 121-134,
2013.
[15] Smith and J. Brady, “SUSAN-a new approach to low level image processing,” IJCV, 1997.
[16] B. Hashimoto, Practical Digital Mammography, Thieme, 2011. [17] P. Mayo, F. Rodenas, and G. Verdu, “Comparing methods to
denoise mammographic images,” in Proc. 26th Annual
International Conference of the IEEE Engineering in Medicine and Biology Society, vol. 1, Sept. 2004, pp. 247-250.
[18] R. Lakshmanan, T. P. Shiji, V. Thomas, S. M. Jacob, and T. Pratab, “Pectoral muscle boundary detection–A preprocessing
method for early breast cancer detection,” accepted in IFMIP,
World Automation Congress, August 3-7, 2014. [19] P. Bourke, “Calculating the area and centoid of polygon,” July
1998. [20] P. Kovesi, “Image features from phase congruency,” Videre:
Journal of Computer Vision Research, vol. 1, 1999.
[21] J. Canny, “A computational approach to edge detection,” IEEE Trans. on Pattern Analysis and Machine Intelligence, vol. 8, pp.
679-698, 1986.
Rekha Lakshmanan is pursuing her PhD at
Govt. Model Engineering College, Kochi, India.
She received her M.Tech in “Digit Image Computing” from Kerala University in 2008
and B.Tech in Computer Science and Engineering from CUSAT in 2001.
Her area of
interest is image processing. She has 16
publications to her credit in international conferences and journals.
Suma MariamJacob received her MBBS and
DMRD from Christian Medical College, Vellore in 1993 and 2001 respectively. She
received her DNB in 2008 and is currently working as Consultant Radiologist, Lakeshore
Hospital, Kerala, India. She was awarded as the
Best radiology student by CMC Vellore for the year 2001. She secured Best paper prize for
RADIOLOGY among post graduate students conducted by Kerala IRIA chapter in 2007.
Thara Pratab is a Senior Radiologist with 14
years of experience. She completed her MBBS, MD, DMRD and DNB from Trivandrum
Medical College in the year 1994, 1999, 2000
and 2001 respectively. She did her MD with specialization in radiology. She was working at
the Lissie Hospital, Kochi, India during 2000-2003. She is currently affiliated to the
Lakeshore Hospital, Kochi, India.
127©2014 Engineering and Technology Publishing
Journal of Image and Graphics, Volume 2, No.2, December 2014
Shiji T. P is working as Associate Professor at
the Govt. Model Engineering College, Kochi, India. She is doing her research in Medical
Image Processing. She received her B.Tech degree in Electronics & Instrumentation from
College of Engineering in 1994,
Thiruvananthapuram and M.Tech in Optoelectronics & Laser Technology from
International School of Photonics, CUSAT in 2004. She has more than 19 years of teaching
experience. Her Research interests include Medical Signal and Image
Processing.
Vinu Thomas received his B.Tech in
Electronics & Communication from Mar
Athanasius College of Engineering Kothamangalam in 1993 and M.Tech and PhD
Degrees in Electronics from Cochin University of Science & Technology (CUSAT) in 2001
and 2009 respectively. He was the University
topper and Gold Medalist for M.Tech in 2001. He has more than 50 papers international and
national journals conferences. His research
interests include Multi Resolution Signal & Image Processing, Artificial
Naaaeural Networks, Array Processing and Computational
Electrodynamics. He is affiliated to College of Engineering, Cherthala, India.