Output feedback tracking of ships - Technische Universiteit Eindhoven
Detection and tracking of ships using a stereo vision system
16
Scientific Research and Essays Vol. 8(7), pp. 288-303, 18 February, 2013 Available online at http://www.academicjournals.org/SRE DOI: 10.5897/SRE12.318 ISSN 1992-2248 ©2013 Academic Journals Full Length Research Paper Detection and tracking of ships using a stereo vision system Gazi Kocak 1,2 *, Shigehiro Yamamoto 1 and Takeshi Hashimoto 3 1 Graduate School of Maritime Sciences, Kobe University, Japan. 2 Maritime Faculty, Istanbul Technical University (ITU), Tuzla, Istanbul, Turkey. 3 Faculty of Engineering, Shizuoka University, Japan. Accepted 12 February, 2013 Maritime transportation continues to maintain the largest volume in the transportation sector, and this is increasing day-by-day. This means there is an ever-increasing demand for safe navigation. In this study, we propose a stereo vision system for detecting and tracking ships as a tool for increasing navigational safety. Ships are detected from obtained images by using an edge detection algorithm that uses a moving average to find high-intensity gradients. The detected points are clustered and the 3D location of a detected ship is calculated from a stereo image pair. The detected ship is then tracked for several tens of seconds to obtain its course. The result of our experiment indicates that the proposed stereo vision system is useful as a tool for safe navigation. Key words: Safety navigation, ship detection, tracking, computer vision, stereo vision. INTRODUCTION Ocean-going vessels are equipped with various electronic devices for navigation, such as automatic radar plotting aid (ARPA) and automatic identification system (AIS). However, existing devices are not perfect, and the navigational abilities of ships are restricted by these devices. In addition, the AIS is not mandatory for ships under 300 GT, and small vessels cannot be detected by the AIS, which increases the collision risk. The occurrences of accidents at sea prove that existing navigational devices are inadequate. Studies show that up to 75 to 96% of maritime accidents and casualties are due to some form of human error (Perera et al., 2011). More specifically, an important cause of collision is an improper look-out being maintained by navigation officers, which accounts for 86% of collisions (Shimpo et al., 2008). This makes the authorities and researchers pay more attention to increase the navigational safety. It is desirable to have many choices for safety navigation which support the applicability of The International *Corresponding author. E-mail: [email protected]. Tel: +81-90-6065-1982. Fax: +81-78-431-6288. Regulations for Preventing Collisions at Sea (COLREGs) (IMO, 1972) in which the target object location and course are essential information for obstacle avoidance. Figure 1 illustrates a crossing situation according to COLREGs rules. In the figure, V 0 and V 1 are speeds of own vessel and target vessel, respectively and X-Z is the coordinate system for own vessel. As it can be seen from the figure, the action for the collision avoidance depends on the location, course and the speed of the target vessel. Recently some studies are carried out for the application of COLREGs in autonomous surface vehicles. These studies assume that the obstacles are already detected and their algorithm makes localization and mapping in accordance with COLREGs rules (Perera et al., 2011; Benjamin et al., 2006; Statheros et al., 2008). However, the obstacle detection is a very complex step for collision avoidance which is the topic of this paper. Especially, automatic ship detection becomes more important for the safety navigation of ships. Automatic ship detection is reported in some papers (Shimpo et al., 2005; Kiriya and Fukuto, 2005; Martins et al., 2007), which utilized digital images. However, these studies use a single camera. In this case, it is very difficult to obtain the location of a target. The authors have previously
Transcript of Detection and tracking of ships using a stereo vision system
Scientific Research and Essays Vol. 8(7), pp. 288-303, 18 February, 2013 Available online at http://www.academicjournals.org/SRE DOI: 10.5897/SRE12.318 ISSN 1992-2248 ©2013 Academic Journals
Full Length Research Paper
Detection and tracking of ships using a stereo vision system
Gazi Kocak1,2*, Shigehiro Yamamoto1 and Takeshi Hashimoto3
1Graduate School of Maritime Sciences, Kobe University, Japan.
2Maritime Faculty, Istanbul Technical University (ITU), Tuzla, Istanbul, Turkey.
3Faculty of Engineering, Shizuoka University, Japan.
Accepted 12 February, 2013
Maritime transportation continues to maintain the largest volume in the transportation sector, and this is increasing day-by-day. This means there is an ever-increasing demand for safe navigation. In this study, we propose a stereo vision system for detecting and tracking ships as a tool for increasing navigational safety. Ships are detected from obtained images by using an edge detection algorithm that uses a moving average to find high-intensity gradients. The detected points are clustered and the 3D location of a detected ship is calculated from a stereo image pair. The detected ship is then tracked for several tens of seconds to obtain its course. The result of our experiment indicates that the proposed stereo vision system is useful as a tool for safe navigation. Key words: Safety navigation, ship detection, tracking, computer vision, stereo vision.
INTRODUCTION Ocean-going vessels are equipped with various electronic devices for navigation, such as automatic radar plotting aid (ARPA) and automatic identification system (AIS). However, existing devices are not perfect, and the navigational abilities of ships are restricted by these devices. In addition, the AIS is not mandatory for ships under 300 GT, and small vessels cannot be detected by the AIS, which increases the collision risk. The occurrences of accidents at sea prove that existing navigational devices are inadequate. Studies show that up to 75 to 96% of maritime accidents and casualties are due to some form of human error (Perera et al., 2011). More specifically, an important cause of collision is an improper look-out being maintained by navigation officers, which accounts for 86% of collisions (Shimpo et al., 2008). This makes the authorities and researchers pay more attention to increase the navigational safety. It is desirable to have many choices for safety navigation which support the applicability of The International *Corresponding author. E-mail: [email protected]. Tel: +81-90-6065-1982. Fax: +81-78-431-6288.
Regulations for Preventing Collisions at Sea (COLREGs) (IMO, 1972) in which the target object location and course are essential information for obstacle avoidance. Figure 1 illustrates a crossing situation according to COLREGs rules. In the figure, V0 and V1 are speeds of own vessel and target vessel, respectively and X-Z is the coordinate system for own vessel. As it can be seen from the figure, the action for the collision avoidance depends on the location, course and the speed of the target vessel. Recently some studies are carried out for the application of COLREGs in autonomous surface vehicles. These studies assume that the obstacles are already detected and their algorithm makes localization and mapping in accordance with COLREGs rules (Perera et al., 2011; Benjamin et al., 2006; Statheros et al., 2008). However, the obstacle detection is a very complex step for collision avoidance which is the topic of this paper. Especially, automatic ship detection becomes more important for the safety navigation of ships. Automatic ship detection is reported in some papers (Shimpo et al., 2005; Kiriya and Fukuto, 2005; Martins et al., 2007), which utilized digital images. However, these studies use a single camera. In this case, it is very difficult to obtain the location of a target. The authors have previously

Figure 1. Crossing (Own vessel gives way).
Figure 2. Concept of the proposed system.
proposed a new approach for the detection and localization of other ships by means of a stereo vision system (Yamamoto and Win, 2006; Kocak et al., 2009a, b).
Kocak et al. 289 In this study, further consideration on detection and localization is carried out and tracking of detected ships is included. The system can be used as a tool to aid navigation officer’s look-out and to complement other electronic devices.
The fundamental theory of stereo vision has been explained in detail in many studies (Faugeras, 1993; Jain et al., 1995; Trucco and Verri, 1998; Hartley and Zisserman, 2003). The basic principle of stereo is that the projection of a 3D object point has a unique pair of image locations in two cameras viewing the same scene from different viewpoints. These projected points of the object are called corresponding points. Therefore, given two camera images, it is possible to calculate the 3D location of an object point by triangulation, provided its image locations that correspond to the same physical point in the real world.
One of the advantages in using stereo vision to detect a ship is that we can measure its 3D location. In addition, we can make use of the correspondence problem mentioned above. That is, it is easy to find the corresponding points for solid objects such as a ship or an obstacle between a pair of stereo images, while it is difficult for more unsteady things such as waves and reflections of the sea’s surface.
In this study, we propose a stereo vision system to help navigation officers by detecting other ships and obstacles, measuring their locations, and tracking them. The remainder of the paper is organized as follows. Firstly, the detection and tracking algorithms - which include bilateral filtering, edge detection method, clustering, 3D calculation and tracking - are explained in detail. Then, basic experimental results are presented. Finally, the results of the study are summarized as conclusions.
DETECTION AND TRACKING OF SHIPS FROM STEREO IMAGES
Figure 2 shows the concept of the proposed system. A stereo camera system, which consists of two cameras set up on the starboard and the port sides of a ship, detects other ships or obstacles, measures their 3D locations in the XYZ coordinate system fixed on the ship, and tracks them.
The outline of the proposed method is shown in Figure 3. First, a pair of stereo images, which are referred to as left and right images for convenience, are captured. Then, color adjustment between the left and right images is carried out for a reliable corresponding point search. Next, the vertical edges are detected from the reference (left) image after removing the noise from the image by using a smoothing filter.
The correspondences of the vertical edges are found in the right image. Edges that cannot find a clear correspondence are removed. The remaining edges are assumed to belong to the detected objects.
We can detect ships and other structures from sea

290 Sci. Res. Essays
Figure 3. Algorithm flowchart.
images by using this procedure. The detected points are clustered, which represent the objects, and the locations of the objects are measured by the principle of triangulation, which is a robust technique for calculating object locations. By repeating the above procedures for time series images, we can track the locations of objects and remove unsteady things such as waves. The following sections describe these procedures in detail. Pre-processing The images obtained from the cameras are RGB color images that contain three color channels (Red, Green, and Blue). Each color channel has a value between 0 and 255. After capturing a pair of stereo images, color adjustment between left and right images is carried out for a reliable corresponding point search. A 3D scene point is viewed from different angles by the stereo cameras, which may result in slightly different color values. Color adjustment is carried out so that the mean value of each color channel of the right image agrees with that of the left image. For example, the red values of the right image are adjusted by
)()(
)(255
)255)((
,
,
,,
,
,
,
,,
,
averr
aver
raveravel
rnewr
averr
aver
raveravel
rnewr
RRR
RRRRR
RRR
RRRRR
(1)
where Rr and Rr,new are, respectively, the original and adjusted red values of the right image; Rl,ave and Rr,ave, respectively, are the mean values of the red channel of the left and the right images.
Sea images are very noisy because of the specular property of the sea’s surface. Therefore, elimination of this noise through a smoothing filter is required as a pre-process. However, some edge data are lost in the process of removing the noise. Therefore, we must choose a suitable smoothing filter. In this study, two types of smoothing filters are compared. One of them is a 7 × 7 median filter and the other is a bilateral filter. A median filter is a nonlinear filter that eliminates noise by taking the median of the sorted intensity data. However, some edge data are also lost in this system. On the other hand, the bilateral filter smoothes image noise while preserving the edges (Tomasi and Manduchi, 1998). The bilateral filter is a nonlinear filter through which the output image Js is the weighted average of the input image I, and the weighting for each pixel p is determined by the spatial distance and the intensity difference between the center pixel s and pixel p within the window Ω. Therefore, the value of pixel s is mainly affected by pixels that are spatially closer and have a similar intensity value. The output image is obtained by:
p
sp
p
psp
sIIgspf
IIIgspf
J)()(
)()( (2)
where the function f for spatial domain and g for intensity domain are usually Gaussian functions.
e d
sp
spf2)(
2
1
)(
(3)
e r
sp II
sp IIg2)(
2
1
)(
(4)
The results of applying a median filter and a bilateral filter to a ship image are shown in Figure 4. While the original image is noisy, the filtered images are smoothed. However, in the median-filtered images, the edges of a ship hull are deteriorated, which makes detection difficult. In bilateral-filtered image, the shape of the ship is preserved, while the noise is removed. Detection of salient points
Points with high-intensity gradients are assumed to be

Kocak et al. 291
Figure 4. Effect
Figure 4. Effect
(a) (b) (c)
Figure 4. Effect of filtering on ship image a) Original b) Median filtered c) Bilateral filtered.
Figure 5. Detection algorithm using the intensity profile
Figure 6. Corresponding point search salient points and are searched via the left stereo image. Although the images are captured as color images, we use the intensity or grayscale of the image to detect the salient points so as to save the computational cost. An intensity profile of a gray channel on a scan line is shown in Figure 5. In this image, the solid line is the intensity values through horizontal pixel locations, and the dashed line is the moving average of intensity values. The candidate salient points are determined as the intersection of moving average values and the intensity values (points A, B and C in Figure 5). However, the intensity values are very unstable and resulting in too many candidate points. To overcome this problem, the area formed by the intersection of the intensity values and moving average line is considered, which is shown as the blue area in Figure 5. If the areas before and after the intersection points are sufficiently large, they are
determined to be candidate points (points A and B in Figure 5), which indicate that the intensity change at this point is sufficiently high.
The application of different types of smoothing filters affects the intensity profile and hence the detection quality. The effects of a median filter and a bilateral filter on the intensity profile and detection are presented in the experimental results part of this work. Finding corresponding points and disparity After detecting salient points, correspondences for these points are searched in the right image, as shown in Figure 6.
Three color channels (R, G, and B) are used for stereo matching to increase the accuracy of the corresponding

292 Sci. Res. Essays
Figure 7. Verification of matching.
Figure 8. Sample corresponding point matching using the SSD similarity measurement
point search. Corresponding points are calculated by the sum of squared differences (SSD) method (Marghany et al., 2011) according to the following equation:
))],(),([
)],(),([
)],(),(([)(
2
2
2
,
jdiBjiB
jdiGjiG
jdiRjiRdR
rl
rl
Wji
rl
(5)
where R, G and B are RGB intensity values. The subscripts l and r indicate the reference (left) and observed (right) images, respectively. W is the area
defined around the candidate point in the reference image. The pixel location d with the minimum value of R is determined as the matching point.
As mentioned earlier, sea images have a high-noise content, which results in the detection of some false points as interest points. For example, sea waves can be detected as object points. To confirm the matching point to be true, a reverse-matching process is carried out, as shown in Figure 7. Here the matched point in the right image is searched in the left image and if both locations are the same, this point is determined to be a true matching point. A sample corresponding point pair is shown in Figure 8.

Kocak et al. 293
Figure 9. Parabola fitting of similarities.
Figure 10. Clustering detected points.
3D measurement by stereo vision makes use of the disparity between left and right images to calculate the distance of an object. The disparity decreased as the distance increases, compared to the baseline length, or the length between two cameras. Therefore, we must identify the disparity as correctly as possible and obtain it with sub-pixel accuracy, especially to measure a distant ship. The sub-pixel estimation is based on the similarity measures of three pixel locations – related pixel, previous pixel and next pixel– calculated by the SSD. After calculating the SSD values, parabola fitting is carried out, the centerline location of which is the estimated sub-pixel position, as shown in Figure 9. The following equation is used for the calculation of the parabola fitting:
)1(2)(4)1(2
)1()1(
dRdRdR
dRdRdsub
(6)
where R(d-1), R(d), and R(d+1) are the similarity measures of the previous pixel, related pixel and next
pixel locations, respectively. Then, the disparity is expressed by d + dsub.
Clustering detected object points
When detection is completed, there will be many points that belong to several objects. For better object representation and tracking performance, the number of points representing the same object should be decreased as much as possible. Therefore, the detected points are clustered by utilizing a stereo-clustering algorithm that uses the pixel location and the disparity data of a pair of stereo images. The points that are at a certain distance and similar disparity values are then collected in the same cluster. Each cluster is represented by the average of point locations and disparity values. When a new point is included in a cluster, the average of location and disparity values are updated, as shown in Figure 10. If the distance between the red and green points and the

294 Sci. Res. Essays
Figure 11. () and () edges.
disparity is less than a certain threshold value, the green point will be included in the cluster and the average value will be refreshed, which represents the renewal cluster. The distance threshold used in this study is 3 pixels for the horizontal direction and 10 pixels for the vertical direction, while the disparity threshold is 1 pixel. When a detected point cannot be included in any existing clusters, a new cluster is generated. When the entire image is scanned, clusters that do not have a sufficient number of points—four in this study—are eliminated, and the remaining clusters are saved to obtain the significant clusters.
In this method, the detected edges of ships are mostly accumulated at the bow and stern of the vessel. Therefore, it is convenient to distinguish them. Classifying
the clusters as () and () edges can help us achieve this.
The concept of () and () edges is illustrated in Figure 11. This is actually the concept of a brightness gradient. If the brightness is changing from higher values to lower
values at the edge point, this edge is a () edge,
otherwise it is a () edge.
Tracking by spatiotemporal clustering and feedback to detection
After clustering the salient points of time t, these points are tracked through image sequences. This is realized by
the same procedure as clustering but extended through time series images. The clusters of time t are saved, and then detection is carried out in a new image at time t+1. Detected points in the new image are included into a suitable existing cluster as detected points of time t. When a cluster is not updated several times in succession, it is removed. This results in tracking only stably detected clusters and eliminating unstable clusters through image sequences.
The specular property of the sea’s surface causes some reflectance points on the sea surface to be perceived as an object point by a computer, and it is not easy to eliminate all noise despite smoothing the image by filtering. Combining detection and tracking algorithms solves this problem, making it possible to confirm detection by tracking through image sequences. The tracking of 3D locations of certain object points will be stable and consistent, while the arbitrary sea surface reflectance will change in successive images. Therefore, it is easy to eliminate such points by tracking them. In this algorithm, clustering the detected points and tracking them through image sequences eliminate false detected points arising from glare from the sea’s surface. Measurement of a 3D location of an object The last step is the calculation of a 3D location (X, Y, and Z) using the disparity. In the case of a standard stereo system in which the optical axes of both cameras are parallel, the 3D location of an object is expressed by:
F
y
xx
dd
L
Z
Y
X rl
sub
B
2/)(
(7)
where (xl, y) and (xr, y) are the image coordinates of the object in the left and right images, respectively. LB is the baseline length of two cameras, and F is the focal length of the cameras. The triangulation process used to calculate the 3D locations is explained in detail in a previous study by the authors (Yamamoto and Win, 2006). EXPERIMENTAL RESULTS
Experimental configuration An experiment was carried out in the Akashi Strait in which we attempted to detect ships from actual sea images. To determine the basic performance of the algorithm, cameras were set up on land not onboard a ship. The authors evaluated two different experimental configurations using different camera types. They are referred as Configuration 1 and Configuration 2.

Kocak et al. 295
is 10.1m, and the image resolution is 1920 x 1080 pixels.
Figure 12. Experimental camera setup and obtained sample images
Figure 12. Experimental camera setup and obtained sample images.
Configuration 1 uses two identical 3CCD Panasonic NV-GS300 video cameras with a zoom lens. The view angle of the cameras is a maximum 43° and the image resolution is 720 × 480 pixels. The cameras are set up nearly parallel to the camera axis with an 8.14m baseline length. A tripod is used for the calibration purposes. Figure 12 shows the camera setup and sample stereo images. In Configuration 2, two identical high-resolution cameras, Canon EOS 5DIIs, are used. The baseline length between the cameras in this case is 10.1m, and the image resolution is 1920 × 1080 pixels. Detection First, the performance of salient point detection is ascertained using Configuration 1. One scan line (327
th)
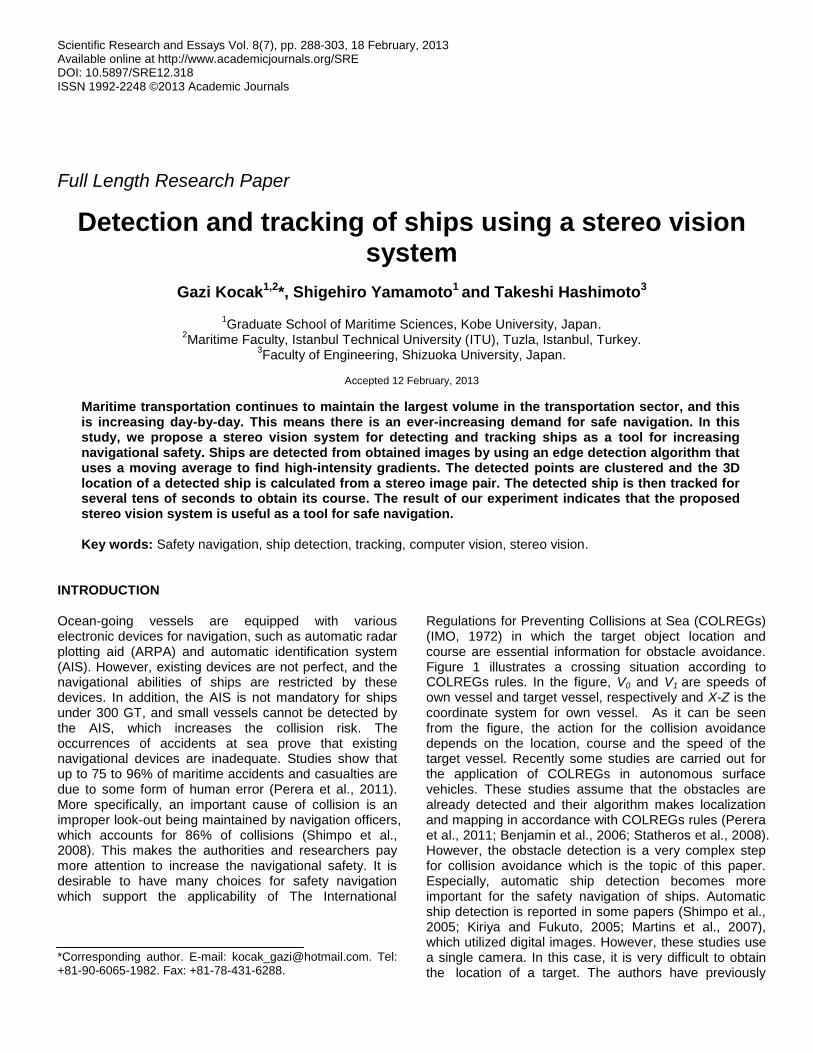
of a bilateral-filtered image is displayed in Figure 13 with different moving average values to show some of the local effects of the algorithm. The blue line is the intensity profile of one scan line. The red, green, and purple lines are moving average values with 71 pixels, 35 pixels, and 29 pixels, respectively. A 71-pixel moving average is shown to be better for the detection purpose from the
figure because it forms greater areas at higher-intensity gradients. Therefore, 71-pixel moving average data are used in the rest of the study, and areas greater than 30 pixels are considered to be interest points.
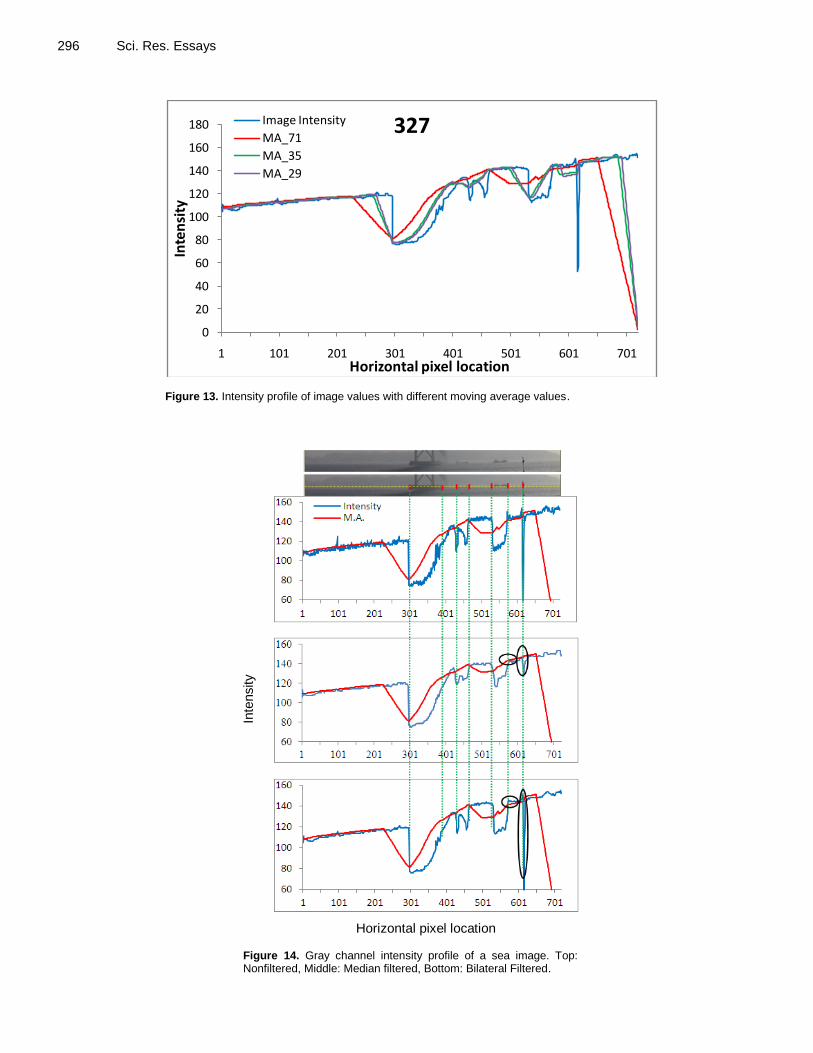
The intensity values of a scan line are changed after the application of smoothing filter, which affects detection quality. Scan lines after the application of a median filter and a bilateral filter are shown in Figure 14. The figure shows a bridge pier and two ships. One of the ships is closer and has a clear image, while the other is farther out and not so clear. The important point for detection is shown within the black circle, which the median-filtered image cannot detect the salient point, while the bilateral-filtered image can. In addition, the median filter truncates the sharp edges, while the bilateral filter preserves them.
The detected salient points are shown in Figure 15. It is clear from the figure that the bilateral filter improves the detection quality. The positive effect of bilateral filtering can be more clearly observed in the tracking data. Clustering In Figure 16, the result of clustering detected points in
296 Sci. Res. Essays
0
20
40
60
80
100
120
140
160
180
1 101 201 301 401 501 601 701
Inte
nsi
ty
Horizontal pixel location
327Image Intensity
MA_71
MA_35
MA_29
Figure 13. Intensity profile of image values with different moving average values.
. In addition, the median filter truncates the sharp edges, while the bilateral filter
preserves them.
Horizontal pixel location
Figure 14. Gray channel intensity profile of a sea image. Top: Nonfiltered, Middle: Median filtered, Bottom: Bilateral Filtered
Inte
nsity
Figure 14. Gray channel intensity profile of a sea image. Top: Nonfiltered, Middle: Median filtered, Bottom: Bilateral Filtered.

Kocak et al. 297
The detected salient points are shown in Figure 15. It is clear from the figure that the bilateral filter improves the detection quality. The positive effect of bilateral filtering can be more clearly observed in the tracking data.
(a)
(b)
Figure 15. Detected points in left image after (a) median filter (b) bilateral filter
Clustering
Figure 15. Detected points in left image after (a) median filter (b) bilateral filter.
Figure 16. Clustering result of detected points.
Figure 15 can be observed. The clusters are mainly located at the bow and stern of the ship.
illumination conditions and for different ships in Configuration 2 are displayed in
Figure 18.
Figure 17. Calculated 3D locations of clusters
0
500
1000
1500
2000
2500
3000
-100 -50 0 50 100 150 200 250 300
Z [m
]
X [m]
Bridge Pier
Ship 1Ship 2
Figure 17. Calculated 3D locations of clusters.
In Figure 17, the calculated 3D locations of detected clusters are displayed in the X-Z dimensions. The detection and clustering results of various situations

298 Sci. Res. Essays
Figure 17. Calculated 3D locations of clusters
Figure 17. Calculated 3D locations of clusters
Figure 18. Detection and clustering results under various conditions
We attempted to determine the actual position of th
Figure 18. Detection and clustering results under various conditions. under different illumination conditions and for different ships in Configuration 2 are displayed in Figure 18.
We attempted to determine the actual position of the ships by using a surveying equipment (Topcon GPT-7500). However, this was not possible because the ships were in motion. Therefore, a stable point on the bridge is measured to show the accuracy of the 3D measurement of the stereo camera system. The projections of this point
to the left and right images are shown in Figure 19. The 3D location of this point measured by the surveying
equipment is (108.694 m, 193.502 m, 917.499 m) which are the X, Y, and Z distances, respectively. 3D measurement of this bridge point is performed by the stereo camera system for 50 images through image sequences in Configuration 2. The average of these 50
calculations is (110.733 m, 195.06 m, 930.171 m). A

Kocak et al. 299
Figure 19. The bridge point measured for 3D accuracy
Figure 19. The bridge point measured for 3D accuracy.
images that are equivalent to tracking of 30 seconds.
Figure 20. 3D locations of tracked points for median-filtered images
The application of a bilateral filter improves clustering and tracking, resulting in better detection. The tracking result of the same image sequence
Ship2
Ship1
Bridge Pier
Ship1 Ship2 Ship1 Ship2
Figure 20. 3D locations of tracked points for median-filtered images.
comparison of the 3D measurement result of the surveying equipment and stereo camera system shows that the accuracy of the 3D measurement of the stereo camera system is acceptable. Tracking by spatiotemporal clustering These points, which represent one cluster, are tracked through the sequences of images, and the 3D locations
are calculated for each image. Figure 20 shows the calculated locations of all tracked cluster points for median-filtered images for 300 images that are equivalent to tracking of 30 s.
The application of a bilateral filter improves clustering and tracking, resulting in better detection. The tracking result of the same image sequence, shown in Figure 20, after application of a bilateral filter is shown in Figure 21. Comparing the results of tracking obtained in Figure 21 with that obtained in Figure 20, we can observe an
300 Sci. Res. Essays
the course of the ship. This is very important for collision avoidance purposes.
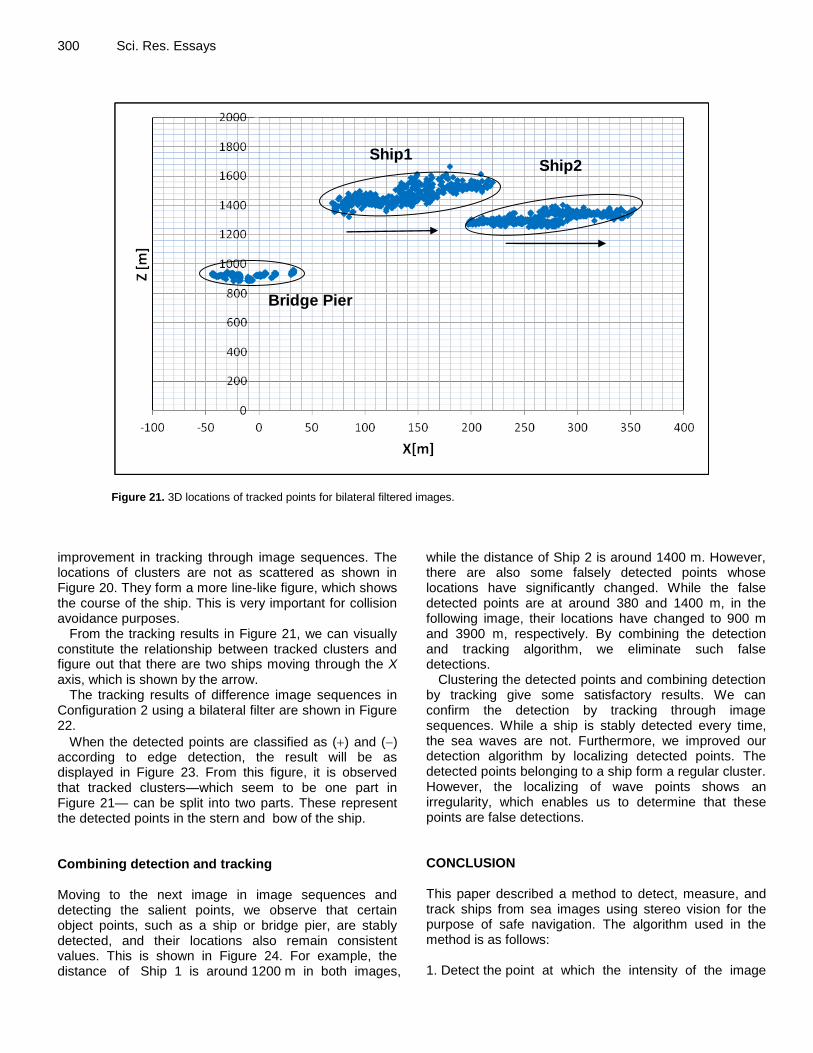
Figure 21 3D locations of tracked points for bilateral filtered images
From the tracking results in Figure
Bridge Pier
Ship1 Ship2
Figure 21. 3D locations of tracked points for bilateral filtered images.
improvement in tracking through image sequences. The locations of clusters are not as scattered as shown in Figure 20. They form a more line-like figure, which shows the course of the ship. This is very important for collision avoidance purposes.
From the tracking results in Figure 21, we can visually constitute the relationship between tracked clusters and figure out that there are two ships moving through the X axis, which is shown by the arrow.
The tracking results of difference image sequences in Configuration 2 using a bilateral filter are shown in Figure 22.
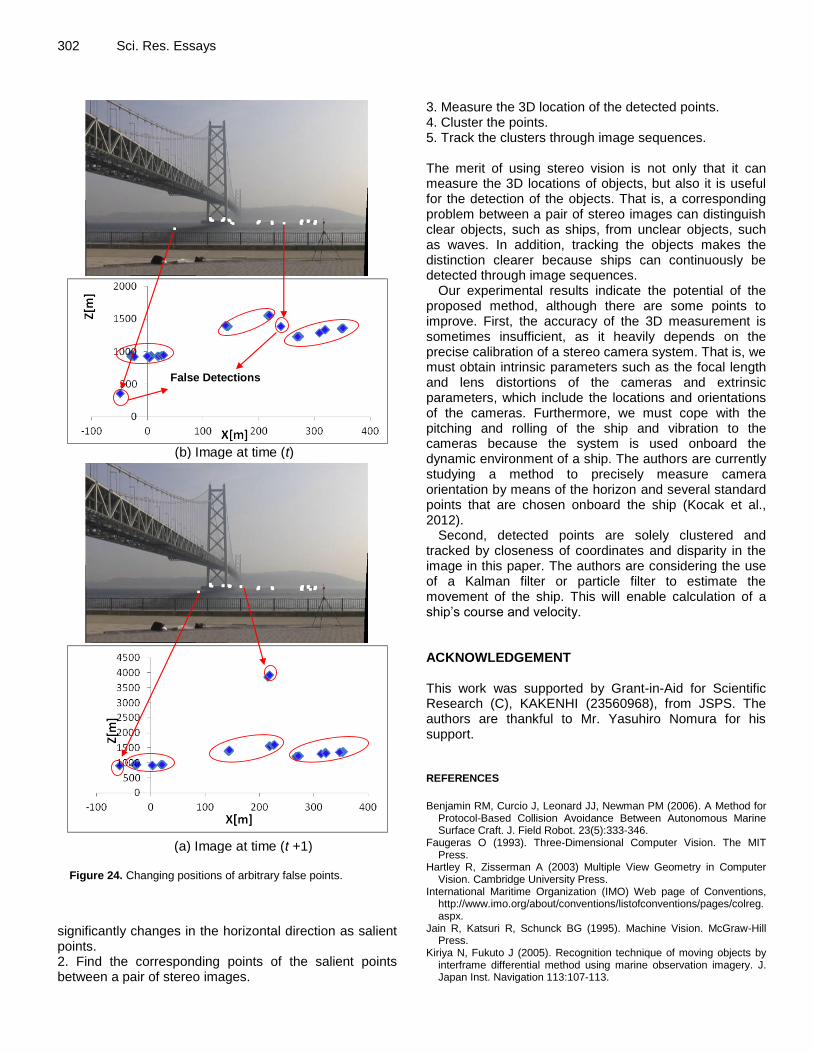
When the detected points are classified as () and () according to edge detection, the result will be as displayed in Figure 23. From this figure, it is observed that tracked clusters—which seem to be one part in Figure 21— can be split into two parts. These represent the detected points in the stern and bow of the ship. Combining detection and tracking Moving to the next image in image sequences and detecting the salient points, we observe that certain object points, such as a ship or bridge pier, are stably detected, and their locations also remain consistent values. This is shown in Figure 24. For example, the distance of Ship 1 is around 1200 m in both images,
while the distance of Ship 2 is around 1400 m. However, there are also some falsely detected points whose locations have significantly changed. While the false detected points are at around 380 and 1400 m, in the following image, their locations have changed to 900 m and 3900 m, respectively. By combining the detection and tracking algorithm, we eliminate such false detections.
Clustering the detected points and combining detection by tracking give some satisfactory results. We can confirm the detection by tracking through image sequences. While a ship is stably detected every time, the sea waves are not. Furthermore, we improved our detection algorithm by localizing detected points. The detected points belonging to a ship form a regular cluster. However, the localizing of wave points shows an irregularity, which enables us to determine that these points are false detections. CONCLUSION This paper described a method to detect, measure, and track ships from sea images using stereo vision for the purpose of safe navigation. The algorithm used in the method is as follows: 1. Detect the point at which the intensity of the image

Kocak et al. 301
difference image sequences in Configuration 2 using a bilateral filter are shown in
Figure 22.
Figure 22. Tracking results with different image sequences
Bridge Pier
Bridge Pier
Ship1 Ship2 Ship1
Ship2 Ship3 Ship2 Ship1 Ship1
Ship1
Ship1
Ship2
Ship2 Ship3
Ship2
Figure 22. Tracking results with different image sequences.
parts. These represent the detected points in the stern and bow of the ship.
Figure 23. Tracking data of () and () edges
Combining Detection and
0
200
400
600
800
1000
1200
1400
1600
1800
-50 0 50 100 150 200 250 300 350 400
Z [m
]
X [m]
(-) (+)
Figure 23. Tracking data of (+) and (-) edges.
302 Sci. Res. Essays
Figure 24. Changing positions of arbitrary false points
False Detections
(a) Image at time (t +1)
(b) Image at time (t)
Figure 24. Changing positions of arbitrary false points.
significantly changes in the horizontal direction as salient points. 2. Find the corresponding points of the salient points between a pair of stereo images.
3. Measure the 3D location of the detected points. 4. Cluster the points. 5. Track the clusters through image sequences. The merit of using stereo vision is not only that it can measure the 3D locations of objects, but also it is useful for the detection of the objects. That is, a corresponding problem between a pair of stereo images can distinguish clear objects, such as ships, from unclear objects, such as waves. In addition, tracking the objects makes the distinction clearer because ships can continuously be detected through image sequences.
Our experimental results indicate the potential of the proposed method, although there are some points to improve. First, the accuracy of the 3D measurement is sometimes insufficient, as it heavily depends on the precise calibration of a stereo camera system. That is, we must obtain intrinsic parameters such as the focal length and lens distortions of the cameras and extrinsic parameters, which include the locations and orientations of the cameras. Furthermore, we must cope with the pitching and rolling of the ship and vibration to the cameras because the system is used onboard the dynamic environment of a ship. The authors are currently studying a method to precisely measure camera orientation by means of the horizon and several standard points that are chosen onboard the ship (Kocak et al., 2012).
Second, detected points are solely clustered and tracked by closeness of coordinates and disparity in the image in this paper. The authors are considering the use of a Kalman filter or particle filter to estimate the movement of the ship. This will enable calculation of a ship’s course and velocity. ACKNOWLEDGEMENT This work was supported by Grant-in-Aid for Scientific Research (C), KAKENHI (23560968), from JSPS. The authors are thankful to Mr. Yasuhiro Nomura for his support. REFERENCES
Benjamin RM, Curcio J, Leonard JJ, Newman PM (2006). A Method for
Protocol-Based Collision Avoidance Between Autonomous Marine Surface Craft. J. Field Robot. 23(5):333-346.
Faugeras O (1993). Three-Dimensional Computer Vision. The MIT Press.
Hartley R, Zisserman A (2003) Multiple View Geometry in Computer Vision. Cambridge University Press.
International Maritime Organization (IMO) Web page of Conventions, http://www.imo.org/about/conventions/listofconventions/pages/colreg.aspx.
Jain R, Katsuri R, Schunck BG (1995). Machine Vision. McGraw-Hill Press.
Kiriya N, Fukuto J (2005). Recognition technique of moving objects by interframe differential method using marine observation imagery. J. Japan Inst. Navigation 113:107-113.
Kocak G, Yamamoto S (2009a). A feasibility study on precise
localization of ships using stereo vision. Conference of the Institute of Systems, Control and Information Engineers (ISCIE’09).
Kocak G, Yamamoto S (2009b). Accuracy improvement of 3D location measurement of ships using stereo vision. 13
th Congress of
International Maritime Association of Mediterranean (IMAM 2009). Kocak G, Yamamoto S, Hashimoto T (2012). Analyzing Influence of
Ship Movements on Stereo Camera System Set-up on Board Ship. Journal of the Japan Institute of Marine Engineering. 47(6): 111-118.
Marghany M, Tahar M, Hashim M (2011). 3D stereo reconstruction using sum square of difference matching algorithm. Sci. Res. Essays 6(30):6404-6411.
Martins A, Almeida JM, Ferreira H, Silva H, Dias N, Dias A, Almeida C, Silva EP (2007). Autonomous surface vehicle docking maneuver with visual information. Proc. IEEE Int. Conf. Robot. Autom., Roma, Italy.
Perera LP, Carvalho JP, Guedes Soares C (2011). Fuzzy logic based decision making system for collision avoidance of ocean navigation under critical collision conditions. J. Mar. Sci. Technol. 16:84-89.
Kocak et al. 303 Shimpo M, Hirasawa M, Oshima M (2005). Detection and tracking
method of moving ships through navigational image sequence. J. Japan Inst. Navigation 113:115-126.
Shimpo M, Shu R, Yamamoto S (2008). Investigation of Image Processing Methods Capable of Supporting Navigational Lookout. Proceedings of Asia Navigation Conference.
Statheros T, Howells G, McDonald-Maier K (2008). Autonomous Ship Collision Avoidance Navigation Concepts, Technologies and Techniques. J. Navigation 61:129-142.
Tomasi C, Manduchi R (1998). Bilateral filtering for gray and color images. Proceedings of International Conference on Computer Vision (ICCV).
Trucco E, Verri A (1998). Introductory Techniques for 3-D Computer Vision. Prentice Hall Publishing.
Yamamoto S, Win MT (2006). A feasibility study on ship detection using stereo vision. Proceedings of Techno-Ocean 2006 / 19
th JASNAOE
Ocean Engineering Symposium.