Detecting Latent Variables of Interest in Geo-localized...
6
Detecting Latent Variables of Interest in Geo-localized Environments Using an Aerial Robot David Salda˜ na 1 , Ramon Melo 1 , Erickson R. Nascimento 1 , and Mario F. M. Campos 1 Abstract— In general, monitoring applications require hu- man intervention whenever there is no physical sensors for the variables of interest (e.g. people in danger after a catastrophe). In this paper we describe an inference engine which is used to estimate latent variables that can not be perceived by sampling the physical phenomena directly. Our approach uses information from different types of sensors, and fuses them along with knowledge of experts. The inference engine works with probabilistic first order logic rules based on geo-located sensed data as evidences in order to dynamically create the structure of a Bayesian network. Our experiments, performed by using an aerial robot with a mounted RGB-Camera, show the capability of our method to detect people in danger situations, where the physical variables to being sensed are humans and fire. Index Terms— Inference engine, Information Fusion, Bayesian Networks, Predictive Situation Awareness. I. I NTRODUCTION There are a variety of environments where monitoring actively is a priority, since most catastrophes begin with small events without early identification. Examples of these kind of environments are: minefields, forests, and devastated cities. In those scenarios, most of the actions must be executed by humans, since some variables are not easy to identify in an autonomous way. However the state of the art methods points towards to create autonomous systems with capabilities to detect events of interest, that cannot be sensed directly, such as: flaming objects, broken pipes, spilled water, trapped animals, source of hazardous chemical leaks or lying people on the floor. While conventional static sensor networks have difficulties in this context, since covering the full environment requires to spread a number of sensors everywhere. Sensors like RGB Cameras are widely used because they have a good cost/benefit, provide a wide visual angle, high resolution and excellent quality. By the same way, some sensors can be very accurate, but they are not light enough to be carry on a small aerial vehicle. In the aforementioned cases, some situations cannot be recognized only using the data acquired by sensors, the available technologies do not offer sensors with full certainty and most of the times a sensor fusion is required. 1 D. Salda˜ na,R. R. Melo, E. R. Nascimento and M.F.M. Campos are with the Computer Vision and Robotics Laboratory (VeRLab), Computer Science Department, Universidade Federal de Minas Gerais, MG, Brazil. E-mails: {saldana, ramonmelo, erickson, mario }@dcc.ufmg.br *The authors also gratefully acknowledge the support of CAPES, CNPq and FAPEMIG. Under the stated premises, the use of mobile sensors offers a promising solution in those contexts, on account of using multiple mobile sensors equipped with different kind of sensor can be more efficient than a single sensor. Additionally, the distributed information can be fused to improve estimations about interested objects and events in the environment. In this work we present a method for inference and infor- mation fusion in partially observable environments, where there is only information about the map boundaries and sensed data. It is focus on fuse sensed data and the expert’s knowledge in order to identify regions of interest, based on evidences and a set of rules defined by an expert. We present a generic framework that can be applied to scenarios where variables of interest cannot be sensed directly. In this work, a situational awareness after a catastrophe is modeled, where there are people lying on the floor and objects on fire, and then, we detect, and classify them by type, and severity. The remaining of this article is presented as follows: section II present a summary of related works in the research area; our problem model, and all information needed to perform the inference evaluation is described in section III; section IV describes the inference engine for information fusion and inference. Section VI describes the experiments executed in order to validate the engine; finally, conclusions on section VII. II. RELATED WORKS An earlier work deploying mobile sensors in the environ- ment is shown in [1]. It describes the basic requirements for a robotic system being capable to locate a chemical leak. The use of a system like this can perform detection on extreme conditions of radiation and/or toxic chemical concentration, that would be impossible the accomplishment by humans. The work of Drews et al. [2] integrates multiple visual static sensor information with probabilistic graphical mod- els. This integration allows to infer crowd behaviors with a probabilistic method based on provided information by multiple RGB and IR cameras looking at the same scene but from different points of view. The fusion technique uses Hidden Markov Networks (HMM) [3] and Bayesian Networks [4] with different results for each one, but both were able to detect abnormal crowd behaviors. However the fusion method requires multiple and redundant sensors looking for the same place at the same time, which is a hard constrain for large environments. The work [5] applies Partially Observable Markov De- cision Process (POMDS) for cooperative active perception.
-
Upload
nguyendang -
Category
Documents
-
view
217 -
download
2
Transcript of Detecting Latent Variables of Interest in Geo-localized...

Detecting Latent Variables of Interest in Geo-localized Environments Usingan Aerial Robot
David Saldana1, Ramon Melo1, Erickson R. Nascimento1, and Mario F. M. Campos1
Abstract— In general, monitoring applications require hu-man intervention whenever there is no physical sensors for thevariables of interest (e.g. people in danger after a catastrophe).In this paper we describe an inference engine which is usedto estimate latent variables that can not be perceived bysampling the physical phenomena directly. Our approach usesinformation from different types of sensors, and fuses themalong with knowledge of experts. The inference engine workswith probabilistic first order logic rules based on geo-locatedsensed data as evidences in order to dynamically create thestructure of a Bayesian network. Our experiments, performedby using an aerial robot with a mounted RGB-Camera, show thecapability of our method to detect people in danger situations,where the physical variables to being sensed are humans andfire.
Index Terms— Inference engine, Information Fusion,Bayesian Networks, Predictive Situation Awareness.
I. INTRODUCTION
There are a variety of environments where monitoringactively is a priority, since most catastrophes begin withsmall events without early identification. Examples of thesekind of environments are: minefields, forests, and devastatedcities. In those scenarios, most of the actions must beexecuted by humans, since some variables are not easy toidentify in an autonomous way. However the state of the artmethods points towards to create autonomous systems withcapabilities to detect events of interest, that cannot be senseddirectly, such as: flaming objects, broken pipes, spilled water,trapped animals, source of hazardous chemical leaks or lyingpeople on the floor.
While conventional static sensor networks have difficultiesin this context, since covering the full environment requiresto spread a number of sensors everywhere. Sensors likeRGB Cameras are widely used because they have a goodcost/benefit, provide a wide visual angle, high resolution andexcellent quality. By the same way, some sensors can bevery accurate, but they are not light enough to be carry ona small aerial vehicle. In the aforementioned cases, somesituations cannot be recognized only using the data acquiredby sensors, the available technologies do not offer sensorswith full certainty and most of the times a sensor fusion isrequired.
1D. Saldana,R. R. Melo, E. R. Nascimento and M.F.M. Camposare with the Computer Vision and Robotics Laboratory (VeRLab),Computer Science Department, Universidade Federal de Minas Gerais,MG, Brazil. E-mails: {saldana, ramonmelo, erickson,mario }@dcc.ufmg.br
*The authors also gratefully acknowledge the support of CAPES, CNPqand FAPEMIG.
Under the stated premises, the use of mobile sensorsoffers a promising solution in those contexts, on accountof using multiple mobile sensors equipped with differentkind of sensor can be more efficient than a single sensor.Additionally, the distributed information can be fused toimprove estimations about interested objects and events inthe environment.
In this work we present a method for inference and infor-mation fusion in partially observable environments, wherethere is only information about the map boundaries andsensed data. It is focus on fuse sensed data and the expert’sknowledge in order to identify regions of interest, based onevidences and a set of rules defined by an expert. We presenta generic framework that can be applied to scenarios wherevariables of interest cannot be sensed directly. In this work,a situational awareness after a catastrophe is modeled, wherethere are people lying on the floor and objects on fire, andthen, we detect, and classify them by type, and severity.
The remaining of this article is presented as follows:section II present a summary of related works in the researcharea; our problem model, and all information needed toperform the inference evaluation is described in section III;section IV describes the inference engine for informationfusion and inference. Section VI describes the experimentsexecuted in order to validate the engine; finally, conclusionson section VII.
II. RELATED WORKS
An earlier work deploying mobile sensors in the environ-ment is shown in [1]. It describes the basic requirements fora robotic system being capable to locate a chemical leak. Theuse of a system like this can perform detection on extremeconditions of radiation and/or toxic chemical concentration,that would be impossible the accomplishment by humans.
The work of Drews et al. [2] integrates multiple visualstatic sensor information with probabilistic graphical mod-els. This integration allows to infer crowd behaviors witha probabilistic method based on provided information bymultiple RGB and IR cameras looking at the same scenebut from different points of view. The fusion technique usesHidden Markov Networks (HMM) [3] and Bayesian Networks[4] with different results for each one, but both were ableto detect abnormal crowd behaviors. However the fusionmethod requires multiple and redundant sensors looking forthe same place at the same time, which is a hard constrainfor large environments.
The work [5] applies Partially Observable Markov De-cision Process (POMDS) for cooperative active perception.

Mobile robots and static sensors work autonomously togetherto identify flames or persons who need of assistance such as:waving, running, or lying on the floor. It is implemented ona group of static cameras along with a mobile robot to workautonomously and cooperatively. The main drawback of thisapproach is the lack of scalability because the number ofstates increases exponentially with the number of agents, thatmakes computationally intractable for approximated methodsand infeasible for exactly solutions. For that reason, test-ing environments in experiments is very limited. Moreover,mobile robots can only move on a topological map whereonly a few interesting points can be defined and a fullyexploration would be computationally expensive as well.Another approach in this direction is given by [6], whichpresents a people classifier intended to be implemented tosurveillance. Based on a system of classification states anduncertainties, it uses Dynamic Bayesian Networks [7] todetermine the current belief state and consequently verifythe characteristics of the involved goals.
In [8] and [9] are used aerial and ground vehicles to workcooperatively based on different sensed information. In [8] isproposed a probabilistic framework to cooperatively detectand track a target using a team composed by UnmannedAerial Vehicles (UAV) and Unmanned Ground Vehicles(UGV).
The work presented by [10] shows a methodology forselection of regions of interest in images in order to ex-tract the maximum of useful information about a scenarioobserved by a group of agents, the objective is to shareonly really important data. For this, the authors demonstratethe technique called Semantic Stability, that describes howto use the relationship between objects to differentiate withlow or high quality of information, where objects with highsemantic level represents information gain.
III. PROBLEM STATEMENT
Let be W ⊂ R2 a region bounded by a convex polygon,where the robot can sample and we define as the robotworkspace.
In this environment, some kind of objects/entities can beidentified by sampling (eg. trees, people, animals), or recog-nized by an expert (eg. people in danger, scared animals).Then, the n types of entities are defined as the set T = {t1,t2, ..., tn}.
The aerial robot is able to capture multiple pictures in theworkspace to identify objects, which we refer as evidences(a picture can contain multiple evidences). Those evidencesare geo-localized using a localization system like a GlobalPositioning System device (GPS). Hence, at the detectionstage, when the robot is sensing the environment, the set E ={e1, e2, ..., em} of m evidences are sampled. Each evidenceis composed of a tuple ei = (xi, ti) where xi is the positionof the evidence in the workspace xi ∈W and the tuple ti ∈T which identifies the object. Additionally, the knowledge ofexperts is also introduced as a a-priori knowledge in order toallow the system to infer about the latent entities that cannotbe sampled by the robot. The association is made by a set
of l rules R = {r1, r2, ..., rl}, where each rule representsthe association of types with the form
E ′ −−→f
e′ (1)
where f is a function which creates a relationship betweenexistent evidences and the possibility of new ones. In otherwords, we take a subset of the evidences E ′ ⊆ E , apply anassociation function f to obtain a new evidence e′ for eachfired rule. The modeling of association functions and therelationship definition take us to the Problem 1.
Problem 1 (geo-localized rule definitions): How to definea way to create relationships based on evidence type andlocation in order to recognize latent variables by using thedetections of the robot.
Then, designing a method to identify latent variables bycombining robot data and knowledge experts, take us to theproblem 2.
Problem 2 (information fusion): How to combine therobot data and the experts’ knowledge in order to infer aboutlatent variables.
Section IV proposes the rule definitions for Problem 1,and section V describes our proposal for Problem 2.
IV. RULE DEFINITIONS FOR GEO-LOCALIZEDENVIRONMENTS
An efficient way for representing the experts’ knowledgehas been a challenge in the scientific community since thebeginnings of the Artificial Intelligence field. One approachto define this kind of rules has been tackled by combin-ing Conditional Probability Tables (CPT) and First Orderlogic [11], [12], [13], [14]. In [14] is presented a set ofrules focused on inference for relational databases. In ourapproach, we want to extend these types of rules in order towork in geo-localized environments, where the associationbetween two variables is made by the evidence type andEuclidean distance. Hence, the function f of the expression1 is represented by the Conditional Probability Table - CPT,and we define E as the set of all the inferred and detectedevidences.
Each rule ri ∈ R is defined as the relationship betweenentities of any type ti ∈ T . In the following, we presentsome type of rules to represent knowledge where the distanceis an important factor to associate correlation between vari-ables. These rules will be used to infer the hidden variableson the environment; using the inference engine described insection V.
1) Sensor rule: This rule describes the two variablesof the Bayesian theorem (cause and effect). It is triggeredwhen there is an evidence about the effect variable. Therequirements are:• Cause variable: hidden variable that a sensor tries to
estimate, e.g. temperature.• Probability of the cause: the possible states and its
probabilities, e.g.: hot = 0.7, and cold = 0.3.
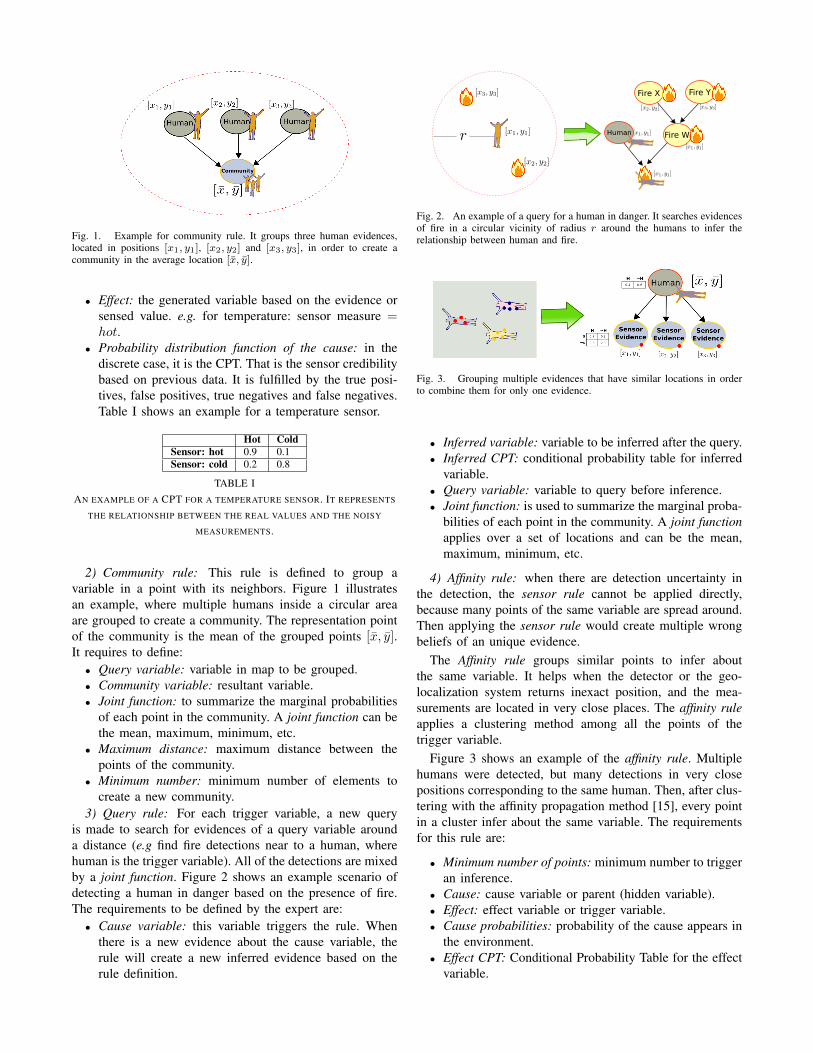
Fig. 1. Example for community rule. It groups three human evidences,located in positions [x1, y1], [x2, y2] and [x3, y3], in order to create acommunity in the average location [x, y].
• Effect: the generated variable based on the evidence orsensed value. e.g. for temperature: sensor measure =hot.
• Probability distribution function of the cause: in thediscrete case, it is the CPT. That is the sensor credibilitybased on previous data. It is fulfilled by the true posi-tives, false positives, true negatives and false negatives.Table I shows an example for a temperature sensor.
Hot ColdSensor: hot 0.9 0.1Sensor: cold 0.2 0.8
TABLE IAN EXAMPLE OF A CPT FOR A TEMPERATURE SENSOR. IT REPRESENTS
THE RELATIONSHIP BETWEEN THE REAL VALUES AND THE NOISY
MEASUREMENTS.
2) Community rule: This rule is defined to group avariable in a point with its neighbors. Figure 1 illustratesan example, where multiple humans inside a circular areaare grouped to create a community. The representation pointof the community is the mean of the grouped points [x, y].It requires to define:• Query variable: variable in map to be grouped.• Community variable: resultant variable.• Joint function: to summarize the marginal probabilities
of each point in the community. A joint function can bethe mean, maximum, minimum, etc.
• Maximum distance: maximum distance between thepoints of the community.
• Minimum number: minimum number of elements tocreate a new community.
3) Query rule: For each trigger variable, a new queryis made to search for evidences of a query variable arounda distance (e.g find fire detections near to a human, wherehuman is the trigger variable). All of the detections are mixedby a joint function. Figure 2 shows an example scenario ofdetecting a human in danger based on the presence of fire.The requirements to be defined by the expert are:• Cause variable: this variable triggers the rule. When
there is a new evidence about the cause variable, therule will create a new inferred evidence based on therule definition.
Fire X Fire Y
Fire WHuman
Fig. 2. An example of a query for a human in danger. It searches evidencesof fire in a circular vicinity of radius r around the humans to infer therelationship between human and fire.
Fig. 3. Grouping multiple evidences that have similar locations in orderto combine them for only one evidence.
• Inferred variable: variable to be inferred after the query.• Inferred CPT: conditional probability table for inferred
variable.• Query variable: variable to query before inference.• Joint function: is used to summarize the marginal proba-
bilities of each point in the community. A joint functionapplies over a set of locations and can be the mean,maximum, minimum, etc.
4) Affinity rule: when there are detection uncertainty inthe detection, the sensor rule cannot be applied directly,because many points of the same variable are spread around.Then applying the sensor rule would create multiple wrongbeliefs of an unique evidence.
The Affinity rule groups similar points to infer aboutthe same variable. It helps when the detector or the geo-localization system returns inexact position, and the mea-surements are located in very close places. The affinity ruleapplies a clustering method among all the points of thetrigger variable.
Figure 3 shows an example of the affinity rule. Multiplehumans were detected, but many detections in very closepositions corresponding to the same human. Then, after clus-tering with the affinity propagation method [15], every pointin a cluster infer about the same variable. The requirementsfor this rule are:
• Minimum number of points: minimum number to triggeran inference.
• Cause: cause variable or parent (hidden variable).• Effect: effect variable or trigger variable.• Cause probabilities: probability of the cause appears in
the environment.• Effect CPT: Conditional Probability Table for the effect
variable.

Fig. 4. Overview of our methodology for detection of latent variables by inference using geolocalized sensed data. We use the geolocalized images todetect variables of interest (e.g. fire and human detection). This information prorvides the evidences that the inference engine receives as input. The outputrepresents the fusion between the experts’ knowledge (defined by the probabilistic rules) and the evidences.
V. INFERENCE ENGINE
The proposed approach is focused on fusing informationfrom different sensors and a-priori expert’s knowledge inorder to infer about latent variables that can not be directlydetected. There is no physical sensor to identify if a personis in danger, but an expert can give the key information tocreate inferences based on sensed data. Therefore, we use theknowledge representation of section IV to extract the users’expertise and combine it with sensed data.
The use of Bayesian Networks gives a way to create rela-tionships about different variables. Some approaches createa strong assumption about a fixed structure for the Bayesiannetwork [2] and others do not work on continuous spaceor geo-localized environments [6]. Our proposal is aimed toavoid those restrictions, we define a method to dynamicallycreate the structure of the Bayesian network based on geo-localized information.
Figure 4 shows an illustration describing how our methodworks in the context of detecting people in danger after acatastrophe. The inference engine has as input the experts’knowledge defined by the set of rules R and the sensors’detections as a set of evidences E . In this case, our sensorsreceive aerial photos with GPS coordinates and orientation.For visual sensors, each image must be processed to detectobjects of interest. In the context of detecting humans indanger, we detect the entities people and fire.
The inference engine works in environments that can bedefined in the Euclidean space R2. There is a set of classesor type of elements T that can be detected by physicalsensors. Then, the punctual evidences ei ∈ E are points inthe environment, which were captured by a sensor.
After the rule definition stage, and new evidences appear,the algorithm 1 is executed in order to create the structureof the Bayesian network, represented as a directed graph,based on the rules in R and the evidences E . This algorithminitially create a new vertex for each evidence (line 1), anda empty set for the edges (line 2). The loop from line 3to 13 is repeated while no vertex or no edges appear aftertriggering a rule. In other words, when the set of verticesV is not empty, and the vertices as the edges are different
from the computed in the last iteration. The set of rules R isapplied for the new and old vertices V ′∪V (line 7) in oder toobtain new ones. Lines 8 and 9 apply the union for verticesV and edges E (it is important to remark that the sets donot contain duplicated elements). This process is repeatedcyclically until no new nodes are created and finally returnthe bayesian network with the graph structure (V,E).
Algorithm 1: InferenceEngine(Evidences E , Rules R)
1 V ← E2 E ← ∅3 while V 6= ∅ ∧ (V = V ′ ∩ V ) ∧ (E = E′ ∩ E) do4 E′ ← ∅5 V ′ = ∅6 foreach ri ∈R do7 Vr, Er ← r.infer(V ′ ∪ V )8 V ′ ← V ′ ∪ Vr9 E′ ← E′ ∪ Er
10 end11 E′ ← E′ ∪ E12 V ′ ← V ′ ∪ V13 end14 return BN(V,E)
We would like to aware that this algorithm has a hazard;when a cyclic rule is defined, the algorithm will fall in ainfinite loop. Hence, a rule definition must be validated apriori in order to avoid possible cycles.
VI. EXPERIMENTS
In our experiments, we simulated a catastrophe in anoutdoor environment, where there are some lied people andfire. The fire is represented by circular red cardboards. Weused an aerial robot (Asctec Quadcopter Hummingbird),Figure 5, equipped with cellphone (Samsung Galaxy S4) tocapture video at 30 FPS and resolution of 1280x720. Theangle of view is perpendicular to the ground. The objectiveis to detect people in danger based on fire and humandetections. In this context, a person is in danger when thereis fire close to it.

Fig. 5. Quadcopter used to collect the visual data used in the experiments.It’s used a cellphone camera to take pictures of the studied environment.
The quadcopter flies taking video of the environment atheight of approximately 5m. The ground-truth was createdby taking an aerial image at 30m that covers the holeenvironment. The experts’ knowledge representation, useddetectors, and the process to take the samples are describedas following.
A. Expert’s Knowledge
We defined five rules to represent the experts’ knowledge.The experts defined the relationship between the variablesand the CPT for each one.
1) Fire detection rule: a sensor rule with a trained sensorwith the mentioned probabilities.
2) Human detection rule: an affinity rule with the men-tioned probabilities for human detection.
3) Human in danger: a query rule to identify when thereare fire and human in a range of 2.0m with a jointfunction maximum probability of having fire.
4) People community: a community rule to identify morethan 2 humans in a radio of 2.5m.
5) Community in danger: similar to the human in dangerrule but using a radius of 3m.
B. Detectors
In this work, we try infer if some person is in danger ornot. For that reason, we define humans and fire as entitiesof interest. The entities in conjunction with the experts’knowledge can achieve the objective.
1) Fire Detector: Fire is one of the natural phenomenathat can be considered dangerous in cases of burnings orexplosions. We have represented fire in map as a red circle. Itdetects and highlights the position of red circles on a image,using a color filter, in the RGB color image space, and aHough transformation [16] for detecting the circular shapes.
2) Human Detector: The people detector was based on apedestrian detector, but with some additional treatment. Inan aerial image, a person lied in the floor can be seen asa pedestrian with a rotated angle θ. Normally a pedestriandetector is trained to detect people totally perpendicular tothe floor, i.e. an angle approximately of θ = π/2 with respectto the image. Therefore, we used the same detector but tryingwith a set of angles Θ with the intuition that the optimal value
θ for the detector will be approximately in the set Θ. As canbe seen in Figure 6 for a Θ of nine different angles. Weused the pedestrian detector latent-svm [17] with the trainedOpenCV implementation.
Fig. 6. Solution used to detect people lying on the ground using a pedestriandetector. The image is rotated into predetermined angles trying to find thecloser angle where the person is in a pedestrian like position.
C. Sampling the environment
The images generated in the aerial capture are exemplifiedin Figure 7, that demonstrate people in different positionsand rotations relative to the camera. It makes the simplepedestrian detector useless, because in rare cases the takenpicture match with the optimal angle θ.
Figure 8 shows the raw sensed data. It has many falsepositives and lacks of human detection. After creating theBayesian network and infering with it, the resultant processedinformation is shown in Figure 9. The pie chart representsthe confidence of having a human in that position (greenfor true). We can see that there are two humans that werenot detected. There were more false negatives than realdetections in that area, then the result of the Bayesiannetwork simply tries to create an estimation with the givendata and the a-priori information. It could be improved byfeeding the same points with a different detector in order tocomplement the information.
All the red circles were detected simulating fire. The resultfor humans in danger, and communities in danger is showedin Figure 10. The person with the green t-shirt were partiallydetected but it was not in danger because it did not have firearound. Only one community in danger where detected basedon the given radio.
We studied an static scene where the robot were samplingin small areas. At the end we combine them using theinference engine and identify that: three people are in danger(true-positives), a partially detected human, a not detectedperson (false-negative) and a partially identified group ofpeople by the community rule (As may be seen in Figure10). Those results are not very optimistic, taking into account

Fig. 7. People lying on the floor with different positions closer to the firemarker (red circle). Images used as input for the detection algorithm.
Fig. 8. Human detections. All the detections were geo-located andcombined for this image. The green human shapes represent a detectionand the black ones represent an area where no human was identified.
Fig. 9. Infered humans after the affinity rule. The pies represent theconfidence about the detections, where green is for positive belief and redfor negative.
Fig. 10. Humans in danger (pie charts in green) and Communities indanger (pie charts in blue)
that a person was not identified, but if we see the very noisyinput of Figure 8, the output of the proposal offers a relevantsummary to act in a hazardous environment.
VII. CONCLUSIONS
We proposed an inference engine to detect latent variablesfusing experts’ knowledge and sampled data by physical
sensors in geo-localized environments. We analyzsed ourapproach in a experiment that simulates a disaster and act asa first response system. The physical experiments showed thatthe information fusion improved the detections, not only toreduce the false-positives (given a very bad human detectorwith high probability for false-positives) but also to inferabout latent variables.
We experimentally showed that the use of different sensordata and expert’s knowledge based on Probabilistic rules andBayesian Networks is a potential approach. It improves theaccuracy about the detected elements and infer about latentvariables that can not be sample directly with a physicalsensor, for example the variable “human in danger”.
This inference engine can be extended to more complexshapes, such as polygons or lines. That increment can helpon detection of other types of cases, since it is based on rulespreviously constructed, making it a generic tool.
REFERENCES
[1] R. Andrew Russell, D. Thiel, R. Deveza, and A. Mackay-Sim,“Robotic system to locate hazardous chemical leaks,” Proceedings -IEEE International Conference on Robotics and Automation, vol. 1,pp. 556–561, 1995, cited By (since 1996)61.
[2] P. Drews Jr., J. Quintas, J. Dias, M. Andersson, J. Nygrds, andJ. Rydell, “Crowd behavior analysis under cameras network fusionusing probabilistic methods,” 13th Conference on Information Fusion,Fusion 2010, 2010.
[3] L. Rabiner and B.-H. Juang, “An introduction to hidden markovmodels,” ASSP Magazine, IEEE, vol. 3, no. 1, pp. 4–16, 1986.
[4] D. Heckerman, D. Geiger, and D. M. Chickering, “Learning bayesiannetworks: The combination of knowledge and statistical data,” Ma-chine learning, vol. 20, no. 3, pp. 197–243, 1995.
[5] M. T. Spaan, “Cooperative active perception using pomdps,” 2008.[6] M. Spaan, T. Veiga, and P. Lima, “Active cooperative perception in
network robot systems using pomdps,” IEEE/RSJ 2010 InternationalConference on Intelligent Robots and Systems, IROS 2010 - Confer-ence Proceedings, pp. 4800–4805, 2010.
[7] K. P. Murphy, “Dynamic bayesian networks,” Probabilistic GraphicalModels, M. Jordan, 2002.
[8] B. Grocholsky, J. Keller, V. Kumar, and G. Pappas, “Cooperative airand ground surveillance,” IEEE Robotics and Automation Magazine,vol. 13, no. 3, pp. 16–26, 2006.
[9] M. Garzon, J. Valente, D. Zapata, and A. Barrientos, “An aerial-groundrobotic system for navigation and obstacle mapping in large outdoorareas,” Sensors, vol. 13, no. 1, pp. 1247–1267, 2013.
[10] M. Rokunuzzaman, T. Umeda, K. Sekiyama, and T. Fukuda, “Aregion of interest (roi) sharing protocol for multirobot cooperationwith distributed sensing based on semantic stability,” 2014.
[11] K. B. Laskey, “Mebn: A language for first-order bayesian knowledgebases,” Artificial intelligence, vol. 172, no. 2, pp. 140–178, 2008.
[12] V. Tresp, J. Hollatz, and S. Ahmad, “Representing probabilistic ruleswith networks of gaussian basis functions,” Machine Learning, vol. 27,no. 2, pp. 173–200, 1997.
[13] S. Natarajan, P. Tadepalli, T. G. Dietterich, and A. Fern, “Learningfirst-order probabilistic models with combining rules,” Annals ofMathematics and Artificial Intelligence, vol. 54, no. 1-3, pp. 223–256,2008.
[14] L. Getoor, N. Friedman, D. Koller, and B. Taskar, “Learning prob-abilistic models of relational structure,” in ICML, vol. 1, 2001, pp.170–177.
[15] B. J. Frey and D. Dueck, “Clustering by passing messages betweendata points,” science, vol. 315, no. 5814, pp. 972–976, 2007.
[16] R. O. Duda and P. E. Hart, “Use of the hough transformation to detectlines and curves in pictures,” Communications of the ACM, vol. 15,no. 1, pp. 11–15, 1972.
[17] C.-N. J. Yu and T. Joachims, “Learning structural svms with latentvariables,” in Proceedings of the 26th Annual International Conferenceon Machine Learning. ACM, 2009, pp. 1169–1176.