
Detecting Impersonation Attacks in a Static...
84
Detecting Impersonation Attacks in a Static WSN Viktor Selleby, Anton Lin [email protected], [email protected] Department of Electrical and Information Technology Lund University Supervisors: Martin Hell, LTH Simon Johansson, Tritech Technology Examiner: Thomas Johansson 4th October 2017
Transcript of Detecting Impersonation Attacks in a Static...
Detecting Impersonation Attacks in a Static WSN
Viktor Selleby, Anton [email protected], [email protected]
Department of Electrical and Information TechnologyLund University
Supervisors: Martin Hell, LTHSimon Johansson, Tritech Technology
Examiner: Thomas Johansson
4th October 2017

c© 2017Printed in SwedenTryckeriet i E-huset, Lund
Abstract
The current state of security found in the IoT domain is highly flawed, a majorproblem being that the cryptographic keys used for authentication can be eas-ily extracted and thus enable a myriad of impersonation attacks. In this MScthesis a study is done of an authentication mechanism called device fingerprint-ing. It is a mechanism which can derive the identity of a device without relying ondevice identity credentials and thus detect credential-based impersonation attacks.
A proof of concept has been produced to showcase how a fingerprinting system canbe designed to function in a resource constrained IoT environment. A novel ap-proach has been taken where several fingerprinting techniques have been combinedthrough machine learning to improve the system’s ability to deduce the identityof a device.
The proof of concept yields high performant results, indicating that fingerprintingtechniques are a viable approach to achieve security in an IoT system.
Keywords — IoT, Device Fingerprinting, Machine Learning, Machine to Ma-chine Authentication, Impersonation Attacks, Spoofing Attacks, Wireless SensorNetwork
i

ii
Acknowledgements
Many thanks to Simon Johansson providing invaluable guidance during this thesisproject. Even more praise to him for being an encouraging and positive-mindedfriend throughout the duration of the project. We are also very grateful to Tritechfor giving us the opportunity and the resources to execute the project and also forletting us have free reign in deciding on thesis matter and direction of the project.Lastly, we would like to thank Martin Hell for being a very accommodating andflexible supervisor, not only making the whole academic process of this MSc thesispainless but also for giving us great advice on academic formalia.
iii

iv
Popular Science Summary
Two devices that communicate without presence of a human beingusually identify themselves using cryptographic keys stored in theirfirmware. Studies have shown that it is possible to extract such keysfrom the devices and thus impersonate them. The proposed solution tothis problem is to add an additional layer of security to identify suchimpersonations.
There exists several methods to authenticate a device that are not based on cryp-tographic keys alone. One such method is physical device fingerprinting whichstems from the fact that physical properties of a device contains some measure ofuniqueness. Thus, these physical properties can be used to authenticate a device.
Studies have previously been done to test the accuracy of such methods, how-ever, most have been tested in laboratory environments with high-end equipment.As a large number of the systems that communicate without human presence arelow-cost and low-power it was unclear if physical device fingerprinting would bepossible in such systems.
Two of the physical device fingerprinting methods analyzed were deemed possi-ble to implement, clock skew and RSSI mean clustering. Clock skew is based onminuscule differences in devices’ perception of time and RSSI mean clustering uti-lizes many antennae to see if a device moves to a different location.
Authentication tests using both of the implemented fingerprinting methods andfour tested devices showed very good results. The system demonstrated that itis possible to detect an impersonation attempt in all the tests and very rarelymisjudged a legitimate device as an impersonating device. However, the systemhas to be tested more extensively with an increasing number of tested devices aswell as in different environmental settings to see if the results hold.
v

vi
Contents
1 Introduction 11.1 Background . . . . . . . . . . . . . . . . . . . . . . . . . . . . . . . 11.2 Project Aims . . . . . . . . . . . . . . . . . . . . . . . . . . . . . . 21.3 Scope . . . . . . . . . . . . . . . . . . . . . . . . . . . . . . . . . . 31.4 Outline . . . . . . . . . . . . . . . . . . . . . . . . . . . . . . . . . 4
2 Preliminaries 52.1 Wireless Sensor Network . . . . . . . . . . . . . . . . . . . . . . . . 52.2 Machine Learning . . . . . . . . . . . . . . . . . . . . . . . . . . . . 72.3 F-Score . . . . . . . . . . . . . . . . . . . . . . . . . . . . . . . . . 8
3 Device Fingerprinting Techniques 93.1 Fingerprinting Flow . . . . . . . . . . . . . . . . . . . . . . . . . . . 93.2 Clock skew . . . . . . . . . . . . . . . . . . . . . . . . . . . . . . . 103.3 Inter Arrival Time . . . . . . . . . . . . . . . . . . . . . . . . . . . 123.4 Received Signal Strength Indication . . . . . . . . . . . . . . . . . . 133.5 Physically Unclonable Function . . . . . . . . . . . . . . . . . . . . 173.6 Preamble Manipulation . . . . . . . . . . . . . . . . . . . . . . . . . 183.7 Radio Frequency Fingerprinting . . . . . . . . . . . . . . . . . . . . 193.8 Radio Frequency Distinct Native Attribute Fingerprinting . . . . . . . 20
4 Attacks Against Fingerprinting Techniques 234.1 Clock Skew Replication Attack . . . . . . . . . . . . . . . . . . . . . 234.2 Packet IAT Attack . . . . . . . . . . . . . . . . . . . . . . . . . . . 234.3 Attacking RSSI . . . . . . . . . . . . . . . . . . . . . . . . . . . . . 244.4 Attacking RFF . . . . . . . . . . . . . . . . . . . . . . . . . . . . . 244.5 Attacks against preamble manipulation . . . . . . . . . . . . . . . . 254.6 PUF impersonation attack . . . . . . . . . . . . . . . . . . . . . . . 254.7 Hill-climbing attack . . . . . . . . . . . . . . . . . . . . . . . . . . . 254.8 Jamming and Denial of Service . . . . . . . . . . . . . . . . . . . . 264.9 Attacking the learning phase . . . . . . . . . . . . . . . . . . . . . . 26
5 Evaluation of Fingerprinting Techniques 275.1 Feasibility . . . . . . . . . . . . . . . . . . . . . . . . . . . . . . . . 27
vii
5.2 Distinguishability . . . . . . . . . . . . . . . . . . . . . . . . . . . . 285.3 Robustness . . . . . . . . . . . . . . . . . . . . . . . . . . . . . . . 285.4 Additional Hardware . . . . . . . . . . . . . . . . . . . . . . . . . . 305.5 Attack Persistence . . . . . . . . . . . . . . . . . . . . . . . . . . . 315.6 Evaluation Verdict . . . . . . . . . . . . . . . . . . . . . . . . . . . 31
6 Method 356.1 Developing the Testbed . . . . . . . . . . . . . . . . . . . . . . . . 356.2 Testbed Overview . . . . . . . . . . . . . . . . . . . . . . . . . . . . 376.3 Network Traffic Capture . . . . . . . . . . . . . . . . . . . . . . . . 396.4 Fingerprint Implementation . . . . . . . . . . . . . . . . . . . . . . . 396.5 Combined Fingerprint . . . . . . . . . . . . . . . . . . . . . . . . . . 41
7 Results 437.1 Clock Skew Results . . . . . . . . . . . . . . . . . . . . . . . . . . . 437.2 RSSI Results . . . . . . . . . . . . . . . . . . . . . . . . . . . . . . 487.3 Combined Results . . . . . . . . . . . . . . . . . . . . . . . . . . . . 52
8 Discussion 558.1 Test Bed and Data Capture . . . . . . . . . . . . . . . . . . . . . . 558.2 Clock Skew . . . . . . . . . . . . . . . . . . . . . . . . . . . . . . . 568.3 RSSI . . . . . . . . . . . . . . . . . . . . . . . . . . . . . . . . . . . 578.4 Combined Fingerprint . . . . . . . . . . . . . . . . . . . . . . . . . . 598.5 Future Works . . . . . . . . . . . . . . . . . . . . . . . . . . . . . . 59
9 Conclusion 61
Bibliography 63
viii

List of Figures
2.1 Visualisation of different network topologies commonly used in WSN 7
6.1 Overview of experiment system . . . . . . . . . . . . . . . . . . . . 386.2 System layout . . . . . . . . . . . . . . . . . . . . . . . . . . . . . . 39
7.1 Data from 1000 packets sent from device 00 . . . . . . . . . . . . . 447.2 Clock Skew quality produced by different devices . . . . . . . . . . . 467.3 Signalprint total average when applying different rules. . . . . . . . . 497.4 Signalprint f-Score when applying different rules. . . . . . . . . . . . 507.5 Fluctuation of raw RSSI and mean of 100 RSSI values. . . . . . . . . 51
ix

x
List of Tables
3.1 The fraction of false positives mapped to distance between nodes whenmaxMatches = (S1, S2, 5) ≥ 5 and minMatches(S1, S2, 10) = 0 isapplied. . . . . . . . . . . . . . . . . . . . . . . . . . . . . . . . . . 17
6.1 Transport media suitability . . . . . . . . . . . . . . . . . . . . . . . 37
7.1 Relationship between linear regression accuracy, sample size and send-ing frequency. . . . . . . . . . . . . . . . . . . . . . . . . . . . . . . 45
7.2 Clock skew threshold results . . . . . . . . . . . . . . . . . . . . . . 477.3 Clock skew threshold results per device . . . . . . . . . . . . . . . . 477.4 Clock skew results with isolation forest . . . . . . . . . . . . . . . . 477.5 Clock skew results with isolation forest per device . . . . . . . . . . 487.6 The most performant signalprint results per device . . . . . . . . . . 517.7 Isolation forest RSSI, system mean . . . . . . . . . . . . . . . . . . 527.8 Isolation forest RSSI . . . . . . . . . . . . . . . . . . . . . . . . . . 527.9 Combined fingerprint with only one receiver . . . . . . . . . . . . . . 537.10 Combined fingerprint with four receivers . . . . . . . . . . . . . . . . 53
xi

xii

List of Acronyms
• AP — Access Point
• BLE — Bluetooth Low Energy
• IC — Integrated Circuits
• IoT — Internet of Things
• LAN — Local Area Network
• MAC — Media Access Control
• M2M — Machine to Machine
• PDF — Probability Distribution Function
• PKI — Public Key Infrastructure
• PUF — Physically Uncloneable Function
• RF-DNA — Radio Frequency Distinct Native Attribute
• RFF — Radio Frequency Fingerprint
• RFID — Radio Frequency Identification
• RSSI — Received Signal Strength Indication
• SNR — Signal to Noise Ratio
• WLAN — Wireless LAN
• WSN — Wireless Sensor Network
xiii

xiv
Chapter 1Introduction
With the rise of Internet of Things (IoT), the number of embedded devices withInternet connectivity is seeing an exponential growth. A society that is fully con-nected down to the bare things in our everyday life has many benefits but does alsoraise a number of security concerns, autonomous authentication between machines–machine to machine authentication– being one of them.
Most IoT systems employ credential based authentication. Similar to smart hand-held devices or traditional mobile phones, it is the keys stored in the device’snon-volatile memory that are the very credentials on which the devices are au-thenticated. However, unlike smart hand-held devices, IoT devices do not enjoythe security of being carried on the owner’s physical being, they are most oftenunmanned and unmonitored. Thus, IoT devices are highly susceptible to attackswhere a potential adversary could extract the necessary credentials and pose asthe device in question.
1.1 Background
Authentication of embedded devices are in many cases credential based which canbe seen in [1] and [2]. A device is deemed authenticated by being able to producethe credentials, most often stored in a SIM-card or the device’s firmware, duringthe authentication procedure. Credentials in this context denotes the device’s PKIkeys. The type of authentication utilized is called machine to machine (M2M) au-thentication, where two machines interact with each other without the presence ofa human being.
In traditional use cases such as hand held smart devices or personal comput-ers, human presence is a fact. In such cases, an assumption can be made thatthe devices are not compromised since they are located at the owner’s physicalbeing. Thus a potential adversary does not have the physical presence necessaryto extract said credentials from the devices in question. However, what meansare available to assert that a physical device is not in fact compromised when theowner of said device is not physically present?
Experiments done in [3] showed that it is possible to retrieve the PKI keys by
1
2 Introduction
reading the flash of a node without expensive hardware or software. Thus, the pa-per emphasizes the need to secure such nodes. With the PKI keys, an adversarycan then impersonate a node as presence of the keys often is the only means ofauthentication when initiating a connection [4].
Research has been done on various authentication mechanisms that operate ontop of the traditional credential based authentication. In machine-metrics basedauthentication various metrics such as computation time given a certain randomproblem, hardware fingerprint and other characteristics can be used to deduce theidentity of the authenticating device. The core of the concept is to identify theproving party through information which cannot be readily found in the device’snon-volatile memory. Such mechanisms are often designed for more traditionalsystems such as personal computers or smart hand held devices. However, cansuch authentication models be extended to embedded systems where computa-tional resources are more restrained?
The target environment of this project is Tritech’s demonstration system con-sisting of end devices in the form of temperature sensors which are equipped withsystem on a chip Mighty Gecko [5], the sensors comprise a fog network whosegateway is realized by a Raspberry Pi with Internet connectivity which in turnis communicating with an Amazon Web Services (AWS) deployment. The AWSinstance enables an application interface which can be reached from desktops orsmart hand-held devices to read data from the different end devices but also tocontrol them. The design of the solution to be produced in the project will bespecifically aimed towards systems with similar characteristics to the ones foundin Tritech’s demonstration platform.
1.2 Project Aims
The main goal of the Master’s thesis is to investigate different means to contin-uously authenticate a device. This will be implemented in a monitoring systemdesigned to detect compromised nodes in an IoT network. Thus, the questionswhich this thesis will try to answer are the following:
1. Given a node in an embedded systems network whose private credentialshave been compromised, what mechanisms can be deployed to identify andsubsequently reject data originating from such a node?
(a) The methods for authentication which will be evaluated will fall withinthe category of machine-metrics based authentication, the core of theconcept is to identify the proving party through information whichcannot be readily found in the device’s non-volatile memory.
(b) Due to the resource constrained nature of the environment, an anal-ysis will be done on the hardware and software requirements of theimplemented system and how the resource demands scale in a networkof many nodes.
Introduction 3
2. From the analysis in 1, can a system be produced and tailored to fit ontoa resource constrained environment? What compromises will need to bedone in order to achieve such an implementation and what impact will suchcompromises have on the security level of the system?
3. Can the implementation produced distinguish between a legitimate and cor-rupt node regardless of possession of underlying credentials?
1.3 Scope
The scope of the MSc thesis is to investigate authentication techniques which areoperating on top of credential based authentication and apply these techniques toan embedded wireless system.
System Characteristics
The system in question will be a static one, nodes are fixed and will not changetheir spatial location without an explicit reconfiguration procedure where the newlocation of the node in question is registered. The network topology is star-shapedwith the access point acting as the center of the topology. The network hop countis limited to one hop, meaning that each node will have to be directly connectedto the AP. In order to conduct a well-defined discussion on the topic, a thoroughdefinition of terms used throughout the report is given.
• Credentials, data found in device memory which the device can use toprove its identity. E.g. MAC address and cryptographic keys.
• Embedded system, a system whose computational abilities are highlyconstrained in comparison to a more typical system where storage, CPUpower and power supply is not considered a highly limited resource. Anexample of an embedded systems is a wireless sensor network (WSN), wherethe connected sensors are constrained in their functional and computationalcapabilities.
• Authentication, the act of verifying the identity of a connecting party.An authentication procedure involves two parties: the proving party andthe verifying party. The former is in the context of the thesis a connectingdevice whose goal is to establish its identity. The latter’s function is toverify the identity of the proving party and subsequently accept or denyconnection based on the outcome of the verification.
• Compromised, a device’s credentials are said to be compromised if anadversary were to gain unlawful access to them.
1.3.1 Attack model
As mentioned in the background section, the thesis project will evaluate vulner-abilities in an embedded system where the credentials of one or more nodes havebeen compromised. Once the credentials have been compromised, they can be
4 Introduction
relocated to a device at the disposal of the attacker who now has the means topose as a compromised node. Consider Alice a proving node, Bob a verifying partyand Eve a malicious entity. In an authentication scheme where private public keypair constitute the means of authentication, Eve has gained access to the cryptokeys used between Alice and Bob. Being in posession of the crypto keys, Eve cannow impersonate Alice and send a message to Bob without Bob detecting it. Inthis project, a protocol will be created such that Bob should be able to detect if apacket originates from Alice or Eve, even if Eve in some way claims to be Alice.
1.4 Outline
The report will be structured as follows: Chapter 2 will present and describe basicconcepts to provide preliminary knowledge required to understand following chap-ters. Chapter 3 intends to describe the fingerprinting techniques discovered duringthe literature-study as well as methods to generate and authenticate a fingerprint.In Chapter 4, the attacks relevant to the thesis project are presented, includingattacks on the different fingerprinting techniques. An evaluation of the finger-printing techniques based on the previous chapters will be described in Chapter 5which will result in the techniques to pursue during implementation. In Chapter6, the experimental setup and methodology will be presented. The results fromthe experimentation will then be displayed in Chapter 7. Chapters 8 and 9 willdeal with discussion of results and conclusion respectively.

Chapter 2Preliminaries
This chapter will describe concepts relevant to the MSc project.
2.1 Wireless Sensor Network
A wireless sensor network (WSN) is a network of connected nodes that most oftenhave limited processing, computing and power resources. These nodes can beequipped with one or more sensors that in some way measure the environment [6].The number of nodes in a network range from a handful up to thousands. Oncedeployed, the network is left unattended and the nodes can either be static ormobile depending on their functionality and purpose [6].
2.1.1 Transport Media
The transport media used in a wireless sensor network can vary depending on theapplication and environment it is used in. Notable transport media in this contextinclude 802.11, Bluetooth Low Energy and 802.15.4 [7].
IEEE 802.11
IEEE 802.11 is a collection of standards for Wireless Local Area Networks (WLAN),the most prominent one being Wifi. Usage of 802.11 is most often seen in localnetworks where devices communicate on either 2.4GHz or 5GHz frequency bands.With a recently standardised specification [8] frequency band at sub 1GHz wereenabled. This makes 802.11 more appropriate to use in constrained environmentssince it provides larger wireless coverage, lower obstruction losses as well as smallerenergy consumption [9].
Bluetooth Low Energy
Bluetooth Low Energy (BLE) is an adaptation of Bluetooth that is designed forultra-low-power applications. This is achieved by reducing the number of chan-nels, data throughput, lower range among others [10].
5
6 Preliminaries
BLE defines two distinct device roles: central and peripheral. A central can man-age multiple connections with different peripheral simultaneously while a periph-eral can only be connected to one central. In context of WSN, an end node willmost often act as a peripheral. These can spend idle periods in sleep mode topreserve energy [11].
IEEE 802.15.4
The IEEE 802.15.4 standard [12] which technologies like ZigBee [13] and Thread[14] are based on. It is designed to provide communication where throughput issmall in order to enable inexpensive devices with constrained resources to be partof a wireless networks without rapidly depleting their limited power supply.
Received Signal Strength Indicator
Received Signal Strength Indicator (RSSI) [15] is a measure of the perceived powerof a received radio signal. It is expressed in decibels and takes on a negative value.The RSSI is perceived as stronger as it grows towards zero.
Signal to Noise Ratio
The Signal to Noise Ratio (SNR) [16] is a measure of how much power a signalhas relative the noise on the channel as described by (2.1).
SNR =Psignal
Pnoise(2.1)
As nodes in WSN often are low-power devices with low transmission power, a noisychannel can affect bit error rate and frame error rate negatively.
2.1.2 Network Topology
To be able to act upon the sensor data generated by each node, the nodes has to beable to communicate with a base station. How the communication between a nodeand a base station is done is decided by the topology of the network. Commonlyused network topologies in WSN is star, multi-hop mesh and two-tier cluster [17]which can be seen in figure 2.1.
The star topology is based on the idea that every node in the network has adirect communication link with the base station. The two-tier cluster topologycan be viewed as an expansion of the star topology. Each node communicateswith a cluster head that in turn communicate with the base station. Thus, thebase station can communicate with many cluster heads which in turn can com-municate with many nodes [18]. In the multi-hop topology every node can relaymessages from other nodes, hence all nodes do not need to have a direct commu-nication link with the base station [17].

Preliminaries 7
(a) Star topology (b) Mesh topology
(c) Two-tier cluster topology
– Cluster Head
– Base Station
– End node
Figure 2.1: Visualisation of different network topologies commonlyused in WSN
2.1.3 Applications
WSN offers a lot of application areas including military, environmental, health,home and other commercial applications [19]. Applications that are static bynature and, thus, more relevant to this paper include:
• Home automation applications where sensors are part of domestic devicessuch as intrusion detection systems, smart meters, household appliances andmore.
• Environmental control in buildings as well as in smart agriculture.
• Environmental irregularity detection. Can be used for anything from nuclearlaunch detection systems to early forest fire detection.
• Industrial machinery.
2.2 Machine Learning
Machine learning is a field where a computer can be trained to make statisticalpredictions of unseen data based on previously recorded data. Many differentmachine learning algorithms exist and they can all be divided into two distinctcategories, supervised and unsupervised.
8 Preliminaries
2.2.1 Supervised Learning
In supervised learning, the algorithm requires a dedicated training set. It consistsof input and its corresponding output where the latter is labeled as belonging toa certain class. The algorithm then uses the labeled data set to find a mappingbetween input and output that can be used to predict the output of unseen input.
2.2.2 Unsupervised Learning
Unsupervised learning does, in contrary to supervised learning, not require anylabeled data set. Instead, the algorithm is trained with only input data. The gen-erated output then depends on the algorithm and its application. In an anomalydetection application using the Isolation Forest algorithm [20], the algorithm willgive a verdict on whether or not unseen data is reminiscent of the input dataobserved during training. A negative verdict will be given if a recorded value isabnormal considered the trained model and a positive one will be given if the datais considered to be in coherence with those in the training data [21].
2.3 F-Score
To measure the accuracy of a model, F-Scores can be used [22]. F-Score is calcu-lated with the rate of true negatives and true positives.
True positives is a measurement of how accurately a model generates positiveoutcomes given that the outcome is correctly assessed as positive. The true posi-tive score is always a value between 0 and 1. By taking 1 minus the true positiverate, the false negative rate is given. A false negative value is given when a posi-tive outcome is misjudged as a negative. A true negative is given when a negativeoutcome is correctly judged as a negative and on the contrary, a false positive isgiven when a negative outcome is misjudged as a positive.
Two measures can be derived from true positives and true negatives: Precisionwhich denotes how accurate a model is in detecting negatives and recall whichindicates the model’s accuracy in regards to positives. The equation for precisionand recall can be seen in (2.2) and (2.3) where FP is false positives, FN is falsenegatives and TP is true positives.
Precision =TP
TP + FP(2.2)
Recall =TP
TP + FN(2.3)
With the precision and recall, the F-score can be calculated as in (2.4). As can beseen by the equation, F-score is a combined measure of precision and recall thatranges from 0 to 1. Because of this, the F-score can be described as a measure ofthe accuracy of a model.
F = 2× precision× recallprecision+ recall
(2.4)

Chapter 3Device Fingerprinting Techniques
In this chapter, techniques to extract device specific attributes – device finger-prints – in order to uniquely identify a device will be described. An evaluation ofthe various techniques will be done in Chapter 5.
Device fingerprinting techniques can be divided into two categories, active andpassive fingerprinting [4]. The former refers to the fact that the verifying partyperforms some form of active interrogation, causing the proving party to activelyrespond to said activity. It is the interrogation data on which the verifying partywill build the fingerprint. Conversely, passive techniques does not require an in-terrogation phase to collect data from the verifying party. Data is gathered bymonitoring network communications between the two parties, from this a devicefingerprint is achieved.
By putting as much logic and computation at the verifying party, the attack sur-face of the system is limited. For this reason, passive fingerprinting techniques arethe main focus of this thesis.
3.1 Fingerprinting Flow
Fingerprinting techniques can vary significantly in their approach and core fun-damentals. However, on a higher level, most fingerprinting techniques follow thesame steps in their respective procedures [23] [24] [25].
1. Learning Phase, a reference fingerprint is generated through data froma legitimate device and stored in the verifying device. This is then usedduring device authentication, where a derived fingerprint is compared withits corresponding reference fingerprint.
(a) Data collection. The data collection during the learning phase isextensive. A large data set is collected in order to produce a referencefingerprint that is representative for the device. If a small data col-lection is used to create the reference fingerprint, the effect of outliersand irregular data will have a greater impact.
(b) Fingerprint Generation. During this phase, fingerprinting tech-niques most often use the collected data to create a reference finger-
9
10 Device Fingerprinting Techniques
print with the use of statistical methods, which vary between finger-print techniques.
2. Authentication. Once a reference database has been created for all au-thorized devices, the system is open for connecting nodes.
(a) Data collection. The data set collected is significantly smaller thanthe one collected during the learning phase. This, in order to keepauthentication time to a minimum.
(b) Fingerprint Generation. The fingerprint generation is done in thesame manner as during the learning phase.
(c) Similarity Measurement. In order to authenticate a device, thedevice’s fingerprint has to be matched against the stored referencefingerprint for said device. Since fingerprints are estimations, an ex-act match is unlikely to be derived. Instead, a threshold is set whichdictates if the authentication fingerprint is considered a match againstthe corresponding reference fingerprint. Therefore, similarity measure-ment techniques are used not only to find similarity metric betweena derived fingerprint and its corresponding reference, but also to finda threshold value where the false negative and false positive rate areminimized.
3.2 Clock skew
A computer clock is driven by a quartz crystal. Due to sub-micron imperfectionsfound within said quartz crystals, each computer’s perception of time will differ.This holds for computers of identical component setup, with components of samemodel produced from one single manufacturing batch. Thus, a slight skew in timewill appear between two computers if time is measured with fine enough granu-larity. The differing perceptions of time is referred to as clock skew [23]and it isunlikely to be the same for any given pair of computers. A fingerprinting techniquehas been developed from this phenomenon and is based on deriving the provingparty’s clock skew relative the verifying party’s clock.
Research have shown various ways [26] [27] to identify a node through clock skew.The core concept is to collect data points over time, the points representing time ofdeparture and time of arrival for a network packet. In [23], the timestamps foundwithin TCP packets denotes the time of departure of the packet and the time ofarrival is recorded at the receiving end as soon as the packet arrives. When a dataset has been collected, statistical methods are applied to fit a function to the timeseries data. The derivative of said function constitutes the clock skew and thus itis ultimately the function’s derivative which dictates the identity of the provingparty.
Device Fingerprinting Techniques 11
3.2.1 Data collection
Although numerous clock skew techniques exist, they are all dependent on timeof departure and time of arrival in various forms. The authors of [23] have madeuse of the timestamps found in TCP packets or ICMP packets. In [26] [28], theauthors utilize management mechanisms found in the IEEE 802.11 standard toderive timestamps of high granularity from beacon probes. The beacon probes areused to advertise the existence of an Access Point (AP) and synchronize the clockof the connecting party with the AP’s clock. 802.11 beacon frames are sent between10 to 100 times per second which in comparison to regular TCP traffic proves tobe a source which will generate a large amount of data in a short amount of time.However, beacon frames are advertised by APs –not devices– which renders thedata collection approach in [26] useless in the context of this project.
3.2.2 Fingerprint Generation
The basis of generating a clock skew fingerprint is to calculate the offset in timewhich the proving device p has in relation to the verifying device v. In [29] theoffset o for a specific packet i is calculated by oi = vti−pti where vti is the time whenv receives packet i and pti is the time p sends packet i. The offset is calculatedfor j packets. The clock skew can then be calculated with linear regression as theslope between
∑j1 oi and
∑j1 v
ti where vt constitutes the x-axis and o the y-axis.
The accuracy of the clock skew is influenced by the total sample size used in thelinear regression as well as the number of outliers in the sample [29].
3.2.3 Similarity Measurement
As stated in Section 3.1, fingerprints are estimations rather than absolute truths.However, the similarity measurement dictates how precise the estimations willbe. For a given identity, a derived clock skew is compared to its correspondingreference clock skew. A clock skew fingerprint is a constant which makes thesimilarity measurement fairly trivial. The clock skew similarity metric is equal tothe difference between the derived clock skew sv and the reference clock skew forthe identity in question. A set error margin threshold will dictate whether or notthe device will be authenticated and is in the magnitude of parts per million (ppm).However, there is no definitive consensus regarding the value of said threshold inorder to uniquely identify a device [23] [26] [28].
3.2.4 Experiment Results
The author of [25] describes an experiment setup which was executed in an isolatedlab environment consisting of four computers of same specification, communicat-ing over wired connection. Under such conditions, it was concluded that an errormargin of 1ppm had to be set to uniquely identify a device. However, the condi-tions used in the experiment does not reflect real-world conditions in public placeswith real wireless user traffic. The experiment in [28] was performed in numerouslocations, all of them public places with a set of participating devices in the mag-nitude of hundreds. A sample size of 300 packets recorded under 30 seconds was
12 Device Fingerprinting Techniques
needed to generate a clock skew with 0.5 ppm precision. The experiment showedthat 88% of all tested clock skews managed to reach at least 0.5ppm error margin.
3.3 Inter Arrival Time
Packet inter-arrival time (IAT) analyses the inter-arrival time in a sequence ofpackets in order to derive a device fingerprint. Since IAT is based on the time ofreception, the technique is not dependent on timestamps found within the packetsthemselves. The implications of this is that IAT analysis is transport layer agnostic[30] [31]. Research seen in [31] pioneered packet IAT fingerprinting. The researchshowed how the technique could classify the device type of a proving AP i.e.the manufacturer and model of the AP. However, the technique was not able touniquely identify a device. Hence, the research was extended in [30] where thedevice type identification is complemented with machine learning techniques toarrive at a unique device identity.
3.3.1 Data Collection
In [31] [30], IAT fingerprinting is done against wireless network APs to detect rogueAPs. Data is extracted from the AP by generating a packet train at one of thewireless network nodes. The packet train emulates normal but intense networktraffic and is sent to put the AP in question under stress. The correspondingoutput from the AP is recorded, especially the packets’ shift in time. It is theshift in time between the output’s packets that constitutes the packet inter-arrivaltime.
3.3.2 Fingerprint Generation
Fast fourier transform is applied to the output of the data collection phase. Theinter-arrival times of the corresponding output to the packet train constitutes aninput signal which is used to generate a fingerprint to compare against knowndevice type fingerprints [31] [30].
The fingerprint is generated by applying wavelet transform to the input signal.More specifically, the input signal is run through a high-pass filter and the cor-responding output is saved as a wavelet transform coefficient and then used asinput in a new wavelet transform. This is done in a recursive fashion until at leastfive coefficients have been produced. The generated coefficients constitutes thedevice type fingerprint. Through empirical studies it is shown that coefficients 2through 5 are the values that show most variations between device types and arethus the ones from which one can most easily detect a deviating device fingerprint.In [32] [30], the authors extend upon this method by applying it to device identityas well. Thus, a system is derived which classifies device type and establishesdevice identity.
Device Fingerprinting Techniques 13
3.3.3 Similarity Measurement
The IAT analysis implementations [30] [32] use an approach where device typeclassification is used as a pre-procedure to establishing the actual device ID. Thisis done in order to reject illegitimate nodes at an early stage without having toexecute the full authentication procedure. Thus, two authentication steps areexecuted.
1. Device Type Authentication. The device type of an authenticating nodeis established. Packet IATs are collected, a device type fingerprint is gener-ated and matched against the reference database. The derived fingerprintmust match a reference fingerprint above a set similarity threshold and willeither be accepted or rejected based on this.
2. Device Identity Authentication. Based on the device type derived inthe previous step, the authenticating node will be matched against refer-ence device identity fingerprints of same device type. Similar to device typeauthentication, a given similarity threshold must be passed in order for theauthenticating node to be considered matched against a reference finger-print.
As stated, a similarity measurement is executed to match the fingerprint againsta set of known fingerprints found in the reference database. It is done by cross-correlating derived coefficient di against known coefficient ki where index 2 ≤ i ≤5. E.g. each derived coefficient is compared to its corresponding coefficient in aknown fingerprint. The output from the similarity measurement is a metric be-tween 0 and 1 for each coefficient. In the case of device type authentication, if thederived fingerprint belongs to a specific device type, the similarity measurementfor each coefficient will differ by no more than 10 parts per thousand. A similaritymeasurement between two differing device types will yield a deviation in the mag-nitude of 100 parts per thousand. In the case of device identity authentication, thesimilarity measurement must yield an output across all coefficients that is above agiven threshold. In [32], empirical studies showed that a 90% similarity thresholdwould yield minimal decision error rate.
3.3.4 Experiment Results
In [30] two experiments were performed, one in an isolated test environment andone in the live network of a school campus during peak hours. For both of theexperiments, packet trains were repeatedly sent to the proving devices. The packettrain sent was crafted in such a way that it would yield a response from the provingparty with the size of 2500 packets transmitted under a period of 0.4375s. In theformer experiment, an average true positive rate of 80% was produced. In thelatter experiment, the true positive rate decreased to 58%.
3.4 Received Signal Strength Indication
The Received Signal Strength Indication (RSSI) over a wireless network can beused as a means of fingerprinting. It is a technique which can be executed with
14 Device Fingerprinting Techniques
most standard wireless systems of today requiring no additional hardware. Fur-thermore, RSSI data can be read out from most standard wireless device drivers,further lowering the integrational effort of an RSSI based scheme.
3.4.1 Data Collection
The data collection in an RSSI scheme consists of monitoring the received RSSIlevel for each device on a packet basis [33]. I.e. for each received packet, thepacket’s corresponding RSSI level is recorded and the packet is annotated withthe sending device. In its simplest form the packets are recorded by a singlereceiver. In such a case the data holds one dimension and the verifying party canonly estimate the distance to the proving party. However, many schemes utilizeseveral receivers in order to achieve multi-dimensional and fine-grained localizationestimates [33] [34] [35] [36].
3.4.2 Fingerprint Generation
When building a device fingerprint based on RSSI techniques, one cannot derive afingerprint based on a specific RSSI value. Noise, multi-path effects and environ-mental variance will affect the wireless channel in such a way that RSSI for a givendevice will yield significant variations between measurements. Instead a multitudeof techniques have been researched to accommodate to wireless channel variancefactors. The approach described in [34] [36] utilizes the Euclidean distance in sig-nal space between clusters of RSSI values to differentiate devices. Signal spacedenoting the n-dimensional geometric space in which the recorded RSSI values ex-ists. Another technique makes use of a vector of receiver RSSI values, the vectormakes the device fingerprint in this case and is called a signalprint [33]. It is asimplistic approach to RSSI-based localization where the core of the technique isbased on the claim that the RSSI of a static node will not differ by more than 5dbbetween contiguous packets.
In [34], an approach is described utilizing k-means clustering of RSSI values. Thetechnique is based on the distance in signal space between two devices. As de-scribed above, one or multiple receivers can be used to record RSSI for a givenpacket. In the case of a single receiver, the signal space is one dimensional. Therecorded RSSI values for two devices whom are spatially separated, will yield twoclusters with their respective centroids located at different values along the X-axis.This can be further extended to a two-dimensional signal space, where the clusterswill be found in different locations on the plane. In this fashion one can add morereceivers in order to further differentiate devices in an n-dimensional signal space.
Research seen in [37] [33] gives an alternative approach utilizing signalprints asdevice fingerprints. A signalprint is a vector of arbitrary length where each cellrepresents an RSSI value from a given receiver. It is generated by aggregating theRSSI values from different receivers for a given packet transmission. The numberof receivers must be larger than one. The signalprint can be used in two ways,either with the raw absolute RSSI values or with differential values. The latter is
Device Fingerprinting Techniques 15
a modified signalprint where the smallest value is subtracted from all remainingvalues in the vector. This way, the impact of RSSI oscillation is reduced. Theexperiment makes use of six spatially distributed receivers. This due to a largernumber of receivers yielding a signalprint of greater accuracy. The authors of [33]argue that battery discharge will have a significant impact on the transmissionpower of a device. For this reason signalprints are used, since they in their dif-ferential value mode become agnostic of reducing transmission power of a batterydriven device.
The authors of [36] registered the RSSI values of 1500 different indoor locationson 86 APs. The resulting data collection was then used as a training set for threedifferent machine learning algorithms, namely, Random Forest, k-NN and JRip toassess which algorithm creates the most reliable device classification.
3.4.3 Similarity Measurement
In the case of using RSSI clustering [34] in signal space to differentiate devices,the collection of RSSI values for a given device acts as a fingerprint. A similaritymeasurement is done by calculating the distance between the centroids of thederived fingerprint and the corresponding reference fingerprint. If the Euclideandistance between the two is below threshold τ , the device is authenticated. Thecalculation of distance between the two RSSI clusters in a one-dimensional signalspace is given by
4P = 10γlog(d2d1
) +4S (3.1)
where P denotes the transmitting power, d1 and d2 represents distance of the twonodes to the receiver, τ is the path loss exponent and S is is the shadow fading,i.e. a PDF for attenuation due to radio channel distances. The equation for RSSIdistance in n-dimensional signal space is as follows
4D =√4P 2
1 + · · ·+4P 2n . (3.2)
The challenge of determining authentication threshold τ is to find a thresholdwhere the number of decision errors is minimized. This is done by comparing thecompound PDF for two devices d1, d2 placed at the same location and anotherPDF where d2 is relocated to a different location whilst d1 remains stationary. Thetwo PDFs will have their respective means in different locations along the X-axisbut a certain overlap can be seen between the tails of the two PDFs. The over-lap is used to produce a threshold where false negatives as well as false positivesare minimized. Hence, if communication is initiated with a node whose claimedidentity is a but produces an RSSI cluster whose distance to the reference clusterof a is above the set threshold, it will be considered illegitimate and subsequentlyrejected from the network.
The technique showcased in [37] has a twofold approach to detecting identity-based attacks. Firstly, a max matching rule is used to assert that two subsequentsignalprints S1 and S2 are originating from the same device. Secondly, the max
16 Device Fingerprinting Techniques
matching rule is combined with a min matching rule. The latter determines ifS1 and S2 have been sent from two different devices. A max matching rule isformulated as follows, signalprints S1 and S2 are assumed to originate from thesame device if the number of max matches between them is greater or equal toNmax. A max matching occurs when two corresponding values found in S1 andS2 respectively, show a difference that is less than or equal to threshold τmax. Therule notation for max matching is written as
maxMatches(S1, S2, τmax) ≥ Nmax . (3.3)
The min matching rule is defined as, signalprints S1 and S2 are sent from the twodifferent devices if the number of min matches between them is greater or equalto Nmin. A min matching is seen when two corresponding values in S1 and S2
are greater or equal to threshold τmin. The min matching rule is based on thefact that even though RSSI values from the same fluctuates, they usually do notsee fluctuation above 5 dB. Therefore, if a larger difference can be seen at manyreceivers for two subsequent signalprints, the packets in question can be assumedto arrive from two different devices. Similar to max matching, the rule notationfor min matching is
minMatches(S1, S2, τmin) ≤ Nmin . (3.4)
In [36], authentication was achieved on a packet basis. Meaning, every incomingpacket was classified using the three different machine learning models. As onlyclassification methods were used, every incoming packet was mapped to one ofthe 1500 locations registered during the fingerprint generation. Because of this, apacket sent from a previously unseen location would still be classified as belongingto one of the registered locations.
3.4.4 Experiment Results
In [34], the experimental setup consists of five receivers evenly distributed acrossan office floor where nodes located in 94 different locations have been placed. Inorder to evaluate an impersonation attack, a pair of nodes were randomly selected,where one acts as the compromised node and the other one as the impersonatingnode. Since the pair of nodes were chosen at random, the distance between themwould vary between executions. However, the summarized result shows that fora false-positive rate less than 5%, a 97% detection rate was achieved. When per-forming tests with a 6.1 meter distance between the two nodes, the detection ratereduced to 90%.
The experiment performed in [37] had a similar experiment setup to the oneseen in [34]. Distributed over an office floor, were 135 nodes acting as prov-ing parties. Six receivers were used to capture RSSI data. The experimentdid not explicitly measure detection of a spoofing device. Hence, no detectionrate metric was produced. Instead, the experiment evaluated the number offalse positives produced given a set of matching rules. For matching rules wheremaxMatches = (S1, S2, 5) ≥ 5 and minMatches(S1, S2, 10) = 0 a false positive
Device Fingerprinting Techniques 17
rate of 1.1% was produced. The fraction of false positives mapped to the distancebetween S1 and S2 when it was observed can be seen in Table 3.1.
Table 3.1: The fraction of false positives mapped to distancebetween nodes when maxMatches = (S1, S2, 5) ≥ 5 andminMatches(S1, S2, 10) = 0 is applied.
Pair distance False positive occurrences≤ 10m 99.0%≤ 7m 90.7%≤ 5m 72.2%
Results in [36] showed that Random Forest was the highest performing out of thethree algorithms tested. It achieved a classification accuracy, or false negative rate,of above 90%.
3.5 Physically Unclonable Function
A physically unclonable function (PUF) maps a set of challenges to a set of re-sponses based on a complex physical system [38]. PUFs are based on characteristicsof the integrated circuit (IC), such as memory elements, logic delays, resistanceand so on [39].
PUFs were first mentioned in [40], where it is proposed that manufacturing processalone create enough variations in the IC characterizations to be able to uniquelyidentify an IC. As a result of this, a PUF utilizes this uniqueness to provide ran-domness, i.e. given specific input, the PUF will generate unique output. Today alot of different versions of PUFs are being used and researched, e.g. Arbiter PUF,Ring Oscillator PUF, SRAM PUF, Butterfly PUF, Flip-flop PUF, Bistable RingPUF and more [41].
PUFs can, as described in [42], be divided into two primary types - strong PUFsand weak PUFs. Strong PUFs are capable to handle a large number of challenge-response pairs, in contrast to weak PUFs, which results in them being suited forauthentication purposes. Weak PUFs on are the other hand better suited for keystorage and key generation.
3.5.1 Data collection
The data collection, or enrollment phase, used by PUF is rather an active mappingof challenge-response pairs than a data collection. The verifying part generatesrandom data, that is sent to the proving device as a challenge. The challenge isthen used to generate unpredictable output, a response, via use of the PUF thatis sent back to the verifying device and mapped to the sent challenge [43].
18 Device Fingerprinting Techniques
3.5.2 Fingerprint Generation
The challenge-response pair generated from the enrollment phase are stored in theverifying part [43]. Thus, the PUF fingerprint consists of a number of challenge-response pairs, where the challenges are randomly chosen by the verifying partand the responses are generated by the PUF in the proving device.
3.5.3 Similarity Measurement
During authentication, the verifying part sends one of the previously stored chal-lenges to the proving part. If the response is not equivalent to that of the storedchallenge-response pair, the proving part is not authenticated [43]. To preventfalse positives, a number of challenges should be sent to the proving part [40].
3.5.4 Experiment Results
In [38] experiments which allowed a maximum 10 out of 128 bits to be incorrect toauthenticate a device showed promising results. A false positive rate of 2.1∗10−21and a false negative rate of 5 ∗ 10−11 was achieved.
3.6 Preamble Manipulation
Preamble manipulation is not a fingerprinting method in the sense that it canuniquely distinguish any kind of device. However, preamble manipulation can beused to separate different transceivers from each other [44]. Preamble manipula-tion utilizes that different transceivers, especially between manufacturers, responddifferently to alterations in the physical layer preamble. The preamble is normallyused to synchronize transmission timing between devices. It consists of a knownset of bits that indicate start of frame.
3.6.1 Data Collection
In [44] and [45] a USRP Software Defined Radio (SDR) is used to capture packetsand modify the preamble. Different alterations of the preamble are then producedand sent to a collection of different transceivers. A number of packets with com-pulsory replies, such as beacon requests, are then sent to the proving transceivers.For every packet with a manipulated preamble sent there are two possible out-comes, either a response is sent back or the packet is ignored. Thus, for everypreamble combination the proving transceivers can be divided into two groups,one with those that, despite the manipulation, responds to the packet and onegroup with those that do not.
3.6.2 Fingerprint Generation
Many preamble alterations are then tested and based on the groups generatedfrom the data collection a decision tree can be created. The fingerprint of anygiven transceiver can hence be described as a node in the decision tree.
Device Fingerprinting Techniques 19
3.6.3 Similarity Measurement
Devices can then be identified through the previously created scheme. This isdone by starting in the root of the decision tree and then following the pathcreated to the target node. If the device responds to each manipulated preamblein accordance to the decision tree, the device is authenticated.
3.6.4 Experiment Results
As preamble manipulation is based on a decision tree rather than matching agenerated fingerprint with a reference fingerprint the results are not comparablewith other fingerprinting techniques. Furthermore, the results presented in [44]and [45] are preliminary and more extensive testing has to be done to properlyevaluate the method.
3.7 Radio Frequency Fingerprinting
When two devices communicate on a wireless channel they send data by transmit-ting radio signals. When said radio signals are being generated several hardwarecomponents are being used, for example DA converters, power amplifiers and radiofrequency oscillators. Any variety in said components will slightly alter the gener-ated radio signal [39]. This makes radio frequency fingerprinting (RFF) indepen-dent of the location of the transmitting device, as long as it is in communicationrange of the receiver. However, the ability to identify devices based on RFF isstrongly affected by the SNR on the channel. As even little noise can affect thesignal characteristics used for authentication [46], thus, longer distances on noisychannels can increase the error rate.
There exists two different categories of RFF, transient based and modulationbased [47]. Transient based RFF utilizes differences in the turn-on/off transient ofa radio signal. Modulation based RFF does instead utilize differences in the partof the signal that constitutes the transmitted data. Differences in the data part ofthe signal include frequency, magnitude and phase errors due to differences in thephysical layer for example.
3.7.1 Data Collection
The differences in the transmitted signal caused by the hardware components canbe used to identify devices in a wireless sensor network [48] [49]. Attributes thatcan be extracted from the RF signal, and used for identification, include [50]:
• transient waveform
• instantaneous phase and amplitude of the signal
• the signal tendency
• transient ramp profile in a temporal range
• the evolution in time
20 Device Fingerprinting Techniques
To be able to extract such attributes, most researchers have used software definedradio platforms such as USRP N210 [24].
3.7.2 Fingerprint Generation
To avoid having to store a lot of data on the verifying part and to fingerprint a de-vice by individual RF characteristics a feature extraction can be done where redun-dant information is removed. One feature selection technique that can achieve thisis Empirical Mode Decompositions first introduced in [51] and described in [46].In Empirical Mode Decompositions the signal is decomposed into a set of IntrinsicMode Functions. Intrinsic Mode Functions are a finite number of sub-signals withdifferent frequency band, time and frequency distribution that together representthe whole signal. Thus, the differences in the Intrinsic Mode Functions can beviewed as differences in the signal. Other RFF extraction methods include Fouriertransform and Wavelet transform [49].
3.7.3 Similarity Measurement
Authentication is done by matching a testing fingerprint with a reference finger-print previously stored in the verifying part. There are a number of ways toachieve this, in [46] Transient Frequency Distribution is used to compare differentIntrinsic Mode Functions. In [49] methods such as Norm Difference and LinearDiscriminant Analyses strategy are described.
3.7.4 Experiment Results
Experiments in [24] showed that it was possible to identify a transceiver throughRFF given the SNR at the receiver is 15dB or higher, the experiments used seventransceivers of the same model. In [52] RFF combined with Bayesian filter achievedan average true negative rate of 94-100% intrusion detection, however, they do notmention the false negative rate or differences caused by SNR. The results in [53]presented a true negative rate of above 90% at an SNR of 12 or greater at thereceiver.
3.8 Radio Frequency Distinct Native Attribute Fingerprinting
All devices leak electromagnetic energy during normal operation that can be cap-tured by – for example – a near field probe connected to an oscilloscope [54]. RadioFrequency Distinct Native Attribute (RF-DNA) fingerprinting is based on the factthat such electromagnetic emissions can be used to uniquely identify a device. Theemissions can be both intentional and unintentional, where unintended emissionsare generated by components on the IC [55].
3.8.1 Data Collection
The RF-DNA fingerprint consists of attributes of the RF emissions such as ampli-tude, phase and frequency. In [56] and [57] these attributes, or characteristics, are

Device Fingerprinting Techniques 21
derived individually and the RF emissions are transformed into the attribute do-main in question. The statistical features – standard deviation, variance, skewnessand kurtosis – are then generated.
3.8.2 Fingerprint Generation
The features generated in the data collection are combined to form one sample,multiple samples are then collected to generate a device fingerprint through sta-tistical methods such as MDA training, which is described in [57].
3.8.3 Similarity Measurement
Devices can then be classified, or authenticated, as belonging to a specific groupof devices or in a device verification situation where a rogue device impersonatesa trusted device.
3.8.4 Experiment Results
Experiments [56] [57] showed that it was possible to correctly classify a device 90percent of the time with an SNR of 12dB in inter-manufacturer cases and with anSNR of 16dB in intra-manufacturer cases.

22 Device Fingerprinting Techniques

Chapter 4Attacks Against Fingerprinting Techniques
In this chapter, attacks designed to thwart the fingerprinting techniques listedin Chapter 3 will be discussed. Attacks against fingerprinting techniques aim toreplicate the behavior of a legitimate device in order to forge its correspondingfingerprint [32].
4.1 Clock Skew Replication Attack
Malicious entity Eve can observe network traffic between Alice and Bob. Further-more, she can collect timestamps and calculate the clock skew of Alice. Once theclock skew of Alice is captured, Eve can replicate the clock skew to cheat Bob [58].The replication is done by first calculating r according to (4.1), where s1 is theskew difference between Eve and Bob and s2 is the skew difference between Eveand Alice.
r =1 + s11 + s2
(4.1)
Every altered timestamp (t′i) is then calculated by (4.2), where t1 is the firsttimestamp.
t′i = t1 + r(ti − t1) (4.2)
There are more complex ways to calculate the altered timestamp that also canhandle changes to the sending period. However, they are based on the sameprinciple [58].
4.2 Packet IAT Attack
In [30] an approach to forge a packet IAT fingerprint is described. In the attack,an adversary has to compute the PDF of its own network communication alongwith the PDF of the legitimate node which is to be impersonated. Once the twoPDFs have been obtained, the difference between them has to be derived. ThePDF difference will dictate how the adversary will have to change the frequency ofits packet transmissions in order to emulate the behavior of the legitimate device.To emulate network behavior such as packet rate, an emulation tool like netemcan be used.
23

24 Attacks Against Fingerprinting Techniques
4.3 Attacking RSSI
RSSI fingerprinting uses spatial correlation to distinguish nodes [34]. I.e. nodesare identified based on their respective spatial location. Thus, the success rateof RSSI-based replication detection is dependent on how capable the RSSI fin-gerprinting system is when it comes to distinguishing devices that are in closeproximity to each other [59]. Experiment results in [34] show that detection ratedecreases as distance between adversary and the node being impersonated shrinks.When the distance between the two nodes is 4.6m, the detection rate can fall aslow as 55%. Thus, an adversary could place an illegitimate node close enough tothe node being impersonated in order to bypass detection. However, if multiplereceivers are used at the verifying party to measure the RSSI of a proving party,a multi-dimensional RSSI fingerprint is achieved. To successfully impersonate anode through the aforementioned approach, rather than matching only one RSSI,the adversary is now required to match all RSSIs registered at each antenna re-spectively.
4.4 Attacking RFF
In RFF fingerprinting signal characteristics unique to a device are captured byanalyzing a device’s wireless communication at the physical layer. In [60] twoRFF impersonation attacks are described, Impersonation by Feature Replay andImpersonation by Signal Replay.
4.4.1 Impersonation by Feature Replay
The approach is designed for modulation-based RFF fingerprinting and makesuse of an USRP SDR to craft a signal where the features extracted from thesignal of the legitimate device are replicated [60]. More specifically, the SDR isused to modify parameters frequency offset, SYNC correlation, I/Q origin offset,magnitude and phase errors of the frame. The modification of the parameters aredone according to recorded communication data of the device to be impersonated.E.g. to produce the correct frequency offset, an analysis is done of the powerspectrum density of the signal transmitted by the target device. One can derivethe carrier frequency from such an analysis and from this set the frequency offsetof the adversary node accordingly. The remaining parameters are set in the samefashion.
4.4.2 Impersonation by Signal Replay
The signal replay attack can be used for transient-based and modulation-basedRFF fingerprinting respectively. In contrast to the feature replay attack where asignal is modified to match the signal transmitted by the target device, a recordedradio packet is replayed in full [60]. With the help of a high-end arbitrary waveform
Attacks Against Fingerprinting Techniques 25
generator [61], the recorded packet can be regenerated and subsequently retrans-mitted with high precision. Impersonation by signal replay needs not know theunderlying signal features which are used to generate a fingerprint at the verify-ing party, it simply replays recorded packets in their entirety. Signal replay canbe further extended. By replaying parts of a recorded packet, a crafted payloadcan be embedded in a packet which utilizes parts of a previously recorded packet.However, in such cases the adversary requires in-depth knowledge of the specificfeatures relevant to the fingerprint generation in order to successfully impersonatea legitimate node with a crafted packet.
4.5 Attacks against preamble manipulation
As preamble manipulation only identifies different transceiver types, an attackerwith knowledge of the target system can use a similar transceiver to authenticate[44]. Additionally, an attacker can through the use of an SDR read the preambleand selectively ignore manipulated preambles to imitate the behavior of a specifictransceiver.
4.6 PUF impersonation attack
Despite its name, research have shown that PUFs are in fact cloneable [62]. A PUFcan be reverse engineered by estimating the various delays at the different logicalgates in the IC. From the gate delay estimations, it is possible to synthesize an ICwhich reproduces the same behavior as the target IC. However, measuring delayat gate-level requires high-end and fine-grained equipment which would result in ahigh cost of executing such measurements. Alternatively, a different approach canbe seen in measuring the global power leakage consumption and modify factors–which has a direct effect on global power leakage consumption– such as the inputvector of the IC, supplied voltage and thermal conditioning [63]. By doing so,multiple linearly independent equations can be produced in order to formulate asystem of linear equations from which the delay of each gate can be derived [62][64]. It is assumed that the attacker has obtained a detailed list of the PUF’scircuit design. Thus, a circuit design copy in combination with gate-level delayestimates is used to emulate a PUF.
4.7 Hill-climbing attack
A hill-climbing attack is an attack that can be harmful to most fingerprintingtechniques as well as biometric recognition systems [65]. The attack is based ona repetitive submission of data and can be compared to a more intelligent versionof brute-force attack that requires less memory [66]. In contrast to a brute-forceattack, a hill-climbing attack only needs to store the sent data that is closest tothe authentication threshold [67]. The attack requires that the adversary has aattained a side-channel to the verifying party where a similarity score can be readfor each authentication attempt. A similarity score telling the distance between
26 Attacks Against Fingerprinting Techniques
the most recent attempt and the authentication threshold. If the value was closerto the threshold than the previously saved, the new value is saved as a template.Following messages are then slightly altered versions of the template message [65].
4.8 Jamming and Denial of Service
Any fingerprinting technique that relies on features in the radio signal, such asRFF, RSSI and RF-DNA, are vulnerable to jamming as Eve can transmit a weakjamming signal to alter the characteristics of Alice’s signal enough to prevent Alicefrom authenticating [48] [47]. If the jamming signal is stronger, it can disrupt thewhole network and sabotage the authentication process no matter what techniqueis used [68].
4.9 Attacking the learning phase
If the learning stage is polluted by Eve, i.e. if packages sent from Eve is included inthe fingerprint generation of Alice, the reference fingerprint will be sabotaged [32].This could lead to Eve being able to authenticate as Alice even with the addedsecurity layer.
Chapter 5Evaluation of Fingerprinting Techniques
This chapter will discuss the various fingerprinting techniques with respect to fea-sibility to implement given the limited time frame, ability to distinguish differentdevices, equipment requirements and replication effort. The outcome of the evalu-ation will be a listing of the various fingerprinting techniques in order of maturityand applicability to perform fingerprinting in a static WSN.
5.1 Feasibility
The different fingerprinting techniques show various degrees of implementationaleffort. Hence, feasibility to implement a given fingerprinting technique is heavilydependent on the short time frame of the project. Below the implementational ef-fort will be discussed. Given the software engineering background of the authors,solutions that require hardware alterations in the device, such as PUF, will beoverlooked.
Clock skew has the advantage of being a software implementation. However, asthe clock skew requires timestamps from the proving device as described in Section3.2, TCP or ICMP must be used. As most computationally restrained systems donot implement any protocol with timestamps, such functionality has to be imple-mented. This differs from IAT as, even though it also bases the fingerprinting onpackets sent from the prover, it does not require timestamps from the transmit-ting device. Furthermore, a potential issue in both clock skew and IAT is wheretimestamping of a received packet should occur, i.e. when does the implementa-tion interpret a packet as being received. If a received packet is timestamped inthe upper layers of the stack, internal processes in the receiver such as queues inthe RX-buffer could lead to unwanted delays. On the contrary, timestamping apacket in the lower layers of the stack will many times be more time-consumingto implement.
Preamble manipulation requires generation of a decision tree before it can beused to classify devices. To be able to generate a decision tree, extensive exper-imentation with a large number of transceivers has to be done as described inSection 3.6. An undertaking which would most likely consume the majority of theimplementation time of the project.
27
28 Evaluation of Fingerprinting Techniques
RFF, RF-DNA and preamble manipulation all require external hardware to beable to identify devices. This could be difficult to integrate with the rest of theexperimental setup. Additionally, RFF and RF-DNA both involve complex mathe-matical theory to extract and interpret features from a wireless signal. Implement-ing such algorithms is a non-trivial task which itself could most likely constitutea number of MSc thesis projects.
Problems could arise when implementing RSSI functionality as reading and in-tegrating the RSSI value with the implementation could be more difficult thanexpected. Often times devices will present RSSI data for a network as a whole.However, achieving RSSI data on a per packet basis could also be difficult if itwould prove to be a performance sink for network interface hardware in caseswhere network traffic is lively and numerous packets are received simultaneously.
5.2 Distinguishability
Each fingerprinting technique described in Chapter 3 provide different accuracyin classifying devices. The ability to distinguish one device from another can becompared to the uniqueness of a generated fingerprint. Fingerprinting techniquessuch as preamble manipulation and to some extent IAT are only able to distinguishbetween different device types, i.e. they are not able to separate devices of thesame manufacturer and model. RFF and RF-DNA is able to identify individualdevices during optimal network conditions, however, in systems with low SNR theability to classify inter-manufacturer devices decreases significantly. Clock skew,RSSI and PUF are claimed to provide the means to differentiate on a device-level.
5.3 Robustness
Robustness is a measure of change of the fingerprinting data over time and in ex-tension a measure of stability of the initially produced fingerprint. Robustness hasa direct impact on the security of a system since the implication of low robustnessis that a fingerprint produced by a device at time t will be difficult to reproduce forthe same device at time t′. Hence, in the case of a fingerprint with low robustness,the reference fingerprint will have to be continuously updated in order to avoid ahigh rate of decisions error.
5.3.1 Data Variance
Major differences in robustness can be seen between fingerprinting techniques.The fingerprinting techniques IAT and clock skew found in Sections 3.3 and 3.2are highly dependent on timestamps over network communications. Therefore,network conditions with high variance will result in unstable data on which tobuild a fingerprint. In [23], the stability of clock skews were evaluated. A packettrace of 38 days for 69 devices was divided into data sets of 12 hours. For the12 hour fingerprints, the largest difference in clock skew for a single device during

Evaluation of Fingerprinting Techniques 29
the 38 days was 6.04 ppm. The mean for difference between 12 hour clock skewsarrived at 2.28 ppm. Recall that in [25] an optimistic threshold to uniquely iden-tify a device was set to 1 ppm. The mean variability for the 38 day experimentsurpasses this threshold with more than a 100%. The literature summarized inSection 3.3 did not contain an explicit evaluation of the stability of IAT finger-prints. However, fingerprint variance can be inferred from the various detectionexperiment results found in the same section. The best test result showed an 80%true positive rate, whilst worst case was the true positive rate decreased to 58%.In comparison, the test results from [28] presented a true positive rate of 88%.
The robustness of RSSI-based authentication schemes varies among the differentimplementations [34] [33] [35] [37]. The nature of RSSI is an unstable one where amultitude of factors all have an impact on the received signal. The techniques de-scribed in Section 3.4 are all designed with noise and signal attenuation factors inmind. In [34] the remedy against signal attenuation factors is double. Firstly, thedescribed approach makes use of several receivers. Secondly, the authentication isbased on the Euclidean distance in signal space between the derived fingerprint andits corresponding reference. The distance threshold dictating the authenticationof a node is determined through a rigorous process where the rate of error decisionis minimized. Thus, the impact of noise and signal attenuation factors is kept toa minimum. The RSSI experiment results seen in Section 3.4 are overwhelminglypositive. However, a major limitation can be seen in RSSI fingerprinting, the spa-tial location of a device is used as its identity. The implications of this is that twodevices located less than 6.1 meters from each other will be difficult to differentiate.
The authors of [37] presents the use of signalprints as a more simplistic approachto RSSI fingerprinting. A major positive is that the technique provides per packetauthentication. Hence, the verifying party does not need to capture x number ofpackets before generating a fingerprint, which is the case in [34]. Instead, givenproperly set matching rules, a single packet will suffice in detecting an illegitimatenode. However, the scheme draws on the sheer number of receivers rather thana rigorous statistical foundation when generating its fingerprint. A signalprintwhere the number of receivers is below six will produce a high rate of decisionerrors. One could argue that the approach is not as robust regarding the signalattenuation factors which [34] mitigates efficiently.
RF-DNA does in many cases show stable and robust results, however, some vari-ance can be noted. In [57] results showed that the general true negative rateof unauthorized devices is relatively high at 90% or greater. Nevertheless, for acertain device in the experiment the true negative rate of 15% was recorded, show-casing that significant variance exists.
In [53], experiments with 3 smart meters and 3 RZUSBsticks as authorized devicesand 3 RZUSBsticks as spoofing devices. The reference fingerprint consisted of datafrom 300 signals per device. Results showed that most of the spoofing attemptsachieved a true positive rate of above 90% while keeping false positive rate under2%. However, two of the spoofing attacks achieved false positive rates of 54% and32% respectively, given a true positive rate of above 90%.
30 Evaluation of Fingerprinting Techniques
Based on the previous work included in the thesis project there is no data vari-ance in the case of PUF and preamble manipulation described in previous research.However, as preamble manipulation fingerprinting is a classifier based on a manu-ally defined decision tree, any transceiver which is not part of the tree will yield anerror. This case could arise in a scenario of a heterogeneous network where a largenumber of transceiver types are communicating. It would be practically infeasibleto generate a decision tree for that large a number of transceiver classes.
5.3.2 Environmental Effects
The experiment results obtained in [28] which can be seen in Section 3.2 shows thatclock skew could function in real-life conditions. However, part of the experimentinvestigated variation of clock skew for a given device during the course of a day.Its results showed variations of 1-2ppm between clock skew measurements wheresignificant temperature differences could be seen. These were variations whichwould far surpass the 1ppm error margin threshold to uniquely identify a device.IAT, which in comparison to clock skew performed much worse in terms of truepositive rate and data variance, does not suffer from variations due to temperaturechanges.
RF-DNA and RFF is highly sensitive to the noise on the channel. Results in [53]shows that at low SNRs the average ability to correctly identify a device is verylow, e.g. 50% true positive rate at 3dB SNR. Similar results can also be seen inthe case of RF-DNA [57]. Furthermore, as the bit error rate is generally increasedwith low SNRs, authentication with PUF could be less applicable in low SNRs asit is based on number of bit errors as described in Section 3.5.4.
5.3.3 Device Aging
The scheme proposed in [34] has failed to account for the impact of battery dis-charge. Battery discharge has a direct effect on the transmitted signal powerand a reference fingerprint will be invalidated given enough time. In this respect,signalprints [37] outperforms the RSSI spatial correlation approach. By utilizingdifferential signalprints instead of the raw absolute value equivalent, the approachis unaffected by the impact of reduced battery energy on transmitted signal power.
5.4 Additional Hardware
Some of the techniques listed in Chapter 3 require additional hardware. Additionalhardware is in this case described as hardware components that is not included ina modern off-the-shelf personal computer. In the case of PUF fingerprinting, thephysical unclonable function is actualized through hardware. The PUF is an ICmounted on the proving device itself, as mentioned in Section 3.5.
RF-DNA, preamble manipulation and RFF requires additional equipment to beable to extract the features that form a fingerprint, as described in Section 5.1. In
Evaluation of Fingerprinting Techniques 31
contrast to PUF where the additional hardware is internal, the additional hard-ware in this case is achieved through external equipment. It comes in the form ofexternal radio signal capturing devices, e.g. an USRP SDR platform. IAT, RSSIand clock skew can be implemented without any additional hardware or hardwarealternations.
5.5 Attack Persistence
As described in Chapter 4 there exist attacks against most of the fingerprintingtechniques presented in Chapter 3. Most of the attacks are based on replicationof the legitimate fingerprint.
Replication attacks can be divided into two categories, those that require ad-ditional equipment and those that do not. The attacks listed against clock skewand IAT fall into the second category as they both require the attacker to alter thefrequency with which they send packets – which can be done purely in software.RSSI replication does not require additional hardware either as it is sufficient toplace an attacking node in proximity to the target node. RFF and preamble ma-nipulation replication fall in the first category as they both require the adversary tobe able to read features in the transmitted signals. In addition to that, RFF repli-cation also requires hardware that can manipulate the transmitted signal to matchthat of the target node. PUF replication attacks, although theoretically possibleas described in Section 4.6, can be seen the attack most difficult to pursue. Itrequires an adversary with in depth knowledge of the PUF-based authenticationscheme, copies of the PUF circuit connectivity and high-cost equipment.
Additionally, there are disruptive attacks that can increase the probability of au-thentication errors from a legitimate device. Fingerprinting techniques that arebased on features in the transmitted signal, such as RFF and RF-DNA, are par-ticularly vulnerable to such attacks.
5.6 Evaluation Verdict
Based on the various aspects of this evaluation, it can be seen that the fingerprint-ing techniques have reached different levels of maturity in their respective researchfields. Some are too unreliable to be included in a live authentication systemwhilst others could work in conjunction with other authentication mechanisms.The fingerprinting techniques will be enumerated by descending level of maturity.
1. PUF, the fingerprinting technique that outperforms the remaining tech-niques . This holds true across all features considered apart from feasibility.In regards to feasibility, the major drawback of PUF fingerprinting is thatit requires an IC that has to be mounted during the manufacturing processas it is difficult to do so subsequent to deployment.
2. RSSI, it maps the location of a device to the device’s identity. In a staticnetwork such an assumption is valid. The performance results of RSSI are
32 Evaluation of Fingerprinting Techniques
high, especially given many receivers working in parallel. However, draw-backs come in the form of difficulties in distinguishing devices which arecloser than 6m from each other and its dependence on multiple receivers torecord RSSI values per packet. This means that a large number of receiverswill have to be distributed across the network so that several RSSI valuescan be recorded for each message sent from each node in the entire network.
3. Clock Skew, shows overall strong results in uniquely identifying a device.However, the technique lacks in robustness since environmental factors suchas temperature has a large impact on the derived fingerprint during au-thentication. But if one could overcome such limitations, clock skew woulddefinitely be a mature fingerprinting technique fit to be incorporated into alive security system.
4. RFF, research shows promising results but is dependent on a high SNR aswell as short distances between proving and verifying parties. Hence, RFF-based authentication is infeasible in deployments where nodes are furtherthan 2m from the AP. Furthermore, additional hardware in the form of aUSRP or equivalent SDR is required at the receiving end. This proves amajor financial obstacle if one were to incorporate it in an already deployedsystem since the cost of the additional hardware is in the order of thousandsof dollars.
5. IAT,performance results will vary widely depending on device class. Certaindevice classes will contain devices which are easily distinguishable. Whilstother classes contain devices which prove to be indistinguishable. Further-more, in an embedded scenario, IAT might be too power consuming due toits large number of packets under short time frame that need be collectedin order to produce a fingerprint.
6. RF-DNA, looks very promising at first glance. However, when lookinginto details of experimental setups, it is clear that most of them are done inoptimal environments, with short distances and powerful receivers. Thus,the applicability of RF-DNA is highly limited and does not fit with the WSNscenario discussed in the thesis project.
7. Preamble manipulation, is deemed as not suited for use in an authen-tication system in its current state. Not enough research with differenttransceiver types has been done to evaluate the technique properly. If manydevices are to be considered when creating the decision tree, chances arethat the tree would get too big and consequently too power consuming dueto many round trips. Another disadvantage with preamble manipulation isthe fact that it can not uniquely identify specific devices, only transceivertypes.
The fingerprinting techniques to implement will differ from the top listings above.In the case of PUF it is not feasible to integrate it in to an pre-existing system,which is the topic of this thesis project. Furthermore, RFF seems promising toimplement, however, as it requires additional hardware that can not be obtainedgiven the limited resources of the thesis project. IAT seemed good at first glance,

Evaluation of Fingerprinting Techniques 33
however, it is designed for authenticating an intermediary node in a network suchas an AP. The burst of packets IAT requires to provide reasonable results doesnot fit the constrained environment of the thesis project. RF-DNA and preamblemanipulation both rate very low on the evaluation verdict hence they will not betested. In conclusion the techniques to implement will be clock skew and RSSI.

34 Evaluation of Fingerprinting Techniques
Chapter 6Method
This chapter will chronicle the different phases of the experiment execution. Firstlyidentifying what requirements needs be fulfilled by the experiment system and howthis informs the design and implementation of the testbed. Thereafter the trial anderrors of the packet capturing process and lastly the implementation and testingof the different fingerprinting techniques will be described.
6.1 Developing the Testbed
Clock skew and RSSI-based fingerprinting techniques impose a specific set of re-quirements on the experiment system. Each respective fingerprinting techniqueoperates on a specific set of attributes in the network traffic. Thus, the testbedmust be designed in such a way that for each packet sent in the wireless networkthe different attributes can be easily extracted. The network traffic attributes inquestion are packet departure timestamp, packet receiver timestamp and packetRSSI.
Furthermore, in the case of clock skew, timestamp data of high resolution andaccuracy is essential. Timestamp accuracy meaning that the timestamping occursas close as possible to the physical event in question. For instance, one could arguethat TCP packet timestamps do not satisfy the timestamp accuracy requirement.The time between injection of a TCP packet timestamp and the physical trans-mission of the packet in question can be highly variable [26]. TCP timestampsdenotes the time when the operating system has scheduled the transmission of thepacket. However, an arbitrary number of interrupts might occur between injectionof timestamp and the actual transmission of the packet and thus the packet depar-ture can be subject to a delay which is not reflected in the sending timestamp [26].In contrast, wifi beacon timestamps broadcasted by access points are consideredhighly accurate, the timestamping occurs in direct conjunction with transmissionof a packet when the network interface card has sensed the channel to be free. Sim-ilarly, the timestamp at the receiving end needs be generated close to the physicalreception of the packet. From this, two more requirements are imposed on thesystem: accurate timestamping at sender and accurate timestamping at receiver.The requirements of the system are the following:
35
36 Method
1. Sending timestamp of packet, used in conjunction with receiver times-tamp to enable clock skew.
2. Receiver timestamp of packet, used by clock skew.
3. RSSI of packet, essential for generating signalprints and other RSSI basedfingerprints.
4. Accurate timestamping at sender.
5. Accurate timestamping at receiver.
6.1.1 Technology Selection
The system requirements informs the selection of technologies which will comprisethe experiment system. The selection of protocol stack was limited to ones foundin the IoT domain. The main contenders being Thread protocol stack, BluetoothLow Energy and regular Wifi.
The Thread protocol stack was a natural option, being used in the Tritechdemo system with a tool suite readily available for use. However, when evaluatingthe API of the platform [5] on which Tritech’s demo system is built, it was estab-lished that RSSI data on a per packet resolution could not be achieved withoutmaking extensive modifications to the internals of the platform. As with manyregular desktop operating systems, the network interface hardware registers anRSSI upon receiving a packet. Nonetheless, the RSSI data is most often discardedbefore leaving kernel space [69]. As is the case with the demo platform. Moreover,the Thread protocol stack has yet to see widespread adoption in the IoT domain.Thus, it will not be compatible with a majority of off-the-shelf computers actingas a gateway devices. An external dongle is needed for a gateway to talk Thread.This has major implications on the accuracy of the receive timestamp. The ex-ternal thread dongle does not include an arrival timestamp with the informationforwarded to its host device, and therefore timestamping does not occur until thepacket has traveled through the dongle and reached the kernel of the gateway de-vice itself [70] which heavily decreases the accuracy of the timstamp.
In contrast, Wifi is a de-facto-standard in wireless home networks and does notface the same compatibility issues as Thread with off-the-shelf hardware, but sim-ilarly to Thread the wifi devices discard packet RSSI data before leaving kernelspace. The wifi devices were all running a Raspbian distribution of Linux and thekernel could without too big an effort be modified to retain RSSI data and thus letit travel all the way to user space. However, by doing so one would put the devicesin a monitor state where a device will listen to all packets sent in a network butit cannot send packets itself. For the means and purposes of the experiment, thedevices were required to be able to both send and receive packets.
Although relatively new, the Bluetooth Low Energy stack has seen widespreaduse and is readily available as a standard communications protocol in many recentdevices ranging from desktop computers to smartphones. The packet RSSI data
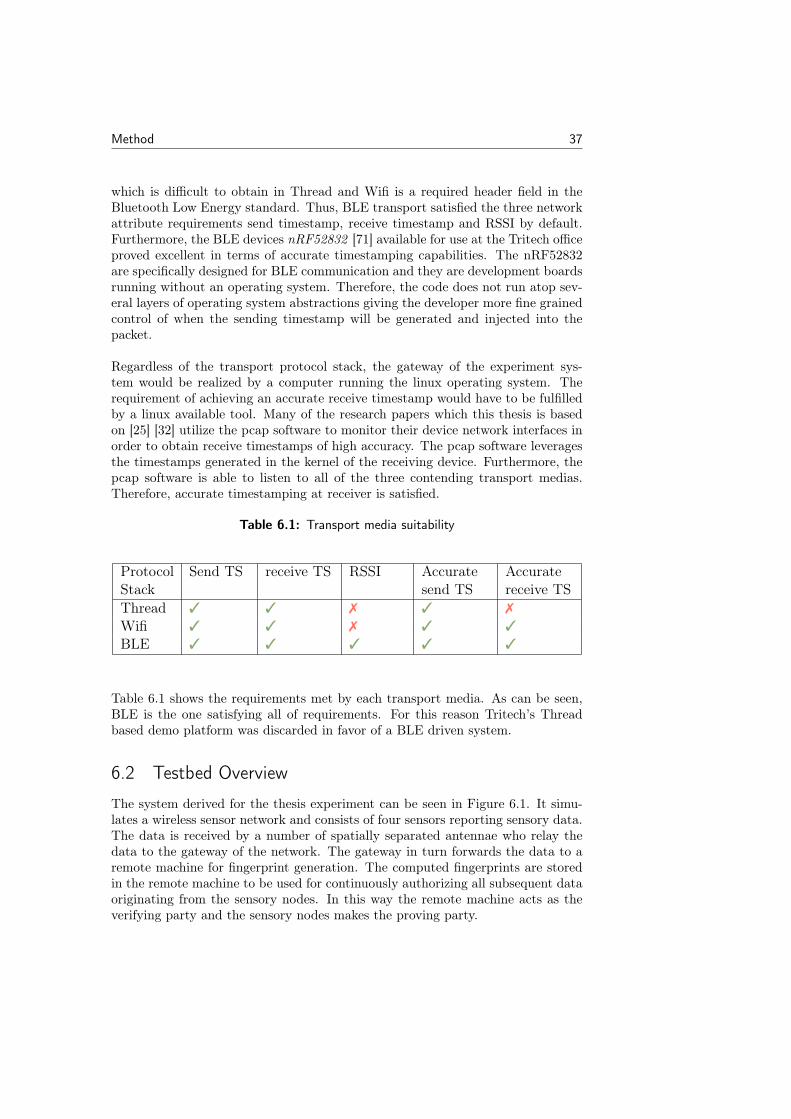
Method 37
which is difficult to obtain in Thread and Wifi is a required header field in theBluetooth Low Energy standard. Thus, BLE transport satisfied the three networkattribute requirements send timestamp, receive timestamp and RSSI by default.Furthermore, the BLE devices nRF52832 [71] available for use at the Tritech officeproved excellent in terms of accurate timestamping capabilities. The nRF52832are specifically designed for BLE communication and they are development boardsrunning without an operating system. Therefore, the code does not run atop sev-eral layers of operating system abstractions giving the developer more fine grainedcontrol of when the sending timestamp will be generated and injected into thepacket.
Regardless of the transport protocol stack, the gateway of the experiment sys-tem would be realized by a computer running the linux operating system. Therequirement of achieving an accurate receive timestamp would have to be fulfilledby a linux available tool. Many of the research papers which this thesis is basedon [25] [32] utilize the pcap software to monitor their device network interfaces inorder to obtain receive timestamps of high accuracy. The pcap software leveragesthe timestamps generated in the kernel of the receiving device. Furthermore, thepcap software is able to listen to all of the three contending transport medias.Therefore, accurate timestamping at receiver is satisfied.
Table 6.1: Transport media suitability
ProtocolStack
Send TS receive TS RSSI Accuratesend TS
Accuratereceive TS
Thread 3 3 7 3 7
Wifi 3 3 7 3 3
BLE 3 3 3 3 3
Table 6.1 shows the requirements met by each transport media. As can be seen,BLE is the one satisfying all of requirements. For this reason Tritech’s Threadbased demo platform was discarded in favor of a BLE driven system.
6.2 Testbed Overview
The system derived for the thesis experiment can be seen in Figure 6.1. It simu-lates a wireless sensor network and consists of four sensors reporting sensory data.The data is received by a number of spatially separated antennae who relay thedata to the gateway of the network. The gateway in turn forwards the data to aremote machine for fingerprint generation. The computed fingerprints are storedin the remote machine to be used for continuously authorizing all subsequent dataoriginating from the sensory nodes. In this way the remote machine acts as theverifying party and the sensory nodes makes the proving party.
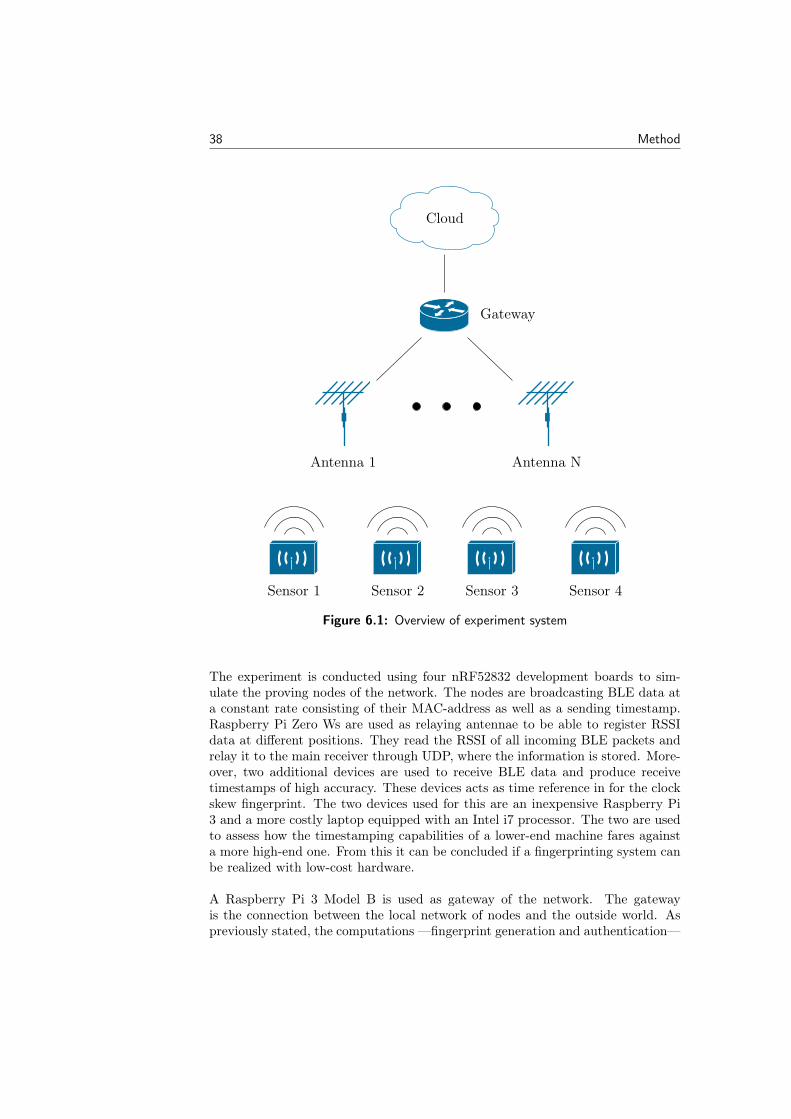
38 Method
Cloud
Gateway
Antenna 1 Antenna N
Sensor 1 Sensor 2 Sensor 3 Sensor 4
Figure 6.1: Overview of experiment system
The experiment is conducted using four nRF52832 development boards to sim-ulate the proving nodes of the network. The nodes are broadcasting BLE data ata constant rate consisting of their MAC-address as well as a sending timestamp.Raspberry Pi Zero Ws are used as relaying antennae to be able to register RSSIdata at different positions. They read the RSSI of all incoming BLE packets andrelay it to the main receiver through UDP, where the information is stored. More-over, two additional devices are used to receive BLE data and produce receivetimestamps of high accuracy. These devices acts as time reference in for the clockskew fingerprint. The two devices used for this are an inexpensive Raspberry Pi3 and a more costly laptop equipped with an Intel i7 processor. The two are usedto assess how the timestamping capabilities of a lower-end machine fares againsta more high-end one. From this it can be concluded if a fingerprinting system canbe realized with low-cost hardware.
A Raspberry Pi 3 Model B is used as gateway of the network. The gatewayis the connection between the local network of nodes and the outside world. Aspreviously stated, the computations —fingerprint generation and authentication—
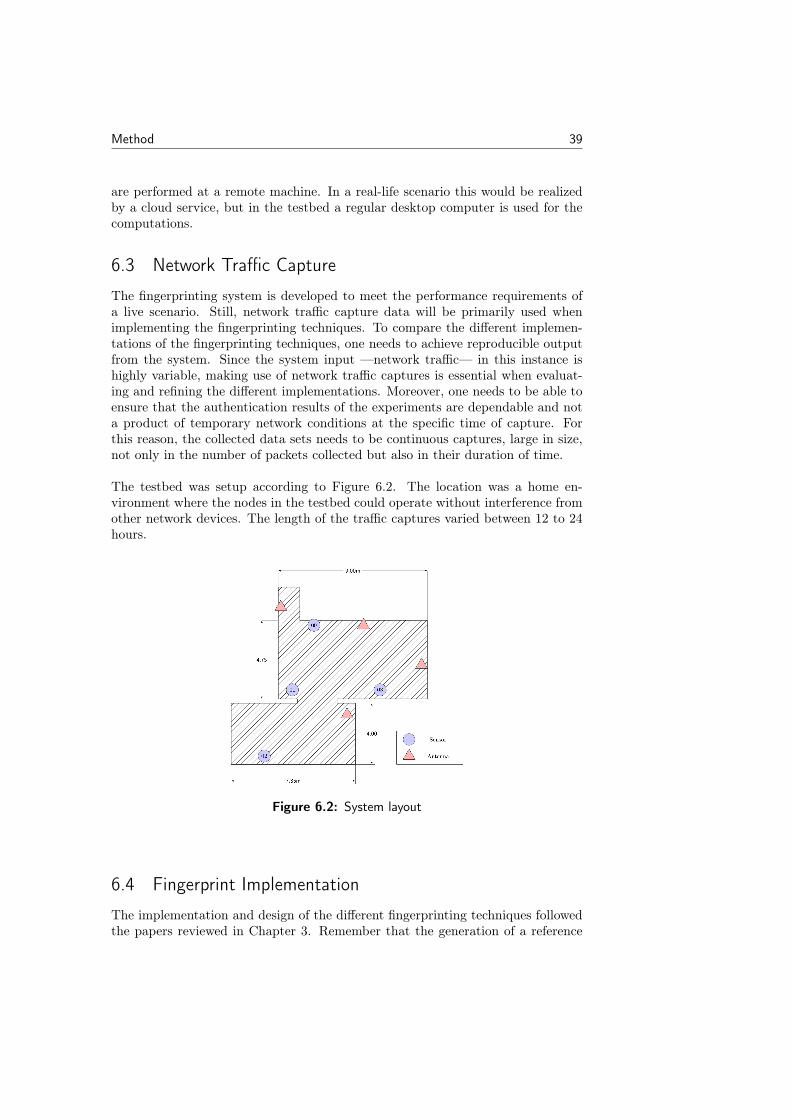
Method 39
are performed at a remote machine. In a real-life scenario this would be realizedby a cloud service, but in the testbed a regular desktop computer is used for thecomputations.
6.3 Network Traffic Capture
The fingerprinting system is developed to meet the performance requirements ofa live scenario. Still, network traffic capture data will be primarily used whenimplementing the fingerprinting techniques. To compare the different implemen-tations of the fingerprinting techniques, one needs to achieve reproducible outputfrom the system. Since the system input —network traffic— in this instance ishighly variable, making use of network traffic captures is essential when evaluat-ing and refining the different implementations. Moreover, one needs to be able toensure that the authentication results of the experiments are dependable and nota product of temporary network conditions at the specific time of capture. Forthis reason, the collected data sets needs to be continuous captures, large in size,not only in the number of packets collected but also in their duration of time.
The testbed was setup according to Figure 6.2. The location was a home en-vironment where the nodes in the testbed could operate without interference fromother network devices. The length of the traffic captures varied between 12 to 24hours.
Figure 6.2: System layout
6.4 Fingerprint Implementation
The implementation and design of the different fingerprinting techniques followedthe papers reviewed in Chapter 3. Remember that the generation of a reference
40 Method
fingerprint is required for each device before an authentication can take place.Additionally, a certain data set size is needed in order to perform a reliable au-thentication of a device against the aforementioned reference fingerprint. Thesmaller the required data set size, the sooner it can be determined if a node islegitimate or not. Hence, the aim of the experiment is to minimize the numberof packets required to generate a reference and authentication respectively whilststill producing reliable authentication results.
Once an initial implementation had been achieved, network traffic captures wereused to evaluate the implementation. Evaluation of the different fingerprintingtechniques would take the following steps:
1. Fingerprint specific parameters are set in order to trace what impact theyhave on the authentication correctness of the implementation.
2. A subset of the traffic capture is used to generate a reference fingerprintFref for each device in the network.
3. The remainder of the traffic capture is used to generate authentication fin-gerprints.
4. The true device ID of each authentication fingerprint Fauth is known, butin order to assess the reliability of the fingerprint implementation, Fauth
is authenticated against all Fref . Knowing the true ID of Fauth and Fref
one can immediately see if the fingerprinting implementation has decidedcorrectly in its authentication verdict.
5. After a set number of authentications against the fingerprint implementa-tion, the total false positive and false negative rate is calculated.
In this manner, the fingerprinting techniques were implemented and further re-fined. Between each invocation of a fingerprint evaluation, the fingerprint parame-ters would be modified. The false positive and false negative rate acts as a measureof the implementation’s overall performance. To obtain a single metric on whichto compare the different implementations, the f-score was derived from the falsepositive and false negative results.
6.4.1 Clock Skew
The clock skew implementation used was heavily influenced by [29] to computethe individual skews using offset between received and sent time for each packet.To detect impersonating nodes, two different methods were used, one thresholdsolution and one machine learning solution using Isolation Forest [21].
Threshold solution
Based on the research in Chapter 3, most previous experimentation with clockskew have used a threshold value of some kind to separate legit from corruptnodes. Because of this, a threshold solution that takes the mean of a number ofclock skews then checks if a packet to authenticate is within a certain error margin
Method 41
was implemented. Different values of the error margin was tested to find the mostsuitable value.
Isolation Forest solution
In addition to the threshold solution a machine learning solution based on Iso-lation Forest was created. The reason for this was mainly the fact that it wasdifficult to visualize how a threshold solution for a combined fingerprint would beimplemented. The Isolation Forest solution was because of this tested on the clockskew values alone as well to find the conditions under which it performs the best.
6.4.2 RSSI
Two RSSI-based implementations were derived based on the techniques describedin Section 3.4, signalprints and RSSI fingerprinting through unsupervised learning.
The motivation behind the signalprint technique [37] is that node compromisa-tion can be detected on a per packet basis with RSSI-based fingerprints. Thethesis of the authors of [37] is that, even though highly variable, the RSSI of astatic node will not differ by more than 5dB between subsequent packets. Thus,a variation larger than 5dB can be seen as a sign of node compromisation. A sig-nalprint is a vector of RSSI readings from different antennae for a given networkpacket. As described in Section 3.4, rules were set for how strictly contiguous sig-nalprints should be judged. When evaluating the signalprint implementation, thestrictness of the signalprint rule was gradually changed from the most lenient ofsettings to the most rigorous, to find the setting that produced the highest f-score.
The second RSSI implementation was influenced by the findings in article [36]where a random forest classifier is used for classifying the location of moving ob-jects in an indoor environment. In contrast to said system, the aim of the RSSIfingerprinting in the testbed is to assess the location of a static node. For thisreason, a more simplistic implementation has been derived. The authors of [36]used single RSSI values as input to their positioning system to achieve a rapidsystem response. The system of the MSc project does not have as strict timingrequirements. Thus, it can afford to take time to aggregate RSSI values for eachrespective antenna. It then computes the average of the aggregated values anduses it as system input. The aggregating and averaging of RSSI data is done inorder to decrease the effect of variance in the RSSI data and consequently increas-ing the stability. To find the minimum viable data set size required to generatereliable RSSI fingerprints, the number of RSSI values aggregated was decreasedbetween executions along with the total size of the training data set.
6.5 Combined Fingerprint
In the last step of the experiment, it was assessed if an authentication verdictproduced by a combined fingerprint would perform better than the comprising
42 Method
fingerprinting techniques individually. More specifically, the combined implemen-tations were clock skew and RSSI fingerprinting through unsupervised learning.The two demonstrated best results during the individual evaluations. and werealso the techniques which were most easy to reason about when considering a com-bined fingerprint.
In the combined fingerprint, Isolation Forest was used with clock skew as onefeature and each antennae used as a feature each. Two experiments will be con-ducted, one where the clock skew and only the RSSI value originating from thegateway receiver will be used and one where the clock skew as well as the RSSIvalues from four receivers will be used.

Chapter 7Results
In this chapter, the results of from the experimentations will be presented. Thechapter will be divided into three sections, where the results from the clock skewand signalprint experimentations will first be presented individually. Then thecombined results will be presented.
The four nRF52 development kits used as nodes are identified by their MAC-address. The MAC-addresses share the same first seven bytes (c0:ca:fe:ba:be) andonly differ in the last byte. Thus, the different nodes will be referred to as 00, 01,02 and 03.
7.1 Clock Skew Results
As described in Section 3.2 the size of the data sample affects the accuracy of agenerated clock skew. This section will present results from different aspects inthe generation of clock skews as well as authentication methods based on clockskew.
43
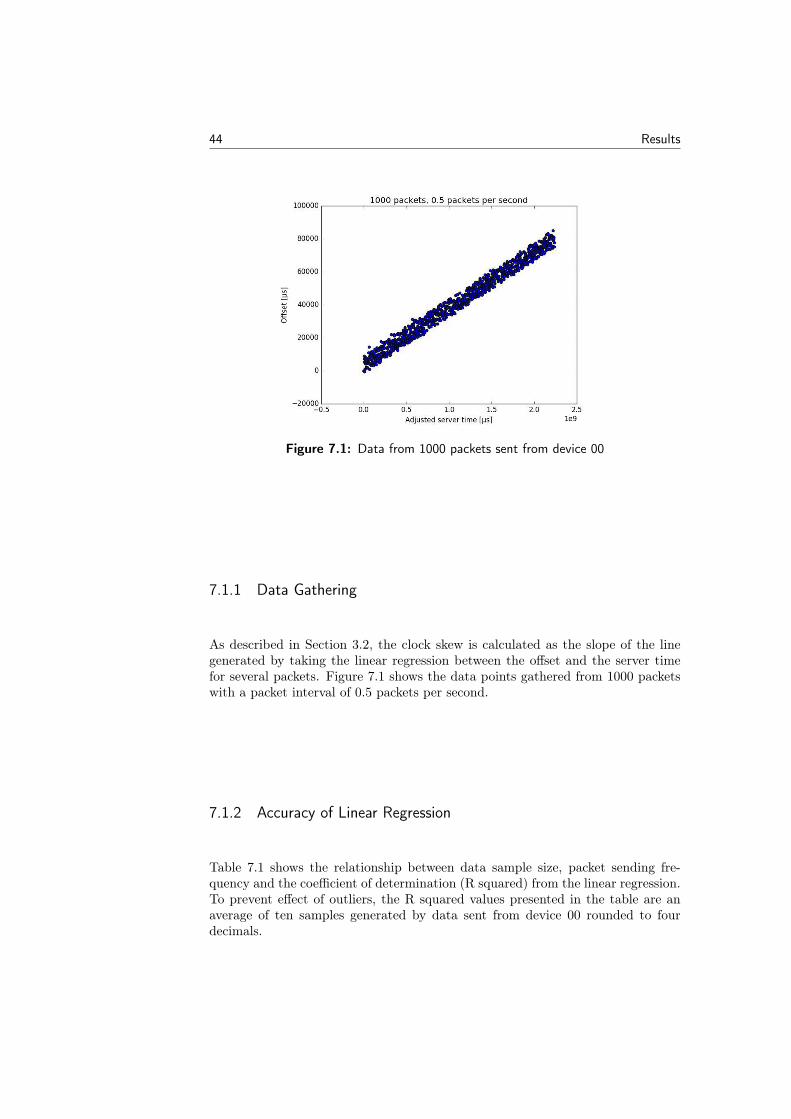
44 Results
Figure 7.1: Data from 1000 packets sent from device 00
7.1.1 Data Gathering
As described in Section 3.2, the clock skew is calculated as the slope of the linegenerated by taking the linear regression between the offset and the server timefor several packets. Figure 7.1 shows the data points gathered from 1000 packetswith a packet interval of 0.5 packets per second.
7.1.2 Accuracy of Linear Regression
Table 7.1 shows the relationship between data sample size, packet sending fre-quency and the coefficient of determination (R squared) from the linear regression.To prevent effect of outliers, the R squared values presented in the table are anaverage of ten samples generated by data sent from device 00 rounded to fourdecimals.
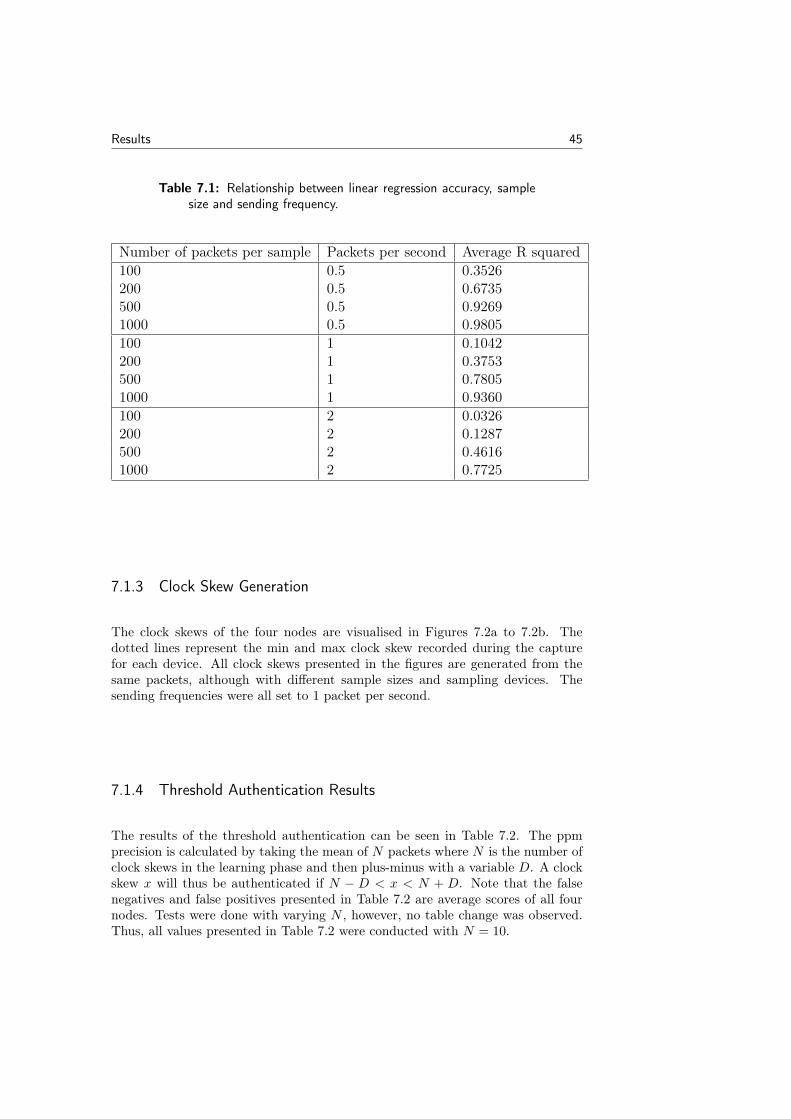
Results 45
Table 7.1: Relationship between linear regression accuracy, samplesize and sending frequency.
Number of packets per sample Packets per second Average R squared100 0.5 0.3526200 0.5 0.6735500 0.5 0.92691000 0.5 0.9805100 1 0.1042200 1 0.3753500 1 0.78051000 1 0.9360100 2 0.0326200 2 0.1287500 2 0.46161000 2 0.7725
7.1.3 Clock Skew Generation
The clock skews of the four nodes are visualised in Figures 7.2a to 7.2b. Thedotted lines represent the min and max clock skew recorded during the capturefor each device. All clock skews presented in the figures are generated from thesame packets, although with different sample sizes and sampling devices. Thesending frequencies were all set to 1 packet per second.
7.1.4 Threshold Authentication Results
The results of the threshold authentication can be seen in Table 7.2. The ppmprecision is calculated by taking the mean of N packets where N is the number ofclock skews in the learning phase and then plus-minus with a variable D. A clockskew x will thus be authenticated if N − D < x < N + D. Note that the falsenegatives and false positives presented in Table 7.2 are average scores of all fournodes. Tests were done with varying N , however, no table change was observed.Thus, all values presented in Table 7.2 were conducted with N = 10.
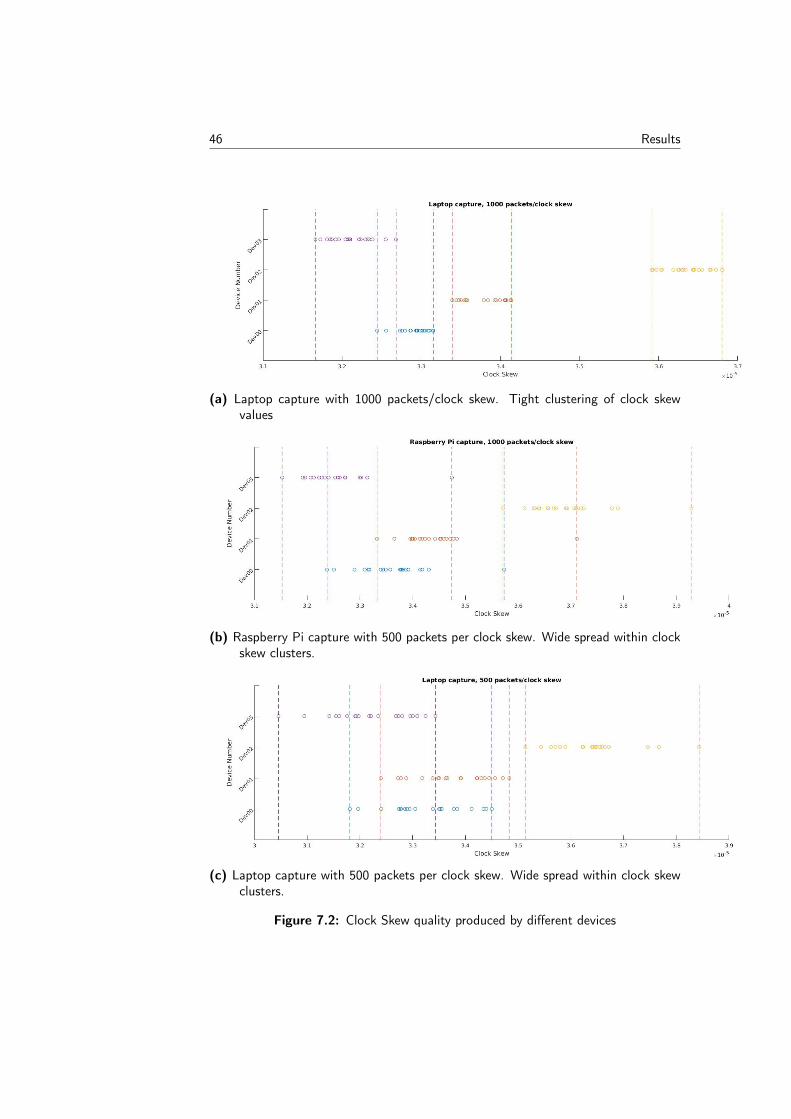
46 Results
(a) Laptop capture with 1000 packets/clock skew. Tight clustering of clock skewvalues
(b) Raspberry Pi capture with 500 packets per clock skew. Wide spread within clockskew clusters.
(c) Laptop capture with 500 packets per clock skew. Wide spread within clock skewclusters.
Figure 7.2: Clock Skew quality produced by different devices
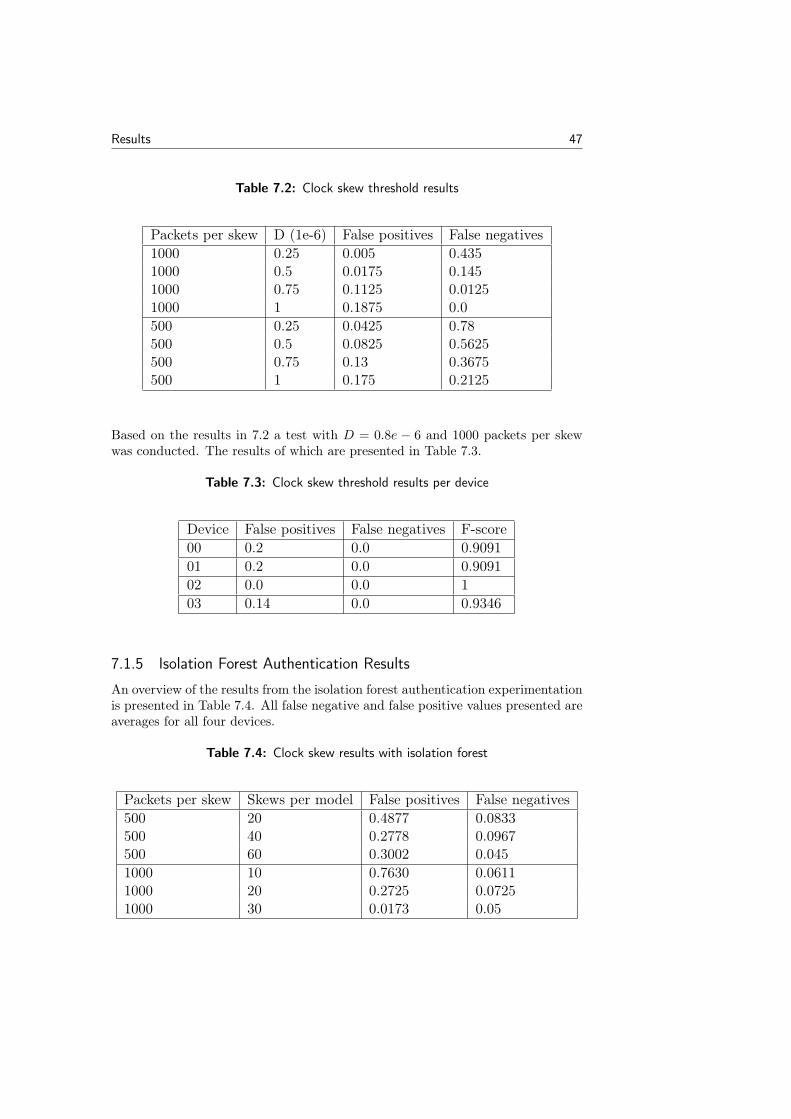
Results 47
Table 7.2: Clock skew threshold results
Packets per skew D (1e-6) False positives False negatives1000 0.25 0.005 0.4351000 0.5 0.0175 0.1451000 0.75 0.1125 0.01251000 1 0.1875 0.0500 0.25 0.0425 0.78500 0.5 0.0825 0.5625500 0.75 0.13 0.3675500 1 0.175 0.2125
Based on the results in 7.2 a test with D = 0.8e − 6 and 1000 packets per skewwas conducted. The results of which are presented in Table 7.3.
Table 7.3: Clock skew threshold results per device
Device False positives False negatives F-score00 0.2 0.0 0.909101 0.2 0.0 0.909102 0.0 0.0 103 0.14 0.0 0.9346
7.1.5 Isolation Forest Authentication Results
An overview of the results from the isolation forest authentication experimentationis presented in Table 7.4. All false negative and false positive values presented areaverages for all four devices.
Table 7.4: Clock skew results with isolation forest
Packets per skew Skews per model False positives False negatives500 20 0.4877 0.0833500 40 0.2778 0.0967500 60 0.3002 0.0451000 10 0.7630 0.06111000 20 0.2725 0.07251000 30 0.0173 0.05
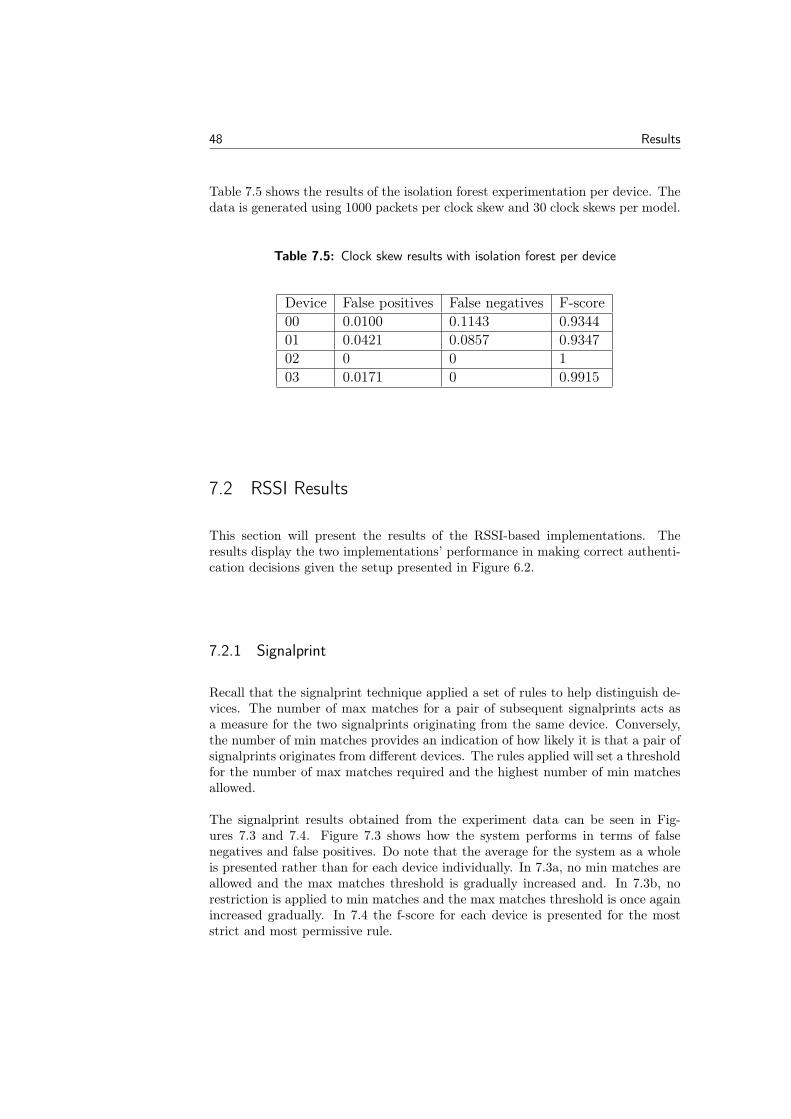
48 Results
Table 7.5 shows the results of the isolation forest experimentation per device. Thedata is generated using 1000 packets per clock skew and 30 clock skews per model.
Table 7.5: Clock skew results with isolation forest per device
Device False positives False negatives F-score00 0.0100 0.1143 0.934401 0.0421 0.0857 0.934702 0 0 103 0.0171 0 0.9915
7.2 RSSI Results
This section will present the results of the RSSI-based implementations. Theresults display the two implementations’ performance in making correct authenti-cation decisions given the setup presented in Figure 6.2.
7.2.1 Signalprint
Recall that the signalprint technique applied a set of rules to help distinguish de-vices. The number of max matches for a pair of subsequent signalprints acts asa measure for the two signalprints originating from the same device. Conversely,the number of min matches provides an indication of how likely it is that a pair ofsignalprints originates from different devices. The rules applied will set a thresholdfor the number of max matches required and the highest number of min matchesallowed.
The signalprint results obtained from the experiment data can be seen in Fig-ures 7.3 and 7.4. Figure 7.3 shows how the system performs in terms of falsenegatives and false positives. Do note that the average for the system as a wholeis presented rather than for each device individually. In 7.3a, no min matches areallowed and the max matches threshold is gradually increased and. In 7.3b, norestriction is applied to min matches and the max matches threshold is once againincreased gradually. In 7.4 the f-score for each device is presented for the moststrict and most permissive rule.
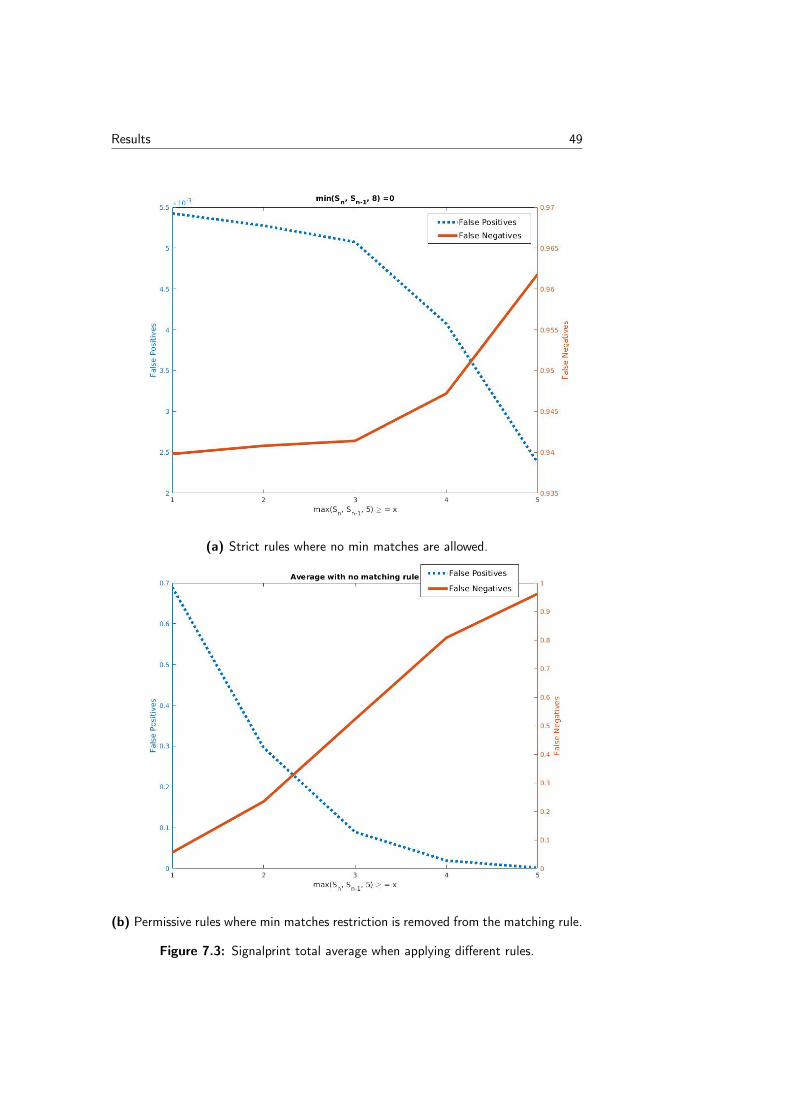
Results 49
(a) Strict rules where no min matches are allowed.
(b) Permissive rules where min matches restriction is removed from the matching rule.
Figure 7.3: Signalprint total average when applying different rules.
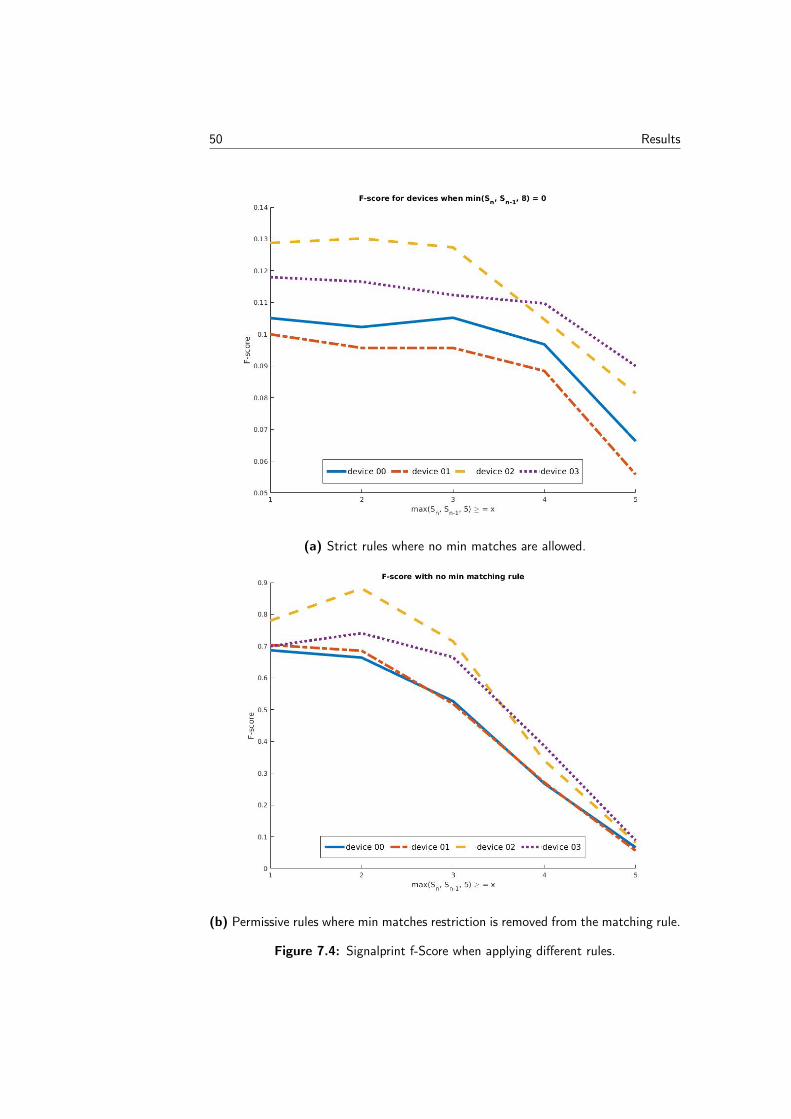
50 Results
(a) Strict rules where no min matches are allowed.
(b) Permissive rules where min matches restriction is removed from the matching rule.
Figure 7.4: Signalprint f-Score when applying different rules.
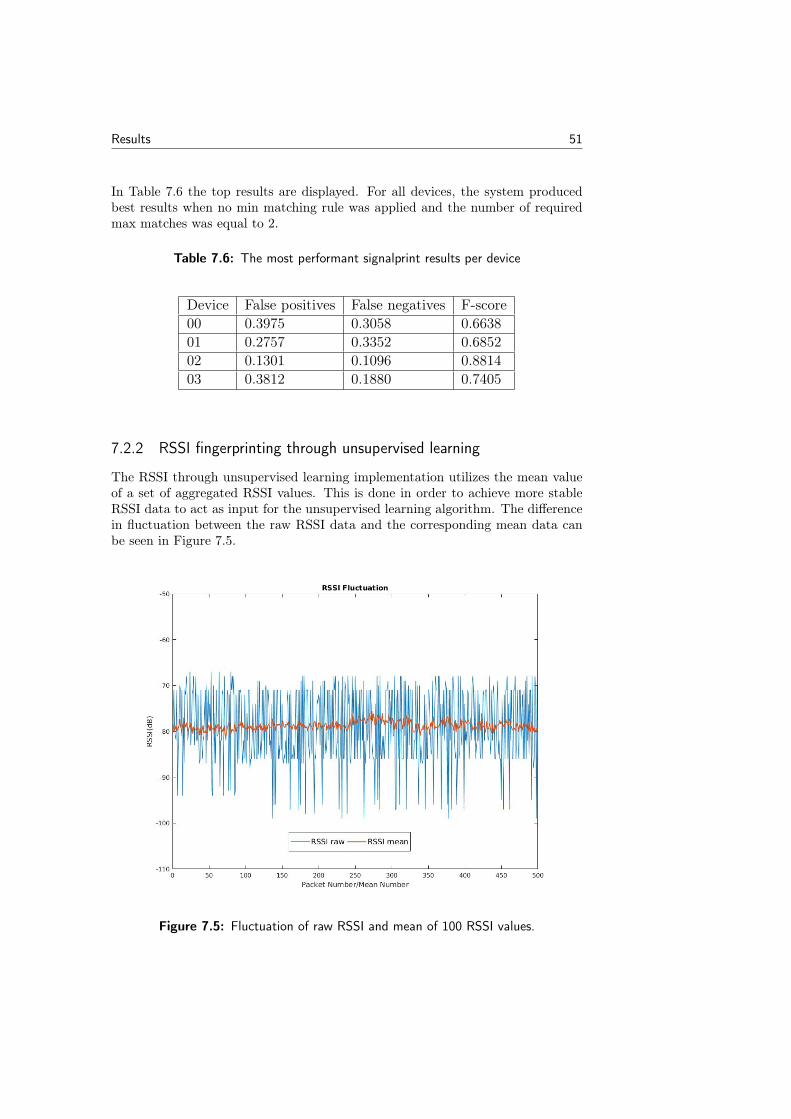
Results 51
In Table 7.6 the top results are displayed. For all devices, the system producedbest results when no min matching rule was applied and the number of requiredmax matches was equal to 2.
Table 7.6: The most performant signalprint results per device
Device False positives False negatives F-score00 0.3975 0.3058 0.663801 0.2757 0.3352 0.685202 0.1301 0.1096 0.881403 0.3812 0.1880 0.7405
7.2.2 RSSI fingerprinting through unsupervised learning
The RSSI through unsupervised learning implementation utilizes the mean valueof a set of aggregated RSSI values. This is done in order to achieve more stableRSSI data to act as input for the unsupervised learning algorithm. The differencein fluctuation between the raw RSSI data and the corresponding mean data canbe seen in Figure 7.5.
Figure 7.5: Fluctuation of raw RSSI and mean of 100 RSSI values.

52 Results
The performance results for the RSSI implementation utilizing unsupervised learn-ing are presented in Table 7.7. Do note that the false positive and false negativevalues are the derived mean for the system as a whole, not the individual de-vices. The packets per average column denotes the number of packets that wereaggregated and averaged. The averages per model column represent the numberof averages used to train the model.
Table 7.7: Isolation forest RSSI, system mean
Packets per average Averages per model False positives False negatives100 50 0.3640 0.0775100 100 0.1353 0.1475100 300 0 0.055200 30 0.3309 0.1350200 50 0.1975 0.0175200 100 0 0.0225500 20 0.0026 0.1925500 30 0.0008 0.22500 50 0.0009 0.32251000 10 0.1394 0.26431000 20 0 0.41431000 30 0.0450 0.3072
Table 7.8 shows the top performing results from Table 7.7 on a device basis. Themean value input to the unsupervised model was calculated from 200 RSSI valuesand in total 100 means were used to train the model.
Table 7.8: Isolation forest RSSI
Device False positives False negatives F-score00 0 0.01 0.99501 0 0.04 0.979602 0 0 103 0 0.04 0.9796
7.3 Combined Results
The combined results can be presented in two different categories. First, the casewhen only the gateway is used to receive packets. The other case is when severalantennas are used to register RSSI values from different positions. Only the bestresults from each experiment is presented. Both results are generated from 1000packets per skew, 30 skews per model, 100 packets per average RSSI and 300

Results 53
RSSI averages per model. As the feature vectors have different length, the clockskew feature vector is oversampled by duplicating entries. The results from theexperimentation with one receiver is presented in Table 7.9 and the results withfour receivers in Table 7.10.
Table 7.9: Combined fingerprint with only one receiver
Device False positives False negatives F-score00 0.01 0.0857 0.950301 0.0211 0 0.989602 0 0 103 0 0 1
Table 7.10: Combined fingerprint with four receivers
Device False positives False negatives F-score00 0 0 101 0 0 102 0 0.0571 0.970603 0 0 1

54 Results
Chapter 8Discussion
In this chapter the results presented in Chapter 7 as well as future works will bediscussed.
8.1 Test Bed and Data Capture
The test bed was created with a live scenario in mind. Because of this, a vastmajority of the implementation effort has been spent on creating a system thatcaptures live data, builds a model and then authenticates a device against saidmodel. If instead a system that only worked with previously captured pcap fileshad been implemented, more effort and time would have been put into executing amore comprehensive experiment study of the fingerprinting techniques. As a moreextensive study could have revealed factors with high impact on the implemen-tations’ performance, a more solid foundation of knowledge would have informedthe process of refining the fingerprinting techniques.
Moreover, the system can accomodate to the addition of more nodes to the net-work. Functionality to move all calculations to a remote server has been imple-mented. Thus, The fingerprinting functionality is no longer constrained by thelimited resources seen in the constrained devices of the local system. Additionally,the sensory nodes in the system perform few calculations as their sole task is toupdate their advertisement data with a timestamp. One possible bottleneck thatcould arise when scaling up the system is the gateway’s ability to handle incomingpackets. Furthermore, the memory requirements of the local system are relativelylow as most data is stored remotely, in either cloud or as in the setup used duringthe experimentation, on a remote laptop.
However, the authentication decision making was originally planned to be per-formed at the gateway device whilst the model building would still be done atthe remote server. By doing this, more swift feedback could be seen from thesystem as soon as an illegitimate device was discovered. Illegitimate data wouldbe stopped at gateway-level and thus the remote server would never be reachedby data originating from a corrupt node. However, it was deemed too taxing bothcomputationally and memory-wise on the gateway device. Thus, all fingerprintinglogic was moved to the remote server. It can be seen as a trade-off between sys-
55
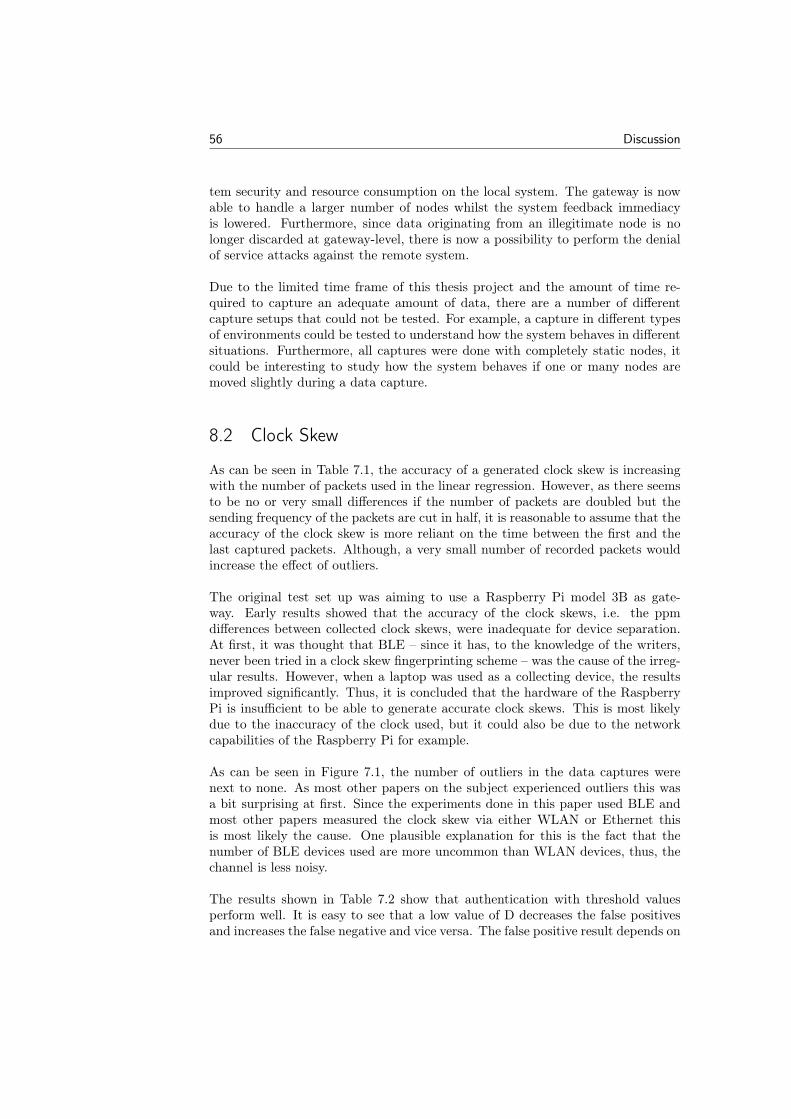
56 Discussion
tem security and resource consumption on the local system. The gateway is nowable to handle a larger number of nodes whilst the system feedback immediacyis lowered. Furthermore, since data originating from an illegitimate node is nolonger discarded at gateway-level, there is now a possibility to perform the denialof service attacks against the remote system.
Due to the limited time frame of this thesis project and the amount of time re-quired to capture an adequate amount of data, there are a number of differentcapture setups that could not be tested. For example, a capture in different typesof environments could be tested to understand how the system behaves in differentsituations. Furthermore, all captures were done with completely static nodes, itcould be interesting to study how the system behaves if one or many nodes aremoved slightly during a data capture.
8.2 Clock Skew
As can be seen in Table 7.1, the accuracy of a generated clock skew is increasingwith the number of packets used in the linear regression. However, as there seemsto be no or very small differences if the number of packets are doubled but thesending frequency of the packets are cut in half, it is reasonable to assume that theaccuracy of the clock skew is more reliant on the time between the first and thelast captured packets. Although, a very small number of recorded packets wouldincrease the effect of outliers.
The original test set up was aiming to use a Raspberry Pi model 3B as gate-way. Early results showed that the accuracy of the clock skews, i.e. the ppmdifferences between collected clock skews, were inadequate for device separation.At first, it was thought that BLE – since it has, to the knowledge of the writers,never been tried in a clock skew fingerprinting scheme – was the cause of the irreg-ular results. However, when a laptop was used as a collecting device, the resultsimproved significantly. Thus, it is concluded that the hardware of the RaspberryPi is insufficient to be able to generate accurate clock skews. This is most likelydue to the inaccuracy of the clock used, but it could also be due to the networkcapabilities of the Raspberry Pi for example.
As can be seen in Figure 7.1, the number of outliers in the data captures werenext to none. As most other papers on the subject experienced outliers this wasa bit surprising at first. Since the experiments done in this paper used BLE andmost other papers measured the clock skew via either WLAN or Ethernet thisis most likely the cause. One plausible explanation for this is the fact that thenumber of BLE devices used are more uncommon than WLAN devices, thus, thechannel is less noisy.
The results shown in Table 7.2 show that authentication with threshold valuesperform well. It is easy to see that a low value of D decreases the false positivesand increases the false negative and vice versa. The false positive result depends on
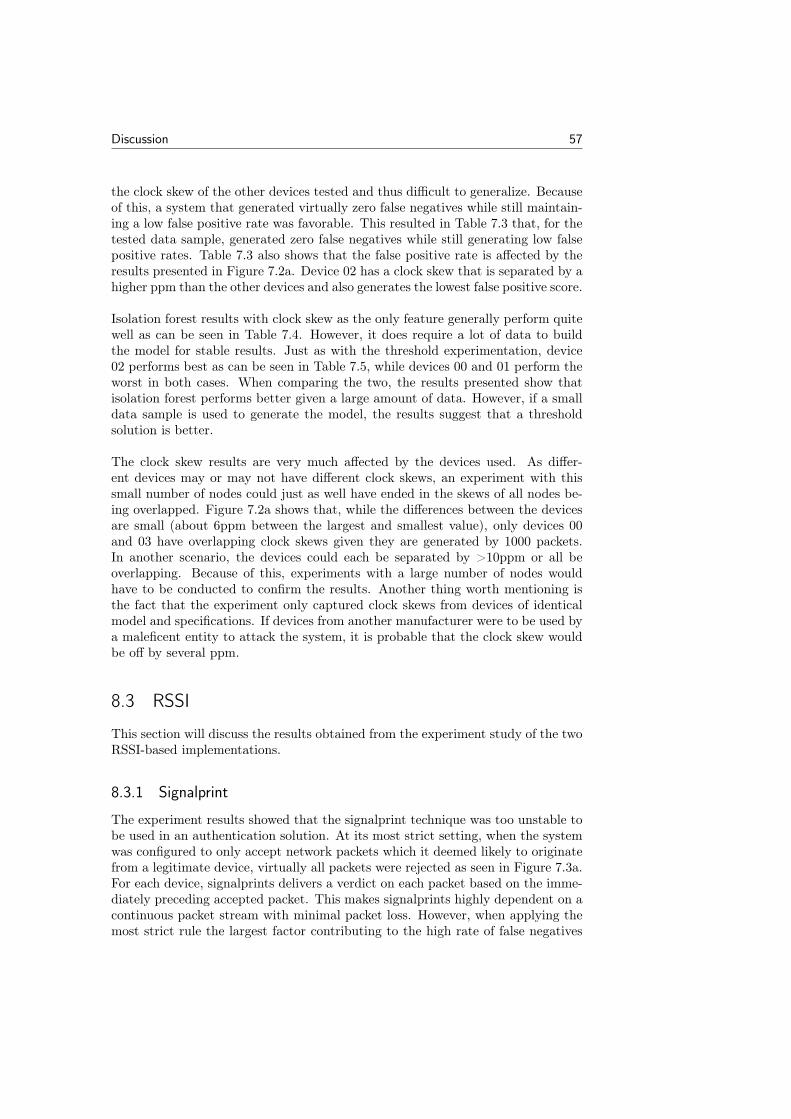
Discussion 57
the clock skew of the other devices tested and thus difficult to generalize. Becauseof this, a system that generated virtually zero false negatives while still maintain-ing a low false positive rate was favorable. This resulted in Table 7.3 that, for thetested data sample, generated zero false negatives while still generating low falsepositive rates. Table 7.3 also shows that the false positive rate is affected by theresults presented in Figure 7.2a. Device 02 has a clock skew that is separated by ahigher ppm than the other devices and also generates the lowest false positive score.
Isolation forest results with clock skew as the only feature generally perform quitewell as can be seen in Table 7.4. However, it does require a lot of data to buildthe model for stable results. Just as with the threshold experimentation, device02 performs best as can be seen in Table 7.5, while devices 00 and 01 perform theworst in both cases. When comparing the two, the results presented show thatisolation forest performs better given a large amount of data. However, if a smalldata sample is used to generate the model, the results suggest that a thresholdsolution is better.
The clock skew results are very much affected by the devices used. As differ-ent devices may or may not have different clock skews, an experiment with thissmall number of nodes could just as well have ended in the skews of all nodes be-ing overlapped. Figure 7.2a shows that, while the differences between the devicesare small (about 6ppm between the largest and smallest value), only devices 00and 03 have overlapping clock skews given they are generated by 1000 packets.In another scenario, the devices could each be separated by >10ppm or all beoverlapping. Because of this, experiments with a large number of nodes wouldhave to be conducted to confirm the results. Another thing worth mentioning isthe fact that the experiment only captured clock skews from devices of identicalmodel and specifications. If devices from another manufacturer were to be used bya maleficent entity to attack the system, it is probable that the clock skew wouldbe off by several ppm.
8.3 RSSI
This section will discuss the results obtained from the experiment study of the twoRSSI-based implementations.
8.3.1 Signalprint
The experiment results showed that the signalprint technique was too unstable tobe used in an authentication solution. At its most strict setting, when the systemwas configured to only accept network packets which it deemed likely to originatefrom a legitimate device, virtually all packets were rejected as seen in Figure 7.3a.For each device, signalprints delivers a verdict on each packet based on the imme-diately preceding accepted packet. This makes signalprints highly dependent on acontinuous packet stream with minimal packet loss. However, when applying themost strict rule the largest factor contributing to the high rate of false negatives
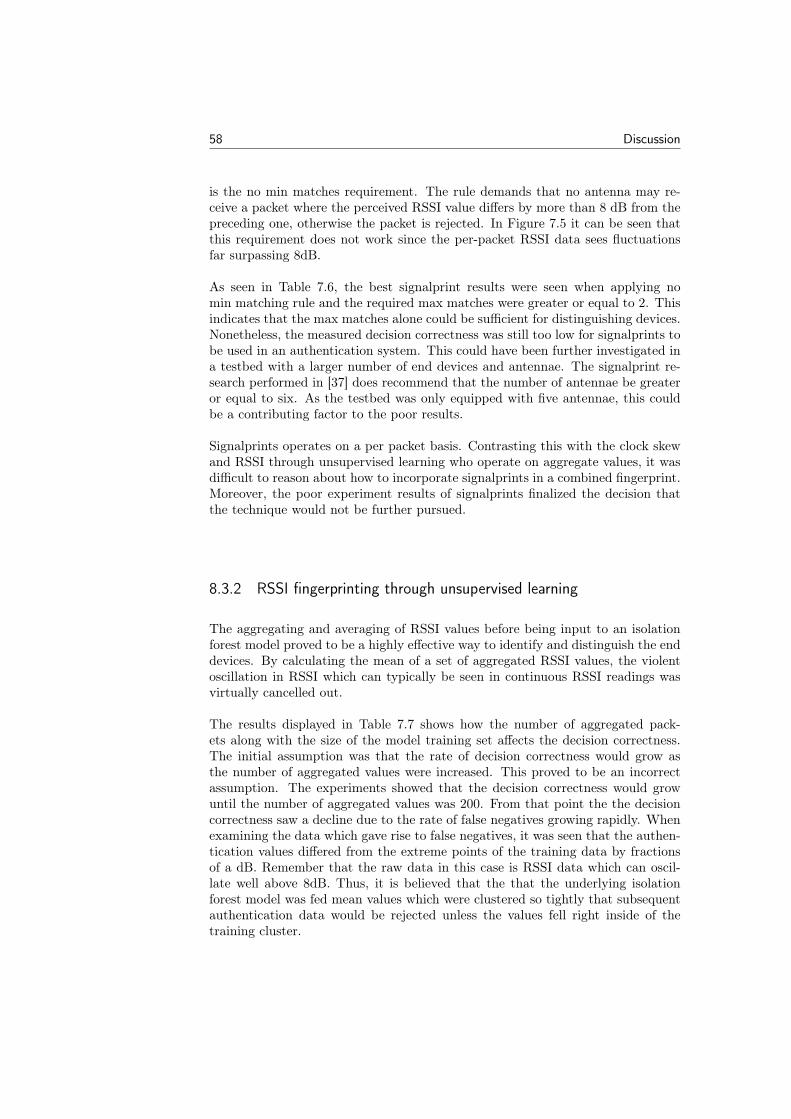
58 Discussion
is the no min matches requirement. The rule demands that no antenna may re-ceive a packet where the perceived RSSI value differs by more than 8 dB from thepreceding one, otherwise the packet is rejected. In Figure 7.5 it can be seen thatthis requirement does not work since the per-packet RSSI data sees fluctuationsfar surpassing 8dB.
As seen in Table 7.6, the best signalprint results were seen when applying nomin matching rule and the required max matches were greater or equal to 2. Thisindicates that the max matches alone could be sufficient for distinguishing devices.Nonetheless, the measured decision correctness was still too low for signalprints tobe used in an authentication system. This could have been further investigated ina testbed with a larger number of end devices and antennae. The signalprint re-search performed in [37] does recommend that the number of antennae be greateror equal to six. As the testbed was only equipped with five antennae, this couldbe a contributing factor to the poor results.
Signalprints operates on a per packet basis. Contrasting this with the clock skewand RSSI through unsupervised learning who operate on aggregate values, it wasdifficult to reason about how to incorporate signalprints in a combined fingerprint.Moreover, the poor experiment results of signalprints finalized the decision thatthe technique would not be further pursued.
8.3.2 RSSI fingerprinting through unsupervised learning
The aggregating and averaging of RSSI values before being input to an isolationforest model proved to be a highly effective way to identify and distinguish the enddevices. By calculating the mean of a set of aggregated RSSI values, the violentoscillation in RSSI which can typically be seen in continuous RSSI readings wasvirtually cancelled out.
The results displayed in Table 7.7 shows how the number of aggregated pack-ets along with the size of the model training set affects the decision correctness.The initial assumption was that the rate of decision correctness would grow asthe number of aggregated values were increased. This proved to be an incorrectassumption. The experiments showed that the decision correctness would growuntil the number of aggregated values was 200. From that point the the decisioncorrectness saw a decline due to the rate of false negatives growing rapidly. Whenexamining the data which gave rise to false negatives, it was seen that the authen-tication values differed from the extreme points of the training data by fractionsof a dB. Remember that the raw data in this case is RSSI data which can oscil-late well above 8dB. Thus, it is believed that the that the underlying isolationforest model was fed mean values which were clustered so tightly that subsequentauthentication data would be rejected unless the values fell right inside of thetraining cluster.
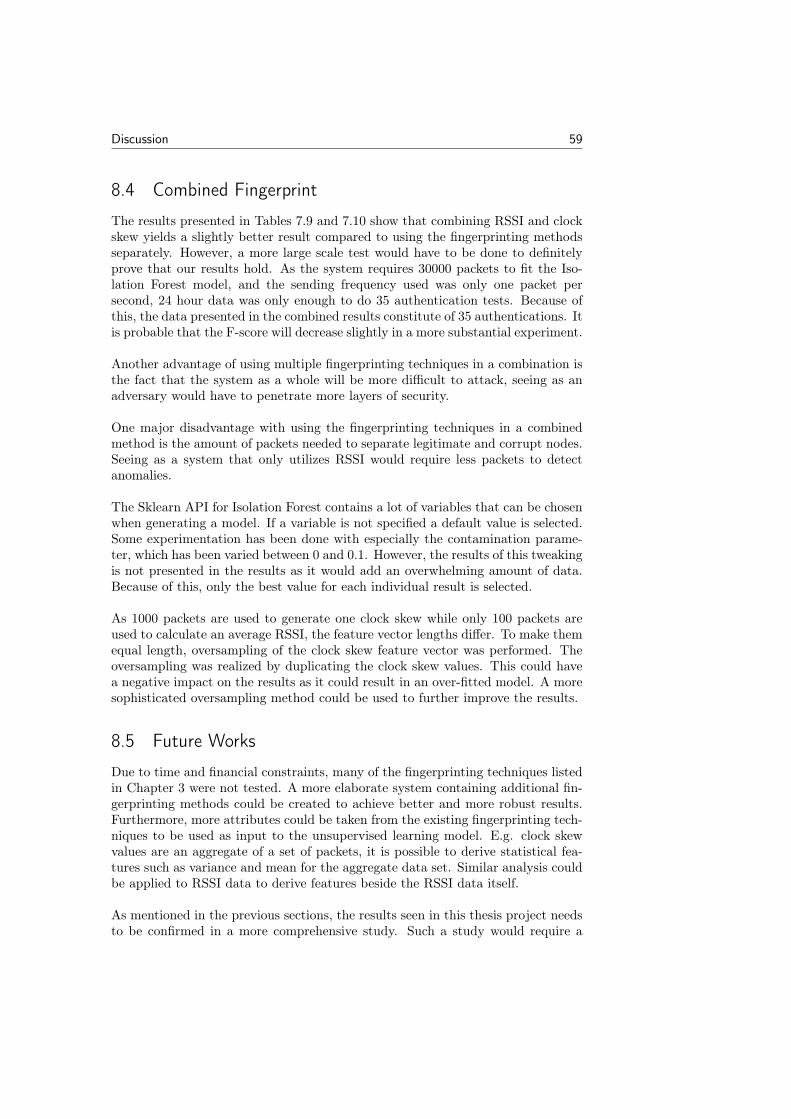
Discussion 59
8.4 Combined Fingerprint
The results presented in Tables 7.9 and 7.10 show that combining RSSI and clockskew yields a slightly better result compared to using the fingerprinting methodsseparately. However, a more large scale test would have to be done to definitelyprove that our results hold. As the system requires 30000 packets to fit the Iso-lation Forest model, and the sending frequency used was only one packet persecond, 24 hour data was only enough to do 35 authentication tests. Because ofthis, the data presented in the combined results constitute of 35 authentications. Itis probable that the F-score will decrease slightly in a more substantial experiment.
Another advantage of using multiple fingerprinting techniques in a combination isthe fact that the system as a whole will be more difficult to attack, seeing as anadversary would have to penetrate more layers of security.
One major disadvantage with using the fingerprinting techniques in a combinedmethod is the amount of packets needed to separate legitimate and corrupt nodes.Seeing as a system that only utilizes RSSI would require less packets to detectanomalies.
The Sklearn API for Isolation Forest contains a lot of variables that can be chosenwhen generating a model. If a variable is not specified a default value is selected.Some experimentation has been done with especially the contamination parame-ter, which has been varied between 0 and 0.1. However, the results of this tweakingis not presented in the results as it would add an overwhelming amount of data.Because of this, only the best value for each individual result is selected.
As 1000 packets are used to generate one clock skew while only 100 packets areused to calculate an average RSSI, the feature vector lengths differ. To make themequal length, oversampling of the clock skew feature vector was performed. Theoversampling was realized by duplicating the clock skew values. This could havea negative impact on the results as it could result in an over-fitted model. A moresophisticated oversampling method could be used to further improve the results.
8.5 Future Works
Due to time and financial constraints, many of the fingerprinting techniques listedin Chapter 3 were not tested. A more elaborate system containing additional fin-gerprinting methods could be created to achieve better and more robust results.Furthermore, more attributes could be taken from the existing fingerprinting tech-niques to be used as input to the unsupervised learning model. E.g. clock skewvalues are an aggregate of a set of packets, it is possible to derive statistical fea-tures such as variance and mean for the aggregate data set. Similar analysis couldbe applied to RSSI data to derive features beside the RSSI data itself.
As mentioned in the previous sections, the results seen in this thesis project needsto be confirmed in a more comprehensive study. Such a study would require a
60 Discussion
larger number of nodes, preferably with a more heterogeneous set of devices to befingerprinted. Additionally, an increased number of machine learning algorithmscan be tested such as One-Class Support Vector Machine and Local Outlier Factoras well as a threshold based solution for RSSI averages.
To better get an understanding of how the system would operate in a live appli-cation, experimentation in a lively environment would be beneficial. For examplein a busy factory with a large number of people in movement and where the po-sition of the nodes may alter slightly due to bumps etc. Environmental factorsshould also be more closely studied, establishing what elements have a large impacton derived fingerprints will help in developing a more robust fingerprinting system.
Finally, experiments investigating attacks against the system created in this papercould be done. It is known, as can be seen in Chapter 4, that there exists nu-merous attacks against the fingerprinting techniques used in the system. Such astudy would answer questions such as feasibility of fingerprinting attacks and givean indication of how much of an added security layer the system provides.
Chapter 9Conclusion
This master thesis project has investigated how to authenticate a device in a wire-less sensor network without the use of device identity credentials. The experimentstudy shows that device fingerprinting can be employed in order to deduce theidentity of a device.
Previous research studied device fingerprinting techniques individually, in this the-sis a novel approach has been taken where different fingerprinting methods havebeen combined to achieve better results. By utilizing the clock skew and RSSI ofa device, it is possible to identify a device as legitimate or corrupt to a high degreeof certainty. However, for accurate results, it has shown that a large data set isrequired to do so and instant discovery of corrupt nodes is not possible with themethod used in the project.
Fingerprinting techniques are usually applied to environments where computa-tional and memory resources are abundant. This project has shown how such tech-niques can be used in a more resource constrained environment. This is achievedby relocating resource demanding operations to a remote location, thus, loweringthe resource demands on the devices found in the wireless static network. How-ever, by doing so, the system takes a highly centralized character. Placing allcomputations and storage of data at a centralized server could however impose asecurity risk on the system.
61

62 Conclusion
Bibliography
[1] D Andeed. Smart grid security: Recent history demonstrates the dire need.2013.
[2] Mark Ward. Smart meters can be hacked to cut power bills. http://www.bbc.com/news/technology-29643276. Accessed: 2017-03-01.
[3] Carl Hartung, James Balasalle, and Richard Han. Node compromise in sensornetworks: The need for secure systems. Department of Computer ScienceUniversity of Colorado at Boulder, 2005.
[4] Qiang Xu, Rong Zheng, Walid Saad, and Zhu Han. Device fingerprintingin wireless networks: Challenges and opportunities. IEEE CommunicationsSurveys & Tutorials, 18(1):94–104, 2016.
[5] Efr32TM mighty gecko mesh networking wireless socs for zigbee R© andthread. http://www.silabs.com/products/wireless/mesh-networking/efr32mg-mighty-gecko-zigbee-thread-soc. Accessed=2017-04-04.
[6] Jennifer Yick, Biswanath Mukherjee, and Dipak Ghosal. Wireless sensornetwork survey. Computer networks, 52(12):2292–2330, 2008.
[7] V Çağrı Güngör and Gerhard P Hancke. Industrial wireless sensor networks:Applications, protocols, and standards. Crc Press, 2013.
[8] Ieee standards association. https://standards.ieee.org/findstds/standard/802.11ah-2016.html. Accessed: 2017-05-04.
[9] Stefan Aust, R Venkatesha Prasad, and Ignas GMM Niemegeers. Ieee 802.11ah: Advantages in standards and further challenges for sub 1 ghz wi-fi.In Communications (ICC), 2012 IEEE International Conference on, pages6885–6889. IEEE, 2012.
[10] Johanna Nieminen, Carles Gomez, Markus Isomaki, Teemu Savolainen,Basavaraj Patil, Zach Shelby, Minjun Xi, and Joaquim Oller. Networkingsolutions for connecting bluetooth low energy enabled machines to the inter-net of things. IEEE network, 28(6):83–90, 2014.
[11] Clinton Francis Hughes. Bluetooth Low Energy. PhD thesis, ARIZONASTATE UNIVERSITY, 2015.
63
64 Bibliography
[12] IEEE 802.15 WPANTM Task Group 4. Ieee 802.15.4 low-rate wireless net-works, 2015.
[13] What is zigbee? http://www.zigbee.org/what-is-zigbee/.Accessed=2017-09-22.
[14] What is thread? http://threadgroup.org/What-is-Thread/Connected-Home. Accessed=2017-09-22.
[15] Martin Sauter. From GSM to LTE: an introduction to mobile networks andmobile broadband. John Wiley & Sons, 2010.
[16] Qutaiba Ibrahem Ali, Akram Abdulmaowjod, and Hussein Mahmood Mo-hammed. Simulation & performance study of wireless sensor network (wsn)using matlab. In Energy, Power and Control (EPC-IQ), 2010 1st Interna-tional Conference on, pages 307–314. IEEE, 2010.
[17] Chris Guy. Wireless sensor networks. In Sixth International Symposium onInstrumentation and Control Technology: Signal Analysis, Measurement The-ory, Photo-Electronic technology, and Artificial Intelligence, pages 63571I–63571I. International Society for Optics and Photonics, 2006.
[18] Sudipto Roy and Manisha J Nene. Prevention of node replication in wirelesssensor network using received signal strength indicator, link quality indicatorand packet sequence number. In Green Engineering and Technologies (IC-GET), 2016 Online International Conference on, pages 1–8. IEEE, 2016.
[19] Ian F Akyildiz, Weilian Su, Yogesh Sankarasubramaniam, and Erdal Cayirci.Wireless sensor networks: a survey. Computer networks, 38(4):393–422, 2002.
[20] Fei Tony Liu, Kai Ming Ting, and Zhi-Hua Zhou. Isolation forest. In DataMining, 2008. ICDM’08. Eighth IEEE International Conference on, pages413–422. IEEE, 2008.
[21] sklearn.ensamble.isolationforest. http://scikit-learn.org/stable/modules/generated/sklearn.ensemble.IsolationForest.html.Accessed=2017-08-18.
[22] Xiao Li, Ye-Yi Wang, and Alex Acero. Learning query intent from regularizedclick graphs. In Proceedings of the 31st annual international ACM SIGIRconference on Research and development in information retrieval, pages 339–346. ACM, 2008.
[23] Tadayoshi Kohno, Andre Broido, and Kimberly C Claffy. Remote physicaldevice fingerprinting. IEEE Transactions on Dependable and Secure Comput-ing, 2(2):93–108, 2005.
[24] Saeed Ur Rehman, Kevin W Sowerby, and Colin Coghill. Analysis of im-personation attacks on systems using rf fingerprinting and low-end receivers.Journal of Computer and System Sciences, 80(3):591–601, 2014.
[25] Russ Fink. A statistical approach to remote physical device fingerprinting.In Military Communications Conference, 2007. MILCOM 2007. IEEE, pages1–7. IEEE, 2007.
Bibliography 65
[26] Suman Jana and Sneha K Kasera. On fast and accurate detection of unautho-rized wireless access points using clock skews. IEEE Transactions on MobileComputing, 9(3):449–462, 2010.
[27] Cherita L Corbett, Raheem A Beyah, and John A Copeland. Passive clas-sification of wireless nics during active scanning. International Journal ofInformation Security, 7(5):335–348, 2008.
[28] Fabian Lanze, Andriy Panchenko, Benjamin Braatz, and Andreas Zinnen.Clock skew based remote device fingerprinting demystified. In Global Com-munications Conference (GLOBECOM), 2012 IEEE, pages 813–819. IEEE,2012.
[29] Ding-Jie Huang, Kai-Ting Yang, Chien-Chun Ni, Wei-Chung Teng, Tien-Ruey Hsiang, and Yuh-Jye Lee. Clock skew based client device identificationin cloud environments. In Advanced Information Networking and Applications(AINA), 2012 IEEE 26th International Conference on, pages 526–533. IEEE,2012.
[30] A Selcuk Uluagac, Sakthi V Radhakrishnan, Cherita Corbett, Antony Baca,and Raheem Beyah. A passive technique for fingerprinting wireless de-vices with wired-side observations. In Communications and Network Security(CNS), 2013 IEEE Conference on, pages 305–313. IEEE, 2013.
[31] Ke Gao, Cherita L Corbett, and Raheem A Beyah. A passive approach towireless device fingerprinting. In DSN, pages 383–392, 2010.
[32] Christoph Neumann, Olivier Heen, and Stéphane Onno. An empirical studyof passive 802.11 device fingerprinting. In Distributed Computing SystemsWorkshops (ICDCSW), 2012 32nd International Conference on, pages 593–602. IEEE, 2012.
[33] Sudip Misra, Ashim Ghosh, Mohammad S Obaidat, et al. Detection ofidentity-based attacks in wireless sensor networks using signalprints. In Pro-ceedings of the 2010 IEEE/ACM Int’l Conference on Green Computing andCommunications & Int’l Conference on Cyber, Physical and Social Comput-ing, pages 35–41. IEEE Computer Society, 2010.
[34] Yingying Chen, Jie Yang, Wade Trappe, and Richard P Martin. Detectingand localizing identity-based attacks in wireless and sensor networks. IEEETransactions on Vehicular Technology, 59(5):2418–2434, 2010.
[35] Kai Zeng, Kannan Govindan, and Prasant Mohapatra. Non-cryptographicauthentication and identification in wireless networks [security and privacy inemerging wireless networks]. IEEE Wireless Communications, 17(5), 2010.
[36] Esrafil Jedari, ZhengWu, Rashid Rashidzadeh, and Mehrdad Saif. Wi-fi basedindoor location positioning employing random forest classifier. In Indoor Po-sitioning and Indoor Navigation (IPIN), 2015 International Conference on,pages 1–5. IEEE, 2015.
[37] Faria and Cheriton. Detection of identity-based attacks in wireless sensor net-works using signalprints. In WiSe ’06 Proceedings of the 5th ACM workshopon Wireless security, pages 43–52. ACM, 2006.

66 Bibliography
[38] G Edward Suh and Srinivas Devadas. Physical unclonable functions for deviceauthentication and secret key generation. In Proceedings of the 44th annualDesign Automation Conference, pages 9–14. ACM, 2007.
[39] Caidan Zhao, Lianfen Huang, Yifeng Zhao, and Xiaojiang Du. Securemachine-type communications toward lte heterogeneous networks. IEEEWireless Communications, 24(1):82–87, 2017.
[40] Blaise Gassend, Dwaine Clarke, Marten Van Dijk, and Srinivas Devadas.Silicon physical random functions. In Proceedings of the 9th ACM conferenceon Computer and communications security, pages 148–160. ACM, 2002.
[41] Qingqing Chen, György Csaba, Paolo Lugli, Ulf Schlichtmann, and UlrichRührmair. The bistable ring puf: A new architecture for strong physical un-clonable functions. In Hardware-Oriented Security and Trust (HOST), 2011IEEE International Symposium on, pages 134–141. IEEE, 2011.
[42] Charles Herder, Meng-Day Yu, Farinaz Koushanfar, and Srinivas Devadas.Physical unclonable functions and applications: A tutorial. Proceedings ofthe IEEE, 102(8):1126–1141, 2014.
[43] Yingjie Lao, Bo Yuan, Chris H Kim, and Keshab K Parhi. Reliable puf-basedlocal authentication with self-correction. IEEE Transactions on Computer-Aided Design of Integrated Circuits and Systems, 36(2):201–213, 2017.
[44] BenjaminWRamsey, Barry E Mullins, Michael A Temple, and Michael R Gri-maila. Wireless intrusion detection and device fingerprinting through pream-ble manipulation. IEEE Transactions on Dependable and Secure Computing,12(5):585–596, 2015.
[45] Nicholas Kulesza, Benjamin Ramsey, and Barry Mullins. Wireless intrusiondetection through preamble manipulation. In Proceedings of the 9th Int’l Confon Cyber Warfare and Security, pages 132–139, 2014.
[46] Xu Jin-yong, Zhao Hang-sheng, and Liang Tao. Method of empirical modedecompositions in radio frequency fingerprint. In Microwave and MillimeterWave Technology (ICMMT), 2010 International Conference on, pages 1275–1278. IEEE, 2010.
[47] Boris Danev, Davide Zanetti, and Srdjan Capkun. On physical-layer identifi-cation of wireless devices. ACM Computing Surveys (CSUR), 45(1):6, 2012.
[48] Kasper Bonne Rasmussen and Srdjan Capkun. Implications of radio finger-printing on the security of sensor networks. In Security and Privacy in Com-munications Networks and the Workshops, 2007. SecureComm 2007. ThirdInternational Conference on, pages 331–340. IEEE, 2007.
[49] Wenhao Wang, Zhi Sun, Sixu Piao, Bocheng Zhu, and Kui Ren. Wirelessphysical-layer identification: Modeling and validation. IEEE Transactions onInformation Forensics and Security, 11(9):2091–2106, 2016.
[50] P Padilla, JL Padilla, and JF Valenzuela-Valdes. Radiofrequency identi-fication of wireless devices based on rf fingerprinting. Electronics Letters,49(22):1409–1410, 2013.
Bibliography 67
[51] Norden E Huang, Zheng Shen, Steven R Long, Manli C Wu, Hsing H Shih,Quanan Zheng, Nai-Chyuan Yen, Chi Chao Tung, and Henry H Liu. Theempirical mode decomposition and the hilbert spectrum for nonlinear andnon-stationary time series analysis. In Proceedings of the Royal Society ofLondon A: Mathematical, Physical and Engineering Sciences, volume 454,pages 903–995. The Royal Society, 1998.
[52] Jeyanthi Hall, Michel Barbeau, and Evangelos Kranakis. Radio frequencyfingerprinting for intrusion detection in wireless networks. IEEE Transactionson Defendable and Secure Computing, 2005.
[53] Benjamin W Ramsey, Tyler D Stubbs, Barry E Mullins, Michael A Temple,and Mark A Buckner. Wireless infrastructure protection using low-cost radiofrequency fingerprinting receivers. International Journal of Critical Infras-tructure Protection, 8:27–39, 2015.
[54] William E Cobb, Eric W Garcia, Michael A Temple, Rusty O Baldwin, andYong C Kim. Physical layer identification of embedded devices using rf-dnafingerprinting. In MILITARY COMMUNICATIONS CONFERENCE, 2010-MILCOM 2010, pages 2168–2173. IEEE, 2010.
[55] William E Cobb, Eric D Laspe, Rusty O Baldwin, Michael A Temple, andYong C Kim. Intrinsic physical-layer authentication of integrated circuits.IEEE Transactions on Information Forensics and Security, 7(1):14–24, 2012.
[56] McKay D Williams, Michael A Temple, and Donald R Reising. Augmentingbit-level network security using physical layer rf-dna fingerprinting. In GlobalTelecommunications Conference (GLOBECOM 2010), 2010 IEEE, pages 1–6.IEEE, 2010.
[57] Clay K Dubendorfer, Benjamin W Ramsey, and Michael A Temple. An rf-dnaverification process for zigbee networks. InMILITARY COMMUNICATIONSCONFERENCE, 2012-MILCOM 2012, pages 1–6. IEEE, 2012.
[58] Komang Oka Saputra, Wei-Chung Teng, and Yi-Hao Chu. A clock skewreplication attack detection approach utilizing the resolution of systemtime. In Web Intelligence and Intelligent Agent Technology (WI-IAT), 2015IEEE/WIC/ACM International Conference on, volume 3, pages 211–214.IEEE, 2015.
[59] Yingying Chen, Konstantinos Kleisouris, Xiaoyan Li, Wade Trappe, andRichard P. Martin. The Robustness of Localization Algorithms to SignalStrength Attacks: A Comparative Study, pages 546–563. Springer Berlin Hei-delberg, Berlin, Heidelberg, 2006.
[60] Boris Danev, Heinrich Luecken, Srdjan Capkun, and Karim El Defrawy. At-tacks on physical-layer identification. In Proceedings of the third ACM con-ference on Wireless network security, pages 89–98. ACM, 2010.
[61] Tektronix arbitrary waveform generators – awg7000 series datasheet. http://www.tek.com/datasheet/arbitrary-waveform-generators-7. Accessed:2017-05-21.
68 Bibliography
[62] Sheng Wei, James B Wendt, Ani Nahapetian, and Miodrag Potkonjak. Re-verse engineering and prevention techniques for physical unclonable functionsusing side channels. In Proceedings of the 51st Annual Design AutomationConference, pages 1–6. ACM, 2014.
[63] Sheng Wei, Saro Meguerdichian, and Miodrag Potkonjak. Gate-level charac-terization: foundations and hardware security applications. In Proceedings ofthe 47th Design Automation Conference, pages 222–227. ACM, 2010.
[64] Ali Keshavarzi, Kaushik Roy, and Charles F Hawkins. Intrinsic leakage inlow power deep submicron cmos ics. In Test Conference, 1997. Proceedings.,International, pages 146–155. IEEE, 1997.
[65] Boris Danev and Srdjan Capkun. Transient-based identification of wirelesssensor nodes. In Proceedings of the 2009 International Conference on Infor-mation Processing in Sensor Networks, pages 25–36. IEEE Computer Society,2009.
[66] Javier Galbally, Chris McCool, Julian Fierrez, Sebastien Marcel, and JavierOrtega-Garcia. On the vulnerability of face verification systems to hill-climbing attacks. Pattern Recognition, 43(3):1027–1038, 2010.
[67] Ruud M Bolle, Jonathan Connell, Sharath Pankanti, Nalini K Ratha, andAndrew W Senior. Guide to biometrics. Springer Science & Business Media,2013.
[68] David R Raymond and Scott F Midkiff. Denial-of-service in wireless sensornetworks: Attacks and defenses. IEEE Pervasive Computing, 7(1), 2008.
[69] What are radiotap headers? http://wifinigel.blogspot.se/2013/11/what-are-radiotap-headers.html. Accessed=2017-08-11.
[70] Wireshark time stamps. https://www.wireshark.org/docs/wsug_html_chunked/ChAdvTimestamps.html. Accessed=2017-08-11.
[71] Nrf52 development kit – product page. https://www.nordicsemi.com/eng/Products/Bluetooth-low-energy/nRF52-DK. Accessed=2017-08-11.


![Detecting Carbon Monoxide Poisoning Detecting Carbon ...2].pdf · Detecting Carbon Monoxide Poisoning Detecting Carbon Monoxide Poisoning. Detecting Carbon Monoxide Poisoning C arbon](https://static.fdocuments.us/doc/165x107/5f551747b859172cd56bb119/detecting-carbon-monoxide-poisoning-detecting-carbon-2pdf-detecting-carbon.jpg)