Detecting Fraud Using Modified Benford...
13
Chapter 10 DETECTING FRAUD USING MODIFIED BENFORD ANALYSIS Christian Winter, Markus Schneider and York Yannikos Abstract Large enterprises frequently enforce accounting limits to reduce the im- pact of fraud. As a complement to accounting limits, auditors use Ben- ford analysis to detect traces of undesirable or illegal activities in ac- counting data. Unfortunately, the two fraud fighting measures often do not work well together. Accounting limits may significantly disturb the digit distribution examined by Benford analysis, leading to high false alarm rates, additional investigations and, ultimately, higher costs. To better handle accounting limits, this paper describes a modified Ben- ford analysis technique where a cut-off log-normal distribution derived from the accounting limits and other properties of the data replaces the distribution used in Benford analysis. Experiments with simulated and real-world data demonstrate that the modified Benford analysis tech- nique significantly reduces false positive errors. Keywords: Auditing, fraud detection, Benford analysis 1. Introduction Financial fraud is a major risk for enterprises. Proactive access restric- tions and post facto forensic accounting procedures are widely employed to protect enterprises from losses. Many practitioners assume that access restrictions do not impact the effectiveness of forensic methods – if they consider the interdependencies at all. However, this is not necessarily true. Auditors often use Benford analysis [5] to identify irregularities in large data collections. Benford analysis is frequently applied to account- ing and tax data to find traces of fraudulent activity [10]. Benford anal- ysis is based on Benford’s law [11], which states that the frequencies of leading digits in numbers follow a non-uniform distribution. This Ben- ford distribution is a logarithmic distribution that decays as the digits
Transcript of Detecting Fraud Using Modified Benford...
Chapter 10
DETECTING FRAUD USINGMODIFIED BENFORD ANALYSIS
Christian Winter, Markus Schneider and York Yannikos
Abstract Large enterprises frequently enforce accounting limits to reduce the im-pact of fraud. As a complement to accounting limits, auditors use Ben-ford analysis to detect traces of undesirable or illegal activities in ac-counting data. Unfortunately, the two fraud fighting measures often donot work well together. Accounting limits may significantly disturb thedigit distribution examined by Benford analysis, leading to high falsealarm rates, additional investigations and, ultimately, higher costs. Tobetter handle accounting limits, this paper describes a modified Ben-ford analysis technique where a cut-off log-normal distribution derivedfrom the accounting limits and other properties of the data replaces thedistribution used in Benford analysis. Experiments with simulated andreal-world data demonstrate that the modified Benford analysis tech-nique significantly reduces false positive errors.
Keywords: Auditing, fraud detection, Benford analysis
1. Introduction
Financial fraud is a major risk for enterprises. Proactive access restric-tions and post facto forensic accounting procedures are widely employedto protect enterprises from losses. Many practitioners assume that accessrestrictions do not impact the effectiveness of forensic methods – if theyconsider the interdependencies at all. However, this is not necessarilytrue.
Auditors often use Benford analysis [5] to identify irregularities inlarge data collections. Benford analysis is frequently applied to account-ing and tax data to find traces of fraudulent activity [10]. Benford anal-ysis is based on Benford’s law [11], which states that the frequencies ofleading digits in numbers follow a non-uniform distribution. This Ben-ford distribution is a logarithmic distribution that decays as the digits

130 ADVANCES IN DIGITAL FORENSICS VII
increase. When using Benford analysis to check financial data for irreg-ularities, auditors test the data for conformance with Benford’s law.
If an enterprise enforces accounting limits for certain employees, forexample, a limit of $5,000, the frequencies of leading digits in the datacreated by these employees deviate from the Benford distribution. Sincethis deviation is much larger than that produced by pure chance, Benfordanalysis of the data would generate more false positive alerts.
This paper respects the implications of access restrictions (e.g., pay-ment and order limits) by using a log-normal reference distribution de-rived from the data. The resulting modified Benford analysis comparesthe frequencies of leading digits in the data to the reference distribution.Applying the modified Benford analysis to simulated and real-world datagives rise to lower false positive rates, which, in turn, reduces auditingcosts.
2. Benford Analysis
Benford’s law states that numbers in real-world data sets are morelikely to start with small digits than large digits [1, 9]. Specifically,the Benford distribution determines the probability of encountering anumber in which the n most significant digits represent the integer d(n).The probability of the associated random variable D(n) is given by:
Pr(D(n) = d(n)) = log(d(n) + 1) − log(d(n)) = log!1 + 1
d(n)
"(1)
Benford’s law has been shown to hold for data in a variety of do-mains. Nigrini [10] was the first to apply Benford’s law to detect taxand accounting fraud.
The Benford analysis methodology compares the distribution of firstdigits in data to a Benford distribution. Alerts are raised when there isa large deviation from the Benford distribution.
Benford analysis is typically an early step in a forensic audit as ithelps locate starting points for deeper analysis and evidentiary search.In order to identify nonconforming data items (i.e., those needing furtherinvestigation), it is necessary to quantify the deviation of the data fromthe reference Benford distribution. This is accomplished using statisticaltests or heuristic methods.
A statistical test quantifies the deviation between the data and thereference distribution using a test statistic. The p-value and significancelevel α are crucial quantities for assessing the selected test statistic. Thep-value is the probability that the test statistic is at least as large ascurrently observed under the assumption that the data is generated ac-cording to the reference distribution. A statistical test yields a rejection

Winter, Schneider & Yannikos 131
if the p-value is small (i.e., the test statistic is large). The threshold forrejection is specified by the significance level α.
An example is the chi-square test, which uses the chi-square statisticto calculate the p-value. Comparison of the p-value with α may resultin rejection. A rejection is either a true positive (i.e., fraud is indicatedand fraud actually exists) or a false positive (i.e., fraud is indicated, butno fraud actually exists).
Other measures for determining the deviation include the “mean ab-solute deviation” and the “distortion factor” [10]. The thresholds forrejection are typically chosen in a heuristic manner for Benford analysesthat use these measures.
A limitation of Benford analysis is that non-fraudulent data mustbe sufficiently close to the Benford distribution. Two techniques areavailable for determining if the data meets this condition: mathematicalapproaches [2, 4, 13, 14] and rules of thumb [5, 6, 8, 10, 11, 16, 18].
One rule of thumb is that data is likely close to the Benford distribu-tion if it has a wide spread, i.e., it has relevant mass in multiple ordersof magnitude. Because accounting data and other financial data usuallyhave a wide spread, we can assume that this rule does not limit theapplication of Benford analysis in the accounting and financial domains.
Another rule of thumb is that non-fraudulent data must not artificiallyprefer specific digits in any position. This automatically holds for naturaldata with a wide spread. However, human-produced numbers (artificialdata) such as prices can be based on psychologically-chosen patterns(e.g., prices ending with 99 cents). But such patterns are more commonin consumer pricing than in business and accounting environments.
Another rule of thumb is that Benford analysis should not be per-formed when the data has an enforced maximum and/or minimum [5,11]. This is problematic because limits are imposed in many account-ing environments. When accounting limits exist, it is only possible toapply Benford analysis to the global data, not to data pertaining to sin-gle individuals. This is because the global data does not have enforcedlimits.
3. Handling Accounting Limits
In order to determine how an accounting limit affects the distributionof leading digits, it is necessary to make an assumption about the overalldistribution of data. The cut-off point at an accounting limit is just oneproperty of the overall distribution and is, therefore, not sufficient toderive a reference digit distribution.
132 ADVANCES IN DIGITAL FORENSICS VII
The first step in handling an accounting limit is to identify a rea-sonable distribution model for the accounting data without the cut-off.Unfortunately, a normal distribution does not match the Benford dis-tribution. However, the logarithms of the data values can be assumedto have a normal distribution, i.e., the data has a log-normal distribu-tion. A log-normal distribution is specified by the mean µ and standarddeviation σ of the associated normal distribution.
Several researchers [6, 13, 16] have considered log-normal distributionsin the context of Benford’s law. In general, they agree that conformancewith the Benford distribution increases as σ increases. The multiplica-tive central-limit-theorem argument, which is used to explain the validityof Benford’s law, also justifies the use of a log-normal data distribution.Bredl, et al. [3] have confirmed that financial data can be assumed tohave a log-normal distribution.
The next step in handling an accounting limit is to introduce a cut-offto the log-normal distribution corresponding to the limit. The resultingcut-off log-normal distribution may be used in the analysis.
Thus, the “modified Benford analysis” technique involves:
Identifying a suitable log-normal distribution.
Cutting-off the log-normal distribution at the accounting limit.
Deriving a reference digit distribution from the cut-off log-normaldistribution.
Statistically testing the data against the derived distribution.
A suitable log-normal distribution can be identified by estimating themean and standard deviation parameters from the data. Unfortunately,it is not known a priori if the data contains traces of fraud and wherethese traces are located. Consequently, the identified distribution is af-fected by fraudulent and non-fraudulent postings. In general, the influ-ence of fraudulent postings on the estimated parameters is marginal andthe distortion in the distribution due to these postings is large enoughto be detected during testing.
4. Modified Benford Analysis
Two assumptions are made to simplify the determination of the cut-off log-normal distribution. First, the global data is assumed to have noenforced limits. Second, the distribution of data generated by a singleemployee is assumed to conform to the global distribution except for cut-offs. This may not be true if the employees have different accountingtasks that do not differ only in the accounting limits.

Winter, Schneider & Yannikos 133
Based on the assumptions, the mean and standard deviation of theglobal log-normal distribution are estimated as the empirical mean andstandard deviation of the logarithms of the global data values. Thesevalues are used to create the reference distribution for the overall dataand to calculate a cut-off distribution for individual employees with ac-counting limits.
4.1 Log-Normal Distribution
The desired log-normal distribution is most conveniently obtained bystarting with the normal distribution of logarithms, which has the prob-ability density function g̃ and cumulative distribution function G̃:
g̃(y) =1√2πσ
exp
(− 1
2
(y − µ
σ
)2)
(2)
G̃(y) =
∫ y
−∞
g̃(t)dt (3)
Note that the functions associated with the uncut distribution have atilde (∼) above them to distinguish them from the functions associatedwith the cut-off log-normal distribution.
The distribution is then transformed to the log-normal distributionby calculating the cumulative distribution function F̃ , followed by theprobability density function f̃ , which is the derivative of F̃ :
F̃ (x) = G̃(log(x)
)for x > 0 (4)
f̃(x) =g̃(log(x))
ln(10) · x for x > 0 (5)
4.2 Cut-Off Limits
Introducing a cut-off requires a rescaling of the distribution to obtaina probability mass of 1.0 over the desired range. Given an upper limitM ≤ ∞ and a lower limit m ≥ 0, the updated probability densityfunction and cumulative distribution function are given by:
f(x) =
{f̃(x)
eF (M)− eF (m)for m ≤ x ≤ M
0 otherwise(6)
F (x) =
⎧⎨
⎩
eF (x)− eF (m)eF (M)− eF (m)
for m ≤ x ≤ M
0 otherwise(7)
134 ADVANCES IN DIGITAL FORENSICS VII
!!""
"
#$##%#
#$##&'
#$##&#
#$###'
## &### %### (### )### '###
$####%
#'###
$##&*
#%(
##&'# &##
##)g†(y)
y
0.60.50.40.30.20.1
!1 0 1 2 3 4
log†(5000)
Pr (D
(1) = d)
0.3
0.2
0.1
0
d1 2 3 4 5 6 7 8 9
Cut-offExampleBenford
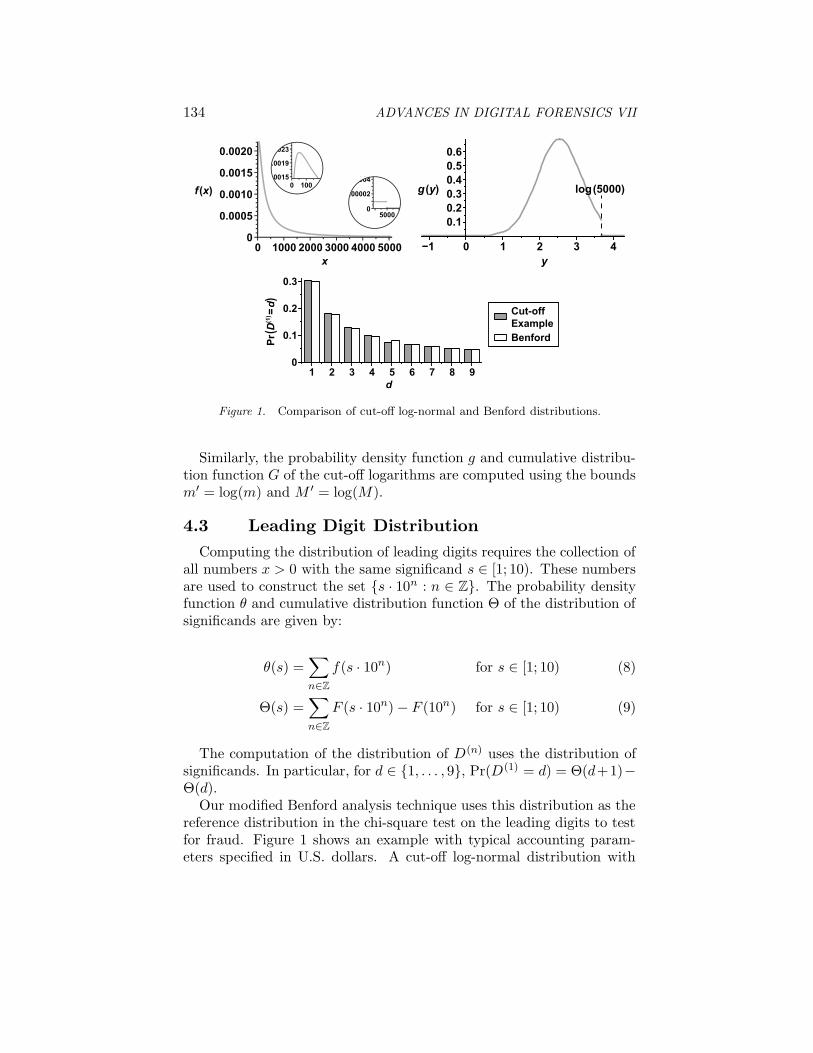
Figure 1. Comparison of cut-off log-normal and Benford distributions.
Similarly, the probability density function g and cumulative distribu-tion function G of the cut-off logarithms are computed using the boundsm′ = log(m) and M ′ = log(M).
4.3 Leading Digit Distribution
Computing the distribution of leading digits requires the collection ofall numbers x > 0 with the same significand s ∈ [1; 10). These numbersare used to construct the set {s · 10n : n ∈ Z}. The probability densityfunction θ and cumulative distribution function Θ of the distribution ofsignificands are given by:
θ(s) =!
n∈Z
f(s · 10n) for s ∈ [1; 10) (8)
Θ(s) =!
n∈Z
F (s · 10n) − F (10n) for s ∈ [1; 10) (9)
The computation of the distribution of D(n) uses the distribution ofsignificands. In particular, for d ∈ {1, . . . , 9}, Pr(D(1) = d) = Θ(d+1)−Θ(d).
Our modified Benford analysis technique uses this distribution as thereference distribution in the chi-square test on the leading digits to testfor fraud. Figure 1 shows an example with typical accounting param-eters specified in U.S. dollars. A cut-off log-normal distribution with

Winter, Schneider & Yannikos 135
µ = log(350), σ = 0.6 and M = 5, 000 is compared with the Ben-ford distribution. Although the distribution of first digits differs onlyslightly from the Benford distribution, the difference could be relevantwhen analyzing large data samples. Table 1 in the next section showsthat Benford analysis yields results of moderate quality for this cut-offlog-normal configuration.
4.4 Alternative Setup
If the data only has enforced limits or if the globally-estimated param-eters are not suitable for the data generated by an individual employee,then the mean and standard deviation of the global set of logarithms arenot suitable parameters. The maximum likelihood method must then beused to obtain suitable parameters. In our case, the maximum likelihoodmethod uses the logarithms of the data values and the density of the cut-off normal distribution to define a likelihood function. An optimizationalgorithm is employed to determine a local optimum of the likelihoodfunction that yields the parameters of the desired log-normal distribu-tion. Note that this step must deal with cut-offs during the parameteridentification step.
5. Results with Synthetic Data
Synthetic accounting data is used to compare the effectiveness of mod-ified Benford analysis versus conventional Benford analysis for two rea-sons. First, it is difficult to obtain real-world accounting data. Second,it is not possible to control the type and amount of fraud present in realdata.
The synthetic data used in the experiments was created by the 3LSPGframework [19]. The simulations produced data corresponding to non-fraudulent and fraudulent employees; the fraudulent employees occa-sionally made unjustified transactions to accomplices. The fraudstersattempted to conceal their activities by choosing amounts that wouldbe checked less carefully. We assumed that amounts of $100 or morerequired secondary approval and, therefore, the fraudsters paid a lit-tle less than $100 (i.e., an amount with 9 as the leading digit) to theiraccomplices. The frequency of occurrence of fraud was set to 0.01.
Table 1 compares the results obtained using modified Benford anal-ysis (MBA) and conventional Benford analysis (BA) for various distri-butions. Each analysis used the chi-square test on the first digits withsignificance α = 0.05. The table reports the number of times the testsmade rejections over 100 simulations. The rejections correspond to truepositive (TP) alerts for fraudsters and false positive (FP) alerts for non-

136 ADVANCES IN DIGITAL FORENSICS VII
Table 1. Comparison of modified and conventional Benford analysis.
Distribution Parameters Sample BA MBALimit µ σ Size TP FP TP FP
∞ log(1, 800) 0.61,000 11 8 11 83,000 25 1 25 19,000 84 5 84 5
5,000 log(1, 800) 0.61,000 100 99 13 43,000 100 100 26 49,000 100 100 91 4
5,000 log(350) 0.61,000 14 6 9 53,000 46 15 33 19,000 93 34 80 1
fraudulent employees. The quality of an analysis technique depends onthe disparity between the corresponding true and false positive counts.
The conventional Benford analysis results vary according to the limitsimposed. The two analysis techniques produce comparable results whenan accounting limit is not imposed (limit = ∞) because the underlyingdistribution of data is sufficiently close to the Benford distribution. How-ever, the effectiveness of conventional Benford analysis diminishes whenthe accounting limit increases the deviation from the Benford distribu-tion. The results show that conventional Benford analysis completelyfails for an accounting limit of $5,000 and µ = log(1, 800). In the casewhere µ = log(350), conventional Benford analysis distinguishes betweenfraudulent and non-fraudulent employees. But if one considers the factthat most employees are not fraudsters, the rate of false positives is toohigh.
The results show that modified Benford analysis performs as well orbetter than conventional Benford analysis in every instance. The falsepositive rate from modified Benford analysis is always low, and the rateof detected cases of fraud grows with the sample size because the discrim-inatory power of statistical tests increases as the sample size increases.
6. Results with U.S. Census Data
The results of the previous section demonstrated that modified Ben-ford analysis is effective regardless of the cut-off log-normal setting.However, while simulated data is guaranteed to match the chosen dis-tribution, real-world data may not fit the log-normal assumption.
This section presents the results obtained with a real-world data setobtained from the U.S. Census Bureau [17]. The data set provides thenumbers of inhabitants in U.S. counties according to the 1990 census.

Winter, Schneider & Yannikos 137
Table 2. U.S. counties with inhabitants within upper and lower limits.
Lower 0 1K 5K 10K 20K 50K 200K 1MUpper
1K 285K 299 271
10K 756 728 45720K 1,463 1,435 1,164 70750K 2,299 2,271 2,000 1,543 836
200K 2,897 2,869 2,598 2,141 1,434 5981M 3,111 3,083 2,812 2,355 1,648 812 214∞ 3,141 3,113 2,842 2,385 1,678 842 244 30
The advantage of using census data over real-world accounting data isthat it can be safely assumed that no fraud exists in the data. Therefore,a Benford analysis technique should result in acceptance; any rejectionis a false alert. Indeed, the chi-square test on the first digits yieldedp = 0.063 – and, thus, no rejection – when using the Benford distributionas reference.
As described earlier, modified Benford analysis requires the computa-tion of the log-normal distribution parameters. The empirical mean andstandard deviation of the logarithms of the census data were µ = 4.398and σ = 0.598. Using these parameters, the chi-square test in a modi-fied Benford analysis yielded p = 0.064. Note that both techniques areapplicable to data without cut-offs.
The cut-offs in Table 2 were applied to test the ability of the modifiedBenford analysis technique to handle cut-offs. The upper and lowercut-off points were used to generate sufficient test cases to compare theaccuracy of conventional and modified Benford analysis. The results arepresented in Tables 3, 4 and 5. Note that p-values smaller than 2−52 ≈2E-16 are set to zero in the tables.
As expected, conventional Benford analysis (Table 3) yields poor re-sults, except for a few cases where the cut-off points introduce minorchanges in the distribution. For α = 0.05, acceptance occurs in onlythree cases (bold values).
A quick fix to conventional Benford analysis that respects the limitsis implemented by changing the Benford distribution of the first digitsto only include the possible digits. The digits that were not possiblewere assigned probabilities of zero while the probabilities for the possibledigits were scaled to sum to one. Table 4 shows that this technique yieldsa marginal improvement over conventional Benford analysis with four (asopposed to three) acceptance cases.

138 ADVANCES IN DIGITAL FORENSICS VII
Table 3. Benford analysis (p-values).
Lower 0 1K 5K 10K 20K 50K 200K 1MUpper
1K 3E-065K 0 0
10K 0 0 020K 0 0 0 050K 0 0 2E-15 0 0
200K 1E-04 9E-05 5E-15 0 0 01M 0.097 0.072 1E-07 0 0 0 0∞ 0.063 0.041 3E-08 0 0 0 9E-16 1E-04
Table 4. Benford analysis with digit cut-off rule (p-values).
Lower 0 1K 5K 10K 20K 50K 200K 1MUpper
1K 3E-065K 0 0
10K 0 0 0.01920K 0 0 1E-11 1.00050K 0 0 2E-15 0.008 0.032
200K 1E-04 9E-05 5E-15 0 0 3E-091M 0.097 0.072 1E-07 0 0 0 0.003∞ 0.063 0.041 3E-08 0 0 0 9E-16 1E-04
Table 5. Modified Benford analysis (p-values).
Lower 0K 1K 5K 10K 20K 50K 200K 1MUpper
1K 0.5755K 0.691 0.549
10K 6E-04 3E-04 0.51020K 7E-04 9E-04 0.275 1.00050K 8E-04 7E-04 0.001 4E-04 0.037
200K 0.032 0.025 0.005 2E-05 1E-06 0.7111M 0.081 0.068 0.044 0.007 1E-04 0.302 7E-06∞ 0.064 0.054 0.033 0.005 0.001 0.588 1E-07 9E-05
The results in Table 5 show that modified Benford analysis yieldsmuch better results – the number of acceptances is thirteen. This resulthas to be qualified, however, because acceptance occurs in the caseswhere the cut-offs do not introduce much distortion and where there are

Winter, Schneider & Yannikos 139
relatively few samples left after the cut-offs are performed. The resultsshow that the log-normal distribution is not ideally suited to the censusdata. Nevertheless, modified Benford analysis yields significantly betterresults than conventional Benford analysis for data with cut-offs.
7. Related Work
Several researchers have defined adaptive alternatives to the Benforddistribution. One approach [8] addresses the issue of cut-offs by adjust-ing the digit probabilities in a manner similar to our quick fix. Otherapproaches [7, 15] employ parametric distributions of digits that arefitted to observed digit distributions by various methods. The latterapproaches, however, are not designed to discover irregularities.
Other researchers, e.g., Pietronero, et al. [12], start with a suitabledistribution model for the data, which they use to derive a referencedistribution of digits. They use power laws that are relevant to theirdomains of application. Note however, that while the approach is similarto the modified Benford analysis technique presented in this paper, itdoes not address the issue of cut-off points.
8. Conclusions
The modified Benford analysis technique overcomes the limitation ofconventional Benford analysis with regard to handling access restric-tions. The technique reduces false positive alerts and, thereby, lowersthe costs incurred in forensic accounting investigations. The false pos-itive rate is independent of the accounting limits because the modifiedBenford analysis technique adapts to the limits.
The results obtained with synthetic and real-world data demonstratethat modified Benford analysis yields significant improvements over con-ventional Benford analysis. Our future research will conduct further as-sessments of the effectiveness of the modified Benford analysis techniqueusing real-world accounting data and fraud cases. Additionally, it willcompare the modified Benford analysis technique with other Benfordanalysis formulations, and identify improved distribution models thatwould replace the log-normal model.
Acknowledgements
This research was supported by the Center for Advanced SecurityResearch Darmstadt (CASED), Darmstadt, Germany.

140 ADVANCES IN DIGITAL FORENSICS VII
References
[1] F. Benford, The law of anomalous numbers, Proceedings of theAmerican Philosophical Society, vol. 78(4), pp. 551–572, 1938.
[2] J. Boyle, An application of Fourier series to the most significantdigit problem, American Mathematical Monthly, vol. 101(9), pp.879–886, 1994.
[3] S. Bredl, P. Winker and K. Kotschau, A Statistical Approach to De-tect Cheating Interviewers, Discussion Paper 39, Giessen ElectronicBibliotheque, University of Giessen, Giessen, Germany (geb.uni-giessen.de/geb/volltexte/2009/6803), 2008.
[4] L. Dumbgen and C. Leuenberger, Explicit bounds for the approxi-mation error in Benford’s law, Electronic Communications in Prob-ability, vol. 13, pp. 99–112, 2008.
[5] C. Durtschi, W. Hillison, and C. Pacini, The effective use of Ben-ford’s law to assist in detecting fraud in accounting data, Journalof Forensic Accounting, vol. V, pp. 17–34, 2004.
[6] N. Gauvrit and J.-P. Delahaye, Scatter and regularity imply Ben-ford’s law . . . and more, submitted to Mathematical Social Sciences,2009.
[7] W. Hurlimann, Generalizing Benford’s law using power laws: Appli-cation to integer sequences, International Journal of Mathematicsand Mathematical Sciences, vol. 2009, id. 970284, pp. 1–10, 2009.
[8] F. Lu and J. Boritz, Detecting fraud in health insurance data:Learning to model incomplete Benford’s law distributions, Proceed-ings of the Sixteenth European Conference on Machine Learning,pp. 633–640, 2005.
[9] S. Newcomb, Note on the frequency of use of the different digits innatural numbers, American Journal of Mathematics, vol. 4(1), pp.39–40, 1881.
[10] M. Nigrini, Digital Analysis Using Benford’s Law, Global AuditPublications, Vancouver, Canada, 2000.
[11] M. Nigrini and L. Mittermaier, The use of Benford’s law as an aid inanalytical procedures, Auditing: A Journal of Practice and Theory,vol. 16(2), pp. 52–67, 1997.
[12] L. Pietronero, E. Tosatti, V. Tosatti and A. Vespignani, Explainingthe uneven distribution of numbers in nature: The laws of Benfordand Zipf, Physica A: Statistical Mechanics and its Applications, vol.293(1-2), pp. 297–304, 2001.

Winter, Schneider & Yannikos 141
[13] R. Pinkham, On the distribution of first significant digits, Annalsof Mathematical Statistics, vol. 32(4), pp. 1223–1230, 1961.
[14] R. Raimi, The first digit problem, American Mathematical Monthly,vol. 83(7), pp. 521–538, 1976.
[15] R. Rodriguez, First significant digit patterns from mixtures of uni-form distributions, American Statistician, vol. 58(1), pp. 64–71,2004.
[16] P. Scott and M. Fasli, Benford’s Law: An Empirical Investigationand a Novel Explanation, Technical Report CSM 349, Departmentof Computer Science, University of Essex, Colchester, United King-dom, 2001.
[17] U.S. Census Bureau, Population Estimates – Counties, Washington,DC (www.census.gov/popest/counties), 1990.
[18] C. Watrin, R. Struffert and R. Ullmann, Benford’s law: An instru-ment for selecting tax audit targets? Review of Managerial Science,vol. 2(3), pp. 219–237, 2008.
[19] Y. Yannikos, F. Franke, C. Winter and M. Schneider, 3LSPG:Forensic tool evaluation by three layer stochastic process based gen-eration of data, in Computational Forensics, H. Sako, K. Franke andS. Saitoh (Eds.), Springer, Berlin, Germany, pp. 200–211, 2011.