Detecting and reducing multicollinearity. Detecting multicollinearity.

DETECTING CHANGES IN TREE TISSUES CHEMISTRY OVER TIME IN NORTHERN
HARDWOODS
by
Yang Yang
A thesis submitted in partial fulfillment of the requirements for the
Master of Science Degree
State University of New York
College of Environmental Science and Forestry
Syracuse, New York
November 2014
Approved: Department of Forest and Natural Resources Management
______________________________ __________________________________
Ruth D. Yanai, Major Professor Charles T. Driscoll, Chair Examining Committee
______________________________ ___________________________________
David H. Newman, Department Chair S. Scott Shannon, Dean, The Graduate School

© 2014
Copyright
Yang Yang
All rights reserved

i
Acknowledgements
Many people have made tremendous contributions to this work. I would like to first express
my special appreciation and thanks to my advisor Dr. Ruth Yanai. She led me to the scientific world,
inspired me with many brilliant ideas, and supported me during my two and a half years in Syracuse.
Ruth exposed me to multiple projects in different topics, which strengthened my skills, including
analysis, communication, and critical thinking. I feel lucky that she took me as one of her master’s
students, and let Syracuse become my first station in the U.S in my life.
I would also like to thank my committee members, Dr. Russell Briggs and Dr. Myron
Mitchell, for all the suggestions and support. Dr. Russell Briggs’s knowledge on soil and statistical
analysis impressed me, and I enjoyed every discussion with him throughout my life here. Dr. Myron
Mitchell’s critical opinions and knowledge on biogeochemistry helped me improve my project
greatly.
Many thanks to Chuck Schirmer and Deb Driscoll for their help in the lab, for guiding me
and assisting me with analyzing hundreds of samples. Thanks to Ian Halm, the site manager at
Hubbard Brook, for helping me collect samples with a chainsaw. Other professors, Dr. Steve
Stehman and Dr. Tim Fahey, also enlightened my thoughts during the past conservations with them.
I’d like to thank Craig See, Franklin Diggs and Kikang Bae for their help in life and in my
studies since I came here. I’d also like to thank Adam Wild, Yi Dong, Brannon Bar, Li Kui, Qin Ren,
and Linghui Meng for their mental supports. I’d like to thank Kara Phelps for checking my grammar
issues. Finally, I’d like to thank my entire family for supporting me doing what I loved and giving
my emotions to moving forward! Thanks ESF and Syracuse, I will never forget the wonderful life
here with all the pains and gains.

ii
Table of Contents List of Tables ............................................................................................................................................................... iii
List of Tigures ..............................................................................................................................................................iv
List of Appendices ......................................................................................................................................................... v
Abstract.........................................................................................................................................................................vi
Chapter 1: Introduction .................................................................................................................................................. 1
Background ............................................................................................................................................................... 1
Roles of nutrients in trees .......................................................................................................................................... 1
Natural variation of nutrient concentrations in trees ................................................................................................. 2
Studies on long-term changes in tree nutrients .......................................................................................................... 4
Chapter 2: Sources of variability in tissue chemistry in northern hardwood species ..................................................... 6
Abstract ..................................................................................................................................................................... 6
1 Introduction ............................................................................................................................................................ 6
2 Materials and methods ........................................................................................................................................... 8
2.1 Study site......................................................................................................................................................... 8
2.2 Field sampling ................................................................................................................................................. 9
2.3 Sample processing and analysis .................................................................................................................... 10
2.4 Data analysis ................................................................................................................................................. 11
3 Results .................................................................................................................................................................. 13
3.1 Accuracy and precision in laboratory ........................................................................................................... 13
3.2 Variability within the tree and among trees .................................................................................................. 13
3.3 Inter-annual variability and long-term changes ............................................................................................ 14
4 Discussion ............................................................................................................................................................ 15
4.1 Effects of element on laboratory precision ................................................................................................... 15
4.2 Effects of element on tree-to-tree and inter-annual CVs ............................................................................... 15
4.3 Effects of tissue type on CVs within the tree, tree-to-tree and inter-annually .............................................. 16
4.4 Comparing magnitudes of different sources of variability ............................................................................ 16
4.5 Long-term changes in tree nutrients .............................................................................................................. 17
5 Conclusions .......................................................................................................................................................... 18
6 Acknowledgements .............................................................................................................................................. 18
Chapter 3: Summary .................................................................................................................................................... 20
Tables and Figures ....................................................................................................................................................... 21
Cited Literature ............................................................................................................................................................ 35
Appendices .................................................................................................................................................................. 39
Vita .............................................................................................................................................................................. 43

iii
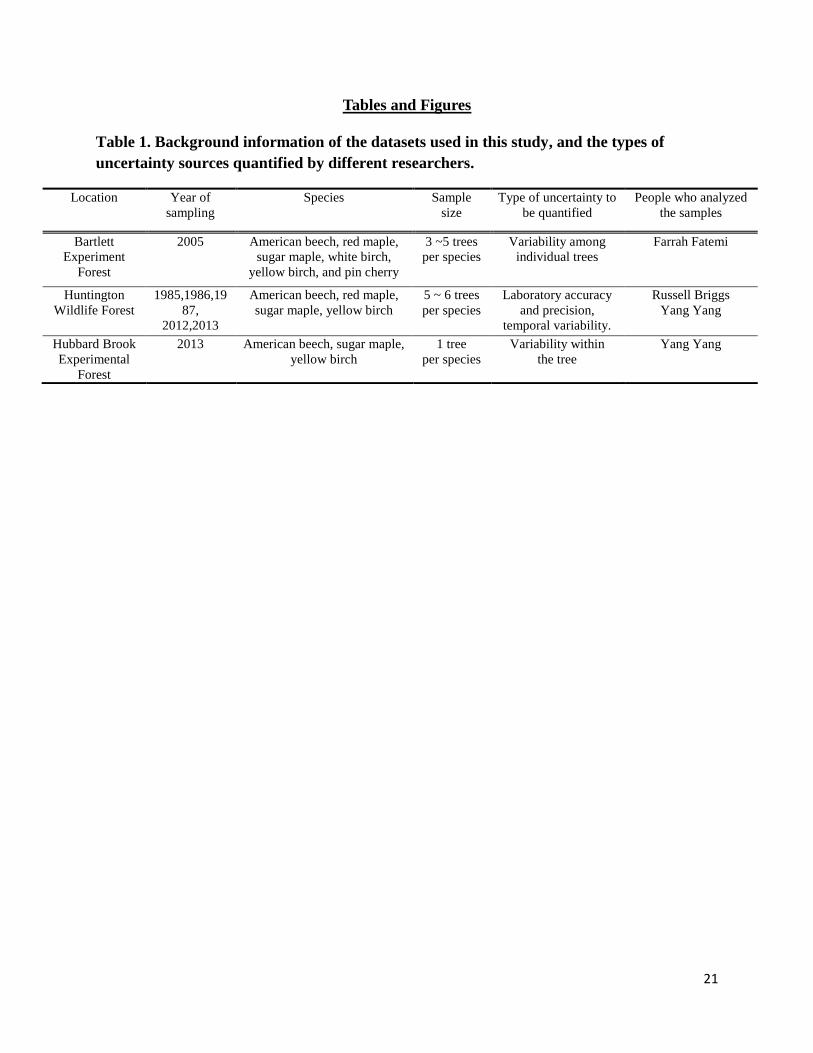
List of Tables
Table 1. Background information of the datasets used in this study, and the types of uncertainty sources
quantified by different researchers…………………………...………………………………...…21
Table 2. Example of ANOVA table for the general linear model for nest-stand selection comparing CV in
nutrient concentrations across element, tissue type, species and stand age. DF denotes degrees of
freedom. * indicates stand was nested in the model for the experimental design…….……….…22
Table 3. A comparison of analysis with the reference (NIST 1515, apple leaves) values using data from
HWF in 2010s. Sample size equals three for P, Ca, Mg and K, and 20 for N. Standard error for
my values and reference values represents the deviation of nutrient concentrations among
replicated samples.………………………………………………………………………………..23
Table 4. Summary of CV in concentrations for different types of variablity. Coefficient of variation for
nutrient element was treating tissue types as replicates. Coefficient of variation for tissue type
was treating nutrient elements as replicates………………………………………………………24
Table 5. Summary of variability in foliar nutrient concentrations (%) within the tree, among trees and
inter-annually for different tree species at different areas………………………………………..25
Table 6. Median nutrient concentrations in bark at five sampled years in four species. Coefficient of
variation (%) was calculated to show the changes in nutrient concentrations across two sampling
periods (1980s vs. 2010s). * indicates p value for unequal two sample t-test is less than 0.05.....26
Table 7. Median nutrient concentrations in branch at five sampled years in four species……………..…27
Table 8. Median nutrient concentrations in foliage at five sampled years in four species………………..28
Table 9. Median nutrient concentrations in wood at five sampled years in four species…………………29

iv
List of Tigures
Figure 1. Sampling strategy for studying variability in nutrient concentrations with the tree by tissue
position at HBEF in 2013…………………………………..…………………………………….30
Figure 2. CV of nutrient concentrations among replicates in the laboratory using data from HWF in 2010s.
Sample size equals three………………………………………………………………………..31
Figure 3. CV of nutrient concentrations within the tree (American beech, sugar maple and yellow birch)
using datsets from HBEF in 2013. Nutrient concentrations used for calculating the CV are in the
Appendices……………………………………………………………………………………......32
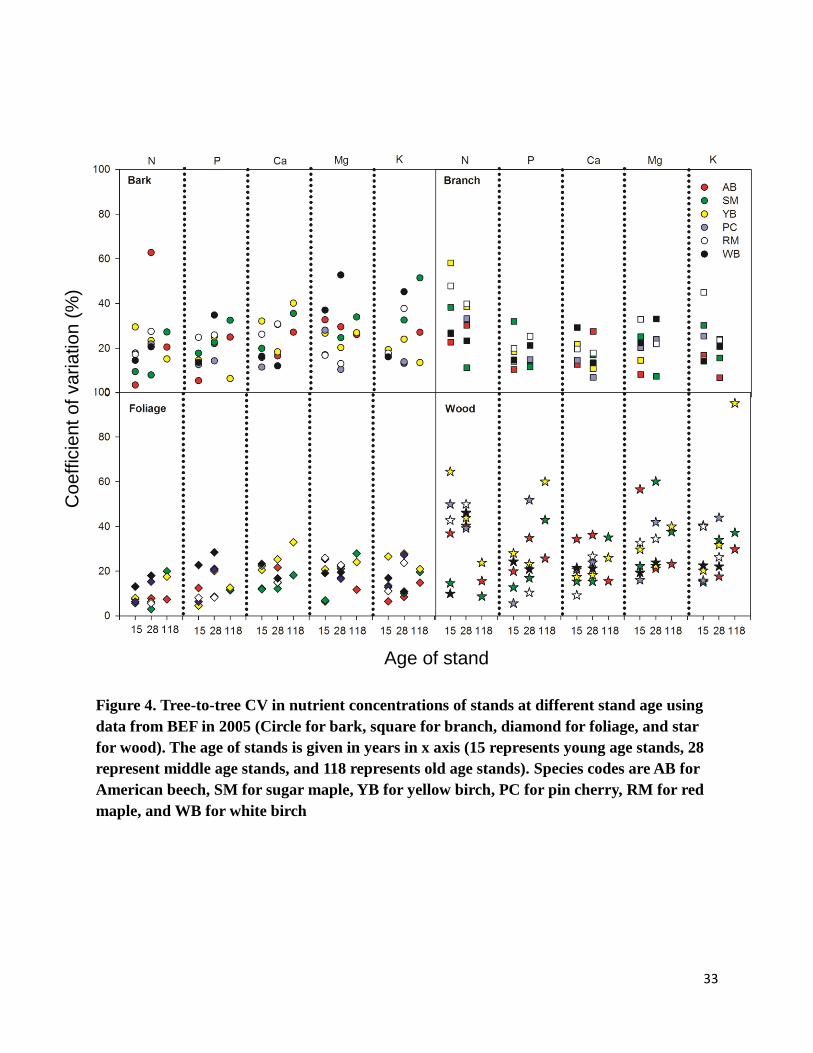
Figure 4. Figure 4. Tree-to-tree CV in nutrient concentrations of stands at different stand age using data
from BEF in 2005 (Circle for bark, square for branch, diamond for foliage, and star for wood).
The age of stands is given in years in x axis (15 represents young age stands, 28 represent middle
age stands, and 118 represents old age stands). Species codes are AB for American beech, SM for
sugar maple, YB for yellow birch, PC for pin cherry, RM for red maple, and WB for white
birch………………………………………………………………………………………...…….33
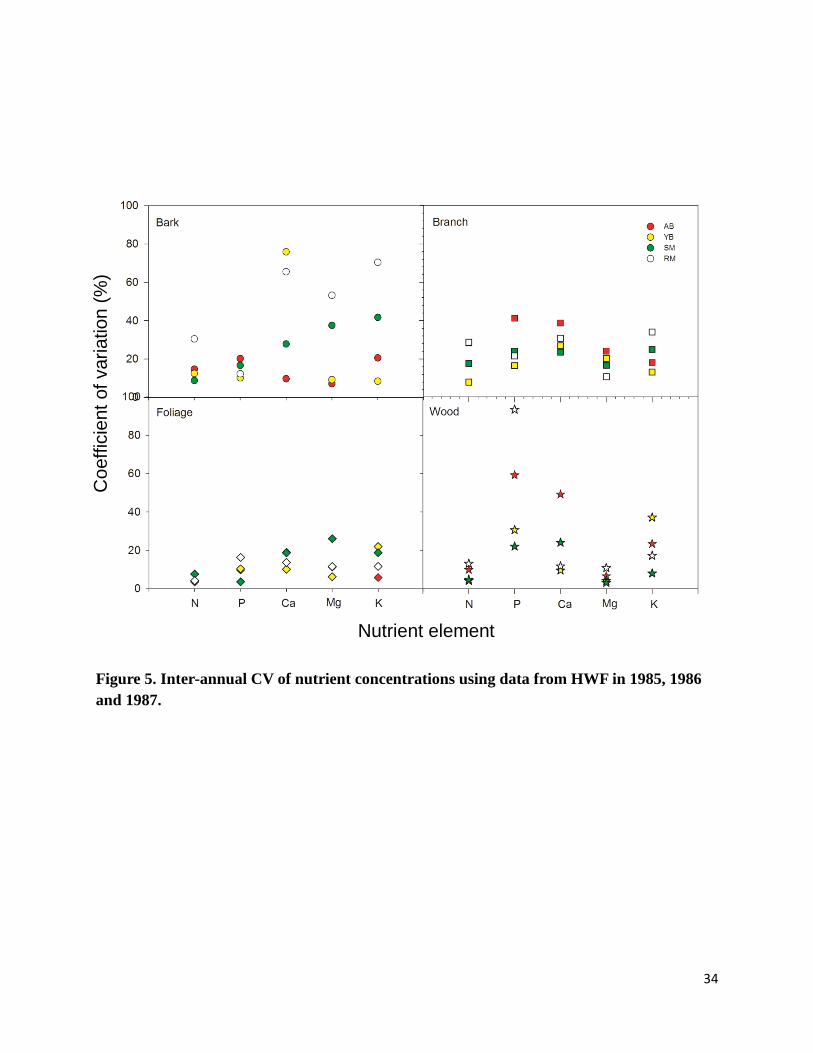
Figure 5. Inter-annual CV of nutrient concentrations using data from HWF in 1985, 1986 and 1987...…34

v
List of Appendices
Appendix 1. Scatterplots of nutrient concentration within the tree by element, tissue type and
species at HBEF……………………………………………….…………....……………39

vi
Abstract
Y. Yang. Detecting Changes in Tree Tissue Chemistry Over Time in Northern Hardwoods, 45 of
pages, 9 of tables, 5 of figures, 2014.
Various sources of uncertainty should be considered in evaluating changes in tree nutrients over a
long-term period. Variability was characterized in laboratory analyses, different sampling
positions within trees, different trees, and variation from year to year, using tissue samples of
northern hardwood species. Uncertainty associated with laboratory analyses differed among
elements with potassium concentration exhibiting the least accuracy and precision. Within trees,
foliage and bark were less variable in nutrient concentration than branches and wood (P < 0.001).
For tree to tree, nitrogen and phosphorus concentrations in leaves were the least variable
resulting in a significant interaction of tissue and element (P = 0.02). From year to year, nitrogen
concentrations in leaves were the least variable (P = 0.03). In monitoring long-term changes in
tree nutrients, a lower sampling intensity is needed to detect a given rate of change in foliar
nitrogen or phosphorus than other elements or tissues.
Keywords: Laboratory precision, within the tree, among trees, inter-annual, sampling effort.
Y. Yang
Candidate for the degree of Master of Science, November 2014
Ruth D. Yanai, Ph.D.
Department of Forest and Natural Resources Management
State University of New York College of Environmental Science and Forestry,
Syracuse, New York
Ruth D. Yanai, Ph.D._______________________________________________

1
Chapter 1: Introduction
Background
In the early 1800s in Europe, De Saussure (1804) identified various chemical elements
that are essential for plant growth. Plant tissue analysis then developed as a means of measuring
the essential nutrients in a sample of plant tissue by Von Leibig (1840). Later, Weinhold (1862)
began to use plant nutrient analysis as an index of available nutrient element supply. Since then,
plant tissue analysis has been widely adopted by other researchers, and has been widely utilized
in crop production for purposes such as making decisions on fertilization use and crop type. In
forested ecosystems, the balance of nutrient concentrations in trees is important to the growth,
reproduction and development of trees. Plant tissue analysis can help correct deficiencies (Beede
et al., 2005) and the time to harvest appropriately (Crow et al., 1991).
In the mid-19th
century, the term “acid rain” was coined by Robert Angus Smith after
deterioration of forests was discovered near industrial areas, coinciding with observations of
damage to plants experiencing acidic precipitation. Acid rain has been found to add nitrogen and
sulfur to ecosystems; oxidized mobile anion forms depletes base cations from soils, thereby
altering the nutrient concentrations and contents in trees (Aber et al., 2003). This change in tree
nutrients may pose a potential threat to forest health and productivity, impairing the
sustainability of forests over the long-term. Thus, the description of changes in tissue chemistry
is important to detecting long-term trends of impacts on forest productivity (Yanai et al., 1999).
Roles of nutrients in trees
Macronutrients such as N, P, Ca, Mg and K are required in large amounts by trees.
Nitrogen and P, which form covalent bonds with CHO skeletons, and a component of essential
molecules such as proteins and nucleic acids. Nitrogen, part of carbon compounds, is required by
plants in the greatest amounts (Gauch 1972; Dickson 1989). Phosphorus, important in energy

2
storage and structural integrity, is the key for respiration and photosynthesis (Taiz and Zeiger,
2006).
Base cations, such as Ca, Mg and K, which are derived from parent material, soil
minerals, and atmospheric deposition also play important physiological roles in trees. Ca and K
contribute to the ionic and osmotic balances of protoplasm and vacuoles, whereas Mg is essential
to energy transfers involving ATP and ADP in trees. Calcium, Mg and K are also the activators
for various enzymes associated with photosynthesis in leaves (Gauch 1972). Leachability from
the foliage and bark is highest for K, relatively low for Ca and Mg, and lowest for N and P
(Carlisle et al. 1966, 1967; Day et al, 1977; Gosz et al, 1975).
Natural variation of nutrient concentrations in trees
Multiple factors can cause the natural variability of nutrient concentrations in trees. 1.
Time and age. Nutrient concentrations in trees can vary during a day, within a year, between
years and at different tree ages. 2. Physiology and morphology. Nutrient concentrations in trees
also vary by tree species, crow class, tissue types, and tissue position. 3. Tree location and
environment. Nutrient concentrations in trees differ in different geographical locations and soils
(site quality).
Some sources of variability in nutrient concentrations have been quantified in foliage for
hardwood species. Within the tree, vertical patterns of macronutrient concentrations in foliage
through the canopy have been summarized as either a decrease from bottom to upper canopy or
from upper to bottom canopy, or no vertical pattern (Van den Driessche 1974). The coefficient of
variation (CV) of foliar nutrient concentrations was within 5% for N and P and 5~10% for
cations for European beech (Fagus sylvatica L.) (Le Tacon and Toutain 1973), sugar maple
(Acer saccharum Marsh.), white ash (Fraxinus americana L.), black cherry (Prunus serotina

3
Ehrh.), yellow birch (Betula alleghaniensis Britton.) (Ellis 1975; Morrison 1985), and red maple
(Acer rubrum L.) (Erdmann et al., 1988). Effects of foliage directional aspect on nutrient
concentrations in the northern hemisphere differ by species within and among sites. Mount Tabor
oak (Quercus ithaburensis Mich.) had higher foliar P in eastern and southern aspects
(Oppenheimer and Halfon-Meiri, 1961), silver birch (Betula verrucosa ehrh.) trees had higher
foliar N in northern aspects than other aspects (Tamm 1951) and Freeman maple (Acer x
freemanii) had lower foliar N in northern aspects and higher foliar Ca in southern aspects
(Mickelbart 2010), with all CVs within 5%. Within the stand, variability in nutrient
concentrations from tree-to-tree was in the similar range (8 ~15% CV for N and P, and 16 ~ 31%
CV for Ca, Mg and K) for red maple, yellow birch and ash (Fraxinus) in Northern Michigan
(Erdmann et al., 1988), and Ontario (Morrison 1985; Ellis 1975). For red maple across sites with
Spodosols, foliar P, Ca and Mg had higher concentrations in a more fertile site with a CV of 9%
for foliar P and more than 20% for foliar Ca and Mg (Erdmann et al., 1988). European beech
foliage had a CV of 5% for N, 7% for P, 11~15% for Ca, Mg and K inter-annually (Duquesnay
et al., 2000).
Variability in nutrient concentration of non-leaf tissues are less studied. Within a tree,
nutrient concentrations in branches decreased with increased branch diameter. For quaking aspen
(Populus tremuloides Michx.) and yellow birch, branch wood had a CV of 56% for N, 49% for
Ca, 37% for Mg and 44% for K, and branch bark had a CV of 28% for N, 33% for Ca, 16% for
Mg and 28% for K from 0-75 mm of branch in Ontario (Hendrickson 1987). For sugar maple,
yellow birch and American beech (Fagus grandifoliaEhrh.), branch wood and bark had a CV of
38% for N and K from 0-30 mm of branch in New Hampshire, USA (Whittaker et al., 1979).
Nutrient concentrations in stem wood varied radially with higher concentrations of N, P and K in

4
sapwood than in heartwood. For a meta-analysis of 50 hardwood species across 42 stands,
concentration of N and P (27% CV for N, 62% CV for P) had a higher radial variability in wood
disk samples than Ca, Mg and K (1% for Ca, 10% for Mg and 26% for K) within a tree (Meerts
2002). Within the stand, the variability in nutrient concentrations among individual trees of the
same species was smaller for N (CV=4~11%) compared with P, Ca, Mg and K (CV=11~33% for
P, 14~27% for Ca, 12~29% for Mg and 11~16% for K) for ash, European beech, yellow birch
and oak (Quercus) in European countries (Hagen-Thorn et al., 2004).
Studies on long-term changes in tree nutrients
Over a long-term period, cation depletion in tree tissues, especially in foliage, has been
caused by acidic deposition (“acid rain”) (Lovett et al., 1985; Johnson et al., 1985) accompanied
by an increase of nitrogen (Flückiger and Braun, 1998; Duquesnay et al., 2000; McNeil et al.,
2007) and a decrease of phosphorus (Flückiger and Braun, 1998; Duquesnay et al., 2000).
Methods of sampling tissues can affect the variability of nutrient concentrations. For
foliage, sampling on the southern and eastern sides of a tree is recommended due to the lower
variation in nutrient concentrations at these locations (Mickelbart 2010). Branch diameters are
rarely recorded or reported when sampled. One study sampled branches in a range of diameters
(1-4 cm) to exclude the variation caused by branch diameter (Santa et al., 1997). For wood
samples, two methods, coring and disk sampling, are commonly used. Cores of the tree bole are
taken using an increment borer; this method is more popular than disk sampling because it is
more efficient and does little damage to the tree (Arthur et al, 1999); However, this method
underestimated the concentrations of N-P-K in the sapwood and overestimated the Ca-Mg
concentrations in the heartwood compared to disk sampling for maritime pine (Pinus pinaster
Ait.) in south-western France (Augusto and Bert, 2005). Considering the inter-tree variability, a

5
sampling intensity of 5~ 10 replicate trees per plot is commonly employed for intensive
monitoring projects to produce a relatively smaller variation (CV ≤ 10%; De Vries et al., 1998).
Collection of tree tissues is usually conducted in late summer when seasonal variations in
nutrients are lower and nutrients are relatively stable (Alban 1985).
A comparison of errors from various uncertainty sources has not been conducted,
especially within the same forest region. To study long-term changes in tree nutrients, guidelines
need to be developed for sampling efforts within the tree, among trees, and within the stand. To
detect change in tree nutrients over decades requires information about previous sampling site,
sampling methods, analyzing methods and the associated inter-annual variation data. Missing
documents or vague descriptions of sampling methods may introduce bias to sampling schemes
repeated from previous studies. The changes in tissue chemistry over time should be reported
with known statistical confidence in the future.
6
Chapter 2: Sources of variability in tissue chemistry in northern hardwood species
Abstract
Various sources of uncertainty should be considered in evaluating changes in tree nutrients over
a long-term period. Variability was characterized in laboratory analyses, different sampling
positions within trees, different trees, and variation from year to year, using tissue samples of
northern hardwood species. Uncertainty associated with laboratory analyses differed among
elements with potassium concentration exhibiting the least accuracy and precision. Within trees,
foliage and bark were less variable in nutrient concentration than branches and wood (P < 0.001).
For tree to tree, nitrogen and phosphorus concentrations in leaves were the least variable
resulting in a significant interaction of tissue and element (P = 0.02). From year to year, nitrogen
concentrations in leaves were the least variable (P = 0.03). In monitoring long-term changes in
tree nutrients, a lower sampling intensity is needed to detect a given rate of change in foliar
nitrogen or phosphorus than other elements or tissues.
Keywords: Laboratory precision, within the tree, among trees, inter-annual, sampling effort.
1 Introduction
Acidic deposition has added nitrogen and sulfur to ecosystems but has depleted nutrient
base cations from soils due to the importance of nitrate and sulfate serving as mobile anions,
posing a potential threat to forest health and productivity (Aber et al., 2003). Nutrient
concentrations in tree tissues affect forest growth and can be used to diagnose the nutritional
disturbances. The abnormal changes of nutrient concentrations under acidic deposition have been
well documented for foliage. In France, increases in foliar N concentration and decreases in
foliar P, Ca, Mg, and K have been reported for European beech (Fagus sylvatica L.) over 26
years (Duquesnay et al., 2000). A similar pattern has been observed in beech and oak over 16

7
years in Belgium-Wallonia and Luxemburg (Jonard et al., 2009), and in beech over an 11 year
period in Switzerland (Flückiger and Braun, 1998). Throughout the United States and Canada,
higher concentration of foliar N and lower concentration of foliar Ca and Mg have been reported
in American beech (Fagus grandifolia Ehrh.), sugar maple, and yellow birch at locations with
greater rates of N deposition (Boggs et al., 2005). Non-leaf tissues such as boles and branches,
are rarely studied because they are more difficult to sample repeatedly, though these tissues
contain a larger amount of nutrients than leaves due to the former’s much greater biomass
(Whittaker et al., 1979). More description of changes in nutrient concentrations in these tissues
over time is essential to detecting long-term trends and understanding the effects of
environmental stresses on forested ecosystems.
Reports of long-term change in tree nutrients should contain errors from 2 sources of
uncertainty. Measurement error comes from the procedures of collecting samples and analyzing
them in the laboratory. Changes in methods of sample collection could contribute to differences
in nutrient concentrations measured at two different times. Differences in laboratory methods
and accuracy used to quantify nutrient concentrations could also potentially contribute variation
in nutrient concentrations; these differences may be mistakenly attributed to the actual
differences in the nutrient concentrations of samples, but can be minimized with proper use of
the standard reference materials. Another source of uncertainty, sampling error, comes from the
location and time of sampling, Nutrient concentrations in foliage varied by crown class, position
in crown, time of year, site properties (Van den Driessche, 1974; Luyssaert et al., 2002). Thus,
samples collected in different positions with a tree, for different individuals of the same species
and at different time period could result in differences that could be mistaken for detecting long-
term change. The magnitude of these two sources of uncertainty, measurement error and

8
sampling error, have not been well characterized for foliage, much less for non-leaf tissues of
different forest types. A comparison of uncertainty from multiple stands, individual trees by
species, tissue types and elements, would help determine which sources most affect the accuracy
of the results and need more sampling effort.
This study took advantage of nutrient datasets at six sampling years and three sites.
Nutrient concentrations (N, P, Ca, Mg and K) of four tissue types (bark, branch, foliage and
wood) were investigated in six dominant species, American beech, red maple, sugar maple,
white birch (Betula papyrifera Marshall.), yellow birch, and pin cherry (Prunus pensylvanica
L.f.), in the BEF (Bartlett Experimental Forest) in 2005; in the HWF (Huntington Wildlife Forest)
in 1985, 1986, 1987, 2012 and 2013; and in the HBEF (Hubbard Brook Experimental Forest) in
2013. The main purpose of this study was to compare the magnitude of different sources of
uncertainty in studying long-term changes in nutrient concentrations in northern hardwoods.
Four sources of uncertainty were characterized using different datasets (Table 1): Laboratory
accuracy and precision, within the tree, tree to tree, and year to year. The effects of tissue type
and element on the uncertainty were reported in this study as well.
2 Materials and methods
2.1 Study site
The HBEF and BEF are located in the White Mountain National Forest in central New
Hampshire. One old stand (> 100 yrs old) was selected for this study at the HBEF, and six stands
were selected at the BEF consisting of two stands for each of three stand ages (young at 15 yrs
old, middle at 30 yrs old and old at 100 yrs old). The HWF is located in the Adirondack
Mountains of northern New York. The old stand selected for this study at the HWF is near the
Integrated Forest Study site (IFS; Johnson and Lindberg, 1992) and outside of the Arbutus

9
Watershed (Mitchell et al., 2002). For all three sites, young and middle-aged stands were
dominated by American beech, yellow birch, red maple, white birch and pin cherry. Old stands
were dominated by American beech, sugar maple and yellow birch. The annual mean
temperature is 4.4 ˚C in all three sites with an annual precipitation of 130 cm at HBEF and BEF
and 101 cm at HWF (Likens et al., 1977; Bailey et al., 2003; Shepard et al., 1989). Well-drained
Spodosol (Haplorthords) developed from glacial drifts are mainly loam at all three sites
(Huntington et al., 1988; Vadeboncoeur et al., 2014; Somers, 1986).
2.2 Field sampling
Sampling at HBEF: To address the variability of nutrient concentrations within the tree,
one tree of each of three species (American beech, sugar maple and yellow birch) with DBH
about 30 cm was selected and cut down in June 2013 near watershed 7. Branch samples were
collected at four branch diameters (0.5, 1, 2, and 3 cm). Thirty leaves without petioles and free
from disease and insect herbivory were collected at three canopy positions (bottom, middle and
upper). Disks were collected from the bole of each tree at three heights (Figure 1).
Sampling at BEF: To report the variability of nutrient concentrations among trees, a total
of 101 trees of 6 species were cut down in 2005 (American beech, red maple, sugar maple, white
birch, yellow birch and pin cherry) (Fatemi, 2007). In young and middle age stands, cut trees had
DBH ranging from 2 to 12 cm. Leaves with petioles from the canopy, branches and disk samples
along the stem were collected in the field. In old stands, trees with DBH larger than 12 cm were
selected for three species (American beech, sugar maple and yellow birch). Bark was collected
from the stem at 1.5 m with a chisel and hammer. Leaves with petioles were sampled using a 12-
gauge shotgun. Two tree cores deep to the pith were also taken from each tree at approximately
1.0 m height.

10
Sampling at HWF: In 1985, a survey line was established around the Integrated Forest
Study site consisting of 39 points encompassing 4.7 ha (Johnson and Lindberg, 1992). The same
survey line was re-established prior to every sampling period. In August of 1985, 1986, 1987,
2012 and 2013, at least five trees of each of four species (American beech, sugar maple, red
maple and yellow birch) with DBH > 10 cm were selected for sampling along the survey line.
Trees nearest each sample point were selected in the 1980s. Because of destructive sampling for
allometric analysis (Briggs et al., 1989), not all the sampled trees were the same in 1985-1987
and 2012-2013, but were the same in 2012 and 2013.
Bark was collected from the stem at 1.3 m with a chisel and hammer. Two branches from
each tree were cut from the base of the crown, at least 1 m from the trunk, using a ladder and
pruner. Twenty to thirty pathogen-free leaves with petiole attached were collected from the cut
branches of each tree. Three cores were collected from each tree at breast height using a
Pressler’s increment borer (5 mm diameter).
2.3 Sample processing and analysis
Samples from HBEF and HWF: Three disks of each of three trees collected from the
HBEF were dissected into bark and wood in the laboratory. Wood samples were separated into
lightwood and darkwood based on color using a clean chisel. Bark samples collected from the
HBEF and the HWF were examined and washed in a phosphorous-free detergent solution (1%
Alconox) if lichens or algae existed, and then rinsed three times in deionized water (Likens and
Bormann, 1970).
All the foliage, branch, bark and wood samples from two sites were dried at 60 ˚C and
ground in a Wiley mill to pass a 20 mm mesh screen. Total N was analyzed using a Kjeldahl
digestion method in the 1980s and a carbon-nitrogen elemental analyzer (Thermo Electron

11
Corporation, EA1112 elemental analyzer, SUNY-ESF) in 2012 and 2013. Subsamples were
ground to pass 40 mm mesh screen, ashed at 470 ˚C and dissolved in 5 mL of 6 molar HNO3 on
a hot plate (Siccama et al., 1994). Concentrations of P, Ca, Mg and K were determined by
Perkin-Elmer Optima 3300DV ® inductively coupled plasma optical emission spectroscopy
(ICP-OES) for all samples. National Institute of Standards and Technology (NIST) solid
standard reference material (NIST 1515, apple leaves) was analyzed along with all samples, and
was also run after every ten samples. The recovery of NIST standards was controlled within 5%.
Samples were re-processed and the analyzer was recalibrated when the recovery was larger than
5%.
Samples from BEF: Samples were oven-dried at 60 ˚C and ground in a Wiley mill to pass
a 20 mm mesh screen (Fatemi, 2007). Total N was determined using the carbon-nitrogen
elemental analyzer. Subsamples were ground to 40 mm using a Wig-L-Bug®, and were ashed at
470 ˚C and digested in either a microwave oven (9 mL of 6M HNO3) or by using the hot-plate
procedure (5 mL of 6M HNO3). Concentrations of P, Ca, Mg and K were determined by ICP-
OES. NIST 1515 apple leaves were used as the standard reference material every 10 samples to
check for machine accuracy and precision.
2.4 Data analysis
To describe the laboratory precision, the coefficient of variation (CV, the standard
deviation as a percentage of the mean) in nutrient concentrations was calculated among
duplicates using data from the HWF in the 2010s. A general linear model was used to test the
effects of element and tissue type on CV in nutrients among duplicates treating CV as the
dependent variable. I reported my values of certified standards (NIST 1515, apple leaves) to
ascertain laboratory accuracy. The bias of the recovery (the differences between actual recovery

12
and 100%) was calculated, and a t–test was used to determine whether the bias was different
from zero. Coefficients of variation were log transformed in all of the analysis to meet the
assumption of normality of the residuals.
Coefficient of variation in nutrients across different tissue positions was reported within
the tree by element and tissue type using data from the HBEF. A general linear model was used
to test the effects of element and tissue type on CV in nutrients within the tree. To describe
variability of nutrients among individuals for the same species, data from the BEF in 2005 was
used and tree-to-tree CV in nutrient concentrations was calculated by element, tissue type and
species for each stand. A general linear model for nest-stand selection (Table 2) was used to test
the main effects of element, tissue type, species, stand age and their interactions on CV in
nutrients among trees.
Samples collected in 1985, 1986 and 1987 at the HWF were used to describe the inter-
annual variation in nutrient concentrations by tissue type, element and species. Coefficient of
variation in nutrients across the three sampling years was calculated, and a general linear model
was used to test the effects of element, tissue type and species and their interactions on inter-
annual CV with Tukey’s honestly significant differences. Long-term changes in nutrient
concentrations between the two sampling periods at HWF (1980s and 2010s) were reported.
Median nutrient concentrations of replicate individuals by element, tissue type and species at
each of five sampling years were used to analyze the long-term changes in tree nutrients using an
unequal two sample t-test (three years in the 1980s and two years in the 2010s). Significance for
statistical analysis was set at α = 0.05, and statistical analysis was conducted with SAS 9.4 (SAS
Institute, Raleigh, NC).

13
3 Results
3.1 Accuracy and precision in laboratory
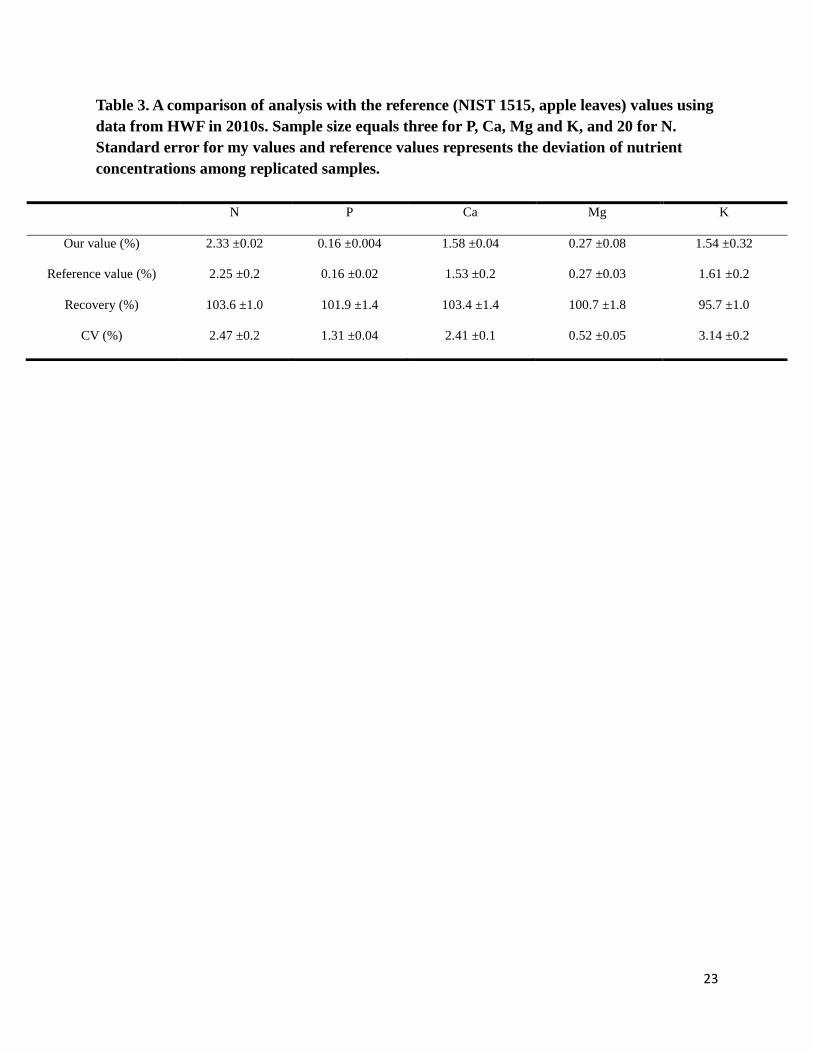
Accuracy and precision were calculated using data from the HWF in 2010s. The accuracy
of tissue element concentrations were within the range of 95~104% (Table 3) compared with the
reference sample (NIST1515-apple leaves). Values were 3% higher than the reference values for
N and Ca, and 4% lower for K (P = 0.01).
The precision were within 8% by tissue and element in the laboratory, in unit of CV.
Tissue type differed among duplicates (P = 0.05) with bark showing the largest variability (CV =
3.2%) and foliage showing the smallest (CV = 1.55%). Elements differed in CV in laboratory
analysis (P = 0.01) with K exhibiting the largest variability (CV = 5.2 %) and N showing the
smallest (CV = 1.3 %).
3.2 Variability within the tree and among trees
Coefficient of variation in nutrient concentrations due to sampling position was
calculated using data from the HBEF in 2013. Tissue types differed in CV (P < 0.001) within the
tree with darkwood showing the largest variability (CV= 44%) and foliage and bark exhibiting
the smallest (CV= 12%) (Figure 3). Elements also differed in CV (P = 0.08) with K having the
largest variability (CV = 29%) and N having the smallest (CV = 18%).
Coefficient of variation in nutrient concentrations among trees was calculated using data
from the BEF in 2005. Species had similar tree-to-tree CVs (CV = 21~25%) among stands at the
Bartlett site (P = 0.19) (Figure 4). Tree-to-tree CV depended on the tissue type (P < 0.001), with
wood having the largest variability (CV = 30%) and foliage having the smallest (CV = 16%)
(Figure 4). Tree-to-tree CV also varied by element (P = 0.03) with K showing the largest (CV =
24%) and N showing the smallest (CV = 19%) (Figure 4). Stand age had a significant effect on

14
tree-to-tree CV (P = 0.002) in that old stands had higher variability (CV = 26%) and young
stands had the least (CV = 21%). Wood N was especially variable (CV = 35%) and foliage N and
P were the least variable (CV = 11%), resulting in a significant interaction of tissue and element
(P =0.02). Different individuals of sugar maple in old stands varied most (CV = 29%) in nutrient
concentrations and American beech in young stands varied the least (CV= 19%), resulting in a
significant interaction of stand age and species (P=0.05).
3.3 Inter-annual variability and long-term changes
Inter-annual CV in nutrient concentrations was calculated using data from the HWF in
1980s. Species differed significantly in inter-annual CV (P = 0.06), with red maple exhibiting the
largest variability (CV = 28%) and yellow birch showing the smallest (CV = 17%) (Figure 5).
Elements also differed in inter-annual CV (P = 0.001), with Ca exhibiting the largest variability
(CV = 28%) and N again showing the smallest (CV = 13%) (Figure 5). Tissue type differed in
inter-annual CV (P = 0.001) with bark showing the largest variability (CV = 28%) and foliage
showing the smallest (CV = 12%). Wood P was especially variable (CV = 51%) and foliar N was
the least variable (CV = 6%), resulting in a significant interaction of tissue and element (P
=0.03).
Compared with nutrient concentrations in trees in 1980s, concentrations of foliar N (P ≤
0.03) reported in red maple, sugar maple and yellow birch was higher, and concentration of foliar
K (P = 0.02) reported in American beech was lower in 2010s (Table 8). For non-leave tissues,
concentration of bark N (P = 0.02) in American beech (Table 6), and concentrations of branch Ca
(P ≤ 0.02) in red maple and sugar maple were both higher in 2010s than in 1980s (Table 7).
Concentrations of wood Ca and Mg (P ≤ 0.02) reported in red maple (Table 9), and concentration
of branch K (P = 0.04) reported in yellow birch were both lower in 2010s than in 1980s (Table 7).

15
4 Discussion
4.1 Effects of element on laboratory precision
For laboratory precision (CV in nutrient concentrations among duplicates), element was
the main factor driving the difference (Figure 2). Concentration of K was the least precise,
having the largest CV among replicates compared with other elements in this study. Since K
suffers from ionization effects in the presence of other alkali metals, it is necessary to quantify K
in a radial mode (torch positioned vertically in relation to the optical system) (Method 200.7,
USEPA 2004). Concentrations of P, Ca and Mg were quantified in an axial mode (which is about
ten times more sensitive as radial mode). Thus K suffers from poor precision due to very low
signal magnitude. In ICP-OES, potassium (~5 ppb) had a relatively higher detection limits than P
(~1.55 ppb), Ca (~0.003 ppb) and Mg (~0.01 ppb) in ICP-OES. However, the measured
concentrations of actual samples were at least 500 times higher than the detection limits which
suggested that the difference in detection limits of elements might not be a reason to cause K to
be less precise.
4.2 Effects of element on tree-to-tree and inter-annual CVs
Element was the main factor driving the differences among tree-to-tree (Figure 4) and
inter-annual (Figure 5) CVs in nutrient concentrations. Potassium was found to be the most
variable element from tree to tree (Figure 4) which might be due to the varying degrees of
leaching for different individual trees. Leachability is the highest for K, relatively low for Ca and
Mg, and lowest for N and P especially in bark and foliage (Carlisle et al. 1966, 1967; Day et al,
1977; Gosz et al, 1975). Nitrogen was found to be the most stable element from tree to tree
(Figure 4) and inter-annually (Figure 5) which might be attributed to the specific amounts of N
needed for biochemical function in trees at one time period (Canadell and Vilà,1992).
16
4.3 Effects of tissue type on CVs within the tree, tree-to-tree and inter-annually
Tissue type was mainly driving the differences of CVs in nutrient concentration within
the tree (Figure 3), tree-to-tree (Figure 4) and inter-annually (Figure 5). Within the tree, nutrient
concentrations within the same tissue type varied by position. Coefficient of variation in nutrient
concentrations was 32% greater in darkwood than in foliage, in units of CV (Figure 3). Within
the tree, the upper stem is composed of the newly formed darkwood, whereas the lower stem has
relatively older darkwood. Accumulation of secondary metabolites, formation of tyloses (Taylor
et al., 2002), and fungal infection (Ostrofsky et al., 1997) vary by the age of the darkwood,
resulting in differences in nutrient concentrations. Nutrients from newly formed heartwood
would recycle back into the sapwood (Bamber and Fukazawa, 1985) which might result in this
great difference in nutrient concentrations for darkwood at different vertical sampling positions.
The variation in foliar nutrient concentrations across the three canopy positions was the smallest
in this study (CV=12%). In sugar maple (Wallihan 1944) and red maple (Erdmann et al., 1988),
similar concentrations of foliar N, P, K and Ca were found in sun leaves and shade leaves. Foliar
K was found to be higher in sun leaves than shade leaves in sugar maple, yellow birch and
American beech; however, there was no difference based on leaf position for Ca or Mg
concentrations (Likens and Bormann 1970). For tree-to-tree and inter-annual CVs in nutrient
concentrations, foliar nutrient concentrations were found to be less variable than nutrient
concentrations in non-leaf tissues (Figure 4 and 5), with reasons unknown.
4.4 Comparing magnitudes of different sources of variability
To study long-term changes in tree tissue chemistry, laboratory analyses introduced only
slight variation, compared to other sources in this study (Table 4). Treating tissue types as
replicates, variation of nutrient concentrations for five elements was smallest among duplicates

17
in the laboratory (CV ≤ 5%). Treating elements as replicates, variation of nutrient concentrations
for four tissue types was also the smallest (CV≤ 3%). Bark and wood (CV = 3~35%) had
relatively larger variation for four uncertainty sources than branch and foliage, and foliage had
the smallest variation (CV = 2~16%).
Within the tree, the variability observed in nutrient concentrations in foliage across
canopy position (5% in N and P, and 12% in Ca, Mg and K) (Figure 3) was similar to that
reported in other studies (Table 5. Ellis 1975; Morrison 1985; Erdmann et al., 1988). Tree-to-tree
CV of foliar N and P was 11% in this study, which was similar to studies for maple, birch and
ash (CV = 8~15%) (Table 5. Erdmann et al., 1988; Morrison 1985; Ellis 1975). Similar inter-
annual variability in concentrations of N and P in foliage (CV=5~7%) was also found in other
studies (Ljungström and Nihlgård, 1995; Duquesnay et al., 2000).
4.5 Long-term changes in tree nutrients
Over extended periods, concentration of K reported in foliage and concentrations of Ca
and Mg reported in wood in the studied species were lower in the 2010s (Table 8, Table 9). The
CV in concentration of K (27%) in foliage across 25 years was higher than the CV within the
tree (12%) and tree-to-tree (16%) in this study. The CV in concentrations of Ca (40%) and Mg
(54%) in wood in red maple across 25 years was again higher than the CV within the tree (35%)
and tree-to-tree (30%). It is possible that the decreased concentration of K in foliage and
concentration of Ca and Mg in wood was a real trend since the long-term variation of nutrients
was larger than the possible sampling error. The decreasing trend of cation concentrations was
also found in other studies but only for foliage (Lovett et al., 1985; Johnson et al., 1985).
Concentration of branch Ca in maple was reported higher in the 2010s (Table 7), probably
because the study site (HWF) is a base rich site.

18
Concentration of foliar N in red maple, sugar maple and yellow birch was reported higher
in 2010s (Table 8) though the rate of nitrogen deposition occurring at Huntington decreased from
4.9 kg ha-1
year-1
in 1980s to 3.3 kg ha-1
year-1
(National Atmospheric Deposition Program
Network). Only the CV in concentration of foliar N (21%) across 25 years in sugar maple, was
higher than the CV within the tree (6%) and tree-to-tree (11%). This did not occur in yellow
birch or red maple. Thus, only the increased concentration of foliar N in sugar maple might be
real in this study.
5 Conclusions
Among all the uncertainty sources described here, variability within the tree, among trees
and inter-annually was relatively larger than variability among duplicates in the laboratory.
Sampling position within the tree should be consistent for repeated samplings, and replicated
individual trees or years is also necessary due to the large uncertainty. Though variability in the
laboratory analysis was the smallest among all uncertainty sources, there is a concern over
analytical determination of K concentration since it had the largest variability in the laboratory.
To detect long-term changes in tree nutrient concentration, wood should be sampled more
intensively than foliage, bark or branches, with darkwood and lightwood separated for analysis.
Foliage is the easiest tissue to monitor for changes over time, because it exhibits the least
variability among samples. For elements, N and P had the smallest variability within the tree,
inter-tree and inter-annually. To detect different elements in various tissue types of trees, foliar N
and P would require less sampling effort compared with cation elements in non-leaf tissues.
6 Acknowledgements
We sincerely thank Dr. Russell Briggs and Dr. Myron Mitchell for providing field
information for sampling. We also thank Ian Halm, Yi Dong, Hongzhang Kang, Allison Spector

19
and Guole Shi for sampling assistance and Debra Driscoll, Chuck Schirmer and Craig See for
laboratory analysis. This project was funded by grants from the USDA-NRICGP (93-37101-
8582) and NSF (DEB-0235650 and DEC-0949324). This paper is a contribution to QUEST
(Quantifying Uncertainty in Ecosystem Studies) (http://quantifyinguncertainty.org/).
20
Chapter 3: Summary
To detect long-term changes in tree nutrients in different sites, it is necessary to keep the
sampling protocol consistent over time. The initial design of sampling methods for long-term
monitoring should be based on the observed variation in the current study site and in similar
earlier studies. Variability within the tree, among trees, and inter-annually has been examined
separately in the past, but all factors were not considered. Researchers have often studied foliage
but there are fewer studies on non-leaf tissues.
It is not possible to quantify all sources of uncertainty when reporting long-term changes
in tree nutrients. Some other related uncertainty sources, such as seasonal nutrient variation, were
not considered in this study. Among all the uncertainty sources studied here, variability in the
laboratory was the smallest; however, special attention should be given to enhancing quality
control through the use of standard reference materials. Variability in nutrient concentrations was
relatively smaller in foliage than in non-leaf tissue within the tree, among trees and inter-
annually. Concentrations of foliar N and P were the least variable for all the uncertainty sources
in this study. Sampling efforts could be allocated more efficiently if the sample size necessary to
detect differences were estimated in advance. Sample size should be calculated based on the
variability at different scales (within a tree, within a stand, across stands) and the objectives of
the study. This research provided a comprehensive study of different sources of variability in tree
tissue analysis. Future research should focus on calculating the actual required sampling effort
according to the sources of uncertainty in northern hardwood species.
21
Tables and Figures
Table 1. Background information of the datasets used in this study, and the types of
uncertainty sources quantified by different researchers.
Location Year of
sampling
Species Sample
size
Type of uncertainty to
be quantified
People who analyzed
the samples
Bartlett
Experiment
Forest
2005 American beech, red maple,
sugar maple, white birch,
yellow birch, and pin cherry
3 ~5 trees
per species
Variability among
individual trees
Farrah Fatemi
Huntington
Wildlife Forest
1985,1986,19
87,
2012,2013
American beech, red maple,
sugar maple, yellow birch
5 ~ 6 trees
per species
Laboratory accuracy
and precision,
temporal variability.
Russell Briggs
Yang Yang
Hubbard Brook
Experimental
Forest
2013 American beech, sugar maple,
yellow birch
1 tree
per species
Variability within
the tree
Yang Yang

22
Table 2. Example of ANOVA table for the general linear model for nest-stand selection comparing
CV in nutrient concentrations across element, tissue type, species and stand age. DF denotes
degrees of freedom. * indicates stand was nested in the model for the experimental design.
Source DF Sum of Squares Mean Square F-value P-value
Model 17 9.81 0.58 5.34 < 0.0001
Error 552 59.71 0.11
Corrected Total 569 69.52
Stand age 2 1.39 0.69 6.40 0.002
Species 5 1.17 0.23 2.16 0.06
Tissue 3 5.35 1.78 16.50 <0.0001
Element 4 1.20 0.30 2.78 0.03
*Stand 3 0.70 0.23 2.16 0.09
23
Table 3. A comparison of analysis with the reference (NIST 1515, apple leaves) values using
data from HWF in 2010s. Sample size equals three for P, Ca, Mg and K, and 20 for N.
Standard error for my values and reference values represents the deviation of nutrient
concentrations among replicated samples.
N P Ca Mg K
Our value (%) 2.33 ±0.02 0.16 ±0.004 1.58 ±0.04 0.27 ±0.08 1.54 ±0.32
Reference value (%) 2.25 ±0.2 0.16 ±0.02 1.53 ±0.2 0.27 ±0.03 1.61 ±0.2
Recovery (%) 103.6 ±1.0 101.9 ±1.4 103.4 ±1.4 100.7 ±1.8 95.7 ±1.0
CV (%) 2.47 ±0.2 1.31 ±0.04 2.41 ±0.1 0.52 ±0.05 3.14 ±0.2

24
Table 4. Summary of CV in concentrations for different types of variablity. Coefficient of variation
for nutrient element was treating tissue types as replicates. Coefficient of variation for tissue type
was treating nutrient elements as replicates.
Type of variability Coefficient of variation (%)
Nutrient element Tissue type
N P Ca Mg K Bark Branch Foliage Wood
Laboratory
precision
1 3 2 2 5 3 3 2 3
Within the tree 18 27 25 20 29 12 23 12 35
Tree-to-tree 24 19 21 24 24 23 22 16 30
Inter-annual 13 25 28 16 23 28 23 12 22

25
Table 5. Summary of variability in foliar nutrient concentrations (%) within the tree, among trees
and inter-annually for different tree species at different areas.
Variability of nutrient element in foliage (%)
Type of
variability
Location Species N P Ca Mg K Sources
Within
the tree
Ontario Sugar
maple,
yellow
birch
3 3 13 10 7 Morrison
1984
Michigan Red
maple
2 4 12 11 14 Erdmann
et al., 1988
Southern
Ontario
Maple
and Ash
2 2 12 13 11 Ellis 1975
Tree-to-
tree
Southern
Ontario
Maple
and Ash
11 12 12 14 17 Ellis 1975
Inter-
annual
France European
beech
6 8 18 27 15 Duquesnay
et al., 2000

26
Table 6. Median nutrient concentrations in bark at five sampled years in four species.
Coefficient of variation (%) was calculated to show the changes in nutrient concentrations
across two sampling periods (1980s vs. 2010s). * indicates p value for unequal two sample t-
test is less than 0.05.
Species Nutrient
element
Sampled years CV
(%)
Species Nutrient
element
Sampled years CV
(%) 1985 1986 1987 2012 2013 1985 1986 1987 2012 2013
American
beech
N 6.88 8.01 6.12 12.63 10.64
35* Sugar
maple
N 5.45 5.34 6.50 10.76 7.47
32
P 0.30 0.37 0.25 0.39 0.39 17 P 0.31 0.33 0.25 0.37 0.36 14
Ca 37.32 33.70 29.52 31.22 27.79 9 Ca 21.93 26.56 37.80 24.20 28.97 6
Mg 0.46 0.39 0.49 0.66 0.54 21 Mg 0.80 0.78 0.36 1.33 1.16 45
K 1.49 1.72 1.15 1.77 2.06 20 K 2.62 3.32 1.19 1.96 2.22 9
Yellow
birch
N 5.74 5.22 6.87 7.57 6.64 13 Red
maple
N 6.03 5.44 9.30 8.34 5.98 2
P 0.25 0.31 0.30 0.25 0.25 11 P 0.34 0.34 0.45 0.37 0.37 1
Ca 9.83 10.05 38.71 6.63 13.37 46 Ca 15.23 12.19 36.67 20.65 18.21 7
Mg 0.42 0.49 0.57 0.51 0.50 1 Mg 0.30 0.40 0.82 0.49 0.47 4
K 0.87 1.14 1.04 0.62 0.78 26 K 0.85 1.23 3.22 0.77 1.61 28

27
Table 7. Median nutrient concentrations in branch at five sampled years in four species
Species Nutrient
element
Sampled years CV
(%)
Species Nutrient
element
Sampled years CV
(%) 1985 1986 1987 2012 2013 1985 1986 1987 2012 2013
American
beech
N 2.41 4.56 4.20 6.56 6.02
36 Sugar
maple
N 3.15 4.62 3.95 6.77 6.44
36*
P 0.15 0.37 0.38 0.28 0.30 1 P 0.25 0.41 0.32 0.49 0.45 26
Ca 3.80 10.32 9.63 10.30 8.35 12 Ca 6.86 8.83 5.96 7.53 7.20 1
Mg 0.35 0.59 0.51 0.60 0.44 5 Mg 0.33 0.49 0.36 0.56 0.44 17
K 1.18 1.20 1.65 1.22 1.11 10 K 1.42 2.18 1.95 2.40 1.87 10
Yellow
birch
N 4.58 5.04 5.20 6.69 5.59 15 Red
maple
N 3.45 2.40 4.55 5.60 5.73 34
P 0.36 0.40 0.50 0.35 0.39 9 P 0.30 0.24 0.38 0.41 0.39 18
Ca 6.29 5.44 8.51 9.44 8.35 19 Ca 7.14 4.87 2.72 11.87 13.17 62*
Mg 0.53 0.56 0.69 0.63 0.56 1 Mg 0.35 0.39 0.42 0.48 0.45 13
K 1.06 1.23 1.25 0.87 0.92 20* K 1.42 1.09 2.14 1.51 1.73 3

28
Table 8. Median nutrient concentrations in foliage at five sampled years in four species
Species Nutrient
element
Sampled years CV
(%)
Species Nutrient
element
Sampled years CV
(%) 1985 1986 1987 2012 2013 1985 1986 1987 2012 2013
American
beech
N 24.14 26.52 22.00 26.21 25.07
4 Sugar
maple
N 19.66 19.01 16.50 24.90 24.50
21*
P 1.26 1.51 1.19 1.18 1.19 8 P 1.13 1.10 0.94 1.46 1.23 17
Ca 6.66 8.56 1.65 9.61 8.56 33 Ca 8.63 6.65 1.11 8.19 6.88 22
Mg 1.32 1.80 1.67 2.00 1.81 12 Mg 1.72 1.16 1.04 1.11 1.21 23
K 7.84 7.74 7.08 5.56 4.65 27* K 7.68 6.08 6.05 5.23 4.46 9
Yellow
birch
N 25.20 26.01 25.20 26.96 26.77 4* Red
maple
N 19.24 20.26 18.50 22.47 22.47 11*
P 1.43 1.70 1.49 1.26 1.29 13 P 1.15 1.38 1.05 1.23 1.23 2
Ca 11.97 11.46 2.82 12.84 11.19 22 Ca 8.32 6.92 1.60 8.46 8.46 29
Mg 3.09 2.88 3.22 2.74 2.47 11 Mg 1.86 1.73 1.46 1.90 1.90 8
K 14.37 8.56 8.83 8.04 5.85 29 K 6.35 7.71 6.00 4.84 4.84 23

29
Table 9. Median nutrient concentrations in wood at five sampled years in four species
Species Nutrient
element
Sampled years CV
(%)
Species Nutrient
element
Sampled years CV
(%) 1985 1986 1987 2012 2013 1985 1986 1987 2012 2013
American
beech
N 1.27 1.28 1.10 1.31 1.95
21 Sugar
maple
N 0.98 0.89 1.00 1.05 1.65
24
P 0.07 0.06 0.02 0.03 0.04 16 P 0.07 0.05 0.05 0.05 0.06 1
Ca 0.77 1.03 2.20 0.95 1.51 6 Ca 1.66 1.54 2.34 1.43 1.17 24
Mg 0.22 0.20 0.23 0.16 0.17 20* Mg 0.22 0.21 0.23 0.20 0.21 6
K 0.76 0.55 0.88 0.34 0.39 48 K 0.49 0.58 0.65 0.39 0.45 22
Yellow
birch
N 0.81 0.94 0.90 1.14 1.79 35 Red
maple
N 0.87 0.90 0.70 1.03 1.51 30
P 0.04 0.05 N/A 0.03 0.03 26 P 0.04 0.09 0.01 0.05 0.05 11
Ca 0.84 0.89 1.06 1.01 1.04 7 Ca 1.93 1.47 2.08 0.82 0.81 40*
Mg 0.18 0.15 0.17 0.18 0.16 2 Mg 0.26 0.22 0.27 0.13 0.15 54*
K 0.36 0.21 0.32 0.13 0.28 25 K 0.77 1.14 1.68 0.74 0.59 40

30
Figure 1. Sampling strategy for studying variability in nutrient concentrations with the tree
by tissue position at HBEF in 2013.
9 cm
Length of the tree crown
1/2 1/2
Upper crown Middle crown Lower crown
Disc Disc Disc
1/3 1/3 1/3

31
Figure 2. CV of nutrient concentrations among replicates in the laboratory using data from
HWF in 2010s. Sample size equals three.

32
Figure 3. CV of nutrient concentrations within the tree (American beech, sugar maple and
yellow birch) using datsets from HBEF in 2013. Nutrient concentrations used for
calculating the CV are in the Appendices.
33
Figure 4. Tree-to-tree CV in nutrient concentrations of stands at different stand age using
data from BEF in 2005 (Circle for bark, square for branch, diamond for foliage, and star
for wood). The age of stands is given in years in x axis (15 represents young age stands, 28
represent middle age stands, and 118 represents old age stands). Species codes are AB for
American beech, SM for sugar maple, YB for yellow birch, PC for pin cherry, RM for red
maple, and WB for white birch
Age of stand
Co
eff
icie
nt
of varia
tio
n (
%)
34
Figure 5. Inter-annual CV of nutrient concentrations using data from HWF in 1985, 1986
and 1987.
Co
eff
icie
nt
of varia
tio
n (
%)
Nutrient element
35
Cited Literature
Aber, J. D., Goodale, C. L., Ollinger, S. V., Smith, M. L., Magill, A. H., Martin, M. E., Hallett,
R.A., and Stoddard, J. L. 2003. Is nitrogen deposition altering the nitrogen status of
northeastern forests. BioScience. 53: 375-389.
Alban, D.H. 1985.Seasonal changes in nutrient concentration and content of aspen suckers in
Minnesota. For. Sci. 31:785-794.
Arthur, M.A., Siccama, T.G., and Yanai, R.D. 1999. Calcium and magnesium in wood of
northern hardwood forest species: relations to site characteristics. Canadian Journal of
Forest Research. 29: 339-346.
Augusto, L., and Bert, D. 2005. Estimating stemwood nutrient concentration with an increment
borer: a potential source of error. Forestry. 78: 451-455.
Bailey, A., Hornbeck, J. W., Campbell, J. L., and Eagar, C. 2003. Hydrometeorological database
for Hubbard Brook Experimental Forest: 1955-2000 (Vol. 305). US Department of
Agriculture, Forest Service, Northeastern Research Station.
Bamber, R. K., and Fukazawa, K. 1985. Sapwood and heartwood: a review. In Forestry
Abstracts. Vol. 46: 567-580.
Beede, R. H., Brown, P. H., Kallsen, C., and Weinbaum, S. A. 2005. Diagnosing and correcting
nutrient deficiencies. Pistachio Production Manual. 4ª Ed. Ferguson L. University of
California, Davis.
Boggs, J.L., McNulty, S.G., Gavazzi, M.J., and Myers, J.M. 2005. Tree growth, foliar chemistry,
and nitrogen cycling across a nitrogen deposition gradient in southern Appalachian
deciduous forests. Can J For Res. 35:1901–1913.
Briggs, R.D., Porter, J.P., White, E.H., 1989. Component biomass equations for Acer rubrum and
Fagus grandifolia. Faculty of Forestry Miscellaneous Publication, SUNY College of
Environmental Science and Forestry, Syracuse, New York.
Canadell, J., and Vilà, M. 1992. Variation in tissue element concentrations in Quercus ilex L.
over a range of different soils. Vegetation, 99: 273-282.
Carlisle, A., A. H. F. Brown, and E. J. White. 1966. The organic matter and nutrient elements in
the precipitation beneath a sessile oak (Quercus petraea) canopy. Journal of Ecology
54:87-98.
Carlisle, A., A. H. F. Brown, and E. J. White. 1967. The nutrient content of tree stem flow and
ground flora litter and leachates in a sessile oak (Quercus petraea) woodland. Journal of
Ecology 55:615-627.
Crow, T. R., Mroz, G. D., and Gale, M. R. 1991. Regrowth and nutrient accumulations following
whole-tree harvesting of a maple-oak forest. Canadian Journal of Forest Research, 21:
1305-1315.
Day Jr, F.P., and Monk, C.D. 1977. Seasonal nutrient dynamics in the vegetation on a southern
Appalachian watershed. American Journal of Botany. 64: 1126-1139. De Vries, W., Vel, E., Reinds, G. J., Deelstra, H., Klap, J. M., and Vel, E.M. 1998. Intensive
monitoring of forest ecosystems in Europe. European Commission-United
Nations/ECONOMIC Commission for Europe, Brussels, Geneva, 193p.
De Saussure, N.T. 1804. Recherhes chimiques sur la vegetation. Nyon. Paris, France.
Dickson, R.E. 1989. Carbon and nitrogen allocation in trees. In Annales des sciences forestières.
46: 631-647.

36
Duquesnay, A., Dupouey, J. L., Clement, A., Ulrich, E., and Le Tacon, F. 2000. Spatial and
temporal variability of foliar mineral concentration in beech (Fagus sylvatica) stands in
northeastern France. Tree Physiology, 20:13-22.
Ellis, R.C. 1975. Sampling deciduous broadleaved trees for the determination of leaf weight and
foliar elemental concentrations. Canadian Journal of Forest Research, 5: 310-317.
Erdmann, G.G., Crow, T.R., and Rauscher, H.M. 1988. Foliar nutrient variation and sampling
intensity for Acer rubrum trees. Canadian Journal of Forest Research, 18: 134-139.
Fatemi, F.R. 2007. Aboveground biomass and nutrients in developing northern hardwood stands
in New Hampshire, USA. STATE UNIVERSITY OF NEW YORK COL. OF
ENVIRONMENTAL SCIENCE and FORESTRY.
Flückiger, W. and S. Braun. 1998. Nitrogen deposition in Swiss forests and its possible relevance
for leaf nutrient status, parasite attacks and soil acidification. Environ. Pollut. 102: 69-76.
Gauch, H.G. 1972. Inorganic plant nutrition. Dowden. Hutchinson and Ross, Stroudsburg,
Pennsylvania, USA.
Gosz, J. R., G. E. Likens, J. S. Eaton, and F. H. Bormann. 1975. Leaching of nutrients from
leaves of selected tree species in New Hampshire. Pages 630-641.
Hagen-Thorn, A., Armolaitis, K., Callesen, I., and Stjernquist, I. 2004. Macronutrients in tree
stems and foliage: a comparative study of six temperate forest species planted at the same
sites. Annals of Forest Science, 61: 489-498.
Hendrickson, O. 1987. Notes: Winter Branch Nutrients in Northern Conifers and Hardwoods.
Forest science, 33: 1068-1074.
Huntington, T.G., Ryan, D.F. and Hamburg, S.P. 1988. Estimating soil nitrogen and carbon
pools in a northern hardwood forest ecosystem. Soil Sci. Soc. Am. J., 52: 1162-1167.
Johnson, D.W., Richter, D.D., Lovett, G.M., and Lindberg, S.E. 1985. The effects of
atmospheric deposition on potassium, calcium, and magnesium cycling in two deciduous
forests. Canadian Journal of Forest Research, 15: 773-782.
Johnson, D.W. and S.E. Lindberg (eds.) 1992. Atmospheric Deposition and Nutrient Cycling in
Forest Ecosystems. Springer-Verlag, New York.
Jonard, M., André, F., Dambrine, E., Ponette, Q., and Ulrich, E. 2009. Temporal trends in the
foliar nutritional status of the French, Walloon and Luxembourg broad-leaved plots of
forest monitoring. Annals of Forest Science, 66: 1-10.
Le Tacon F, and Toutain F. 1973. Variations saisonnières et stationnelles de la teneur en
éléments minéraux des feuilles de Hêtre (Fagus sylvatica) dans l’Est de la France. Ann
Sci For 30:1–29.
Likens, G.E., Bormann, F.H., Pierce, R.S., Eaton, J.S., and Johnson, N.M. 1977.
Biogeochemistry of a forested ecosystem. Springer, New York, USA.
Likens, G.E., and Bormann, F.H. 1970. Chemical analyses of plant tissues from the Hubbard
Brook ecosystem in New Hampshire. Yale University: School of Forestry. Bulletin
NO.79.
Ljungström, M., and Nihlgård, B. 1995. Effects of lime and phosphate additions on nutrient
status and growth of beech (Fagus sylvatica L.) seedlings. Forest Ecology and
Management, 74: 133-148.
Lovett, G.M., Lindberg, S.E., Richter, D.D., and Johnson, D.W. 1985. The effects of acidic
deposition on cation leaching from three deciduous forest canopies. Canadian Journal of
Forest Research, 15: 1055-1060.
37
Luyssaert, S., Raitio, H., Vervaeke, P., Mertens, J., and Lust, N. 2002. Sampling procedure for
the foliar analysis of deciduous trees. Journal of Environmental Monitoring, 4: 858-864.
McNeil, B.E., Read, J.M., and Driscoll, C.T. 2007. Foliar nitrogen responses to elevated
atmospheric nitrogen deposition in nine temperate forest canopy species. Environ Sci
Technol. 41:5191–5197.
Mickelbart, M.V. 2010. Variation in leaf nutrient concentrations of Freeman maple resulting
from canopy position, leaf age, and petiole inclusion. Hortscience, 45: 428-431.
Mitchell, M.J. 2002. Episodic Acidification. In: Jay H. Lehr (ed). Encyclopedia of Water. John
Wiley and Sons Publishing (In Press).
Morrison, I.K. 1985. Effect of crown position on foliar concentrations of 11 elements in Acer
saccharum and Betula alleghaniensis trees on a till soil. Canadian journal of forest
research, 15: 179-183.
Meerts P., 2002. Mineral nutrient concentrations in sapwood and heartwood: a literature review.
Ann. For. Sci. 59: 713–722.
Oppenheimer, H.R., and Halfon-Meiri, A. 1961.Studies on the influence of different soils on
growth and mineral composition of Mediterranean forest trees. IN: Plant analysis and
fertilizer problems, p. 389-399. American Institute of Biological Sciences, Washington,
D.C.
Ostrofsky, A., Jellison, J., Smith, K. T., and Shortle, W. C. 1997. Changes in cation
concentrations in red spruce wood decayed by brown rot and white rot fungi. Canadian
journal of forest research, 27: 567-571.
Santa Regina, I., Rico, M., Rapp, M., and Gallego, H. A. 1997. Seasonal variation in nutrient
concentration in leaves and branches of Quercus pyrenaica. Journal of Vegetation
Science, 8: 651-654.
Shepard, J.P., Mitchell, M.J., Scott, T.J., Zhang, Y.M., Raynal, D.J., 1989. Measurements of wet
and dry deposition in a northern hardwood forest. Water, Air and Soil Pollut 48: 225-238.
Siccama, T.G., Hamburg, S.P., Arthur, M.A.,Yanai, R.D., Bormann, F.H., and Likens, G.E.
1994. Corrections to the allometric equations and plant tissue chemistry for the Hubbard
Brook Experimental Forest. Ecology 75:246-248.
Somers, R.C. 1986. Soil classification, genesis, morphology, and variability of soils found within
the central Adirondack region of New York. Ph.D. Dissertation. State University of New
York, College of Environmental Science and Forestry, Syracuse, NY USA.
Tamm, C.O. 1951. Seasonal variation in composition of birch leaves. Physiologia plantarum, 4:
461-469.
Taylor, A. M., Gartner, B. L., and Morrell, J. J. 2002. Heartwood formation and natural
durability—a review. Wood and Fiber Science, 34: 587-611.
Taiz Lincoln and Zeiger Eduardo. Plant Physiology. Sunderland, Massachusetts: Sinauer
Associates, 2006. Print
U.S. Environmental Protection Agency. 2004. Method 200.7: Determination of Metals and Trace
Metals in Water and Wastes by Inductively Coupled Plasma-Atomic Emission
Spectrometry. Agency UEP.
Vadeboncoeur, MA, Hamburg SP, Yanai RD, and Blum JD. 2014. Rates of sustainable forest
harvest depend on rotation length and weathering of soil minerals. Forest Ecology and
Management, 318: 194-205.
Van den Driessche R. 1974. Prediction of mineral nutrient status of trees by foliar analysis. Bot
Rev. 40:347–394.

38
Von Liebig, J. 1840. Organic Chemistry in its Application to Agriculture and Physiology. Taylor
and Walton, London.
Wallihan, E.F. 1944. Chemical composition of leaves in different parts of sugar maple tree. J.
For. 5: 684.
Weinhold, A. 1862. Analyze von unkiauterm des bodens der versuchsstation chemnitz. Landeo
Vers. Sta. 4: 188-193.
Whittaker, R.H., Likens, G.E., Bormann, F.H., Easton, J.S., and Siccama, T.G. 1979. The
Hubbard Brook ecosystem study: forest nutrient cycling and element behavior. Ecology,
60: 203-220
Yanai, R.D., Siccama, T.G., Arthur, M.A., Federer, C.A., Friedland, A.J., 1999. Accumulation
and depletion of base cations in forest floors in the northeastern US. Ecology 80:2774-
2787.

39
Appendices
Spatial variation of nutrient concentrations in foliage within the tree. CV was calculated for
nutrient concentrations among different sampling positions for each species.
Figure
0
2
4
6
8
10
0.0
0.5
1.0
1.5
2.0
2.5
3.0
0
2
4
6
8
10
12
14
16
Co
ncen
tra
tio
ns (
mg
/g)
0.0
0.5
1.0
1.5
2.0
2.5
Amercian beech (AB)
Sugar maple (SM)
Yellow birch (YB)
AB = 1.5% SM = 4.7% YB = 4.3%
P K
Ca Mg
Bottom Middle Top Bottom Middle Top
Position of foliage sample
Figure 1: Spatial variation of nutrient concentrations in foliage within trees. Cofficient of variation (CV) was calculated for nutrient concentrations among different sampling positions for each species. Same calculations in figure 2, 3 and 4.
AB = 17.2% SM = 7.4% YB = 20.8%
AB = 18.2% SM = 26.0% YB = 16.8%
AB = 7.7% SM = 29.1% YB = 12.2%

40
Spatial variation of nutrient concentrations in bark within the tree.
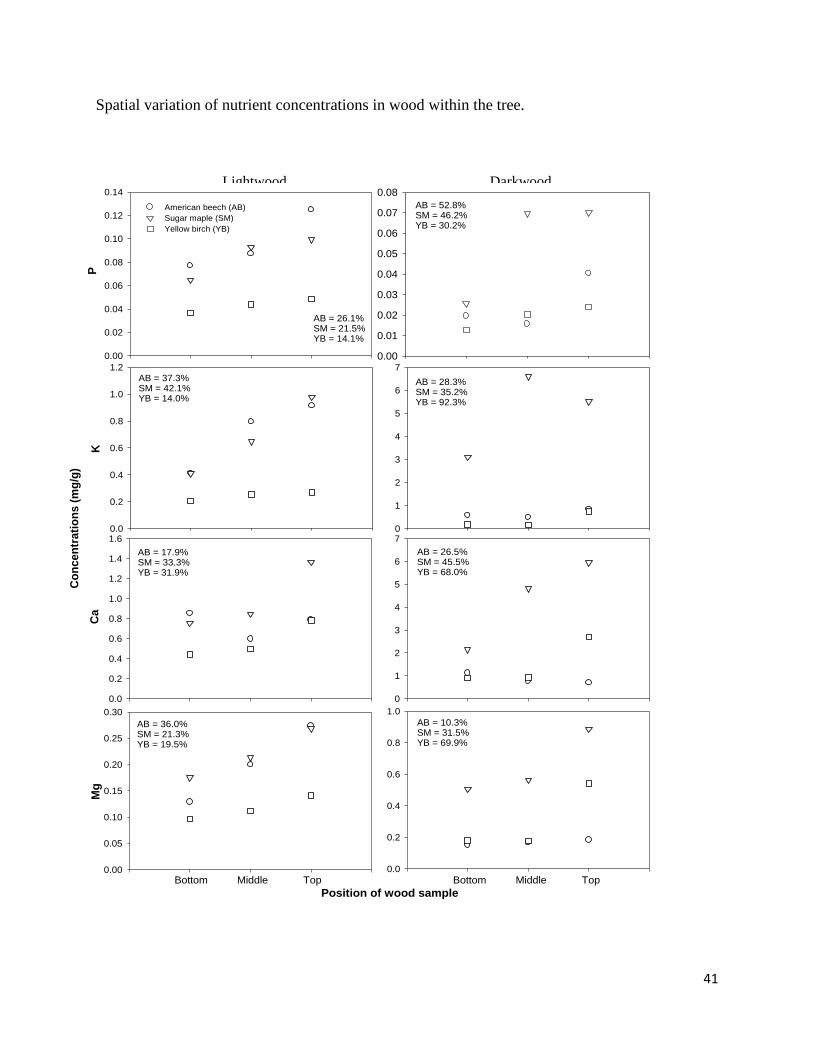
Figure 9: Spatial variation of nutrient concentrations in wood within the tree.
0.0
0.5
1.0
1.5
2.0
2.5
3.0
0.0
0.1
0.2
0.3
0.4
0.5
0.6
American beech (AB)
Sugar maple (SM)
Yellow birch (YB)
0.0
0.2
0.4
0.6
0.8
1.0
0
5
10
15
20
25
30
P K
Ca Mg
Bottom Middle Top Bottom Middle Top
Position of bark sample
Co
ncen
trati
on
s (
mg
/g)
Figure 2: Spatial variation of nutrient concentrations in bark within trees.
AB = 11.4% SM = 11.0% YB = 5.9%
AB = 15.0% SM = 38.8% YB = 27.1%
AB = 2.9% SM = 12.0% YB = 3.5%
AB = 8.3% SM = 2.9% YB = 17.8%
41
Spatial variation of nutrient concentrations in wood within the tree.
0.00
0.02
0.04
0.06
0.08
0.10
0.12
0.14
0.0
0.2
0.4
0.6
0.8
1.0
1.2
0.0
0.2
0.4
0.6
0.8
1.0
1.2
1.4
1.6
0.00
0.05
0.10
0.15
0.20
0.25
0.30
0
1
2
3
4
5
6
7
0
1
2
3
4
5
6
7
0.0
0.2
0.4
0.6
0.8
1.0
HeartwoodSapwood
Bottom Middle Top Bottom Middle Top
0.00
0.01
0.02
0.03
0.04
0.05
0.06
0.07
0.08
American beech (AB)
Sugar maple (SM)
Yellow birch (YB)
Position of wood sample
Figure 3: Spatial variation of nutrient concentrations in wood within trees.
Co
ncen
trati
on
s (
mg
/g)
Mg
Ca
KP
AB = 26.1% SM = 21.5% YB = 14.1%
AB = 52.8% SM = 46.2% YB = 30.2%
AB = 37.3% SM = 42.1% YB = 14.0%
AB = 28.3% SM = 35.2% YB = 92.3%
AB = 17.9% SM = 33.3% YB = 31.9%
AB = 26.5% SM = 45.5% YB = 68.0%
AB = 36.0% SM = 21.3% YB = 19.5%
AB = 10.3% SM = 31.5% YB = 69.9%
Lightwood Darkwood

42
Spatial variation of nutrient concentrations in branches within the tree.
0
2
4
6
8
10
12
0.0
0.5
1.0
1.5
2.0
2.5
3.0
0.0
0.1
0.2
0.3
0.4
0.5
0.6
American beech (AB)
Sugar maple (SM)
Yellow birch (YB)
0.0
0.2
0.4
0.6
0.8
P K
Ca Mg
5 10 20 3015 25 5 10 20 3015 250 40 0 40
Branch diameter (mm)
Co
nce
ntr
ati
on
s (
mg
/g)
Figure 4: Spatial variation of nutrient concentrations in branch within trees.
AB = 47.9% SM = 34.6% YB = 30.8%
AB = 19.9% SM = 21.4% YB = 23.4%
AB = 44.5% SM = 17.6% YB = 13.5%
AB = 10.8% SM = 20.3% YB = 25.0%

43
Vita
YANG YANG
(315)-928-0081 [email protected]
EDUCATIONAL BACKGROUND
State University of New York 2015
College of Environmental Science and Forestry, Syracuse, NY
M.S. in Forest and Natural Resources Management
Minzu University of China, Beijing, China 2012
B.S. in Environmental Science
RESEARCH EXPERIENCE
SUNY College of Environmental Science and Forestry Spring and Summer 2014
Research Project Collaborator
Collaborated with PIs to design the experiments of measuring mercury in wood, helped write the proposal and
received $5,700 as a seed grant at ESF.
Collected tree disc samples in the Hubbard Brook Experimental Forest, prepared wood samples using different
drying temperature, analyzed total mercury concentrations using the Milestone Analyzer.
United States Department of Agriculture Forest Service Summer 2013
Research Intern in Northern Research Station
Wrote proposals to Research Approval Committee in Hubbard Brook Experimental Forest and received the
approval of collecting tree samples in watershed 7.
Collected samples and analyzed nutrient concentrations in different tree components by tissue positions using
CN-analyzer and ICP-MS.
SUNY College of Environmental Science and Forestry 2012-14
Research Assistant (Ruth Yanai’s lab)
Assisted with monitoring soil respiration, taking minirhizotron images and doing tree inventory in the Bartlett
Experiment Forest.
Modeled streamflow datasets using composite, regression and linear interpolation methods, calculated the loads
and related bias for four solutes.
Performed uncertainty analysis of litterfall mass and nutrient concentrations using bootstrapping.
Collected tree samples in Huntington Wildlife Forest, analyzed nutrient concentrations in tree samples using
CN-analyzer and ICP-MS.
Trained technicians in the field and laboratory, and provided analysis assistance.
Minzu University of China, Beijing, China 2009-10
Project Leader
Organized and managed a research team, wrote proposals and received $4,700 from Program of 985 Project
Foundation of MUC (MUC985-09) and Undergraduate Research Training Program of MUC (URTP201011071).
Performed nitrogen fertilization in urban greenings and remote forests, collected soil samples, analyzed physical
and chemical properties.
Performed data management and analysis, wrote and presented a report.
Minzu University of China, Beijing, China Spring 2012
Field and Lab Technician (Jinchao Feng’s lab)
Measured plant respiration rate using IRGA along with soil moisture.
Assisted with soil sampling and data management.

44
Prepared reagents and pre-set instruments for Environmental Monitoring laboratory sections.
Chinese Research Academy of Environmental Science (CRAES), Beijing, China Spring 2011
Research Intern in Environmental Ecological Research Institute
Ground soil samples, performed acid digestion and ICP analysis.
Assisted with data management, analysis and report writing.
TEACHING EXPERINECE
Syracuse City School District Spring 2015
Instructor, Natural science and chemistry
Developed syllabus, lectured, and designed experiments for Fifth grade at Dr. King Elementary School and Van
Duyn Elementary School.
Coordinated the production and distribution of print and web-based information materials.
Generated evaluations and reports for elementary mentoring program.
SUNY College of Environmental Science and Forestry Fall 2012–14
Teaching Assistant, General Chemistry II and Introduction of Chemistry
Taught two laboratory sections, graded lab reports and exams, held weekly office hours.
VOLUNTEER EXPERIENCE
Guilin Environmental Center (NGO), Guangxi, China December 2013
Project Coordinator
Organized volunteers and interns, improved the team capacity.
Developed the research aspects of survey plan for Lijiang River.
Evaluated projects and wrote summary reports.
American Chemical Society Syracuse Section, Syracuse, NY October 2012
Project Assistant
Presented demonstrations of experiments focusing on nanotechnology to the public.
Conducted activities about chemical experiments for children.
UCT International Culture Development, New York (NGO) Summer 2011
International Coordinator
Assisted with organizing Chinese culture exhibition in the United Nations in New York.
Coordinated with UN Chinese Book Club to organize media press conference and banquet.
60th
National Day Celebration Committee of the Municipal government, Beijing, China 2010
Project Assistant
Trained 15 volunteers and performed dancing in Tiananmen Square at the National Celebration Day.
Provided tour description and direction to foreign visitors.
PUBLICATIONS
Yang, Y., R.D. Yanai., M. Montesdeoca., and C.T. Driscoll. 2015. Measuring Mercury in Wood: Important but
Challenge. Canadian Journal of Forest Research. (Under review)
Germain, R.H., R.D. Yanai, A.K. Mishler, Y. Yang and BB Park. 2014. Landscape and Individual Tree Predictors
of Dark Heart Size in Sugar Maple. Journal of Forestry.113: 20-29.
PRESENTATIONS
Yang, Y., R.D. Yanai., M. Montesdeoca., and C.T. Driscoll. Measuring Mercury in Wood: Important but Challenge.
SUNY/CUNY Graduate Research Poster Session. Albany, NY. February 11, 2015.

45
Yang, Y., R.D. Yanai., M. Montesdeoca., and C.T. Driscoll. Measuring Mercury in Wood: Important but Challenge.
New York Society of American Foresters Meeting, Syracuse, NY. January 22, 2015.
Yang, Y. Detecting differences of tissue chemistry in four northern hardwoods tree species. Presentation in defense
of Masters Thesis, SUNY-ESF, Syracuse, NY. November 14, 2014.
Yang, Y., R.D. Yanai., M. Montesdeoca., and C.T. Driscoll. Measuring Mercury in Wood: Important but Challenge.
American Geophysical Union Fall Meeting, San Francisco, CA. December 18, 2014.
Yang, Y., R.D. Yanai, and R.D. Briggs. Detecting differences of tissue chemistry in four northern hardwoods tree
species. Ecological Society of America Annual Meeting, Sacramento, CA. August 14, 2014
Yang, Y., C.R, See, and R.D. Yanai. Sampling intensity and uncertainty in litterfall mass and nutrient flux in
northern hardwoods. Ecological Society of America Annual Meeting Later Poster Session, Sacramento,
CA. August 15, 2014
Yang, Y., R.D. Yanai, and R.D. Briggs. Detecting differences of tissue chemistry in four northern hardwoods tree
species. SUNY-ESF Spotlight on Graduate Student Research, Syracuse, NY.
Yang, Y. Source of variability in tissue chemistry in northern hardwood species. New York Society of American
Foresters Meeting, Syracuse, NY. January 23, 2014
Aulenbach, B.T., D.A. Burns., J.B. Shanley., R.D. Yanai., KiKiang. Bae., A.D. Wild., Y. Yang., and Y. Dong.
Uncertainty of streamwater solute fluxes in five contrasting headwater catchments including model
uncertainty and natural variability. American Geophysical Union Fall Meeting, San Francisco, CA.
December 10, 2013
Yang, Y. Detecting change over time in tree tissue chemistry. Rochester Academy of Science Fall Paper Session,
Rochester, NY. November 9, 2013
Yang, Y, and R.D. Yanai. Detecting change over time in tree tissue chemistry Hubbard Brook 50th Cooperator’s
Meeting, Hubbard Brook Experimental Forest, NH. July 10, 2013
Yang, Y, and Jinchao FENG. Effects of simulated nitrogen deposition on soil microbial quantities in Fragrant
Mountain in Beijing Undergraduate Research and Training Program Report Session, Minzu University of
China, BJ, China. December 25, 2010
FELLOWSHIPS, GRANTS, AWARDS, AND CERTIFICATE
C. Eugene Farnsworth Fellowship Dept Forest and Natural Resources Management, SUNY-ESF (2015)
Graduate Student Travel Grant Dept Forest and Natural Resources Management, SUNY-ESF (2014)
Certificate of Level-1 Game of Logging Chainsaw Training Bill Lindloff’s ProCUTS (2013)
Sussman Foundation Fellowship Edna Bailey Sussman Foundation (2013)
Second-class scholarship Minzu University of China, China (2012)
Second prize of 2nd
Chemical Experiment Competition Minzu University of China, China (2010)
Second prize of 1st Biological Experiment Competition Minzu University of China, China (2010)
Second-class scholarship Minzu University of China, China (2010)
First-class scholarship Minzu University of China, China (2009)
Undergraduate Research Training Grant Minzu University of China, China (2009)
SKILLS
Statistics and Spatial: R, SAS, SPSS, Microsoft offices and ArcGIS
Field: Soil respiration (Licor 8100) and Minirhizotrons
Laboratory: ICP-MS, Kjeltec Auto Analyzer and Total Mercury Analyzer
SOCIETY MEMBERSHIPS
Ecological Society of America
American Geophysical Union