DETECTING AND RESOLVING WORK-SPACE CONGESTIONS AND ... -...
62
DEGREE PROJECT, REAL ESTATE AND CONSTRUCTION MANAGEMENT PROJECT MANAGEMENT MASTER OF SCIENCE, 30 CREDITS, SECOND LEVEL STOCKHOLM, SWEDEN 2016 DETECTING AND RESOLVING WORK-SPACE CONGESTIONS AND TIME-SPACE CONFLICT THROUGH 4D - MODELING IN THE MICRO LEVEL ZENGSHITING ZHANG TECHNOLOGY DEPARTMENT OF REAL ESTATE AND CONSTRACTION MANAGEMENT ROYAL INSTITUTE OF TECHNOLOGY DEPARTMENT OF REAL ESTATE AND CONSTRUCTION MANAGEMENT
Transcript of DETECTING AND RESOLVING WORK-SPACE CONGESTIONS AND ... -...
DEGREE PROJECT, REAL ESTATE AND CONSTRUCTION MANAGEMENT PROJECT MANAGEMENT MASTER OF SCIENCE, 30 CREDITS, SECOND LEVEL STOCKHOLM, SWEDEN 2016
DETECTING AND RESOLVING WORK-SPACE
CONGESTIONS AND TIME-SPACE CONFLICT
THROUGH 4D - MODELING IN THE MICRO
LEVEL ZENGSHITING ZHANG
TECHNOLOGY
DEPARTMENT OF REAL ESTATE AND CONSTRACTION MANAGEMENT
ROYAL INSTITUTE OF TECHNOLOGY
DEPARTMENT OF REAL ESTATE AND CONSTRUCTION MANAGEMENT

Master of Science thesis
Title Detecting and resolving work-space conges-tions and time-space conflicts through 4D - Modeling in the Micro level
Author Zengshiting Zhang
Department Master Thesis number
Architecture and the Built Environment TRI-TA-FOB-PrK-MASTER-2016:1
Archive number 407
Supervisor Väino Tarandi
Keywords BIM, 4D, Construction, Work-space conges-tion, Time space conflict, Location lag, Flowline scheduling
Abstract
This degree project aims to find solutions to prevent construction process from delay by detecting and resolving work-space congestions and time-space conflicts based on 4D-modeling.
The purpose is to improve the work efficiency on the construction site of a hospital project. Through a software experiment, the proposed solutions will be tested to see if the conflicts on the construction site can be resolved or minimized. This is achieved by following the construction phase of the NKS project from Skanska AB. The largest hospital project in Sweden.
The theoretical framework focuses on the concepts of 4D, work-space congestions, time-space conflicts, lean construction, last planner system, project organization as well as reviewing a variety of literature regarding how to resolve the conflicts during the construction process. The useful data and information have been gathered through semi-structured interviews with project managers and workforce. The obser-vations have been done on-site. Followed by 4D software experiment, by associating the tasks to the different areas through LBS with the time constraint data, the effi-ciency of work based on the quantity takeoff can be evaluated and thus it allows pro-ject managers to foresee the potential conflicts easily. Eventually, applying 4D - modeling helps the planners visualize the inefficiencies in the schedule and thus re-schedule the tasks before they lead to delays.

Acknowledgement The thesis was carried out at the department of Real Estate and Construction Man-agement at KTH, the Royal Institute of Technology. This report is the result of a mas-ter thesis project carried out in conjunction with the Nya Karolinska Solna project governed by Skanska AB. I would first and foremost like to give thanks to the supervisor Göran Pettersson in Skanska who offered me this great opportunity to carry out my study in NKS and in-troduced me to many contacts. Also I'd like to thank professor Väino Tarandi at KTH for the helpful guidance and continuous support throughout the whole project. Additionally I want to express my appreciation to all the personnel involved in this thesis project from NKS as well as to PhD Pouriya Parsanezhad from KTH who pro-vided valuable knowledge and experience. Finally, I would like to give a big thanks to Rob Krieger who provided me much help in finalizing this thesis within a limited time frame.

Examensarbete
Titel Detecting and resolving work-space conges-tions and time-space conflicts through 4D - Modeling in the Micro level
Författare Zengshiting Zhang
Institution Examensarbete Master nivå
Architecture and the Built Environment TRI-TA-FOB-PrK-MASTER-2016:1
Arkiv nummer 407
Handledare Väino Tarandi
Nyckelord BIM, 4D, Construction, Work-space conges-tion, Time space conflict, Location lag, Flowline scheduling
Sammanfattning Syftet med detta examensarbete är att finna lösningar för att förhindra konstruktions-processen från förseningar genom att upptäcka och lösa arbetsplatsstörningar samt tids- och utrymmeskonflikter baserat på 4D-modelering. Målet är att effektivisera arbetet på byggarbetsplatsen för ett sjukhusprojekt. Genom simuleringar kommer föreslagna lösningar, för att undvika konflikter på arbetsplatsen, att prövas för att få bukt med eller minimera dessa konflikter. Detta uppnås genom att följa byggnadsfasen av NKS-projektet från Skanska AB. Sveriges största sjukhuspro-jekt. Den teoretiska referensramen fokuserar på begreppen: 4D, arbetsutrymmesbelast-ning, tids- och platskonflikt, lean construction, last planner-systemet, projektorgani-sation samt granskning av litteratur som handlar om konfliktlösning under byggpro-cessen. Användbara data och information har samlats in via semistrukturerade inter-vjuer med projektledare och byggnadsarbetare. Observationer har gjorts på plats. Följt av 4D-simulering, genom att sammankoppla uppgifter till de olika områdena ge-nom LBS med tidsrestriktionsdata, kan effektiviteten av arbete som bygger på mängdavtagning utvärderas. Det tillåter projektledare att utan svårighet förutse po-tentiella konflikter. Så småningom kan tillämpningen av 4D-modellering hjälpa plane-rare att visualisera ineffektiviteter i tidsplanen och därmed planera om arbetsuppgif-terna innan de leder till förseningar.

Contents 1. Introduction .................................................................................................. 3
1.1 Background ............................................................................................... 3
1.2 Summary of previous studies ..................................................................... 4
1.3 Theoretical Grounds .................................................................................. 7
1.4 Research purpose and questions ............................................................. 12
2. Methodology ................................................................................................ 14
2.1 The literature review ................................................................................ 14
2.2 Semi-structured interview......................................................................... 15
2.3 Observation ............................................................................................. 17
2.4 Backward Chaining Method ..................................................................... 18
3. Theory .......................................................................................................... 19
3.1 Work-space congestion ........................................................................... 19
3.2 Time space conflict .................................................................................. 23
4 Case study – Nya Karolinska Solna ............................................................ 27
4.1 Project information ................................................................................... 27
4.2.1 Category A: Objects conflict with Objects ......................................... 30
4.2.2 Category B: Objects conflict with Activities ....................................... 31
4.2.3 Category C: Activities conflict with Activities ..................................... 32
5 Software experiment .................................................................................... 34
5.1 Software implementation .......................................................................... 34
5.1.1 Problem Assessment ......................................................................... 34
5.1.2 Solutions ........................................................................................... 35
5.2 Location Based Structure (LBS) ............................................................... 36
5.2.1 The Experiment with LBS Manager ................................................. 37
5.3 Flowing scheduling .................................................................................. 42
5.3.1 The experiment of flowing scheduling ................................................ 42
5.3.2 Solution A .......................................................................................... 45
5.3.3 Solution B .......................................................................................... 47
6. Analysis ....................................................................................................... 50
6.1 Strengths and Opportunities for Beneficial Implementation ...................... 50
6.2 Limitations ............................................................................................... 51
6.3 The answers for the questions ................................................................. 51
1

7. Conclusion ................................................................................................... 53
8. References ................................................................................................... 54
2
1. Introduction
1.1 Background Delay phenomena are considered as one of the biggest problems and challenges
in the construction industry (Owlabi and Amusan, 2014). Many researchers
and engineers have tried to solve the problem and optimize the results. This
delay phenomena has many causes such as inadequate client’s finance and
payment, improper planning and management, shortage in materials and
problems with subcontractors (Alnuaimi and Mohsin, 2013).
This thesis mainly focuses on delays due to work-space conflicts in the
construction process. More specifically, it addresses conflicts when there is
congestion in the work-space, which is when they usually occur. This is when
there are collisions of time schedule between different groups of people and
when the work-space is occupied by materials and equipment. Conflicts
occurring due to this haven’t been detailed enough and have not been predicted
precisely in the long term. This is because spatial structure has not been studied
sufficiently and because of inaccurate time scheduling and work plans.
With development of the construction industry, many new concepts and useful
tools have been proposed in order to resolve the conflicts and to further improve
the methods for reviewing these issues. Building Information Modeling (BIM) was
the one concept that became more and more popular in both the design and the
construction field during the past two decades. 3D, one of BIM’s techniques, is a
basic tool to achieve visualization of projects especially for representing
architecture in design. With the introduction of 4D techniques (3D plus
timeframe), project activities can be better managed not only in the design aspect
but also for the construction activities.
4D can reduce work accidents and improve work efficiency by providing visual
activity information with a timeline schedule. According to the experiments from
the previous projects (which will be illustrated in the literature review section
later), 4D can easily detect the conflict between two activities regarding the time
and space elements and thus enable project managers to reschedule activities
accordingly, thus yielding better results.
3
1.2 Summary of previous studies Wu and Chiu from Taiwan (2010) carried out research on developing conflict
detection and analyzing modules based on a 4D CAD system. First, they
categorized work-spaces into five aspects: building component spaces, site
layout spaces, human work-spaces, equipment spaces and material spaces.
Then they identified four major types of work-space conflicts, which are design
conflict, safety hazard, damage conflict and congestion. Afterwards, they used
Bentley MicroStation and integrated it with schedule information for the dynamic
identification of space conflicts. Those conflicts can be detected based on work-
spaces by using 4D Visualization. The detection and analysis system was
created through Microsoft VB.Net which simultaneously detects and analyzes
work-space conflicts with various working objects, as well as visually
representing the location, size, scope and type of work-space conflicts (Wu and
Chiu, 2010).
Another study was carried out by Akinci, Fischer, Kunz and Levitt (2000c). On the
construction site, different types of spaces required different positional
requirements. In order to automatically detect the conflicts by 4D SpaceGen, it is
necessary to generate project-specific spaces required by activities and
represent those spaces in four dimension (Akinci and Fischer, 2000b). They tried
to clarify the different orientation and volumetric requirement descriptions in order
to formalize mechanisms. Some past studies have generated four approaches:
(1) Static or dynamic site layout planning (Eastman 1975; Tommelein and Zouein
1993; Choi and Flemming 1996; Alshawi 1997; Choo and Tommelein 1999). (2)
Line of balance (O'Brien 1975; Birell 1981; Stradal and Cacha 1982; Halpin and
Riggs 1992; Howell et al. 1993; Yamamoto and Wada 1993). (3) Path-planning
(Latombe 1988; Morad et al. 1992). (4) Space-scheduling (Zouein and
Tommelein 1993; Riley 1994; Thabet and Beliveau 1994; Choo and
Tommelein1999). However, those studies did not describe the methods with
enough detail. Thus, Akinci, Fischer, Kunz and Levitt (2000c) took a closer look
at micro-level construction spaces and proposed two ways to solve spatial
conflicts:using a transformation matrix to present the relationship between two
graphical objects quantitatively and using the space – loaded 4D production
models to make more realistic 4D simulations.
4

In terms of using 4D BIM for work-space planning, several Korean researchers
have done a comprehensively systematic summarization of previous studies.
Besides that, they also came up with a new framework for work-space planning
by dividing the attributes of work-space and conflict (point out). There are many
techniques and tools that are being used now such as Gantt chart, network
diagram, critical path method (CPM), and line of balance (LOB) (Choi et al.,
2014). However, some of those techniques cannot present the spatial feature of
each activity and some of them are unable to consider more possibilities of the
type of work. In order to have a better understanding, Choi et al. (2014) came up
with a diagram with all the methods based on related studies (Figure.1).
Figure.1 Review on related studies
5
Through this diagram, comparisons within each category between different
papers are simply addressed. Starting in 2002, Akinci et al.(2002a,b) developed
a 4D model which can automatically generate the work space for each object and
also suggested a method to categorize and prioritize work space conflicts.
Dawood and Mallasi (2006) followed by identifying work space congestion status
by viewing the Pattern Execution and Critical Analysis of Site-space Organization
(PECASO) system. Chavada et al. (2002) suggested AABB intersection and
congestion test (CgS) with geometrical parameters between two work-space
models for checking work space conflicts. So based on previous findings,
Chavada et al. (2012) achieved further improvements by differentiating the work
space requirements and work space occupations, integrating activity execution
plan and material management plans and formalizing the procedure for work-
space problem resolutions (Choi et al., 2014).
6

1.3 Theoretical Grounds BIM
Building Information Modeling (BIM) is a way of working which enables everyone
to better understand and interact with buildings by using digital models. With BIM,
all team members should be working with the same standards, for instance,
using the same format of model among different parties. Doing so, it can improve
their actions and create more value from the combined efforts of people, process
and technology, finally resulting in a greater whole life value for the asset. The
whole life value is reflected in the many stages of the asset which starts from
design, analysis, documentation, and fabrication, and then is followed by
construction, logistics, operation, maintenance and finally results in renovation
(Eastman et al., 2011).
3D
A 3D model contains geometric information like length, width and height of the
building components. It makes the model more realistic compared to a 2D model.
It also makes it easier to detect errors in the project. Furthermore, the client who
is not an expert in construction would be better able to comprehend the product
in 3D rather than in 2D (Velasco, 2013).
4D
A 4D model contain objects and assemblies that have schedule and time
constraint data added to them. The information can be contained in the BIM or
can be linked or otherwise associated (integrated and/or interoperable) with
project design, construction activity scheduling, time sensitivity estimating and
analysis systems. (Conover and Barnaby, 2009)
Work-space congestion
Work-space congestion is a situation that occurs when the work-space available
for the resources of an activity or group of activities is either limited or smaller
than the required work-space for such resources. (Chavada et al., 2012)
7

Time-space conflict
Time space conflict means that one activity’s space requirements interfere with
another activity’s space requirements, or with work-in-space (Akinci et al.,
2000a). The consequence of it can be problems with productivity, safety and
constructibility on site. In the end, those problems translate into delays in the
onset of activities (Akinci et al., 2000a).
Project organization
The main focus of project organization is Planning, Control, and Evaluation
(Packendorff, 1994). From a project management perspective, it is more about
enhancing participation than controlling or inspiring creativity in the plan (Kanter,
1983). The key words of project management are learning, leadership, renewal
and innovation.
One of the important techniques for defining the task and goals in a specific way
within project organization is called Work Breakdown Structure (WBS). The aim
of WBS is to identify the activities of different groups and labors through the
optimal sequence during production planning (Nathan, 1991).
Several planning tools have been adapted for achieving WBS. The most widely
used was the Gantt chart, developed by Henry Gantt in the 1910s. The Gantt
chart describes the tasks and events clearly based on the sequence according to
the time scale.
Moreover, another tool which is efficient in planning is called CPM (Critical Path
Method). It is based on the assumption that the duration of activities can be
estimated in advance. CPM can evaluate the cost based on the changes of
activities. The mathematical problem of the CPM is to find the optimal ratio
between fixed and variable costs given that stipulated time limits are not
exceeded (Wiest and Levy, 1969)
Yet another tool is PERT (Program Evaluation and Review Technique), which
unlike CPM is based on the assumption that the duration of activities cannot be
8
estimated accurately. In PERT, the cost varies directly with time, therefore time is
the controlling factor. The less time spent, the more money saved and vice versa.
Finally, Line of Balance (LOB), which is also known as Vertical Production
Method, is an essential communication and productivity analysis tool for projects
that have repetitive work areas (Line-of-Balance, 2010). By using LOB, project
managers can easily see if the activities are in good balance, which accordingly
lets project managers know whether or not the activities are lagging behind
schedule. It also forecasts future performance by receiving timely information
regarding trouble areas, and then implements appropriate corrective action.
9
Lean construction
Hafey (2014) has stated that lean is about eliminating waste and making
processes more efficient, with the end goal of better serving the customer. There
are five fundamental principles for lean thinking.
a) Specify value from the customer’s perspective
b) Identify the value stream
c) Confirm the flow through the whole process
d) Speed up the process to make sure everything is on time
e) Achieve perfection by improving the solutions
Ren (2012) emphasized that subcontractors and suppliers are playing an
increasingly important role in project construction. Additionally, the contribution of
subcontractors to the total construction process can account for as much as 90%
of the total value of a construction project
The traditional production method is to build up procedures based on
constructors’ needs and convenience, then push the work until the next stage in
order to meet clients’ requirements. However, due to insufficient communication
and orientation, logistics was hardly coupled with information delivery which led
to many mistakes being made, and materials wasted during the whole process.
In opposition to this traditional way, lean construction proposes a new method.
First, constructors need to fully understand client needs at the very beginning.
They should know exactly what the client expectations and worries are. Second,
instead of planning work from the initial stage to the final stage, constructors
should premise on the final product and then plan everything back from there to
the initial stage. Lastly, by combining the lean construction approach with the last
planner approach, logistics can be optimally bound up with information flows.
This reduces unnecessary waiting time and improves working efficiency
significantly.
10

The concept of lean construction is related to the application of lean thinking to
the construction industry. It is about improved delivery of the finished
construction project to meet client needs. ( Koskela, 2009)
Last planner system
The Last Planner (also referred to as the Last Planner System) is a production
planning system designed to produce predictable work flow and rapid learning in
programming, design, construction and commissioning of projects (Hussain et
al.,2014).
11

1.4 Research purpose and questions Purpose The aim of this thesis is to present a method of shortening the construction
process by detecting work-space congestions and time-space conflicts.
Moreover, the project aims to implement the method in Nya Karolinska Solna
(NKS) project and test if the conflicts on the construction site can be resolved or
minimized.
Questions In order to achieve the purpose, the main goal had to be identified in the first
place. By using Backward Chaining Method, the main goal was broken down into
smaller targets that need to be achieved.
As the figure. 2 shows below, the main goal is to avoid delays and to keep
construction time under control so that work efficiency can be improved and costs
can be significantly lowered. In order to achieve this goal, the conflicts, as the
strongest negative influential factor in the construction process, need to be
clearly defined, and then a method needs to be generated to minimize them.
Since most of the ongoing conflicts arise due to overlapping location or timeline
schedule changes, it is essential to assign tasks to the corresponding location
with the right time schedule and to keep track of those tasks in order to avoid
potential problems. Therefore, finding an effective way of assigning tasks with
less mistakes and resolving them as soon as they arise is the optimal means to
solving this critical problem in construction management.
12

Figure.2 Backwards chaining method
Research questions have been raised based on the research goal. The answers
will be stated in the end of this thesis.
The research questions are the following:
1. How are conflicts detected through 4D models?
2. Can those conflicts be solved permanently?
3. How can timeline schedules be re-arranged in order to maximize
performance?
4. What is the potential risk of re-arranging the timelines for the tasks?
5. Is it possible to prevent the construction process from having delays?
13

2. Methodology
This section explains the methods used in this thesis. A number of methods were
used in conjunction with one another. First, in order to achieve the purpose of this
study, an extensive literature review was done before and during the study.
Second, interviews were conducted with many managers and workers on site.
Through the interviews, data was collected effectively which helps the thesis to
be more accurate. Third, an actual construction project plan was assessed an
optimized through use of a software planner tool. The results of the tool were
then assessed. The actual meaning and implementation of each method are
further illustrated below.
2.1 The literature review A literature review has three main purposes. First, to broaden the horizons of
researchers. Second, to prevent the researchers from repeating work that has
already been done. And third, to understand the strengths and weaknesses of
the previous studies.
The literature review has been carried out to provide general background
knowledge for this study. It mainly focused on 4D and BIM. The type of sources
vary from scientific papers, reports and master thesis. Primary sources of
information are based on scientific databases, KTH Primo and online
researching.
From the literature review, the previous studies were divided into different
categories according to the tools they used (4D, 4D CAD, 4D BIM). Through the
comparison, gaps and limitations could be identified, and that led to new
research questions (Silva, 2009).
14

2.2 Semi-structured interview According to Berg (1998:59), interviews can be categorized into three groups:
Structured, informal and semi-structured interview. In this thesis, semi-structure
interviews were chosen as main method.
Bjørnholt and Farstad, (2012) further defined this method:
‘’A semi-structured interview is a method of research used in the social sciences.
While a structured interview has a rigorous set of questions which does not allow
one to divert, a semi-structured interview is open. This allows new ideas to be
brought up during the interview. The interviewer in a semi-structured interview
generally has a framework of themes to be explored.’’
The advantage of semi-structured interview is that the interviewers have enough
time to prepare their questions and build up a good structure so that they can
successfully lead the conversation during the interview. Another advantage is
that the interviewees have more freedom to express their own view and
perspective. Thus it can lead to more reliable, comparable qualitative data
(Cohen and Crabtree, 2006)
The semi-structured interviews for this project were divided into two steps. The
first step was done before starting to write the thesis (end of February to
beginning of April, 2015) and consisted of designing and conducting one
interview with each of seven mangers of the NKS project from different
departments. The questions were designed to get to know some basic project
information and to understand their opinions about combining current tasks with
4D BIM. The second step was to conduct further interviews with the managers
from step one, if required based on research needs, as well as to conduct
interviews with additional contributors to the NKS project including on-site area
managers, workers, BIM specialist and other relevant staff. This allowed for the
collection of useful information, the receipt of feedback, and for adjustment of
research direction.
The general interview with both NKS staff and KTH staff is recorded below
(Figure. 3) based on the timeframe. Regarding the detailed content of each
interview, please refer to the appendix of this thesis.
15
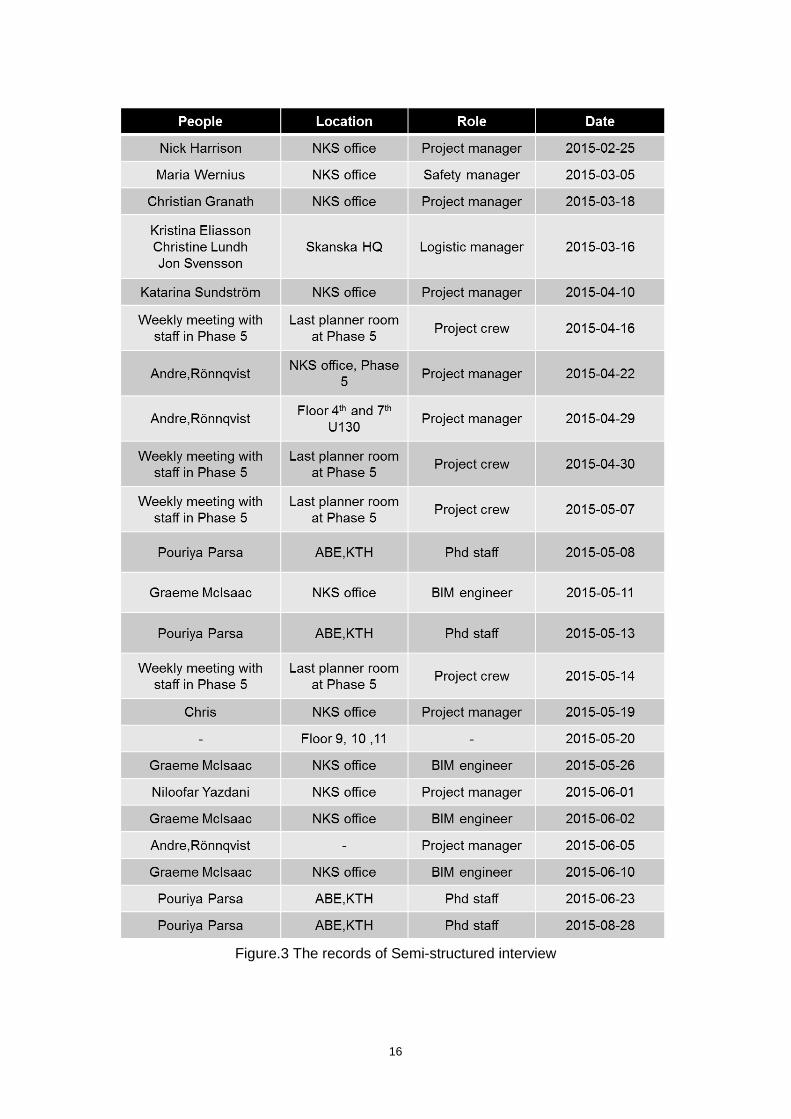
Figure.3 The records of Semi-structured interview
16

2.3 Observation Observation is important when analyzing construction project work. It is a way of
gathering data by watching behavior and events, and noting physical
characteristics in their natural setting. The main advantage of this method is that
the researcher can focus on community and know the immediate impact of
events. It allows the researcher to get an inside view of reality.
There are two types of observation, participant observation and non-participant
observation. Non-participant observation is when the researcher attempts to
observe people without letting them know. This means the researcher is not
involved in the event. Participant observation is when the people who the
researcher is observing and studying are cognizant of the researcher’s presence.
It assumes that the researcher observes the events and relevant people closely.
In some situations, observers may even need to live or work in that area (cite).
For this study, non-participant observation is selected. This means that the
author observed the time difference and relation between each construction
activity in a natural setting on site without those observed being explicitly aware
of the researcher’s presence.
17
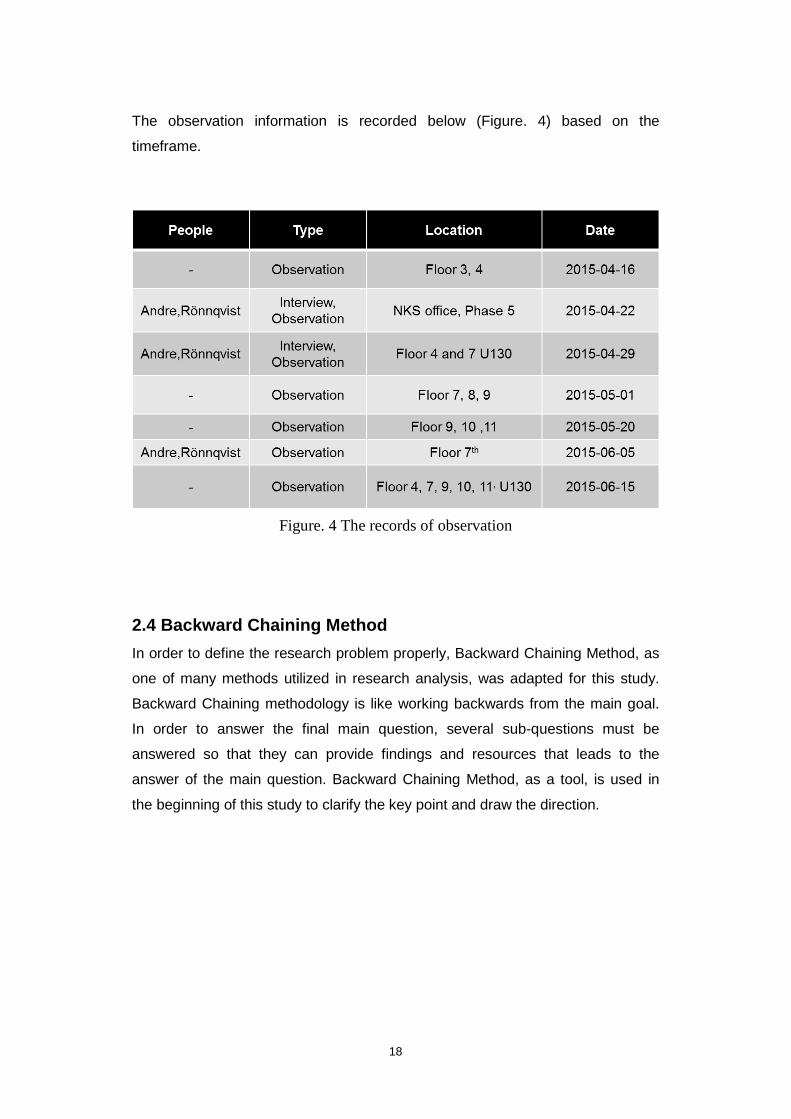
The observation information is recorded below (Figure. 4) based on the
timeframe. Regarding the detailed finding from each observation, please refer to
the appendix of this thesis.
Figure. 4 The records of observation
2.4 Backward Chaining Method In order to define the research problem properly, Backward Chaining Method, as
one of many methods utilized in research analysis, was adapted for this study.
Backward Chaining methodology is like working backwards from the main goal.
In order to answer the final main question, several sub-questions must be
answered so that they can provide findings and resources that leads to the
answer of the main question. Backward Chaining Method, as a tool, is used in
the beginning of this study to clarify the key point and draw the direction.
18
3. Theory
3.1 Work-space congestion On a construction site, various activities are usually carried out by subcontractors
in a limited area. Every subcontractor needs specific work-space for worker
movement, material allocation and equipment movement. Congestion usually
occurs when the job site is crowded, which means there is an interference among
two or more activities. One of the most common phenomena is that there is
overlap in the spaces where subcontractors need to do their tasks. (Guo, 2002).
In order to improve the productivity of overall work flow, project managers have to
create a detailed space management plan with all the subcontractors’ activities
involved. It not only must include the space allocation they required for activities,
but also the specific time frame of doing it. Otherwise, multiple activity crews may
clash with each other or conflicts may arise between workers and machines.
Sometimes even experienced project managers are unable to identify all the
potential conflicts. When conflicts occur, the schedule is affected and usually is
delayed (Guo, 2002). Many bad consequences can arise as a result, for instance,
safety accidents, collisions, stricture, and falling objects (Moon et al., 2014).
Therefore, it is essential to minimize the occurrence of conflicts.
If the work-space size or range, as a key factor, can be determined in advance,
the work-space congestion can be identified in advance as well. By doing this,
the productivity will be improved accordingly. However, before studying and
identifying the specific problems in the project case, several categories of work-
space congestion have to be analyzed.
19

To identify the work-space congestion, there are three categories:
A. Objects conflict with objects
B. Activities conflict with objects
C. Activities conflict with activities
Category A represents a situation where the area allocated for objects A
interferes with the one allocated for objects B (Figure. 5). The objects could be
arbitrary materials or equipment belonging to some activity. The objects A are
properly placed in zones 1 and 2, but the ones in zone 4 occupy parts of the
walking path and the area in zone 3. The dark blue area depicts the overlapping
region and conflict area. This situation will affect construction process. For
instance, suppose equipment for a ventilation installation was delivered to the
site in zone 3 on Monday and it needs to be prepared at least one day before the
installation process can be started. Additionally suppose that there were many
side boards and boxes together with the materials placed in zone 4 overlapping
with the corridor. If the phase do not clean up the area and move the materials
away, moving in the ventilation equipment will generate obstacles. If the conflict
can be identified in advance, the project manager can reschedule the tasks so
that the problem will be solved earlier.
Figure. 5 Objects conflict with objects
20
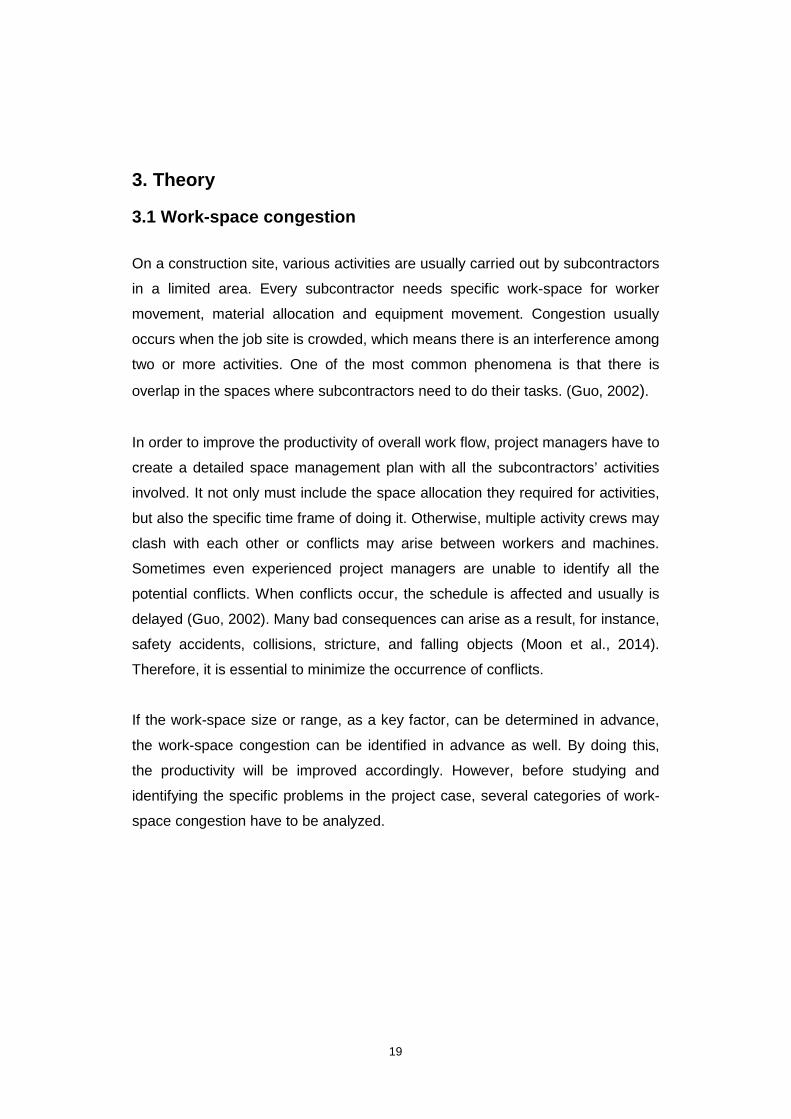
Category B represents a situation where the area allocated to an object interferes
with the working area of an activity (figure 6). There are many objects stored in
zones 1 and 2 while at the same time a group of people is doing their tasks in
zones 1, 2 and 3. It is obvious that the work-spaces for both objects and activity
overlap (dark blue area in the picture). This state will cause delay for the
construction work. For example, suppose some equipment and materials are
placed in zone 1. At the same time, several workers enter the space to do
flooring according to the schedule. Without emptying the whole zone, the workers
cannot start their job. As a result, they need to wait until all the objects have been
moved away and then start flooring. In this way, the duration of flooring will be
extended which may also affect the following activities. If the project manager
can identify the conflict in advance, the tasks can be finished more effectively.
Figure. 6 Activities conflict with objects
21
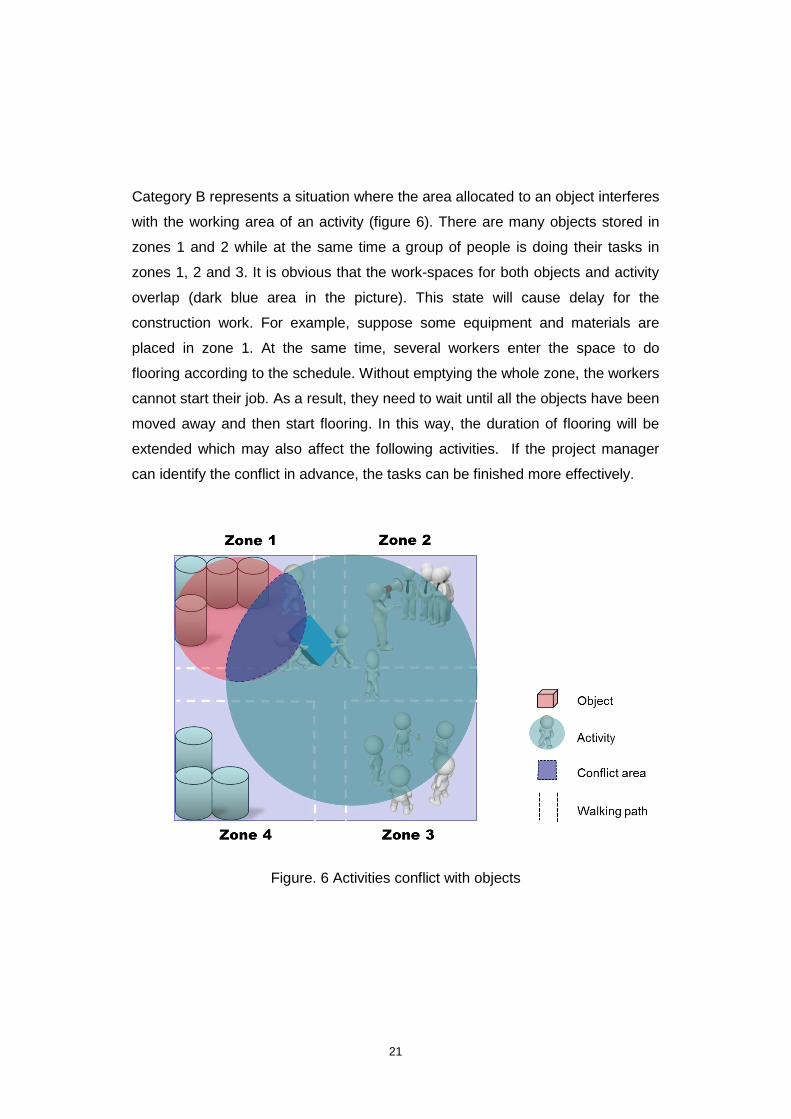
Category C represents a typical work-space congestion where two activity work
schedules overlap, which means they occupy the same working space during the
same time period (Figure. 7). As the picture shows below, activity B is taking
place in zones 3 and 4 whereas activity A is taking place in zones 1, 2 and 3.
Under this situation, zone 3 became the sharing area for both activities. Also the
walking path near zone 3 is occupied by Activity A. So, suppose participants in
activity A are doing pipework in zones 1, 2, and 3, while at the same time
participants in activity B are doing installations in zone 3. The workers of activity
B need to place the materials somewhere near the tasks, which require the same
working space as activity A. Besides that, delivering materials and moving
equipment makes the walking path very crowded and chaotic. All this has a
strong negative effect on the performance of each activity. If those conflicts could
have been foreseen in advance, either the work-space or the work schedule
could have been rearranged, and the conflicts avoided or significantly reduced.
Figure. 7 Activities conflict with activities
Thus, solving work-space congestion is considered as a crucial factor for
improving work effectiveness.
22
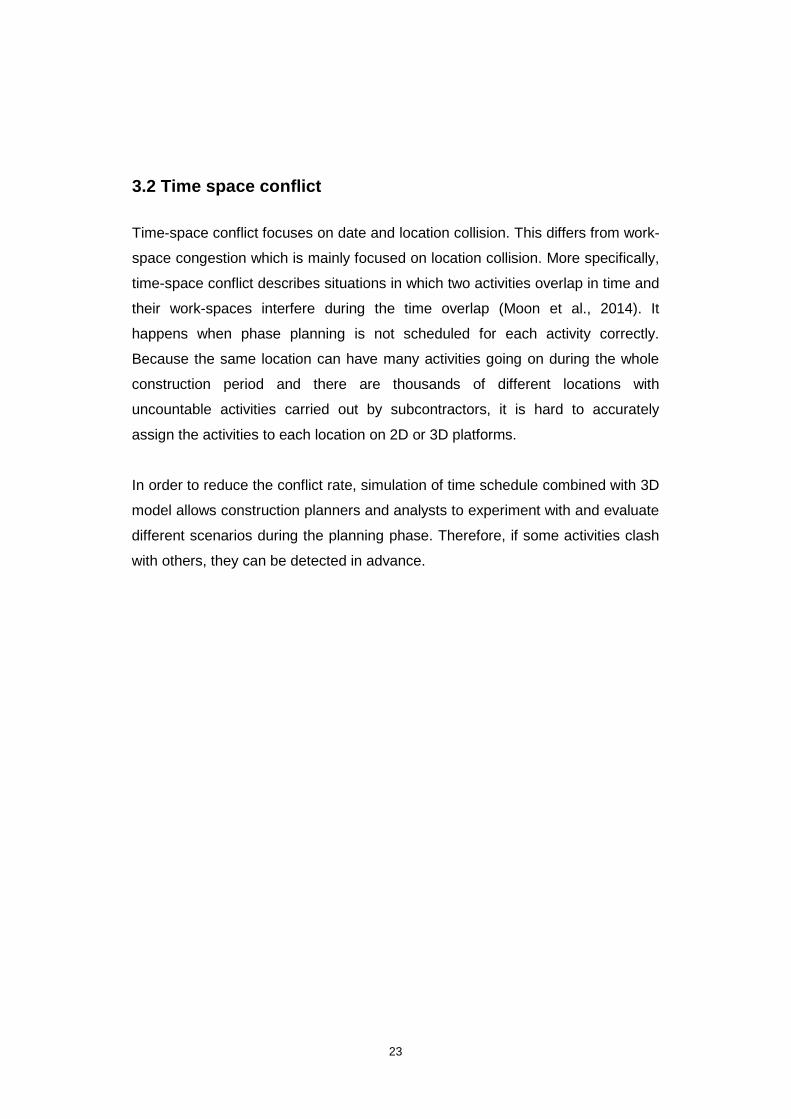
3.2 Time space conflict
Time-space conflict focuses on date and location collision. This differs from work-
space congestion which is mainly focused on location collision. More specifically,
time-space conflict describes situations in which two activities overlap in time and
their work-spaces interfere during the time overlap (Moon et al., 2014). It
happens when phase planning is not scheduled for each activity correctly.
Because the same location can have many activities going on during the whole
construction period and there are thousands of different locations with
uncountable activities carried out by subcontractors, it is hard to accurately
assign the activities to each location on 2D or 3D platforms.
In order to reduce the conflict rate, simulation of time schedule combined with 3D
model allows construction planners and analysts to experiment with and evaluate
different scenarios during the planning phase. Therefore, if some activities clash
with others, they can be detected in advance.
23
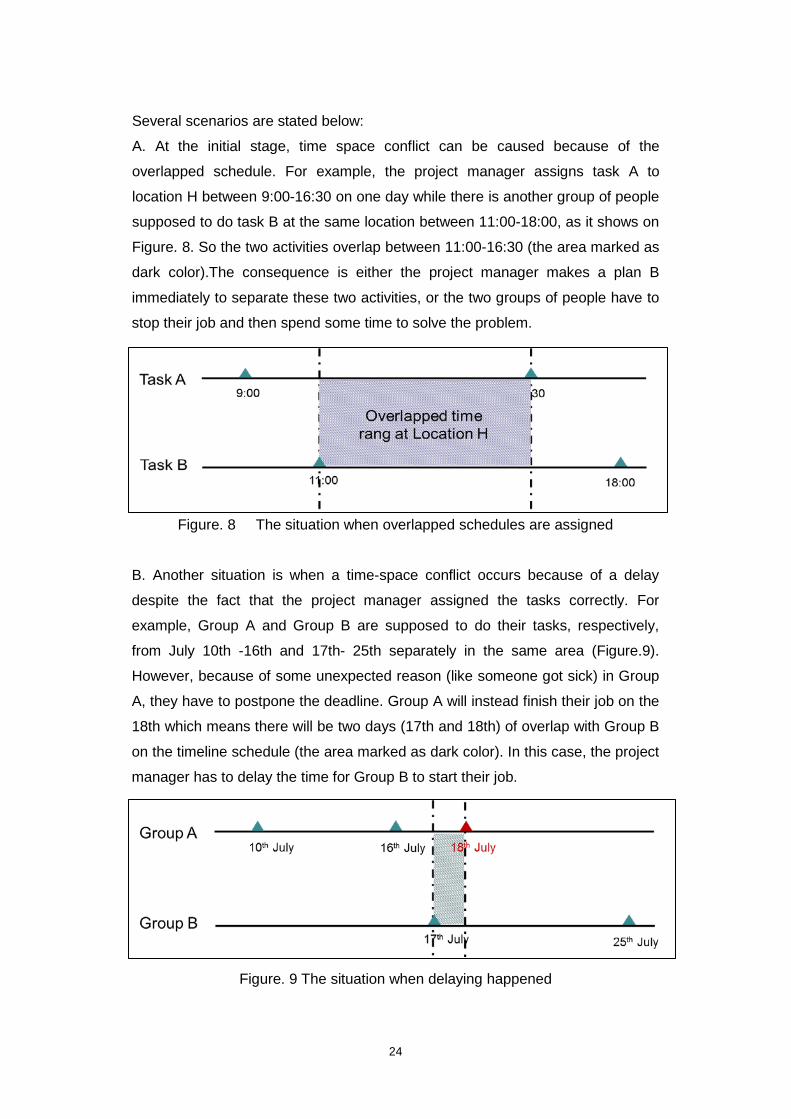
Several scenarios are stated below:
A. At the initial stage, time space conflict can be caused because of the
overlapped schedule. For example, the project manager assigns task A to
location H between 9:00-16:30 on one day while there is another group of people
supposed to do task B at the same location between 11:00-18:00, as it shows on
Figure. 8. So the two activities overlap between 11:00-16:30 (the area marked as
dark color).The consequence is either the project manager makes a plan B
immediately to separate these two activities, or the two groups of people have to
stop their job and then spend some time to solve the problem.
Figure. 8 The situation when overlapped schedules are assigned
B. Another situation is when a time-space conflict occurs because of a delay
despite the fact that the project manager assigned the tasks correctly. For
example, Group A and Group B are supposed to do their tasks, respectively,
from July 10th -16th and 17th- 25th separately in the same area (Figure.9).
However, because of some unexpected reason (like someone got sick) in Group
A, they have to postpone the deadline. Group A will instead finish their job on the
18th which means there will be two days (17th and 18th) of overlap with Group B
on the timeline schedule (the area marked as dark color). In this case, the project
manager has to delay the time for Group B to start their job.
Figure. 9 The situation when delaying happened
24
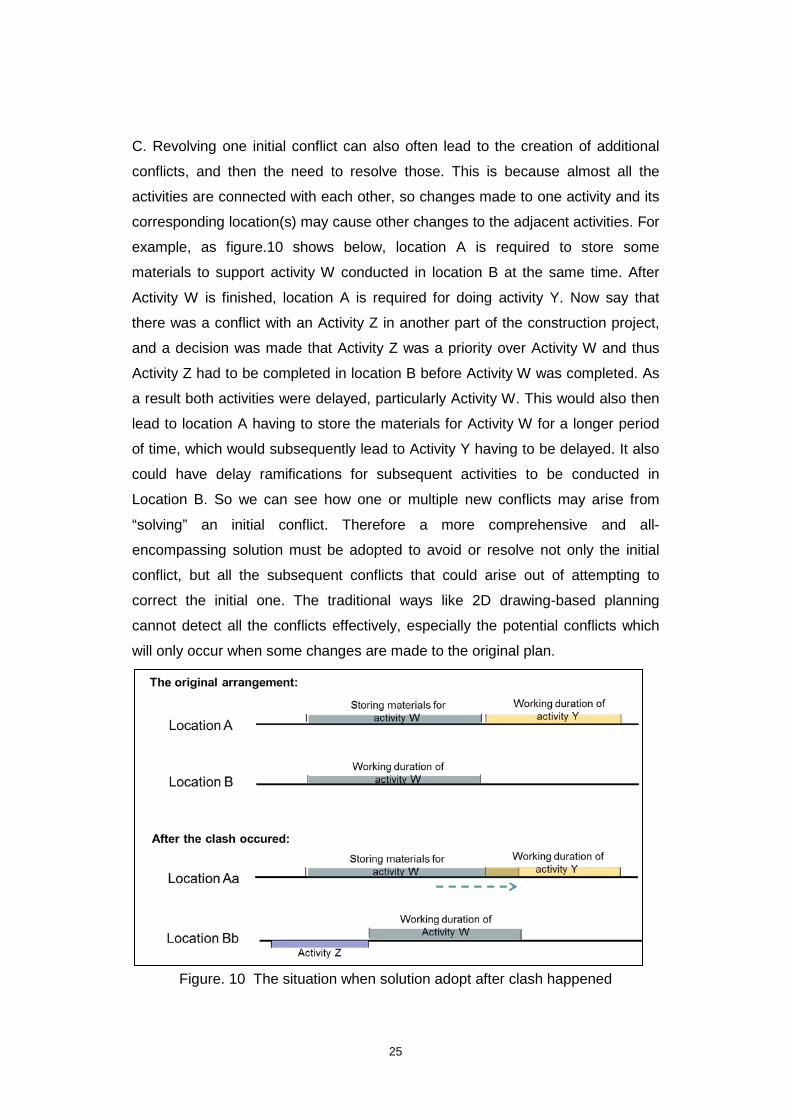
C. Revolving one initial conflict can also often lead to the creation of additional
conflicts, and then the need to resolve those. This is because almost all the
activities are connected with each other, so changes made to one activity and its
corresponding location(s) may cause other changes to the adjacent activities. For
example, as figure.10 shows below, location A is required to store some
materials to support activity W conducted in location B at the same time. After
Activity W is finished, location A is required for doing activity Y. Now say that
there was a conflict with an Activity Z in another part of the construction project,
and a decision was made that Activity Z was a priority over Activity W and thus
Activity Z had to be completed in location B before Activity W was completed. As
a result both activities were delayed, particularly Activity W. This would also then
lead to location A having to store the materials for Activity W for a longer period
of time, which would subsequently lead to Activity Y having to be delayed. It also
could have delay ramifications for subsequent activities to be conducted in
Location B. So we can see how one or multiple new conflicts may arise from
“solving” an initial conflict. Therefore a more comprehensive and all-
encompassing solution must be adopted to avoid or resolve not only the initial
conflict, but all the subsequent conflicts that could arise out of attempting to
correct the initial one. The traditional ways like 2D drawing-based planning
cannot detect all the conflicts effectively, especially the potential conflicts which
will only occur when some changes are made to the original plan.
Figure. 10 The situation when solution adopt after clash happened
25

However, some other factors should be also taken into account which may lead
to work-space congestion or time space conflict. For instance, inadequate or
inaccurate information from the clients will disrupt the construction flow
significantly. This happens when the information is delayed, or when clients
change their minds, so the information cannot be delivered to the construction
site on time with the correct content. Under this situation, either project managers
have to stop doing current activities and wait for the correct information, or
continue to guide the work with information that is not up to date. However, either
way, there is a high chance of conflict creation. Thus it is important to keep lean
thinking principles throughout the whole process in order to minimize the
deviations. More specifically, customer value and requirements have to be
specified at the beginning to ensure that there is a continuous flow in the
process. Having close communication with clients, managers as well as
employees will avoid mistakes and defects. The flow will then be optimized.
26
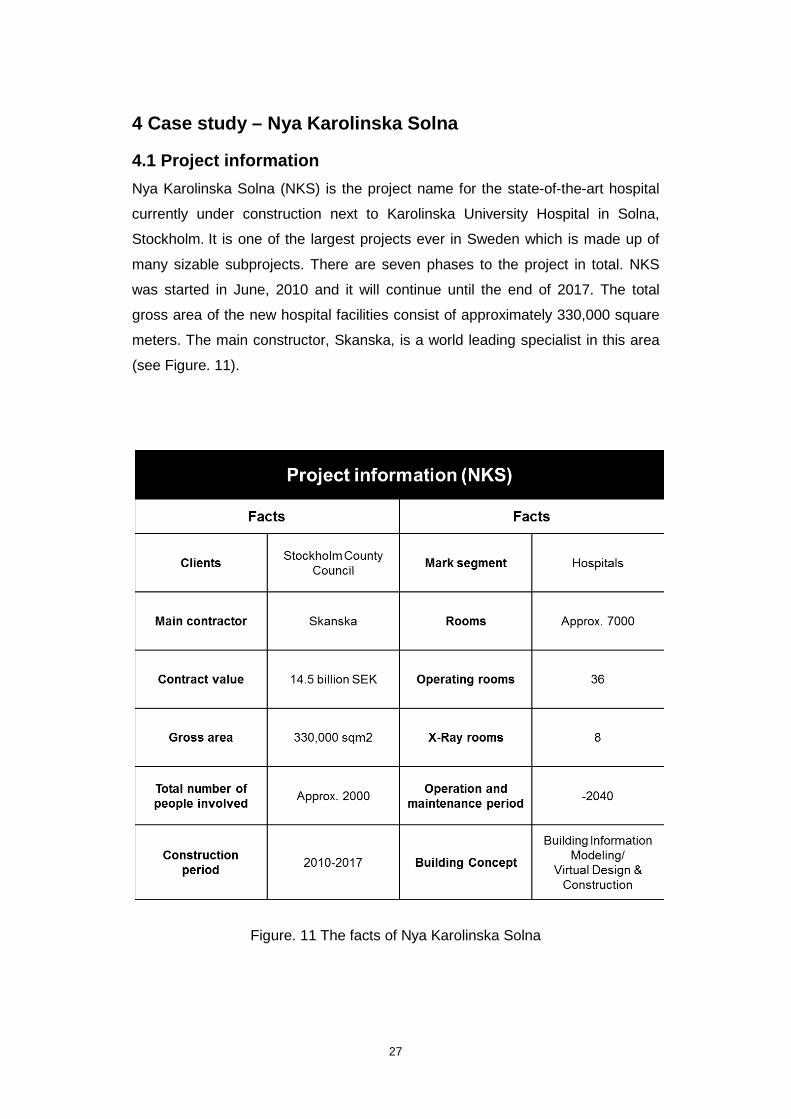
4 Case study – Nya Karolinska Solna
4.1 Project information Nya Karolinska Solna (NKS) is the project name for the state-of-the-art hospital
currently under construction next to Karolinska University Hospital in Solna,
Stockholm. It is one of the largest projects ever in Sweden which is made up of
many sizable subprojects. There are seven phases to the project in total. NKS
was started in June, 2010 and it will continue until the end of 2017. The total
gross area of the new hospital facilities consist of approximately 330,000 square
meters. The main constructor, Skanska, is a world leading specialist in this area
(see Figure. 11).
Figure. 11 The facts of Nya Karolinska Solna
27

As figure. 12 shows below, Phase 1 and 2 are the Technological Building and
Garage Car Park, which were already finished in December 2012 and May 2014,
respectively. Phase 5 - the biggest part and also the most important one - is the
main body of the hospital which occupies approximately 125,000 sqm2. This is
about 40 percent of the whole project. The total cost for Phase 5 is around 4
billion SEK (excluding design). Phase 5 contains three buildings: 1:20, 1:30 and
1:40. They share the common floors from floors 1-3. From floor 4 onwards,
buildings are built up separately with some parts connected. Phase 5B is the
second part of the hospital which will be handed over by October 2017. Phase 6
is a research laboratory which is expected to be finished in July 2017. The last,
phase 7, is now under construction as well. It will be handed over as a patient
hotel combined with a garage.
Figure. 12 The timeframe for completion of the hospital
28
4.2 Conflict identification
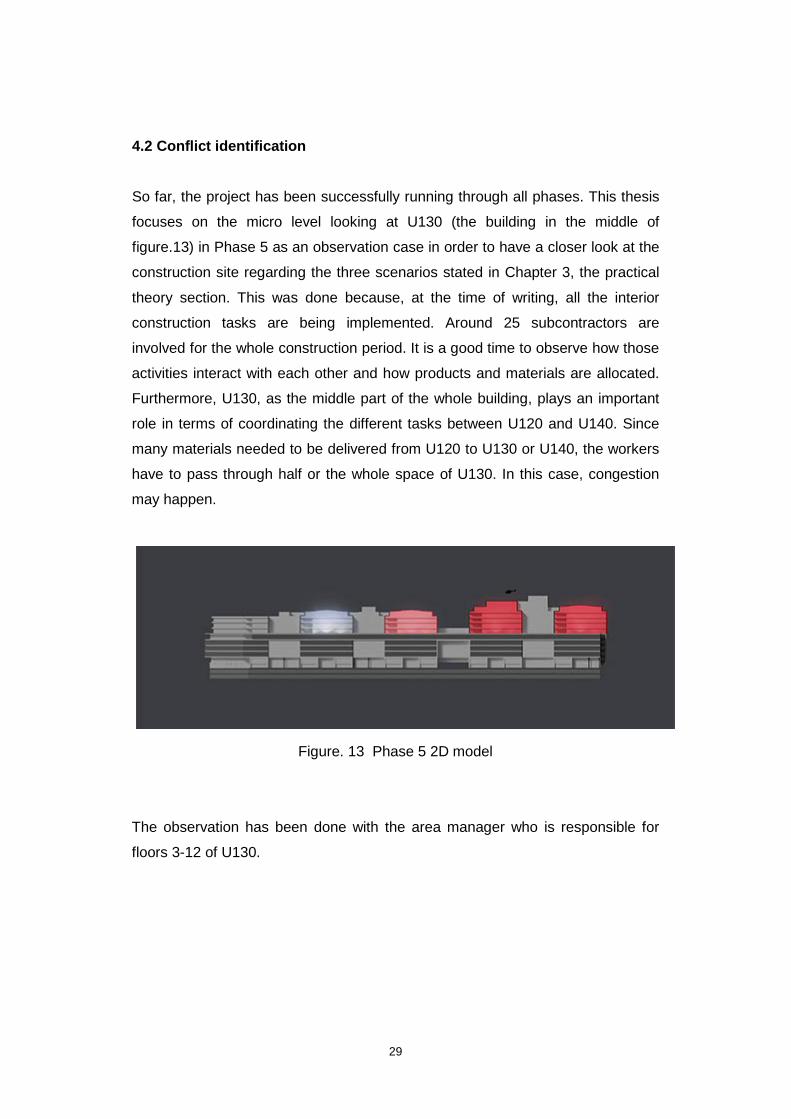
So far, the project has been successfully running through all phases. This thesis
focuses on the micro level looking at U130 (the building in the middle of
figure.13) in Phase 5 as an observation case in order to have a closer look at the
construction site regarding the three scenarios stated in Chapter 3, the practical
theory section. This was done because, at the time of writing, all the interior
construction tasks are being implemented. Around 25 subcontractors are
involved for the whole construction period. It is a good time to observe how those
activities interact with each other and how products and materials are allocated.
Furthermore, U130, as the middle part of the whole building, plays an important
role in terms of coordinating the different tasks between U120 and U140. Since
many materials needed to be delivered from U120 to U130 or U140, the workers
have to pass through half or the whole space of U130. In this case, congestion
may happen.
Figure. 13 Phase 5 2D model
The observation has been done with the area manager who is responsible for
floors 3-12 of U130.
29
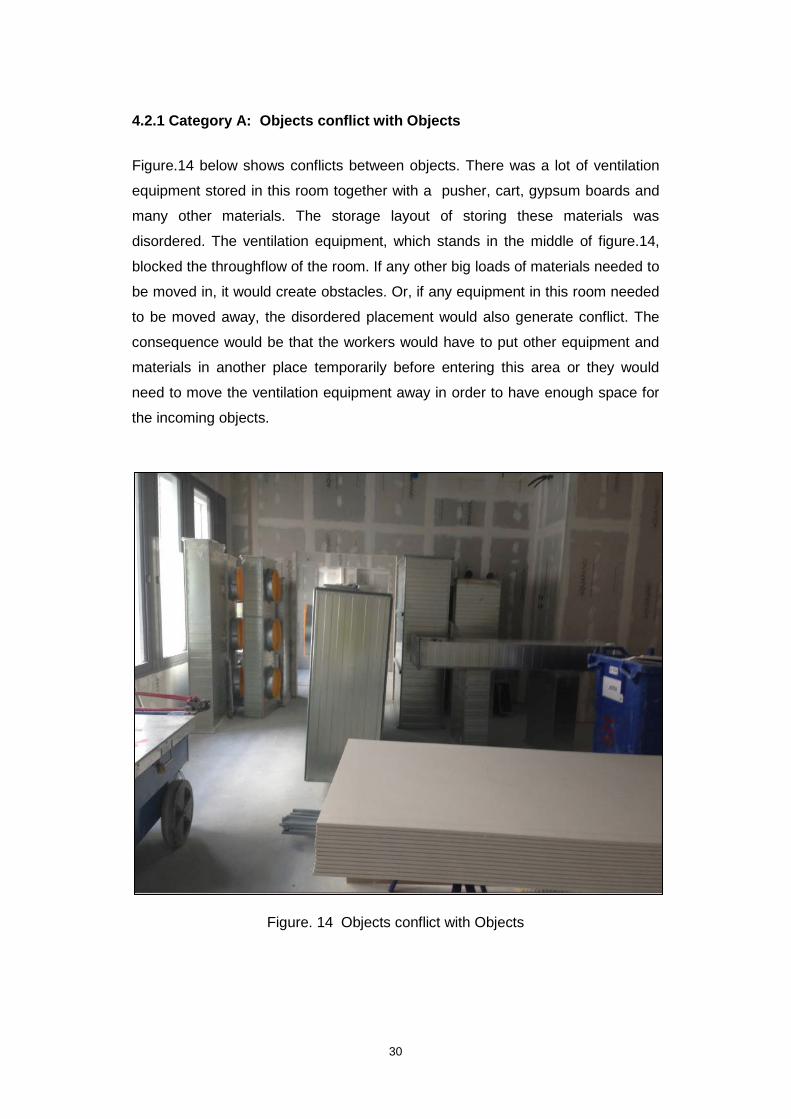
4.2.1 Category A: Objects conflict with Objects
Figure.14 below shows conflicts between objects. There was a lot of ventilation
equipment stored in this room together with a pusher, cart, gypsum boards and
many other materials. The storage layout of storing these materials was
disordered. The ventilation equipment, which stands in the middle of figure.14,
blocked the throughflow of the room. If any other big loads of materials needed to
be moved in, it would create obstacles. Or, if any equipment in this room needed
to be moved away, the disordered placement would also generate conflict. The
consequence would be that the workers would have to put other equipment and
materials in another place temporarily before entering this area or they would
need to move the ventilation equipment away in order to have enough space for
the incoming objects.
Figure. 14 Objects conflict with Objects
30
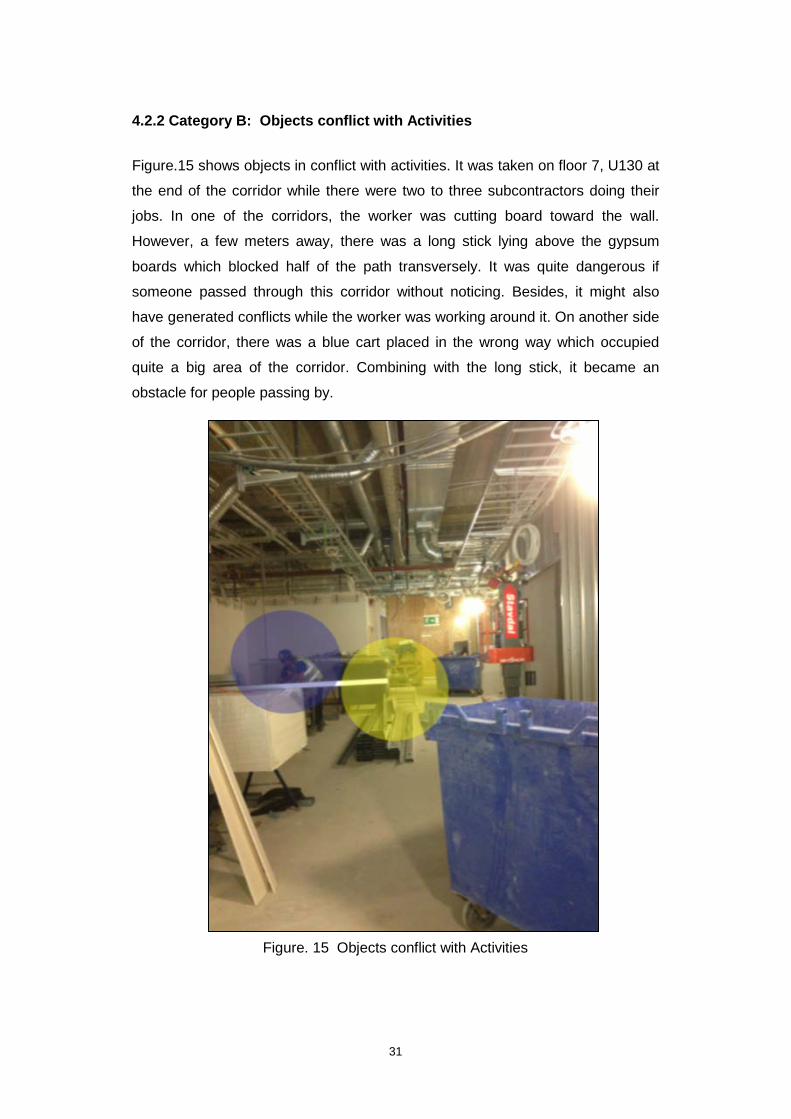
4.2.2 Category B: Objects conflict with Activities
Figure.15 shows objects in conflict with activities. It was taken on floor 7, U130 at
the end of the corridor while there were two to three subcontractors doing their
jobs. In one of the corridors, the worker was cutting board toward the wall.
However, a few meters away, there was a long stick lying above the gypsum
boards which blocked half of the path transversely. It was quite dangerous if
someone passed through this corridor without noticing. Besides, it might also
have generated conflicts while the worker was working around it. On another side
of the corridor, there was a blue cart placed in the wrong way which occupied
quite a big area of the corridor. Combining with the long stick, it became an
obstacle for people passing by.
Figure. 15 Objects conflict with Activities
31
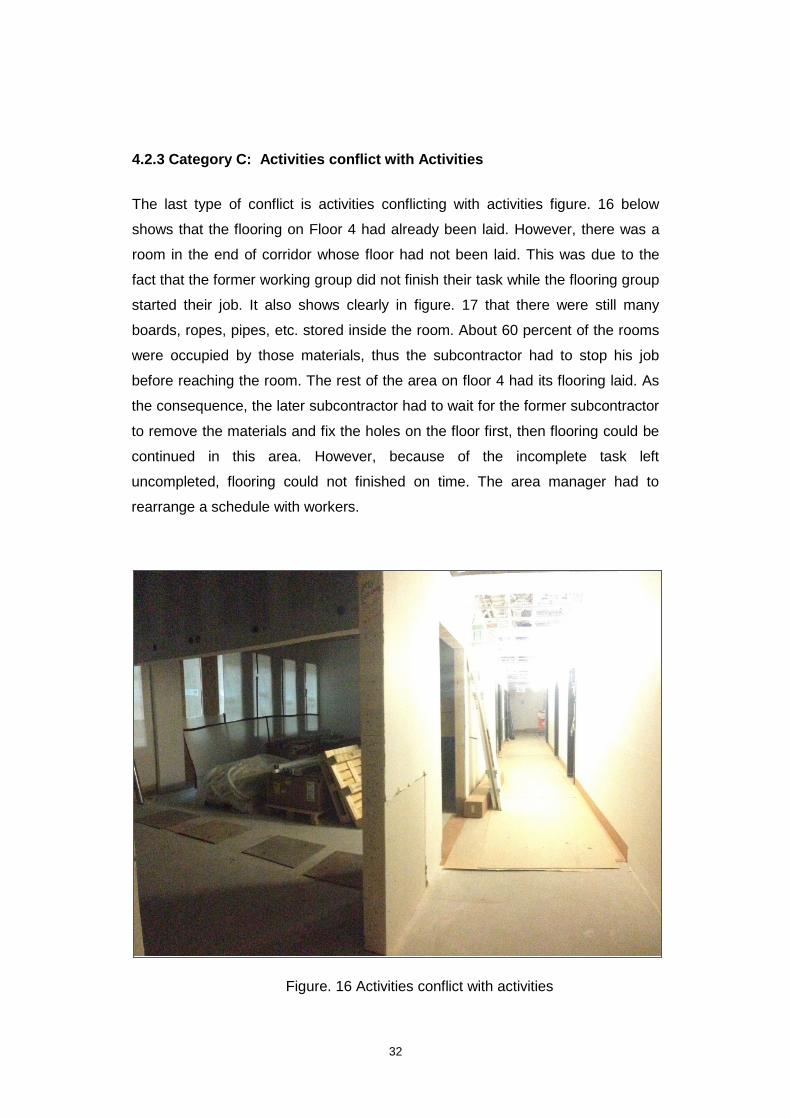
4.2.3 Category C: Activities conflict with Activities
The last type of conflict is activities conflicting with activities figure. 16 below
shows that the flooring on Floor 4 had already been laid. However, there was a
room in the end of corridor whose floor had not been laid. This was due to the
fact that the former working group did not finish their task while the flooring group
started their job. It also shows clearly in figure. 17 that there were still many
boards, ropes, pipes, etc. stored inside the room. About 60 percent of the rooms
were occupied by those materials, thus the subcontractor had to stop his job
before reaching the room. The rest of the area on floor 4 had its flooring laid. As
the consequence, the later subcontractor had to wait for the former subcontractor
to remove the materials and fix the holes on the floor first, then flooring could be
continued in this area. However, because of the incomplete task left
uncompleted, flooring could not finished on time. The area manager had to
rearrange a schedule with workers.
Figure. 16 Activities conflict with activities
32
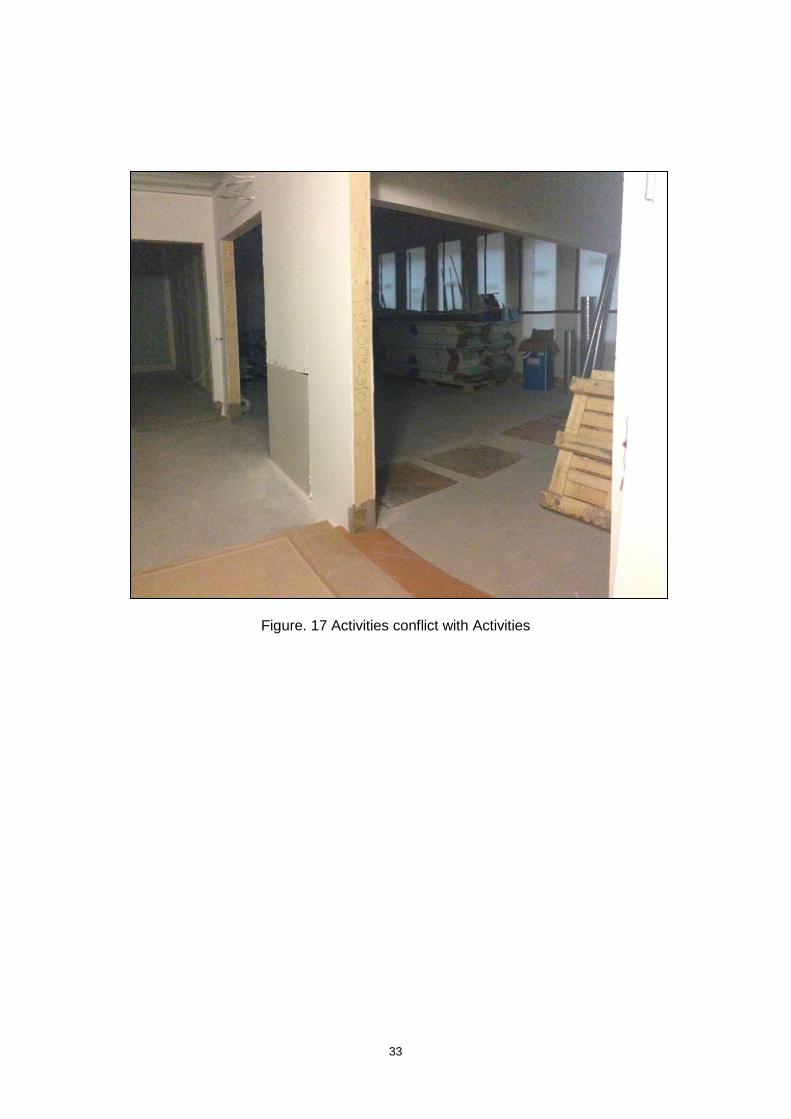
Figure. 17 Activities conflict with Activities
33
5 Software experiment
4D BIM Scheduling
Currently, Skanska is using Primavera P6 and Powerproject together with
Naviswork, Revit, MagiCad and other software as BIM tools for project
management and scheduling. These softwares have been successfully used for
generating 3D and 4D models. However the models could be improved by
adopting Vico software which combines 3D model and timeline schedule to
achieve 4D simulation. More specifically, Vico helps planners divide the site into
manageable areas per trade (Vico Software, 2015b) through LBS (location
Breakdown Structure). After the tasks or activities are assigned to the different
areas, the efficiency of work based on the quantity takeoff and the number of
people can be evaluated. By doing this, all the activities are connected with their
locations in the Vico system and it can be used to track and to arrange work
sequences accurately. Followed by flow line scheduling, once the starting dates
and closing dates are added up, the duration of all activities can be estimated.
Therefore, the project manager can easily detect the conflicts and reschedule the
activities to optimize the efficiency of the project. By using flow line scheduling,
the construction schedule can be optimized.
5.1 Software implementation
5.1.1 Problem Assessment Before officially starting the modeling phase, format issues were identified as a
potentially big problem. As this thesis mentioned before, Vico Software has
chosen as the main tool for combining 3D modeling and timeline scheduling.
Literally, it supports many publishers (i.e, Tekla, Revit, ArchiCAD, AutoCAD
MEP, and AutoCAD Architecture) and importers (i.e, IFC, CAD-Duct and
SketchUp). However, due to the license limitation, only IFC files can be imported
into Vico without requesting additional licenses. In this case, all the 3D models
required have to be imported as IFC format in Vico.
34

Several obstacles need to be overcome when transferring these 3D models to be
used in Vico.
A. First, Skanska has never used IFC files before, and the models for NKS were
generated in dwg, rvt, nwd, nwc and nwf by using Revit, MagiCad, Naviswork or
others, not in IFC. Therefore, it was necessary to transfer those formats to IFC
for Vico in order to continue with the experiment.
B. Second, some of those models could not be generated as proper IFC files
through the transfer. To use an example that reflected a common problem, in one
case the size of file was only 5KB after transferring which means it did not
contain enough information about elements and thus did not become a usable
IFC file.
C. Third, even for the files that did transfer successfully to an IFC file, some of
them still did not show as a proper image in Vico. It may have been because the
sizes of files (around 153MB) were too big so the computer’s hard drive could not
handle such a heavy workload. Or it could have been that some of those files
were MEP models and they were created by MagiCAD which certainly include
semantics and properties, however, were not constructed in full accordance with
the structural requirements of an interoperable BIM model.
5.1.2 Solutions Four 3D models needed to be successfully transferred and assessed for the
purposes of this experiment, and in the end this was achieved. Three were MEP
files and one was an architecture file, all from U130. The was no initial problem
with having the architecture file in the correct .ifc format. Regarding the MEP
model files, the BIM coordinator in NKS provided the MEP models in .dwg format
at the beginning. As mentioned in obstacle B above, the attempt to convert .dwg
to .ifc, initially was unsuccessful. However upon consulting with Patrik Malarholm,
the owner of Vico software, he suggested publishing the DWG files from Revit to
Vico directly. This worked, and the files published in Vico successfully, showing
all the needed information.
35
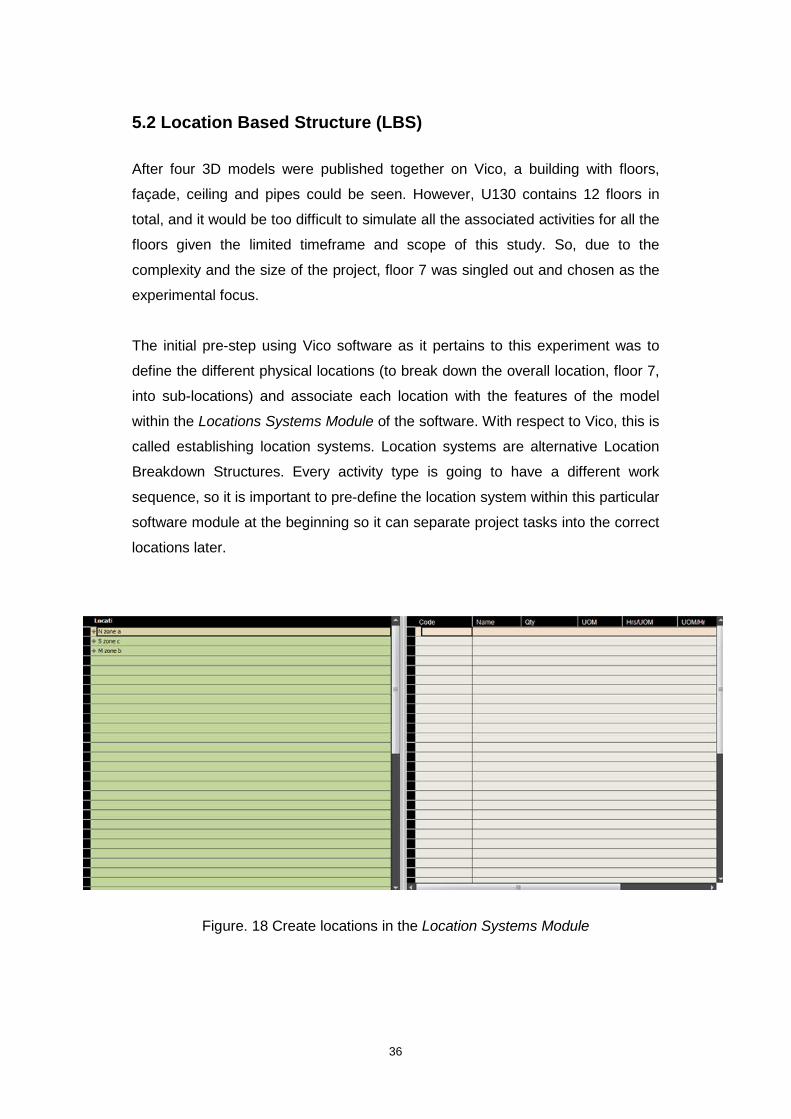
5.2 Location Based Structure (LBS) After four 3D models were published together on Vico, a building with floors,
façade, ceiling and pipes could be seen. However, U130 contains 12 floors in
total, and it would be too difficult to simulate all the associated activities for all the
floors given the limited timeframe and scope of this study. So, due to the
complexity and the size of the project, floor 7 was singled out and chosen as the
experimental focus.
The initial pre-step using Vico software as it pertains to this experiment was to
define the different physical locations (to break down the overall location, floor 7,
into sub-locations) and associate each location with the features of the model
within the Locations Systems Module of the software. With respect to Vico, this is
called establishing location systems. Location systems are alternative Location
Breakdown Structures. Every activity type is going to have a different work
sequence, so it is important to pre-define the location system within this particular
software module at the beginning so it can separate project tasks into the correct
locations later.
Figure. 18 Create locations in the Location Systems Module
36
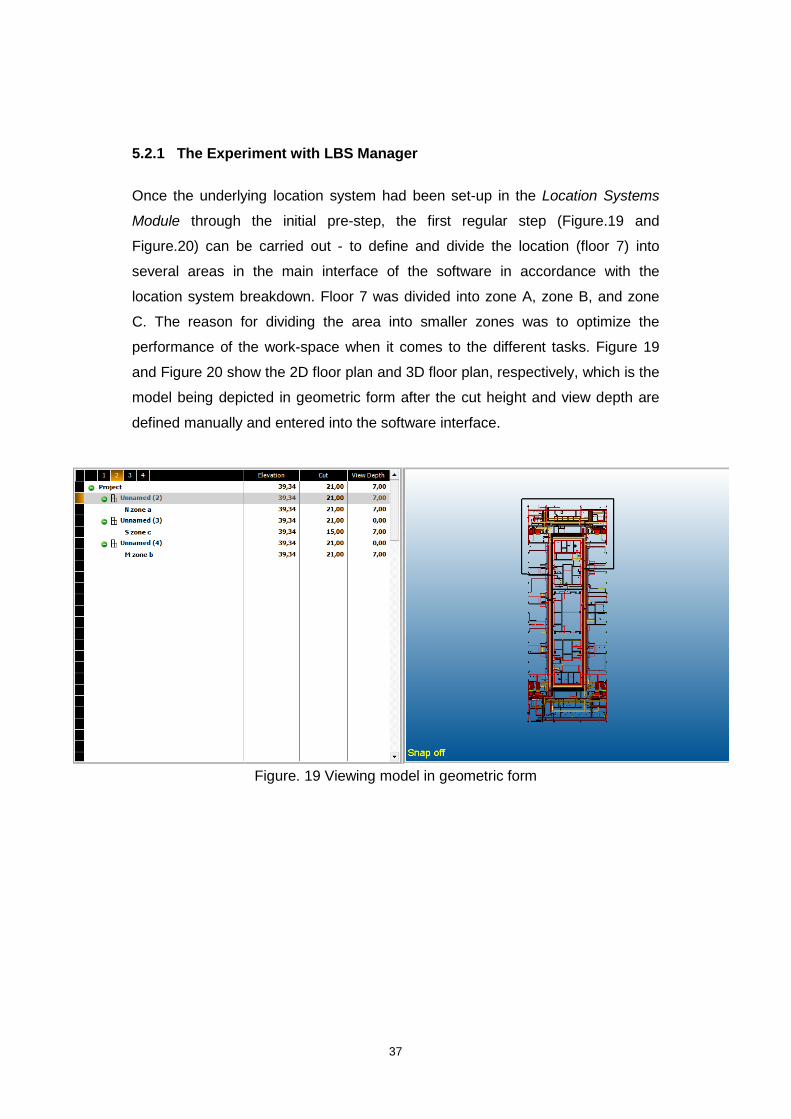
5.2.1 The Experiment with LBS Manager
Once the underlying location system had been set-up in the Location Systems
Module through the initial pre-step, the first regular step (Figure.19 and
Figure.20) can be carried out - to define and divide the location (floor 7) into
several areas in the main interface of the software in accordance with the
location system breakdown. Floor 7 was divided into zone A, zone B, and zone
C. The reason for dividing the area into smaller zones was to optimize the
performance of the work-space when it comes to the different tasks. Figure 19
and Figure 20 show the 2D floor plan and 3D floor plan, respectively, which is the
model being depicted in geometric form after the cut height and view depth are
defined manually and entered into the software interface.
Figure. 19 Viewing model in geometric form
37

Figure. 20 Breakdown location into three parts
The second step (Figure. 21) is to create tasks and define them in the task
manager. Usually, the tasks (which are also referred to as onsite activities) would
have already been sorted out in another software. Here, Powerproject software is
used to plan all activities. So, the selected activities will be exported to a
spreadsheet from Powerproject and then inserted into the Task Manager.
Figure. 21 Define tasks in the Task Manager
38

The third step (Figure. 22) is to export takeoff item and their associated quantities
from the floor 7 model into the Cost Planner sheet. The typical purpose of using
the Cost Planner sheet would be to define target costs for a 5D model, however
with 4D models (which is what this experiment pertains to) it is not necessary to
add unit cost, consumption, waste factors, etc. into the cost planner sheet.
Instead, only quantities are needed. Thus, in the cost planner, each takeoff item
is listed with its associated quantity.
Figure. 22 Takeoff items with associated quantities
The fourth step (Figure.23) is to associate the information from the Cost Planner
sheet to the tasks. Both Task Manager and Cost Planner need to be included in
the view. After activating the cost planner sheet, the selected items can be
dragged and then link to the corresponding task manager on the left. After
assigning all the takeoff items to the tasks, it allows planner to calculate task
durations based on detailed location-based quantity data. (Vico Software,
2015a )
39

Figure. 23 Viewing Task Manager and Cost Planner
The fifth step (Figure.24) is to assign tasks to Location Systems. (It should be
noted that this function is only for a situation in which the planner already knows
all the locations and their corresponding tasks). So, all the tasks get assigned to
a specific location system and only the information from that location system will
be filtered into task’s duration calculations.
Figure. 24 Assigning tasks to Location System
40

Figure.25 below shows a general process of establishing LBS and assigning
tasks. The goal is to increase the work crew’s productivity rate by tracking their
migration and reducing the frequency of them moving around inefficiently.
Figure. 25 Process diagram
41
5.3 Flowing scheduling
After breaking down the project into smaller locations, now it’s time to use these
to plan and analyze the project work as it flows through each location. (Kenley
and Seppänen, 2006)
Flow line schedule consists of LBS in the vertical axis and a calendar in the
upper horizontal axis. There are a series of sloping lines representing different
tasks within the schedule view. Each task is made up of sub-components of
materials needed to complete that task which have been assigned to the task
manager, which means each task includes the quantity of components. As tasks
flow through the project, each one of them corresponds to its associated location
in the vertical column.
5.3.1 The experiment of flowing scheduling
Figure.26 shows the flow line view of each activity corresponding with its location
and timeline schedule. There are 29 tasks in total beginning on Jan 21st, 2015
and ending on Oct 9th, 2015. Taking an example of the first task - completion of
first side boarding - it started on Jan 21st at zone b, then moved to zone c on
Feb 5th and ended up at zone a on Feb 19th. The rest of the task shows that
there are some conflicts between different activities because some flow lines
overlapped with others during the same time period and some flow lines shared
the same location at certain points. However, the perfect situation should enable
each task to not overlap with its predecessor or successor, so all the crews can
flow through the site location continuously with a clear logic relation and achieve
the optimal productivity rate.
42

Figure.26 Flow line view of each activity in 7 floor, U130 between 2015-01-27 and 2015-10-09
43

In order to detect the conflict and de-risk the schedule, it is essential to define
schedule logic in Schedule Planner through a Gantt Chart view or Network view.
The dependency dialogue box is activated in Figure.27 below when the planner
draw a dependency link to another task. The options include
FF/SF/FS/SS/SS+FF, buffer delays, and location delays. In this example FS is
the appropriate option to select. FS means ‘Finish to Start’. So in this case, task
number 2 will start after task number 1 is finished. Following this rule, the
remaining tasks can be defined individually according to their own dependency.
Picture 13 below shows the final version of schedule logic relationship.
Picture 12
Figure.27 The Gantt Chart view
Figure. 28 The Network view
44

5.3.2 Solution A
To ensure high usage and productivity in each location, the ASAP method can be
introduced. ASAP, As Soon As Possible, indicates that under the external logic
relationship tasks can start as soon as the location becomes available. (Note that
when the planner starts to create a task, it will always start as a Continuous task
or Paced task since it is the base of LBS scheduling). Take an example - as
Figure.29 shows below, the yellow area marked between task 1 and task 2 is
free. After selecting ASAP, task 2 splits at each zone (Figure.30). Taking a closer
look at the calendar, the end date of the task also moved ahead. Therefore, by
using ASAP, the location can be optimized in its usage and the tasks can be
Figure. 29 Flow line view before adopting ASAP
45
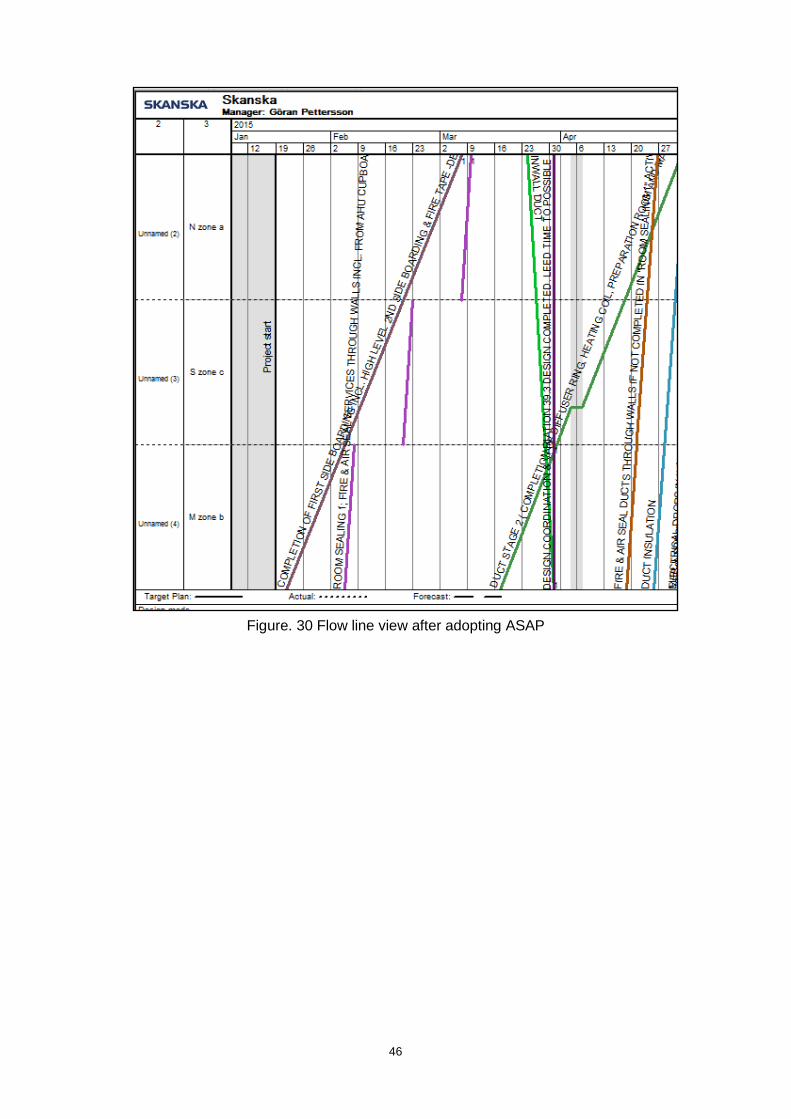
Figure. 30 Flow line view after adopting ASAP
46
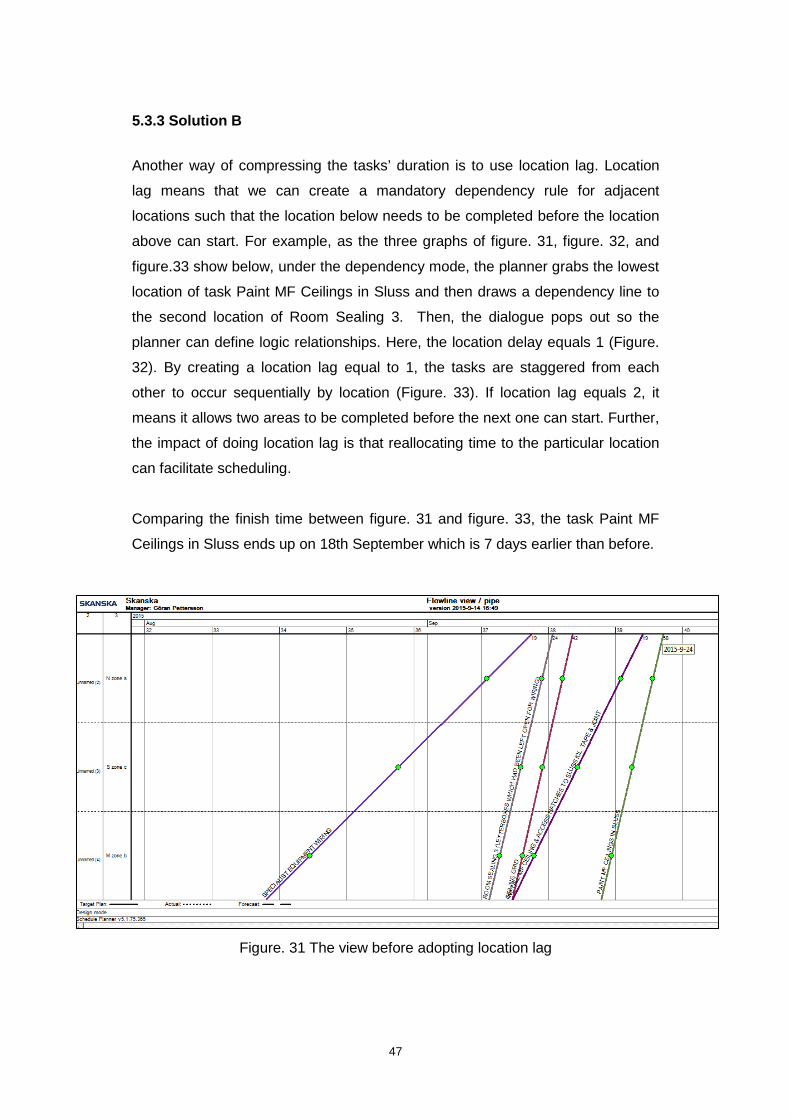
5.3.3 Solution B
Another way of compressing the tasks’ duration is to use location lag. Location
lag means that we can create a mandatory dependency rule for adjacent
locations such that the location below needs to be completed before the location
above can start. For example, as the three graphs of figure. 31, figure. 32, and
figure.33 show below, under the dependency mode, the planner grabs the lowest
location of task Paint MF Ceilings in Sluss and then draws a dependency line to
the second location of Room Sealing 3. Then, the dialogue pops out so the
planner can define logic relationships. Here, the location delay equals 1 (Figure.
32). By creating a location lag equal to 1, the tasks are staggered from each
other to occur sequentially by location (Figure. 33). If location lag equals 2, it
means it allows two areas to be completed before the next one can start. Further,
the impact of doing location lag is that reallocating time to the particular location
can facilitate scheduling.
Comparing the finish time between figure. 31 and figure. 33, the task Paint MF
Ceilings in Sluss ends up on 18th September which is 7 days earlier than before.
Figure. 31 The view before adopting location lag
47

Figure. 32 The view of setting
Figure. 33 The view after adopting location lag
48

By combining ASAP and location lag in conjunction with LBS and time line
scheduling, project planner can clearly see the conflicts during the whole
construction process and then modify the dependencies of each task. Comparing
the original planning view (Figure. 34). with the current planning view (Figure.
35), it is obvious that those four main conflicts have improved. The new planning
view shows the total time for finishing those tasks as less than it was in the
original planning view.
Figure. 34 The original planning view
Figure. 35 The current planning view
49

6. Analysis
This section is the assessment of Vico software with respect to strengths and
limitations of it as a BIM tool. Additionally, the questions raised in the Research
Purpose and Questions section are answered in this section based on the
software experiment.
6.1 Strengths and Opportunities for Beneficial Implementation
Regarding strengths, first off Vico software offers a wide range of functions not
only focused on 4D modeling but also on 5D modeling (4D plus cost estimating).
In the current NKS project, planners use scheduling tools and cost planning tools
separately. However, it is possible to combine those project components by using
one BIM tool and then follow up with reporting and data mining.
Second, the flow line view in Vico software is more readable than comparable
tools. Compared to the schedule generated by Powerproject, Vico software
contains one more element which is LBS. This enables clients and workers to
understand the information more easily through the flow line view. Additionally,
the flow line view is more effective when detecting conflicts because it aims to
eliminate overlapping tasks and plan continuous work without conflicts crossing.
As seen in the figures from the software experiment in Section 5, it can compress
activity duration in certain locations in certain situations without introducing risks.
Furthermore, using the time and space buffer function can mitigate the project
bottlenecks as well.
Lastly, as it is important for the project to be visualized during the construction
process, Vico software can also make 4D simulations for the project (when done
with cost planning and schedule planning). So on the one hand, planners and
managers can foresee the whole construction process visually for themselves,
therefore allowing for potential conflicts to be easily discovered and for an
adjustment plan to be implemented immediately. And on the other hand, when
these planners and managers present the project to their clients and other people
who are not experts in the construction field, this 4D simulation allows them to
understand the information quickly, even though they are not well versed in
construction.
50

6.2 Limitations There are a few limitations when adopting Vico software for planning construction
activities. First, Vico software has certain requirements for the format of a model.
In the case of Skanska, they did not use IFC format very often beforehand, thus
they could not import some of their 3D models into the Vico software. It will be
hard for Skanska to continue to work with Vico if they are not able to import fully
comprehensive and accurate information. Secondly, even though Vico software
offers really advanced possibilities for model manipulation not only in scheduling
but also in cost planning, the planners and project managers in NKS have been
using their current software and BIM tools for a long time. It will be time
consuming for them to learn all the functions of Vico software and transfer all the
data and information to the format that Vico requires. Finally, Vico software
seems to have less capacity to run a big model due to file size limitations.
6.3 The answers for the questions These questions were first proposed in the Research Purpose and Questions
section. The answers are given below:
1. How are conflicts detected through 4D models? By building up an LBS system with all associated elements of tasks and inputting
a time line schedule, the conflicts will show up from the schedule planner view
automatically.
2. How can those conflicts be solved permanently? Once the conflicts are detected by the planner, they can be highlighted and
communicated to avoid the issue. But with changes in the schedule due to
adjustments to prevent these initially-detected conflicts, other conflicts may arise,
or other unforeseeable conflicts may arise during the actual construction process
due to issues that have nothing to do with poor planning. There needs to be
continual monitoring as construction progresses. So in that sense not all conflicts
can be pre-solved “permanently.” Yet since planners can easily visualize the
51
conflicts with the 4D model, they will be aware and preplan effectively in order to
avoid risks to the greatest extent possible. So in general, in order to avoid any
conflicts occurring as best as possible, it is very important to logically plan the
schedule in the beginning.
3. How can timeline schedules be re-arranged in order to maximize
performance?
This thesis has introduced two main methods. One of these was ASAP, As Soon
As Possible, which allows tasks to start immediately by splitting the task itself
when the location is available. The other one was Location Lag, which creates
mandatory dependency from the related tasks based on the locations. By doing
this, the location can only be used when the previous task is finished. Thus, it
reduces the risk of overlapping and keep the performance stable.
4. What is the potential risk of re-arranging the timelines for the tasks? The potential risk is having other conflicts arise after resolving the current one.
5. Is it possible to prevent the construction process from having delays? It is possible to prevent delays. However, it requires not just re-scheduling the
plan, but also quick problem solving ability, effective communication flow and
sufficient finance support. However, by using visualized scheduling, project
managers can minimize conflicts and improve their working efficiency.
52

7. Conclusion Foreseeing conflicts is very important for the whole construction process. If
project managers and planners can detect inefficiencies in advance, it allows
them to avoid having activities delayed and having to rework them. Applying 4D
modeling and flow line theory allows planners to visualize those inefficiencies in
the schedule so that they can re-schedule the tasks before they lead to delays or
other problems.
Nevertheless, there are methods based on theories other than flow line theory
that can also be incorporated in the construction planning and execution process
to increase efficiency and improve results. The true core of achieving optimal
results is rooted in sound communication. Whatever the changes that are made
by project managers, it is always essential that they are discussed with the
subcontractors and that the information is delivered to the workers successfully.
Furthermore, whenever planners reschedule, it is essential that it’s done in
conjunction with the client’s needs and that the implementation is transparent.
The NKS project followed the Lean Construction Method and Last Planner
System quite well through all construction phases for the portion of the project
that was studied in this thesis. It was also well organized by using current BIM
tools to achieve high productivity, and thus provided an effective use case for
Vico software. The use of Vico software for improving construction planning and
implementation efficiency, as described in this thesis, would provide improved
efficiency for the NKS project, as well as any other similar construction project.
4D modeling through Vico software gives project managers another means and
method to better schedule construction tasks onsite.
53
8. References
Akinci, B., Fischer, M., Levitt, R., and Carlson, R., (2000a). Formalization and Automation of Time-space Conflict Analysis. STANFORD UNIVERSITY Akinci, B., and Fischer, M., (2000b). ”4D WorkPlanner; A Prototype System for Automated Time-Space Conflicts Analysis.” Proceedings of the ICCCBE-VIII, Stanford, California, August 14-17, 2000, ASCE, 740-751. Akinci, B., Fischer, M., Kunz, J., and Levitt, R., (2000c). Automated Generation of Work Spaces Required by Construction Activities. STANFORD UNIVERSITY Alnuaimi, A. S., and Mohsin, M.A., (2013), Causes of Delay in Completion of Construction Projects in Oman, International Conference on Innovations in Engineering and Technology (ICIET2013) Dec.25-26, 2013 Bangkok (Thailand) Alshawi, M., (1997). SPACE: An Integrated Environment for the Construction Environment. Time Research Institute, Salford University, Salford. Birell, G., (1981). Construction Planning - Beyond the Critical Path. Journal of the Construction Division, ASCE, 106(CO3), 389-407. Bjørnholt, M.,and Farstad, G. R., (2012). ”Am I rambling?’ On the advantages of interviewing couples together” (PDF). Qualitative Research 14 (1): 319. doi:10.1177/1468794112459671 Chavada, R., Dawood, N., Kassem, M., (2012) Construction workspace management: the development and application of a novel planning approach and tool, Journal of Information Technology in Construction (ITcon), Vol. 17, pg. 213 – 236 Choi, B., and Flemming, U., (1996). Adaptation of a Layout Design System to a New Domain: Construction Site Layouts. Computing in Civil Engineering, New York, 711-717. Choi, B., Lee H., Park, M., Cho, Y. K., and Kim, H., (2014) ”Framework for Work-Space Planning Using Four- Dimensional BIM in Construction Projects.” Journal of Construction Engineering and Management September Volume 140.Issue 9: 2. DOI. Web Choo, H. Y., and Tommelein, I. D., (1999). Space Scheduling Using Flow Analysis. IGLC- 7, Berkeley, CA, 299-311.
54

Cohen, D., and Crabtree, B., ”Qualitative Research Guidelines Project.” July 2006. Available from: http://www.qualres.org/HomeSemi-3629.html Conover, D.,and Barnaby, C. S., (2009). An introduction to Building Information Modeling Eastman, C., (1975). Spatial Synthesis in Computer-Aided Building Design, John Wiley and Sons, New York Eastman, C., Teicholz, P., Sacks, R., Liston, K., (2011). BIM Handbook: A Guide to Building Information Modeling for Owners, Managers, Designers, Engineers and Contractors, 2nd Edition. Guo, S., (2002). Identification and Resolution of Work Space Conflicts in Building Construction. Journal of Construction Engineering and Management. DOI: 10.1061/(ASCE)0733- 9364(2002)128:4(287 Halpin, D., and Riggs, L., (1992). Planning and Analysis of Construction Operations, John Wiley and Sons, Inc., New York. Hafey, R., (2014). Building a Safety Culture, Safety Leadership Conference, Indianapolis Hague, M. E., and Rahman, M., (2009). Time-Space- Activity Conflict Detection Using 4D Visualization in Multi-storied Construction Project. IVIC 2009, LNCS 5857, pp. 266278 Howell, G., Laufer, A., and Ballard, G., (1993). Interaction Between Subcycles: One Key to Improved Methods. Journal of Construction Engineering and Management, 119(4), 714-728. Hussain, S.M. Abdul Mannan, Krishna, B.V., and Ranjith, Kumar V, (2014)
Application and analysis of last planner system in the construction industry.
Gitam University, Vol. 2, Issue 6, Jun 2014, 33-44
Kanter, R. M., (1983) The Change Masters: Corporate Entrepreneurs at Work. New York, NY: Simon and Schuster. Kenley, R., and Seppänen, O., (2006) Location- Based Management for Construction: Planning, Scheduling and Control; pg123 Koskela, L., (2009). Lean Construction a Constrictors; Lean Manufacturing Advisor, September 2005: Volume 7, Number 4
55

Latombe, J., (1988). Global Path Planning Approaches for Material Movements in a Worksite. Technical Report 3, Center for Integrated Facility Engineering, Stanford University, Stanford. Line-of-balance, (2010). CPM tutor. Available from: http://www.cpmtutor.com/c02/lineofbalance.html Moon, H., Dawood, N., Kang, L., (2014). Development of workspace conflict visualization system using 4D object of work schedule Morad, A., Cleveland, A., Beliveau, Y., Francisco, V. and Dixit, S. (1992). Path-Finder: AI-based Path Planning System. Journal of Computing in Civil Engineering, 6(2), 114-128. Nathan, P., (1991) Project Planning and Control Systems: An Investigation into their Application and Implications of Usage in the UK Construction Industry. HenleyThe Management College and Brunel University, UK (unpublished dissertation). O’Brien, J. J., (1975). VPM Scheduling for High-Rise Buildings. Journal of the Construction Division, ASCE, 101(CO4), 895-905. Owolabi, J., Amusan, L., (2014). CAUSES AND EFFECT OF DELAY ON PROJECT CONSTRUCTION DELIVERY TIME. International Journal of Education and Research Vol. 2 No. 4 Packendorff, J., (1994) Temporary organizing: Integrating organization theory and project management. In R. A. Lundin and J. Packendorff (eds.) Proceedings of the IRNOP Conference on Temporary Organizations and Project Management, March 22-25, Lycksele, Sweden Ren, J., (2012). Lean Construction Supply Chain. Real Estate Development and Financial Services. Royal Institute of Technology Riley, D., (1994). Modeling the Space Behavior of Construction Activities, Ph.D. Thesis, Department of Architectural Engineering; Pennsylvania State University, University Park. Silva, R. A., (2009). The Literature Review,Conduction Interviews and the Collection of Statistical Information. Available from: http://uir.unisa.ac.za/bitstream/handle/10500/1683/05chapter5.pdf Stradal, O., and Cacha, J., (1982). Time Space Scheduling Method. Journal of the Construction Division, 108(CO3), 445-457.
56

Thabet, W. and Beliveau, Y. (1994). Modeling Work Space to Schedule Repetitive Floors in Multistory Buildings. Journal of Construction Engineering and Management, 120(1), 96-116 Tommelein, I., and Zouein, P., (1993). Interactive Dynamic Layout Planning. Journal of Construction Engineering and Management, 119(2), 266-287. The Last Planner . The Construction Institute. Available from: http://www.leanconstruction.org/training/the-last-planner/ Velasco, A. U., (2013). Assessment of 4D BIM applications for project management functions. Master thesis from the University of Cantabria conducted at the Polytechnic University of Valencia. Vico Software, (2015a). Vico Office Schedule Planner Video Tutorials Vico Software. Available from: http://www.vicosoftware.com/products/schedule-planner/level-2-schedule planner-tutorials/tabid/294674/Default.aspx. [8 July 2015] Vico Software, (2015b). 4D BIM planning, Vico Software. Available from: http://www.vicosoftware.com/products/4d-bim-softwarescheduling/ tabid/229125/Default.aspx. [8 July 2015]. Wiest, J. D., and Levy, F. K., (1969) A Management Guide to PERT/CPM. Englewood Cliffs, NJ: PrenticeHall. Wu, C., Chiu, Y. C.,(2010). 4D Workspace conflict detection and analysis system. In: 10th International Conference on Construction Applications of Virtual Reality. National Kaohsiung University of Applied Sciences. Yamamoto, K., and Wada, K., (1993). Resource Constrained Time-Space Scheduling Model. Proceedings of the 5th International Conference Computing in Civil Engineering, Anaheim, California, 1794-1801. Zouein, P., and Tommelein, I., (1993). Space Schedule Construction Proceedings of the 5th International Conference on Computing in Civil Engineering, ASCE, 1770- 1777.
57