Detailed Windscreen Model for Pedestrian Head Impact€¦ · 2 XX-XX-2009 Name of presenter - short...
30
© 2010 Copyright by DYNAmore GmbH Detailed Windscreen Model for Pedestrian Head Impact G. M. Thompson (Adam Opel GmbH) A. Kilgur (Mira Ltd.) 9. LS-DYNA Forum, Bamberg 2010 Crash I B - I - 1
Transcript of Detailed Windscreen Model for Pedestrian Head Impact€¦ · 2 XX-XX-2009 Name of presenter - short...

© 2010 Copyright by DYNAmore GmbH
Detailed Windscreen Model for Pedestrian Head Impact
G. M. Thompson (Adam Opel GmbH)
A. Kilgur (Mira Ltd.)
9. LS-DYNA Forum, Bamberg 2010 Crash I
B - I - 1

XX-XX-2009 Name of presenter - short title1

www.opel.com
Detailed Windscreen Model for Pedestrian Head Impact
G. M. Thompson (Adam Opel GmbH)
A. Kilgour (Mira Ltd.)
12 October 2010
XX-XX-2009 Name of presenter - short title2

• Pedestrian head impacts on windscreen are a potential source of
pedestrian injury and form part of the EuroNCAP Pedestrian Star Rating.
• Thus, there is a strong wish to increase pedestrian CAE predictive
capability for windscreen impacts and hence create pedestrian safety
measures early in the vehicle development cycle, rather than relying on
expensive and time-consuming hardware testing.
• Existing CAE technology, because of the complex material behaviour
involved, including fracture, did not enable realistic simulation of
windscreen impact.
• This paper describes the development of new CAE techniques and more
realistic material models for windscreens, in order to enable virtual
development of protection measures to reduce pedestrian head impact
injuries.
Summary

• Test at various strain rates 2 constituent parts of windscreen system:
PVB (Poly Vinyl Butyral) foil
adhesive
• Create preliminary CAE material models for each
• Test complete windscreens dynamically at different strain rates
• Correlate windscreen tests & develop preliminary LS-Dyna CAE models for
complete windscreen
• Test pedestrian adult 4.5 kg head v. full vehicles
• Further develop LS-Dyna CAE material models using vehicle tests
Windscreen CAE Model Development

• Windscreen Component Material Tests
Testing performed with representative manufacturing conditions:
Tensile tests to obtain properties for treated PVB (Poly Vinyl Butyral) foil layer
Tensile tests to obtain properties for adhesive (Dow BETASEAL 1849).
• Windscreen Quasi-Static Tests & Photo-Elastic Measurements
Quasi-static test performed on full Vehicle 1 windscreen.
Windscreen mounted on 4 hemispherical posts.
5th hemisphere used to apply load to centre or edge. 3 tests per location.
Strain gauges & photo-elastic coating used to record strain on inner face of
windscreen.
• Windscreen Drop Tests
Dynamic drop tests of windscreen.
Screen bonded to rigid test fixture.
Drop tower used to apply medium-rate loading.
Locations as for quasi-static tests
Hardware Test Series – Vehicle 1 Components

4. Vehicle 1 Windscreen Impact Tests
Head impact tests v. windscreen in Vehicle 1 production vehicle, interior cleared to
avoid 2ndary impact
2 impact locations, each tested 3 times
5. Vehicle 2 Windscreen Impact Tests
Cross check with several impact tests v. windscreen in Vehicle 2 production
vehicle.
Hardware Test Series – Vehicles 1& 2

7
101m
m
12m
m
12mm
R= 12mm
• Unaxial tensile tests performed on treated PVB at 0.33mm/s,
1.6mm/s , 8.33mm/s.
• Force vs strain curves obtained for all 3 tensile test speeds.
test specimen
Windscreen PVB (Poly Vinyl Butyral) FoilMaterial Testing

8
• Preliminary CAE models created to reproduce tests @ 3 speeds
Windscreen PVB (Poly Vinyl Butyral) FoilCAE / Test

• Production line adhesive (Dow BETASEAL 1849) is cold-applied and
takes 24+ hours to cure - not practical to reproduce in R & D project
• Windscreens were bonded into the car using RAC fast cure adhesive
(RAC Driveaway – hot-applied, safe to drive within 1 hour of fitting)
• Cured material property data for adhesives supplied by manufacturers
• Samples supplied by manufacturers for testing
• Adhesive material model built & validated in head impact tests
Windscreen Adhesive Testing & Validation

10
10
1m
m
12
mm
12mm
R= 12mm
• Unaxial tensile tests performed on cured windscreen adhesive at low, medium and high speeds at 0.33mm/s, 1.6mm/s , 8.33mm/s.
• Force vs strain curves obtained for all 3 tensile test speeds.
test specimen
Windscreen Adhesive Material Testing

11
• Preliminary CAE models created to reproduce tests @ 3 speeds
Windscreen Adhesive Material CAE / Test
Test – Low Speed
Test – Med Speed
Test – High Speed
CAE – Low Speed
CAE – Med Speed
CAE – High Speed
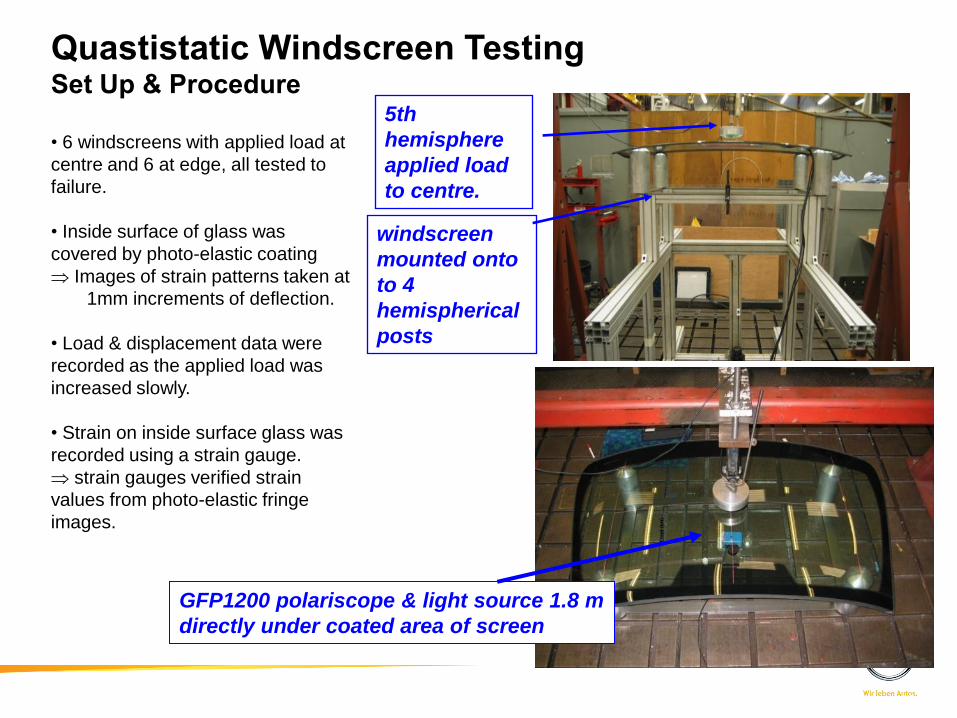
windscreen
mounted onto
to 4
hemispherical
posts
5th
hemisphere
applied load
to centre.
• 6 windscreens with applied load at
centre and 6 at edge, all tested to
failure.
• Inside surface of glass was
covered by photo-elastic coating
Images of strain patterns taken at
1mm increments of deflection.
• Load & displacement data were
recorded as the applied load was
increased slowly.
• Strain on inside surface glass was
recorded using a strain gauge.
strain gauges verified strain
values from photo-elastic fringe
images.
12
Lo
ad
(k
N)
GFP1200 polariscope & light source 1.8 m
directly under coated area of screen
Quastistatic Windscreen Testing Set Up & Procedure

Quasi-static Photo-Elastic Edge Stress Results
Typical EdgeMaster stress results, TOP edge
windscreen
• Rectangle shows area where analysis carried out,
resulting in an average line plot of stress in the glass.
• Results: Edge compression -14.5 MPa,
max. inboard tensile stress 1.5 MPa.
Typical EdgeMaster stress results, LOWER edge
windscreen
• Rectangle shows area where analysis carried out,
resulting in an average line plot of stress in the glass.
• Results: Edge compression -0.5 MPa,
max. inboard tensile stress 2.5 MPa.
Blue edge
compressionMax compressive stress
Max tensile
stress

Quasi-static Photo-Elastic Deflection ResultsTypical central loading results
Typical offset loading results
Windscreen 2: Shear 45 and Shear 0 Strain images at 4mm deflection
Windcreen 6: Shear 45 and Shear 0 Strain images at 10mm deflection
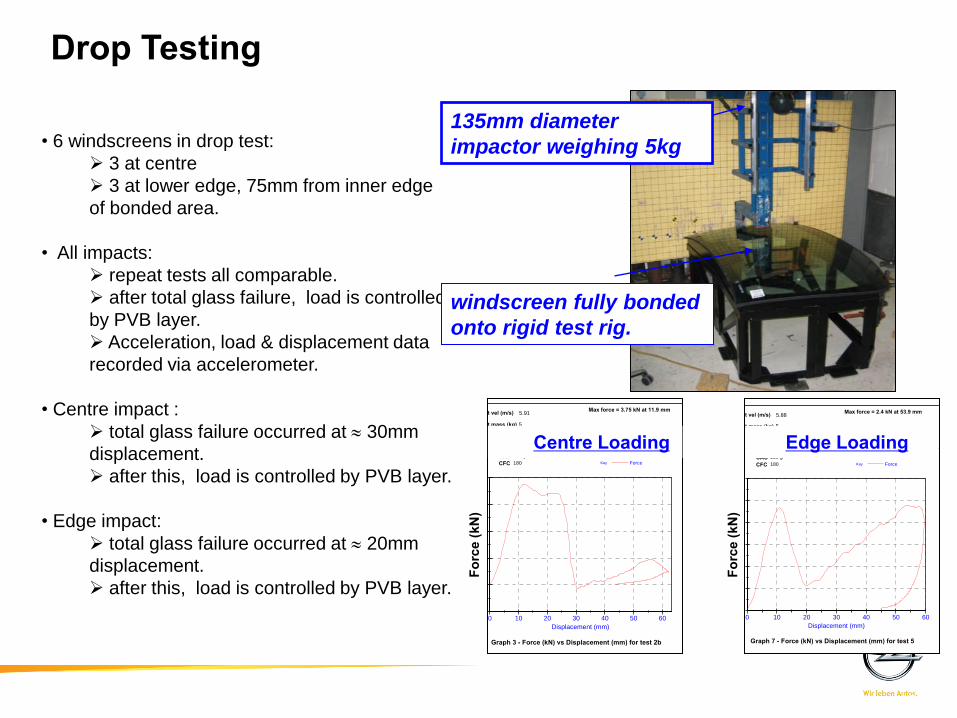
• 6 windscreens in drop test:
3 at centre
3 at lower edge, 75mm from inner edge
of bonded area.
• All impacts:
repeat tests all comparable.
after total glass failure, load is controlled
by PVB layer.
Acceleration, load & displacement data
recorded via accelerometer.
• Centre impact :
total glass failure occurred at 30mm
displacement.
after this, load is controlled by PVB layer.
• Edge impact:
total glass failure occurred at 20mm
displacement.
after this, load is controlled by PVB layer.
15
135mm diameter
impactor weighing 5kg
windscreen fully bonded
onto rigid test rig.
Drop Testing
0 10 20 30 40 50 60
Displacement (mm)
0
0.5
1
1.5
2
2.5
3
Fo
rce
(kN
)
ForceKey
Project No 1016060-005
5
Customer Opel
Test Item: wscreen strength tests
Test Details windscreen edge 5
CAC 250 g
CFC 180
Impact vel (m/s)
Impact.vbs issue 1
Test Date 18/01/2008
1016060-005#5#080118#09-04
Impact mass (kg) 5
5.88
Test No:
Max force = 2.4 kN at 53.9 mm
Graph 7 - Force (kN) vs Displacement (mm) for test 5
Edge Loading
0 10 20 30 40 50 60
Displacement (mm)
-1
0
1
2
3
4
Fo
rce
(kN
)
ForceKey
Project No 1016060-005
2b
Customer Opel
Test Item: ADAM OPEL AG wscreen strength tests
Test Details Windscreen centre 2b
CAC 250 g
CFC 180
Impact vel (m/s)
Impact.vbs issue 1
Test Date 15/01/2008
1016060-005#2b#080115#08-50
Impact mass (kg) 5
5.91
Test No:
Max force = 3.75 kN at 11.9 mm
Graph 3 - Force (kN) vs Displacement (mm) for test 2b
Centre LoadingFo
rce
(kN
)
Forc
e (k
N)

• Dynamic head impacts performed on Vehicle 1 windscreens mounted in-vehicle, setup to
exclude 2ndary impact
• Performed with 4.5kg head @ 40kph, as EuroNCAP
• 2 impact pos: AH2 = windscreen centre AH1 = 200mm inboard from A-pillar
• 3 tests done per impact position
Impact AH1
Impact AH2
AH1
AH2
Windscreen Impact Testing
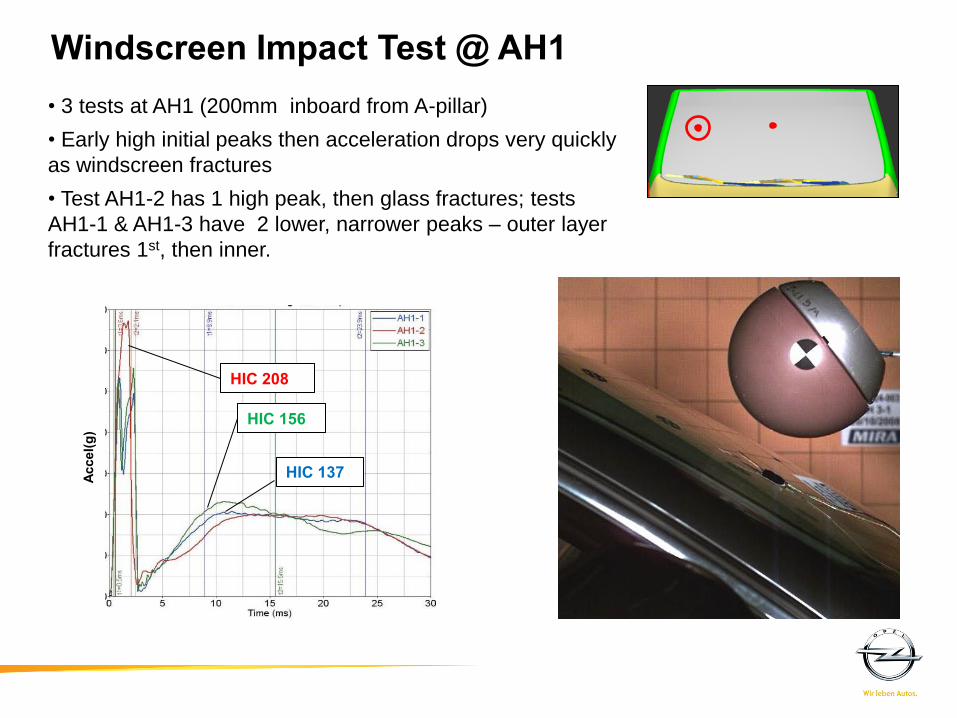
• 3 tests at AH1 (200mm inboard from A-pillar)
• Early high initial peaks then acceleration drops very quickly
as windscreen fractures
• Test AH1-2 has 1 high peak, then glass fractures; tests
AH1-1 & AH1-3 have 2 lower, narrower peaks – outer layer
fractures 1st, then inner.
HIC 137
HIC 208
HIC 156
Windscreen Impact Test @ AH1 Ac
cel(g
)

• 3 tests at AH2 (windscreen centre)
• all 3 tests have 2 early narrow peaks – outer layer
fractures 1st, then inner.
HIC 227 HIC 407
HIC 413
Windscreen Impact Test @ AH2 Ac
cel(g
)

CAE Model for Windscreen Impact

Glass Inner Layer (Brown)MAT110 JOHNSON_HOLMQUIST_CERAMICS
PVB Layer (Dark Pink)MAT181SIMPLIFIED_RUBBERSolid Elements
Glass Outer Layer (Orange-brown)MAT110 JOHNSON_HOLMQUIST_CERAMICSSolid Elements
Adhesive Layer (Blue)MAT181SIMPLIFIED_RUBBERSolid Elements
PVB Null Shells (Light Pink)MAT9 NULL
Windscreen Modelling Details

• Glass and PVB (including Null Shells) joined by equivalent nodes
• Contact between Null Shells modelled as CONTACT_SINGLE_SURFACE
• Adhesive tied to glass using CONTACT_SPOTWELD card
• PVB and adhesive models are hyper-elastic materials with tension and
compression curves specified at various rates.
• Glass parameter values in Johnson_Holmquist material cards are based on
published data from reports. Parameters, especially fracture-related were tuned
v. component & full vehicle tests.
Additional Windscreen Modelling Detail

Acce
l(g)
Radial crack-lines:
important for
fracture
propagation
Tangential crack-
lines: important in
reducing stiffness
of glass in tension
Vehicle 1 (w/o Package)
Dis
plac
emen
t(m
m)

Vehicle 2 (w/o Package)New CAE Method / Traditional Method / Test
0

Vehicle 2 (no 2ndary Impact)
Radial crack-lines:
important for
fracture
propagation
Tangential crack-
lines: important in
reducing stiffness
of glass in tension
Acce
l(g)
Dis
plac
emen
t(m
m)
Acce
l(g)
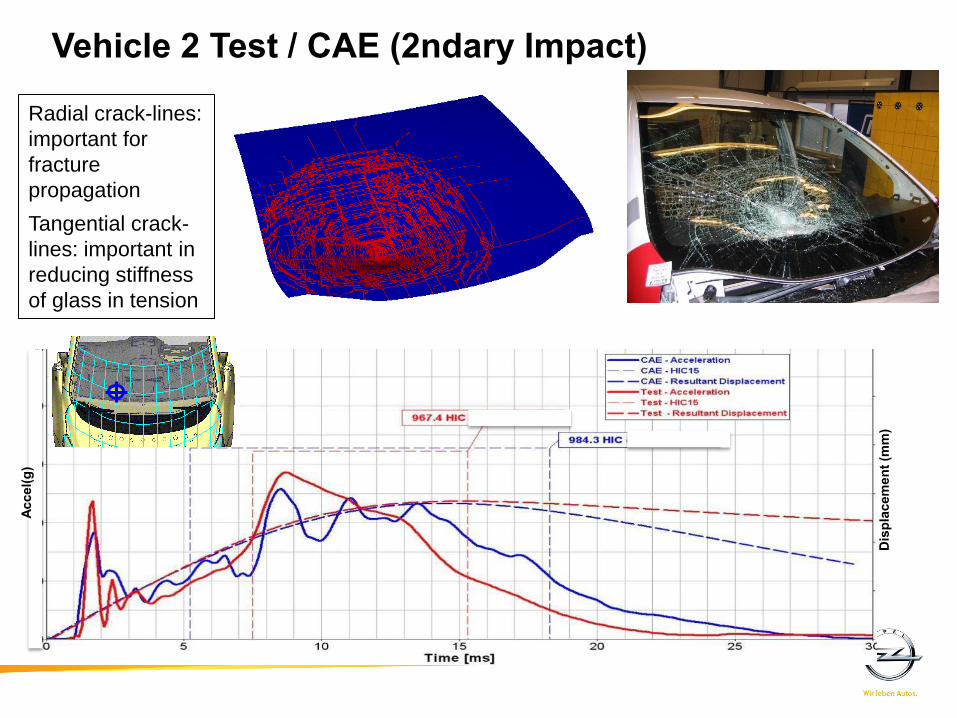
Vehicle 2 Test / CAE (2ndary Impact)
Radial crack-lines:
important for
fracture
propagation
Tangential crack-
lines: important in
reducing stiffness
of glass in tension
Dis
plac
emen
t(m
m)

Acce
l(g)
Radial crack-lines:
important for
fracture
propagation
Tangential crack-
lines: important in
reducing stiffness
of glass in tension
Vehicle 2 Test / CAE (2ndary Impact)
Dis
plac
emen
t(m
m)

Edge stresses added for both inner & outer glass layers
Edge effects were NOT significant for acceleration Good for predictive quality
Effect of Edge Stresses: CAE with / CAE Without Edge Stresses
Acce
l(g)

Summary PVB coupon model
Adhesive model
Windscreen model for quasi-static tests
Quasi-static windscreen model for drop test
Technique developed to input photo-elastic output as pre-stressing into windscreen (dyna_in file)
Option of Vehicle 1 pre-stress test / CAE data to pre-condition windscreen for impact simulation
Added parameters from windscreen manufacturing process to model
Investigated mesh size sensitivity – refined initial mesh x 4, x 16
Final Correlation Head Impacts v. Windscreen Optimum “3-layer” methodology for inner glass, PVB, outer glass developed
Optimum mesh size determined for all 3 windscreen layers and adhesive
Optimum element type , HG, # integration pts determined – solids for all layers
Optimum static & dynamic friction values determined
Realistic “fracture lines” radially & tangentially
Optimum material laws determined for PVB and Adhesive (MAT181 simplfied rubber ) and
inner & outer glass layers (MAT110 MAT_JOHNSON_ HOLMQUIST_ CERAMICS), – also tried
but not as good: MAT24, MAT 17 (ORIENTED_CRACK), MAT_BRITTLE_DAMAGE .....
Material parameters tuned for test correlation
Effect of pre-stressing assessed - found to be small

XX-XX-2009 Name of presenter - short title29