Detailed technical report of data used in the development ...
33
Detailed technical report of data used in the development of the updated targets Submitted by the WHO Collaborating Centre on Nutrition Policy for Chronic Disease Prevention and the Department of Nutritional Sciences at the University of Toronto, Ontario Tech University, and the Costa Rican Institute of Research and Teaching in Nutrition and Health (INCIENSA) February 19, 2021 Updated PAHO Regional Sodium Reduction Targets (2021–2025)
Transcript of Detailed technical report of data used in the development ...

Detailed technical report of data used in the development of the updated targets
Submitted by the WHO Collaborating Centre on Nutrition Policy for Chronic Disease Prevention and the Department of
Nutritional Sciences at the University of Toronto, Ontario Tech University, and the Costa Rican Institute of Research and
Teaching in Nutrition and Health (INCIENSA)
February 19, 2021
Updated PAHO Regional Sodium Reduction Targets (2021–2025)

V. February 19, 2021
Part 1: Data to preferentially consider is from BASELINE, which is 2015.
14 country study (Arcand et al. Nutrients 2019)Countries included:ArgentinaBrazilChileCosta RicaCubaEcuadorGuatemalaJamaicaMexicoPanamaParaguayPeruTrinidad and TobagoBarbados
ADDITIONAL DATA2013 Canadian Data from FLIP (Arcand et al. APNM, 2016) Canadian data is a combination of FLIP 2013 and FLIP 20172013 US Data (Ahuja et al. Prev Med Reports, 2015) Other country data from the region, e.g. Colombiamg/kcal data, retrieved from the Food Label Information Program (FLIP) database, University of Toronto, Canada.
Part 2: Data to Compare Calculated Estimates and Inform Feasibility Categories and Subcategories are not exactly matched due to differences in the categorization method in different targetsUK Targets https://assets.publishing.service.gov.uk/government/uploads/system/uploads/attachment_data/file/604338/Salt_reduction_targets_for_2017.pdf
FDA Proposed Targets @ 10 years (the most stringent); https://www.fda.gov/media/98264/download% products meeting targets for different food categoriesMember state national targets - Min, Median, Max See Appendix 3aFOP targets See Appendix 3bWHO Global benchmarksApproach1. All the category data as described above were consolidated into the respective category tab.
2. Using the mg/100g and mg/kcal sodium monitoring data, for each food category, the mean of the Means, Minimums, 25th percentiles, Medians (50th percentiles), 75th percentiles, and Maximums were calculated- Each country's data was weighted equally
3. The monitoring data (mean of the 25th percentiles, medians, and 75th percentiles) were entered into the summary table for comparisons (with national targets, FOP thresholds, etc.) and feasibility estimates.
METHODOLOGY:
- When appropriate, a weighted mean was calculated for an individual country, which was then given an overall weight of 1 within that food category, e.g., to calculate the Canadian data for canned vegetables, the weighted mean of canned beans, canned tomatoes, etc., was calculated, then that weighted mean was given an overall weight of 1 when combined with other country data, which also were given a weight of 1.
7. There were three primary criteria used in considering the expansion of food categories and subcategories: 1) A food category is documented as a significant source of dietary sodium in several of the countries within the region, or 2) Stakeholders requested the inclusion of food category of national relevance to dietary sodium intakes, based on stakeholder consultation, or 3) More than two countries had national-level targets for a given food category. Additionally, some existing food categories were split into multiple subcategories to increase specificity, where sufficient data was available to support the development of sodium targets for more refined sodium subcategories.
4. To set sodium targets for new and revised food subcategories based on mg/100 g, a 15% and 30% reduction was set for 2022 and 2025, respectively, from the measured levels of sodium at the 50th percentile from the baseline data in Part 1. If the calculated value for 2025 (30% reduction) was below the 25th percentile, the 25th percentile was used as the 2025 Target. All calculated targets were assessed for feasibility, and adjusted accordingly, by comparing the calculated values to national targets in the region, to the United Kingdom targets, and to the 25th percentile which gave an indication of the overall distribution of sodium in a food subcategory. The feasibility assessment also included the known proportion of foods meeting the 2015 PAHO Sodium Targets.
5. The TAG Target-setting Subgroup recommended setting a new additional and complementary set of targets based on the sodium content per calorie (mg/100 kcal). This approach aligns with the PAHO Nutrient Profile Model, which has a threshold of < 1.0 mg sodium/kcal. To set these targets, data on the distribution of sodium mg/kcal were available and used from five countries: Argentina, Canada, Costa Rica, Paraguay, and Peru. T t di t t f ll d i d f d b t i b d /100 k l 15% d 30% d ti t f 2022 d 2025 ti l f th d l l f di t th 50th til If th l l t d l 6. For foods, where the calculated 2025 sodium target exceeded >3.0 mg/kcal, these foods were identified and highlighted in red. These food subcategories should be consumed less frequently or sodium-reduced versions of these
products be considered, as these foods were considered to have attributes or processing implications that would make it very difficult to reformulate to sufficiently lower levels of sodium.

V. February 19, 2021
References
16. Barquera S, Tolentino-Mayo et al. Base de datos de alimentos mexicanos. Not yet published. January-December. 2017.
- For new subcategories for consideration, the overall data is an amalgamation of the new subcategories For consideration data only, not all subcategories typically found within that food category, e.g. fish and seafood data overall includes only new subcategory data, and not data from other fish and seafood categories such as imitation seafood or fish/seafood mousse. A49
3. Public Health England. Salt Reduction Targets for 2024; 2020. Available from: https://assets.publishing.service.gov.uk/government/uploads/system/uploads/attachment_data/file/915406/2024_salt_reduction_targets_070920-FINAL-1.pdf [Accessed 2 October 2020].
1. Arcand J, Blanco-Metzler A, Benavides Aguilar K, L'Abbe MR, Legetic B. Sodium Levels in Packaged Foods Sold in 14 Latin American and Caribbean Countries: A Food Label Analysis. Nutrients. 2019;11(2).
2. Food and Drug Administration. Draft Guidance for Industry: Target Mean and Upper Bound Concentrations for Sodium in Commercially Processed, Packaged, and Prepared Foods for Voluntary Sodium Reduction Goals. Available at: https://www.fda.gov/regulatory-information/search-fda-guidance-documents/draft-guidance-industry-target-mean-and-upper-bound-concentrations-sodium-commercially-processed [Accessed July 2020].
15. Mora-Plazas M, Gomez LF, Miles DR, Parra DC, Taillie LS. Nutrition Quality of Packaged Foods in Bogota, Colombia: A Comparison of Two Nutrient Profile Models. Nutrients. 2019;11(5).
4. Public Health England. Salt targets 2017: Second progress report; 2020. Available from: https://assets.publishing.service.gov.uk/government/uploads/system/uploads/attachment_data/file/915371/Salt_targets_2017_Second_progress_report_031020.pdf [Accessed 2 October 2020].
5. Arcand J, Jefferson K, Schermel A, et al. Examination of food industry progress in reducing the sodium content of packaged foods in Canada: 2010 to 2013. Applied Physiology, Nutrition, and Metabolism. 2016;41(6):684-690.
6. Ahuja JK, Wasswa-Kintu S, Haytowitz DB, Daniel M, Thomas R, Showell B, et al. Sodium content of popular commercially processed and restaurant foods in the United States. Prev Med Rep. 2015;2:962-7.
7. Blanco-Metzler A, Franco-Arellano B, Vega-Solano J, Allemandi L, Sequera G, Saavedra L, et al. A comparative analysis of the proportion of commonly consumed packaged foods meeting regional sodium targets in four Latin American countries between 2015 and 2018. Not yet published.
8. Vega-Solano J, Blanco-Metzler A, Benavides-Aguilar KF, Arcand J. An Evaluation of the Sodium Content and Compliance with the National Sodium Reduction Targets among Packaged Foods Sold in Costa Rica in 2015 and 2018. Nutrients. 2019;11(9).
9. Nilson EAF, Spaniol AM, Goncalves VSS, Moura I, Silva SA, L'Abbe M, et al. Sodium Reduction in Processed Foods in Brazil: Analysis of Food Categories and Voluntary Targets from 2011 to 2017. Nutrients. 2017;9(7).
10. Christoforou A, L’Abbe M. Sodium levels in packaged foods sold in Canada in 2017. Internal data; Not yet published.
11. Ahuja JKC, Li Y, Haytowitz DB, Bahadur R, Pehrsson PR, Cogswell ME. Assessing Changes in Sodium Content of Selected Popular Commercially Processed and Restaurant Foods: Results from the USDA: CDC Sentinel Foods Surveillance Program. Nutrients. 2019;11(8).
12. Nieto C, Tolentino-Mayo L, Medina C, Monterrubio-Flores E, Denova-Gutierrez E, Barquera S. Sodium Content of Processed Foods Available in the Mexican Market. Nutrients. 2018;10(12).
13. Allemandi L, Tiscornia MV, Guarnieri L, Castronuovo L, Martins E. Monitoring Sodium Content in Processed Foods in Argentina 2017-2018: Compliance with National Legislation and Regional Targets. Nutrients. 2019;11(7).
14. Health Canada. Sodium Reduction in Processed Foods in Canada: An evaluation of Progress Toward Voluntary Targets from 2012 to 2016. In: Canada H, editor. Ottawa ON Canada. 2018.

V. February 19, 2021
Food Categories for the Updated PAHO Regional Sodium Reduction Targets:1. Bread, bread products, and crisp breads
1a. Pantry and hearth breads, rolls, and buns 1b. Tortillas (wheat), wraps, naan, and roti1c. Bread with additions 1d. Other bread products
2. Cakes, biscuits, pastries, and sweet breads2a. Savory biscuits and crackers2b. Cookies and sweet biscuits2c. Pastries, squares, and quick/sweet breads2d. Cakes
3. Corn derivatives3a. Tortillas (corn)3b. Biscuits (bizcochos)3c. Tostadas3d. Arepas
4. Breakfast cereal4a. Ready to eat and hot instant breakfast cereal
5. Savory snacks5a. Nuts, seeds, and kernels, seasoned and candied5b. Chips, popcorn, and/or extruded snacks5c. Pretzels and snack mixes5d. Other savory snacks
6. Cheese6a. Fresh cheese (fresh mozzarella and others)6b. Soft cheese (unripened goat cheese and cream cheese) 6c. Semi-hard cheese (mozzarella, cheddar and others) 6d. Hard cheese, grated and ungrated6e. Processed cheese
7. Processed vegetables, beans, and legumes7a. Tomato paste with additions7b. Canned vegetables 7c. Canned beans, chickpeas, and lentils 7d. Baked and refried beans (mashed)

V. February 19, 2021
7e. Frozen potatoes and similar products7f. Dry mashed or scalloped potatoes (as consumed)7g. Pickled vegetables7h. Sundried tomatoes7i. Olives 7j. Vegetable juice
8. Processed meat and poultry8a. Packaged deli meats – fully cooked8b. Packaged dry-cured deli meats – dry cured, fermented, no thermal process 8c. Sausages – uncooked8d. Sausages – cooked8e. Uncooked bacon – belly8f. Burgers, meatballs, meatloaf, and breaded meat and poultry8g. Ham, canned meat and poultry, and uncooked, pickled, cured, and smoked meats that are not deli meats 8h. Patés and meat spreads
9. Processed fish and seafood9a. Canned fish9b. Frozen plain fish and seafood with added sodium phosphate9c. Fish and seafood cakes, fingers or burgers, seasoned, and breaded or battered or with sauces9d. Smoked, salted, pickled, and kippered fish
10. Soy products and meat alternatives10a. Seasoned tofu and tempeh10b. Meat analogues and other meat alternatives
11. Soups11a. Wet and dry soups (as consumed)11b. Noodles in broth (as consumed)
12. Ready-made foods, convenience foods, and mixed dishes12a. Canned chili 12b. Canned stew and meatballs

V. February 19, 2021
12c.
Pasta, noodles, and rice or grains with sauce or seasonings (as consumed)
12d.
Pasta, noodles, and rice or grains with sauce or seasonings (as sold)
12e. Stuffing mixes (as consumed)12f. Pizza and pizza snacks 12g. Sandwiches12h. Refrigerated or frozen appetizers, sides and entrées
13. Fresh or dried plain pasta and noodles13a. Plain pasta and noodles (as consumed or dry, uncooked)
14. Granola and energy bars, and nut butters/spreads14a. Granola, cereal, and energy bars14b. Nut butters and nut spreads
15. Fats and oils15a. Salted butter, margarine, and butter blends15b. Mayonnaise15c. Salad dressing and vinaigrette
16. Sauces, dips, gravy, and condiments16a. Bouillon cubes and powders (as sold)16b. Pasta sauce16c. Pesto16d. Tomato sauce 16e. Ketchup, and similar tomato-type condiments (as consumed)16f. Mustard16g. Spicy sauce

V. February 19, 2021
16h. Gravy, cooking sauces, dips, and salsa (as consumed)16i. Sweet oriental sauces16j. Soya and other salty oriental sauces16k. Marinades (as consumed)16l. Dry seasoning mixes for rice and side dishes 16m. Dry seasoning mixes for meat and fish

V. February 19, 2021
Table 1.1 Bread, bread products, and crisp breads – Updated food subcategories and sodium reduction targets
US–FDAProposed 10-year Targets
(2026)[2]2024 [3] 2017 [3]
UK 2017 Targets met [4]
Min Median Max
1a
- - Maximum 435 405 450 95% f 286 500 600 300 400 500
- - Target 300 340 360 Yes g 330 360 470340 280 1.2 1.0
1b- - Maximum 700 405 450 95% f 540 545 550 300 400 500
- - Target 410 340 360 Yes g 760 760 760550 450 1.8 1.7
1c- - Maximum 600 430 450 93% f - 550 - 300 400 500
- - Target 420 360 400 - - - -420 350 1.5 1.2
1d
- - Maximum 463 410 438 90% f 286 503 860 300 400 500
- - Target 313 341 375 - 250 470 550
400 350 1.3 1.1
Table 1.2 Summary of existing bread products (overall) sodium reduction targets and front-of-package label (FOPL) thresholds
US - FDA
Proposed 10-year Targets
(2026)[2]2024 [3] 2017 [3]
UK 2017 Targets Met
[4]Min Median Max
600 83% Maximum 463 410 438 95% f 286 512 860 300 400 500400 34% Target 313 341 375 Yes g 250 470 550
Table 1.3 Sodium content for bread (overall) – mg/100 gAverage Sodium
(mg/100g) Min 10th 25th 50th 75th Max2015 123 208 ± 146 452 ± 255 0 81 279 480 609 12002015 101 198 ± 51 417 ± 128 168 270 326 414 484 8472015 106 227 ± 89 428 ± 140 7 272 365 413 491 9842015 83 232 ± 251 435 ± 314 0 0 215 473 591 12402015 24 312 ± 137 542 ± 76 381 473 479 528 601 6962015 106 192 ± 136 421 ± 200 0 123 329 427 520 10232015 68 201 ± 159 519 ± 702 0 38 281 457 540 44442015 72 257 ± 160 465 ± 137 0 298 415 481 516 9692015 112 167 ± 122 603 ± 448 0 317 376 475 728 40002015 137 178 ± 98 531 ± 221 10 320 440 500 610 12702015 76 165 ± 78 398 ± 199 0 86 299 439 536 9132015 68 286 ± 281 503 ± 249 1 222 404 486 590 13002015 95 226 ± 138 421 ± 171 0 202 350 450 510 10002015 100 211 ± 106 403 ± 134 0 227 343 410 461 7402013 445 242 ± 100 418 ± 129 0 267 351 413 507 782
2013 80 253 ± 4.2c 490 ± 10c 11 - - - - 818222 465 36 213 350 456 553 1389
Table 1.4 Sodium content for proposed bread, bread products, and crisp breads subcategories – mg/100 gAverage Sodium
(mg/100g) Min 10th 25th 50th 75th Max
2018 33 - 291 ± 242 0 - - 291 - 9362017 21 - 482 401 - - - - 5542017 23 - 440 15 - 67 500 783 7832013 248 248 436 59 304 380 442 514 660
2017 11 - 374 ± 59 270 - - 372 - 512
248 405 149 304 224 401 649 689
2013 63 378 ± 132 647 ± 138 246 441 588 680 750 8812017 16 - 712 ± 105 531 - - - - 873
378 ± 132 680 389 441 588 680 750 877
2013 36 288 ± 98 530 ± 141 18 360 464 553 604 7822018 6 130 ± 121 294 ± 258 0 - 0 403 480 4802018 3 125 ± 69 639 ± 186 528 - 528 534 854 854
181 488 182 360 331 497 646 705
Current Regional TargetsMean Sodium Content of Foods in the
Americas (mg/100 g)b Sodium Targets (mg/100 g)Mean Sodium Content of Foods in the
Americas (mg/kcal)b
2025 25th Percentile Median
Sodium Targets (mg/kcal) WHO Global Benchmark National Sodium Reduction Targets (mg/100 g)c FOPL Thresholds (mg/100 g)e
2015 PAHO Targets
(mg/100 g)
2015 Targets met [1] a
25th Percentile
Median75th
Percentile 2022
United Kingdom Member State Targetsd
Min Median MaxCountries with Targets
75th Percentile 2022 2025
mg/100 g
Pantry and hearth breads, rolls, and buns (Data from 2013, 2017, 2018) (Data from 2017, 2018)
Regional Target224 401 649 341 281 Argentina, Brazil, Canada, Chile, Colombia, Costa
Rica, Mexico, Paraguay, USALower Target
Updated Targets
Tortillas (wheat), wraps, naan, and roti (Data from 2013, 2017) (Data from 2017)
1.0 1.5 1.9 1.2 1.0330
Canada, USALower Target
Updated Targets
1.7 1.8 2.0 1.5 1.3Regional Target
588 680 750 578 476320
Bread with additions (Data from 2017) (Data from 2017, 2018)
Regional Target331 497 646 422 348 Costa Rica
Lower Target
Updated Targets
Other bread productsh (Data from 2013, 2015) (Data from 2017, 2018)
1.1 1.7 2.1 1.5 1.2N/A
(For bread, overall) Argentina, Brazil, Canada, Chile, Colombia, Costa Rica, Mexico, Paraguay,
USALower Target
Updated Targets
0.8 1.6 1.9 1.3 1.1Regional Target
350 456 553 388 319N/A
United Kingdom Member State Targetsd
Min Median Max
Bread products (overall) (Data from 2013, 2015) (Data from 2017, 2018)
25th Percentile
Median75th
Percentile25th
PercentileMedian 75th Percentile
Current Regional TargetsMean Sodium Content of Foods in the Americas b
National Sodium Reduction Targets (mg/100 g)c FOPL Thresholds (mg/100 g)e
mg/100 g mg/kcal
2015 PAHO Targets
(mg/100 g)
2015 Targets met [1] a
1.9Lower Target
a Proportion of products in 14-country study [1] meeting PAHO Regional Sodium Reduction Targets; b Mean sodium content calculated from available national sodium monitoring data (Tables 1.3 and 1.5); c Calculated as the average of relevant subcategories; d Data extracted from latest approved national sodium targets in Appendix 3a and may illustrate distinct subcategory targets; e Data extracted from final (proposed, accepted or implemented) Front-of-Package "high in" or "excess" sodium thresholds for prepackaged foods in Appendix 3b; f Proportion of products at or below maximum; g Is proportion of products in 2018 at or below maximum within 5% of average sodium target ("target").
Year nAverage Sodium
(mg/serving)
Sodium Percentiles (mg/100g)
Regional Target350 456 553 0.8 1.6
GuatemalaJamaicaMexicoPanamaParaguayPeru
ArgentinaBrazilChileCosta RicaCubaEcuador
Year nAverage Sodium
(mg/serving
Sodium Percentiles (mg/100g)
Pantry and hearth breads, rolls, and buns
Trinidad and TobagoBarbados
Canada [5]a
United States [6]b
MEAN
All data was from Arcand J et al. Nutrients (2019) and represents 2015 data, unless otherwise indicated; Data presented as mean ± standard deviation. a Packaged bread products; b Bread, rolls, tortillas; c Data presented as standard error of the mean.
Tortillas (wheat), wraps, naan, and rotiCanada [5]United States (SWA)[11]MEAN
Bread with additionsf
Canada [5]
Costa Rica [8]a
United States (SWA)[11]b
Argentina [13]c
Canada [5]d
Brazil [9]e
MEAN
Costa RicaParaguayMEAN
Data presented as mean ± standard deviation. Sales weighted average (SWA). a Wholemeal bread; b Data was calculated as the weighted average of wheat bread, White bread and hamburger buns subcategories; c Toast; d Data was calculated as the weighted average of pantry bread, hearth bread, and pantry rolls and buns subcategories; e Buns; f Data acquired from the Food Label Information Program (FLIP) database for packaged food and beverage items for the corresponding country (unpublished), unless otherwise specified.
a Proportion of products in 14-country study [1] meeting PAHO Regional sodium reduction targets; b Mean sodium content calculated from available national sodium monitoring data (Tables 1.3 to 1.6); c Calculated as the average of relevant subcategories; d Data extracted from latest approved national sodium targets in Appendix 3a and may illustrate distinct subcategory targets; e Data extracted from final (proposed, accepted or implemented) Front-of-package label "high in" or "excess" sodium thresholds for prepackaged foods in Appendix 3b; f Proportion of products at or below maximum; g Is proportion of products in 2018 at or below maximum within 5% of average sodium target ("target"); h Data for other bread products is a composite of data for bread (overall) (see Table 1.2).

V. February 19, 2021
Table 1.5 Sodium content for bread – mg/kcal
Min 25th 50th 75th Max2018 110 1.8 ± 0.5 0.0 1.6 1.8 1.9 3.9
2018 100 1.3 ± 0.8 0.0 0.6 1.5 1.9 2.9
2018 75 1.4 ± 0.8 0.0 0.3 1.6 2.0 2.8
2018 27 1.1 ± 0.7 0.0 0.4 1.3 1.6 2.0
2017 651 1.7 ± 0.5 0.0 1.3 1.6 2.0 3.81.5 0.0 0.8 1.6 1.9 3.1
Table 1.6 Sodium content for proposed bread, bread products, and crisp breads subcategories – mg/kcal
Min 25th 50th 75th Max
2018 110 1.8 0.2 1.5 1.8 1.9 3.82018 100 1.3 0.0 0.8 1.2 1.9 2.92018 74 1.3 0.0 0.6 1.6 2.0 2.42018 24 1.0 0.0 0.8 1.1 1.6 1.92017 456 1.7 0.3 1.4 1.7 2.0 3.5
1.4 0.1 1.0 1.5 1.9 2.9
2017 62 1.7 ± 0.6 0.0 1.7 1.8 2.0 3.21.7 ± 0.6 0.0 1.7 1.8 2.0 3.2
2017 129 1.9 ± 0.5 0.0 1.5 1.9 2.2 3.82018 3 1.1 ± 1.0 0.0 0 1.5 1.9 1.92018 3 1.9 ± 0.2 1.7 1.7 1.8 2.2 2.2
1.6 0.6 1.1 1.7 2.1 2.6
Year nAverage Sodium
(mg/kcal)
Sodium Percentiles (mg/kcal) Proportion below PAHO Nutrient Profile Model
threshold
0%Canada 7.1%
MEAN N/A
Argentina 6.4%
Costa Rica 30%Paraguay 32%
Costa RicaParaguayMEANAll data acquired from the Food Label Information Program (FLIP) database for packaged food and beverage items for the corresponding country; Data presented as mean ± standard deviation. a Data for Argentina, Costa Rica, Paraguay, and Peru calculated as the weighted average of brown bread and white bread subcategories, and Canadian data was calculated as the weighted average of pantry bread, pantry rolls and buns, and hearth bread subcategories; b Also includes taco shells.
MEAN
Tortillas (wheat), wraps, naan, and rotiCanadab
MEAN
Bread with additions Canada
Pantry and hearth breads, rolls, and bunsArgentinaCosta RicaParaguayPeruCanada
All data acquired from the Food Label Information Program (FLIP) database for packaged food and beverage items for the corresponding country; Data presented as mean ± standard deviation. a
Products evaluated against the 2016 PAHO Nutrient Profile Model threshold for excess sodium (1 mg/kcal) included only products classified as processed or ultra-processed.
Year nAverage Sodium
(mg/kcal)
Sodium Percentiles (mg/kcal)
Peru

V. February 19, 2021
US–FDA
Proposed 10-year Targets
(2026)[2]2024 [3] 2017 [3]
UK 2017 Targets met [4]
Min Median Max
2a1340 97% Maximum 760 700 700 66% f 635 890 1340 300 400 500
700 59% Target 500 520 520 N/A 600 620 640
640 580 1.5 1.3
2b485 90% Maximum 330 340 380 93% f 265 405 485 300 400 500
265 48% Target 220 220 220 No g 240 250 260
225 200 0.5 0.4
2c- - Maximum 302 276 290 85% f 400 488 790 300 400 500
- - Target 208 221 245 N/A 220 250 530260 215 0.7 0.6
2d400 64% Maximum 270h 265 280 94% f 204 332 512 300 400 500
205 25% Target 180h 160 170 N/A 230 240 250
300 240 0.7 0.6
Average Sodium
(mg/100g) Min 10th 25th 50th 75th Max2018 25 - 852 ± 304 0 - 643 859 1124 12372018 84 - 710 ± 227 5 - 563 719 864 14332018 24 - 627 ± 361 0 - 520 600 664 20002018 2 - 700 ± 141 600 - 650 700 750 8002013 301 155 ± 80 739 ± 316 0 375 525 700 900 18572013 24 128 834 638 - - - - 1110
142 744 207 375 580 716 860 1406
Average Sodium
(mg/100g) Min 10th 25th 50th 75th Max2018 161 - 269 ± 155 0 - - 267 - 12502017 237 - 249 46 - - 255 - 4702018 112 - 277 ± 336 9 - - 250 - 34192013 398 84 ± 47 277 ± 128 0.4 100 185 286 360 667
84 ± 47 268 14 100 185 265 360 1452
Table 2.4 Sodium content for pastries, squares, and quick/sweet breads – mg/100 gAverage Sodium
(mg/100g) Min 10th 25th 50th 75th Max
2018 3 - 166 ± 233 0 - - 66 - 4322013 311 221 310 32 161 215 310 384 939
221 309 32 161 215 308 384 934
Average Sodium
(mg/100g) Min 10th 25th 50th 75th Max2015 127 146 ± 91 323 ± 204 3 81 214 260 435 8202015 154 133 ± 53 324 ± 153 55 144 200 315 443 8602015 157 149 ± 110 231 ± 180 21 73 113 183 313 14602015 117 180 ± 114 385 ± 244 22 132 195 297 572 9712015 8 65 ± 31 225 ± 84 75 132 198 214 303 3202015 135 192 ± 230 331 ± 333 0 50 148 258 430 27432015 96 212 ± 115 470 ± 273 22 165 253 402 701 14832015 75 302 ± 93 540 ± 224 125 267 330 595 721 9472015 121 171 ± 132 369 ± 232 0 143 238 324 438 13712015 129 222 ± 121 405 ± 235 0 124 270 380 530 11302015 35 198 ± 92 472 ± 176 120 200 368 496 577 7652015 33 172 ± 134 425 ± 301 0 104 200 677 104 1465
2015 127 240 ± 102 433 ± 255 80 190 260 330 660 15802015 129 235 ± 96 505 ± 258 40 200 300 420 720 1250
187 388 40 143 235 368 496 1226
Table 2.1 Cakes, biscuits, pastries, sweet breads – Updated food subcategories and sodium reduction targetsCurrent Regional
TargetsMean Sodium Content of foods in the
Americas (mg/100 g)b Sodium Targets (mg/100 g)Mean Sodium Content of Foods in the
Americas (mg/kcal)b Sodium Targets (mg/kcal) WHO National Sodium Reduction Targets (mg/100 g)c
Median
FOPL Thresholds (mg/100 g)e
2015 PAHO Targets
(mg/100 g)
2015 Targets met [1] a 25th Percentile Median 75th Percentile 2022 2025 25th Percentile
United Kingdom Member State Targetsd
Min Median MaxCountries with Targets
75th Percentile 2022 2025
Savoury biscuits and crackers (Data from 2017) (Data from 2017, 2018)
mg/100 g
1.3 1.7 2.0 1.4 1.2600
Argentina, Brazil, Canada, Costa Rica, USALower Target
Updated Targets
0.4 0.6 0.8 0.5 0.4
Regional Target580 716 860 608 501 Argentina, Brazil, Canada,
Colombia, Costa RicaLower Target
Updated Targets
Pastries, squares, and quick/sweet breads (Data from 2013, 2018) (Data from 2017)
265
Regional Target215 308 384 262 215
Regional Target185 265 360 225 185
Cookies and sweet biscuits (Data from 2013, 2017) (Data from 2017, 2018)
Colombia, Costa Rica, Canada, USALower Target
Updated Targets
0.6 0.8 1.1 0.7 0.6475
Cakes (as consumed) (Data from 2013, 2015) (Data from 2017, 2018)
Regional Target235 368 496 313 258
a Proportion of products in 14-country study [1] meeting PAHO Regional Sodium Reduction Targets; b Mean sodium content calculated from available national sodium monitoring data (Tables 2.2 to 2.6); c Calculated as the average of relevant subcategories; d Data extracted from latest approved national sodium targets in Appendix 3a and may illustrate distinct subcategory targets; e Data extracted from final (proposed, accepted, or implemented) Front-of-package "high in" or "excess" sodium thresholds for prepackaged foods in Appendix 3b; f Average proportion of products at or below maximum; g Is proportion of products in 2018 at or below maximum within 5% of average sodium target ("target"); h Excludes cheesecake.
Table 2.2 Sodium content for savory biscuits and crackers – mg/100 g
Year nAverage Sodium
(mg/serving
Sodium Percentiles (mg/100g)
Brazil, Canada, Costa Rica, USA, USALower Target
Updated Targets
0.6 0.9 1.2 0.7 0.6205
MEAN
Data presented as mean ± standard deviation. a Crackers; b Data was calculated as the weighted average of crackers, Ritz-type, and crackers, saltine subcategories.
Table 2.3 Sodium content for cookies and sweet biscuits – mg/100 g
Year nAverage Sodium
(mg/serving
Sodium Percentiles (mg/100g)
Argentina [7]Costa Rica [7]Paraguay [7]Peru [7]
Canada [5]a
United States [6]b
Year nAverage Sodium
(mg/serving
Sodium Percentiles (mg/100g)
Pastries and quick/sweet bread
Costa Rica [8]a
Brazil [9]b
Costa Rica [8]c
Canada [5]d
MEAN
Data presented as mean ± standard deviation. a Dry sweet cookies; b Data was calculated as the weighted average of sweet biscuits and filled sweet cookies subcategories; c Filled sweet cookies; d
Cookies.
Costa Rica [8]
Canada [5]a
OVERALL WEIGHTED MEANb
Data presented as mean ± standard deviation. Sales weighted average (SWA). a Data calculated as the weighted average of baked desserts, tea biscuits and scones, and toaster pastry subcategories; b
Overall mean calculated as the weighted mean due to the large discreptancy in product numbers between countries.
Table 2.5 Sodium content for cakes (as consumed) – mg/100 g
Year nAverage Sodium
(mg/serving)
Sodium Percentiles (mg/100g)
GuatemalaJamaicaMexicoPanamaParaguayPeru
ArgentinaBrazilChileCosta RicaCubaEcuador
Trinidad and Tobago
BarbadosMEANAll data was from Arcand J et al. Nutrients (2019) and represents 2015 data, unless otherwise indicated; Data presented as mean ± standard deviation.

V. February 19, 2021
Table 2.6 Sodium content for proposed cakes, biscuits, pastries, and sweet breads subcategories – mg/kcal
Min 25th 50th 75th Max
2018 25 1.9 ± 0.7 0.0 1.5 2.0 2.4 2.9
2018 84 2.9 ± 11.8 0.0 1.3 1.7 2.0 110.0
2018 24 1.5 ± 0.8 0.0 1.3 1.4 1.6 4.42018 2 1.7 ± 0.4 1.4 1.4 1.7 2.0 2.0
2017 317 1.7 ± 1.2 0.0 1.1 1.5 1.9 10.81.9 0.3 1.3 1.7 2.0 26.0
2018 362 0.8 ± 1.5 0.0 0.3 0.6 1.0 27.3
2018 283 0.6 ± 0.5 0.0 0.4 0.5 0.7 7.3
2018 427 0.6 ± 0.4 0.0 0.4 0.5 0.7 3.12018 113 0.8 ± 0.7 0.0 0.4 0.5 0.9 5.3
2017 550 0.6 ± 0.3 0.1 0.4 0.6 0.8 3.20.7 0.0 0.4 0.5 0.8 9.2
2017 316 0.8 ± 0.4 0.1 0.5 0.7 1.0 2.5
2017 14 1.9 ± 0.6 0.9 1.5 1.9 2.3 3.1
2017 11 1.0 ± 0.1 0.8 0.9 1.0 1.1 1.2
341 0.9 0.2 0.6 0.8 1.1 2.5
2018 10 1.3 ± 0.5 0.2 1.0 1.4 1.8 1.82018 72 1.3 ± 0.9 0.1 0.6 1.2 1.5 5.12018 140 0.8 ± 1.2 0.0 0.3 0.5 0.9 13.92018 3 0.4 ± 0.2 0.3 0.3 0.4 0.7 0.72017 327 0.8 ± 0.4 0.1 0.6 0.8 1.1 3.0
0.9 0.1 0.6 0.9 1.2 4.9
Savory biscuits and crackersArgentina 4%
Costa Rica 13%
Year nAverage Sodium
(mg/kcal)
Sodium Percentiles (mg/kcal)Proportion below PAHO Nutrient Profile Model
threshold a
MEAN N/A
Cookies and sweet biscuitsArgentina 73.9%
Paraguay 8%
Peru 100%Canada 19.2%
Canada 90.9%
MEAN N/A
Pastries, squares, and quick/sweet breads
Costa Rica 91.9%
Paraguay 87.4%
Peru 100%
WEIGHTED MEAN N/A
Cakes (as consumed)Argentina 20%
Canadab N/A
Canadac N/A
Canadad N/A
Canada 69.7%
MEAN N/A
All data acquired from the Food Label Information Program (FLIP) database for packaged food and beverage items for the corresponding country; Data presented as mean ± standard deviation. a
Products evaluated against the 2016 PAHO Nutrient Profile Model threshold for excess sodium (1 mg/kcal) included only products classified as processed or ultra-processed; b Baked desserts; c Tea biscuits and scones; d Toaster pastries.
Costa Rica 43.1%Paraguay 79.3%Peru 100%

V. February 19, 2021
Table 3.1 Corn derivatives – Updated food subcategories and sodium reduction targets
mg/100 g US–FDA
Proposed 10-year Targets
(2026)[2]2024 [3] 2017 [3]
UK 2017 Targets met [4]
Min Median Max
3a Hard taco shells
- - Maximum 530 - - - - 416 - 300 400 500- - Target 320 - - - - - -
35 30 0.9 0.7
3b- - Maximum - - - - - - - 300 400 500- - Target - - - - - - -
825 800 1.6 1.5
3c- - Maximum - - - - - - - 300 400 500- - Target - - - - - - -
720 600 2.6 2.1
3d- - Maximum - - - - - - - 300 400 500- - Target - - - - - - -
50 40 0.5 0.4
Average Sodium
(mg/100g) Min 10th 25th 50th 75th Max
2017 17 - 341 ± 181 3 - - - - 5932018 7 45 ± 39 111 ± 146 36 - 40 43 103 4362017 23 - 113 ± 128 0 11 25 40 238 440
45 ± 39 188 13 11 33 42 171 490
2018 5 521 ± 695 867 ± 342 396 - 800 853 933 1354
521 ± 695 867 ± 342 396 - 800 853 933 1354
2018 4 125 ± 16 937 ± 358 400 - 757 1115 1117 11172017 83 - 541 ± 313 0 100 273 583 788 1204
125 ± 16 739 200 100 515 849 952.5 1160.5
2018 3 52 ± 45 43 ± 38 0 - 0 59 71 7152 ± 45 43 ± 38 0 - 0 59 71 71
Min 25th 50th 75th Max
2017 62 1.7 ± 0.6 0.0 1.7 1.8 2.0 3.22018 7 0.5 ± 0.6 0.2 0.2 0.2 0.6 1.9
1.1 0.1 1.0 1.0 1.3 2.6
2018 5 1.7 ± 0.8 0.8 1.5 1.6 1.9 2.91.7 ± 0.8 0.8 1.5 1.6 1.9 2.9
2018 4 2.4 ± 1.1 0.8 1.9 3.0 3.0 3.02.4 ± 1.1 0.8 1.9 3.0 3.0 3.0
2018 3 0.6 ± 0.6 0.0 0.0 0.6 1.1 1.10.6 ± 0.6 0.0 0.0 0.6 1.1 1.1
National Sodium Reduction Targets (mg/100 g)c FOPL Thresholds (mg/100 g)e
2015 PAHO Targets
(mg/100 g)
2015 Targets met [1] a
25th Percentile Median
75th Percentile 2022 2025
Current Regional TargetsMean Sodium Content of Foods in the
Americas (mg/100 g)bSodium Targets (mg/100
g)Mean Sodium Content of Foods in the
Americas (mg/kcal)bSodium Targets
(mg/kcal) WHO
MaxCountries with Targets
Median
Tortillas (corn) (Data from 2017, 2018) (Data from 2017, 2018)
United Kingdom Member State Targetsd
Min25th
Percentile Median75th
Percentile 2022 2025
ColombiaLower Target
Updated Targets
1.0 1.0 1.3 0.9 0.7Regional Target
33 42 171 35 29N/A
Biscuits (bizcochos) (Data from 2018) (Data from 2018)
Regional Target800 853 933 725 597 N/A
Lower Target
Updated Targets
1.5 1.6 1.9 1.4 1.1
Tostadas (Data from 2018) (Data from 2018)
N/A
Regional Target515 849 953 722 594 N/A
Lower Target
Updated Targets
1.9 3.0 3.0 2.6 2.1N/A
Arepas (Data from 2018) (Data from 2018)
Regional Target0 59 71 50 41
Table 3.2 Sodium content for proposed corn derivatives subcategories and overall mean – mg/100 g
Year nAverage Sodium
(mg/serving
Sodium Percentiles (mg/100g)
N/ALower Target
Updated Targets
0.0 0.6 1.1 0.5 0.4N/A
Sodium Percentiles (mg/kcal)
Costa RicaMEAN
TostadasCosta RicaMexico [16]MEAN
Tortillas (corn)United States (SWA) [11]a
Costa RicaMexico [16]MEAN
Biscuits (bizcochos)
MEANAll data acquired from the Food Label Information Program (FLIP) database for packaged food and beverage items for the corresponding country; Data presented as mean ± standard deviation. a Data only available for tortillas, taco shells, wraps, and naan (includes corn and wheat-based tortillas and taco shells).
a Proportion of products in 14-country study [1] meeting PAHO Regional Sodium Reduction Targets; b Mean sodium content calculated from available national sodium monitoring data (Tables 3.2 and 3.3); c Calculated as the average of relevant subcategories; d Data extracted from latest approved national sodium targets in Appendix 3a and may illustrate distinct subcategory targets; e Data extracted from final (proposed, accepted or implemented) national Front-of-package "high in" or "excess" sodium thresholds for prepackaged foods in Appendix 3b.
MEAN
TostadasCosta RicaMEAN
ArepasCosta Rica
Tortillas (corn)Canadaa
Costa Rica
MEAN
Biscuits (bizcochos)Costa Rica
ArepasCosta RicaMEAN
Data acquired from the Food Label Information Program (FLIP) database for packaged food and beverage items for the corresponding country (unpublished), unless otherwise specified. Data presented as mean ± standard deviation. Sales weighted average (SWA). a Taco shells, corn.
Table 3.3 Sodium content for proposed corn derivatives subcategories – mg/kcal
Year nAverage Sodium
(mg/kcal)

V. February 19, 2021
Table 4.1 Breakfast cereal – Updated food subcategories and sodium reduction targets
US - FDA
Proposed 10-year Targets
(2026)[2]2024 [3] 2017 [3]
UK 2017 Targets met [4]
Min Median Max
4a630 91% Maximum 418 360 400 98% f 418 600 630 300 400 500
500 76% Target 260 190 235 Yes g 210 360 390
260 220 0.6 0.5
Table 4.2 Sodium content for breakfast cereal – mg/100 gAverage Sodium
(mg/100g) Min 10th 25th 50th 75th Max2015 88 95 ± 76 318 ± 253 0 46 113 277 518 1100
2015 100 73 ± 66 224 ± 217 0 18 76 166 327 1500
2015 109 69 ± 57 213 ± 175 1 7 50 188 324 642
2015 115 140 ± 63 433 ± 185 44 240 315 400 550 1067
2015 23 175 ± 178 602 ± 708 0 150 297 450 568 2760
2015 100 84 ± 149 283 ± 498 0 0 19 200 384 3400
2015 100 133 ± 56 412 ± 188 0 183 300 433 533 800
2015 114 168 ± 93 456 ± 223 0 141 335 457 575 1179
2015 104 103 ± 65 323 ± 204 0 27 99 356 467 1073
2015 190 118 ± 69 344 ± 201 0 10 220 355 493 810
2015 98 60 ± 63 201 ± 210 0 12 69 125 269 977
2015 91 72 ± 91 251 ± 276 0 2 7 229 378 1395
2015 112 147 ± 130 406 ± 245 0 85 265 388 534 1280
2015 113 122 ± 97 356 ± 316 0 10 70 370 510 1680
2013 310 119 317 0 45 124 291 480 900
2013 20 188 ± 2.2b 443 ± 5.9b 356 - - - - 552117 351 25 65 157 312 461 1320
Min 25th 50th 75th Max2018 85 0.8 ± 0.5 0.0 0.3 0.7 1.2 2.2
2018 135 1.1 ± 0.7 0.0 0.7 1.1 1.4 6.8
2018 126 0.6 ± 0.5 0.0 0.2 0.5 0.9 2.2
2018 79 1.0 ± 0.8 0.0 0.4 0.9 1.2 5.5
2017 379 0.7 ± 0.6 0.0 0.1 0.6 1.1 2.40.8 0.0 0.3 0.8 1.2 3.8
Table 4.1 Breakfast cereal – Updated food subcategories and sodium reduction targets
United Kingdom
WHO National Sodium Reduction Targets (mg/100 g)c FOPL Thresholds (mg/100 g)e
2015 PAHO Targets
(mg/100 g)
2015 Targets met [1] a
25th Percentile
Median 75th Percentile 2022 2025
Current Regional TargetsMean Sodium Content of Foods in the
Americas (mg/100 g)bSodium Targets (mg/100
g)Mean Sodium Content of Foods in the
Americas (mg/kcal)bSodium Targets
(mg/kcal)
Ready to eat and hot instant breakfast cereals (Data from 2013, 2015) (Data from 2017, 2018)
2022 202525th Percentile
Median75th
Percentile
mg/100 g Member State Targetsd
Min Median MaxCountries with Targets
Brazil, Canada, USALower Target
Updated Targets
0.3 0.8 1.2 0.6 0.5Regional Target
157 312 461 265 219280
Year n
Ecuador
a Proportion of products in 14-country study [1] meeting PAHO Regional Sodium Reduction Targets; b Mean sodium content calculated from available national sodium monitoring data (Tables 4.2 and 4.3); c Calculated as the average of relevant subcategories; d Data extracted from latest approved national sodium targets in Appendix 3a and may illustrate distinct subcategory targets; e Data extracted from final (proposed, accepted or implemented) national Front-of-Package "high in" or "excess" sodium thresholds for prepackaged foods in Appendix 3b; f Proportion of products at or below maximum; g Is proportion of products in 2018 at or below maximum within 5% of average sodium target ("target").
Year nAverage Sodium
(mg/serving)
Sodium Percentiles (mg/100g)
ArgentinaBrazilChileCosta RicaCuba
Proportion below PAHO Nutrient Profile Model
thresholds
All data was from Arcand J et al. Nutrients (2019) and represents 2015 data, unless otherwise indicated; Data presented as mean ± standard deviation. a Canadian data was calculated as the weighted average of ready-to-eat and hot instant breakfast cereal subcategories; b Data presented as standard error of the mean.
All data acquired from the Food Label Information Program (FLIP) database for packaged food and beverage items for the corresponding country; Data presented as mean ± standard deviation. a Products evaluated against the 2016 PAHO Nutrient Profile Model threshold for excess sodium (1 mg/kcal) included only products classified as processed or ultra-processed.
Peru 100%Canada 67%
MEAN N/A
Argentina 68%Costa Rica 47%Paraguay
Guatemala
79%
Table 4.3 Sodium content for breakfast cereal – mg/kcalAverage Sodium
(mg/kcal)
Sodium Percentiles (mg/kcal)
JamaicaMexicoPanamaParaguayPeruTrinidad and TobagoBarbados
Canada [5]a
United States [6]
MEAN

V. February 19, 2021
Table 5.1 Savory snacks – Updated food subcategories and sodium reduction targets
US–FDA
Proposed 10-year Targets
(2026)[2]d2024 [3] 2017 [3]
UK 2017 Targets met [4]
Min Median Max
5a- - Maximum 330 480 - - 86 352 550 300 400 500
- - Target 200 400 - - 320 320 320
265 220 0.9 0.8
5b- - Maximum 646 713 883 86% f 291 600 1006 300 400 500
- - Target 390 577 701 N/A 400 430 680
530 470 1.4 1.2
5c- - Maximum 1040 - - - 1400 1400 1400 300 400 500
- - Target 725 - - - 790 815 840
800 670 1.8 1.7
5d- - Maximum 693 679 883 86% f 86 532 1400 300 400 500
- - Target 438 551 701 Yes h 320 515 840
525 430 0.9 0.8
US–FDA
Proposed 10-year Targets
(2026)[2]2024 [3] 2017 [3]
UK 2017 Targets met
[4]Min Median Max
Snacks (overall)Regional Target 900 75% Maximum 693 679 883 86% f 86 532 1400 300 400 500
Lower Target 530 39% Target 438 551 701 Yes g 320 515 840
Proposed Targets
Table 5.3 Sodium content for snacks (overall) – mg/100 gAverage Sodium
(mg/100g) Min 10th 25th 50th 75th Max2015 123 223 ± 272 863 ± 1043 0 174 423 608 900 8000
2015 198 196 ± 122 812 ± 484 20 347 517 764 1010 35162015 132 117 ± 71 443 ± 271 0 12 267 458 623 13002015 206 195 ± 157 765 ± 579 0 216 395 643 956 50132015 14 229 ± 83 622 ± 179 330 365 544 675 699 10232015 187 185 ± 162 591 ± 483 0 117 271 467 786 32142015 181 282 ± 880 774 ± 701 0 178 410 689 964 70002015 147 210 ± 144 671 ± 436 11 217 384 607 913 33932015 211 269 ± 267 812 ± 518 0 324 500 714 975 31662015 207 214 ± 151 735 ± 464 0 262 410 670 1000 32302015 159 184 ± 113 670 ± 425 0 34 400 610 944 23332015 116 162 ± 117 584 ± 399 0 182 377 537 700 3000
2015 152 213 ± 135 676 ± 357 0 250 428 635 933 1710
2015 202 211 ± 228 907 ± 2997 0 252 430 635 910 428602013 620 267 587 161 315 415 553 720 1526
2013 95 217 755 528 - - - - 988
211 704 66 216 411 618 869 5705
Average Sodium
(mg/100g) Min 10th 25th 50th 75th Max
2013 158 180 ± 152 391 ± 351 0 70 190 312 500 2156180 ± 152 391 ± 351 0 70 190 312 500 2156
2013 406 277 611 222 388 472 591 728 12552016 246 - 824 54 - - - - 24002017 70 - 676 285 - - - - 10202013 62 161 554 368 - - - - 746
219 666 232 388 472 591 728 1355
2013 56 433 ± 212 964 ± 385 175 480 637 957 1280 1720
2013 21 352 ± 7c 1240 ± 23c 849 - - - - 1640
393 1102 512 480 637 957 1280 1680
FOPL Thresholds (mg/100 g)e
2015 PAHO Targets
(mg/100 g)
2015 Targets met [1] a
25th Percentile
Median 75th Percentile 2022 2025
Current Regional Targets
Mean Sodium Content of Foods in the Americas (mg/100 g)b
Sodium Targets (mg/100 g)
Mean Sodium Content of Foods in the Americas (mg/kcal)b
Sodium Targets (mg/kcal)
25th Percentile Median 75th Percentile
Member State Targetsd
Min Median MaxCountries with Targets
Nuts, seeds, and kernels, seasoned and candied (Data from 2013) (Data from 2018)
2022 2025
United Kingdom
WHO National Sodium Reduction Targets (mg/100 g)c
mg/100 g
Canada, ColombiaLower Target
Updated Targets
0.5 1.1 1.8 0.9 0.8Regional Target
190 312 500 265 218280
Chips, popcorn, and/or extruded snacks (Data from 2013, 2016, 2017) (Data from 2018)
Regional Target472 591 728 503 414 Brazil, Canada, Colombia, USA
Lower Target
Updated Targets
1.2 1.6 1.9 1.4 1.1
Pretzels and snack mixes (Data from 2013) (Data from 2017)
500
Regional Target637 957 1280 813 670 Canada, USA
Lower Target
Updated Targets
1.7 1.8 2.0 1.5 1.3760
Other savory snacksd (Data from 2013, 2015) (Data from 2017, 2018)
Regional Target411 618 869 525 432 Savory snacks overall: Argentina, Brazil,
Canada, Colombia, USALower Target
Updated Targets
0.7 1.1 1.9 0.9 0.8
a Proportion of products in 14-country study [1] meeting PAHO Regional Sodium Reduction Targets; b Mean sodium content calculated from available national sodium monitoring data (Tables 5.2 to 5.6); c Calculated as the average of relevant subcategories; d Data extracted from latest approved national sodium targets in Appendix 3a and may illustrate distinct subcategory targets. Maximum value may exceed target, as many countries only possess maximum sodium values; e Data extracted from final (proposed, accepted, or implemented) front-of-package "high in" or "excess" sodium thresholds for prepackaged foods in Appendix 3b; f Proportion of products at or below maximum; g Data for other savory snacks is a composite of data for savory snacks (overall) (see Table 5.2); h Is proportion of products in 2018 at or below maximum within 5% of average sodium target ("target").
N/A
Table 5.2 Summary of existing savory snacks sodium reduction targets and front-of-package label (FOPL) thresholdsCurrent Regional
TargetsMean Sodium Content of Foods in the
Americas (mg/100 g)bMean Sodium Content of Foods in the
Americas (mg/kcal)b National Sodium Reduction Targets (mg/100 g)c FOPL Thresholds (mg/100 g)e
2015 PAHO Targets
(mg/100 g)
2015 Targets met [1] a
United Kingdom Member State Targetsd
Min Median Max
(Data from 2013, 2015) (Data from 2017, 2018)
25th Percentile
Median 75th Percentile25th
PercentileMedian 75th Percentile
a Proportion of products in 14-country study [1] meeting PAHO Regional Sodium Reduction Targets; b Mean sodium content calculated from available national sodium monitoring data (Tables 5.3 and 5.5); c Calculated as the average of relevant subcategories (excludes snack puddings); d Data extracted from latest approved national sodium targets in Appendix 3a and may illustrate distinct subcategory targets; e Data extracted from final (proposed, accepted or implemented) national front-of-package "high in" or "excess" sodium thresholds for prepackaged foods in Appendix 3b; f Average proportion of products in crisps and snacks category at or below maximum; g Is proportion of products in 2018 at or below maximum within 5% of average sodium target ("target").
Year nAverage Sodium
(mg/serving)
Sodium Percentiles (mg/100g)
411 618 869 0.7 1.1 1.9
GuatemalaJamaicaMexicoPanamaParaguayPeru
Argentina
BrazilChileCosta RicaCubaEcuador
Table 5.4 Sodium content for proposed savory snacks subcategories – mg/100 g
Year nAverage Sodium
(mg/serving)
Sodium Percentiles (mg/100g)
Trinidad and Tobago
Barbados
Canada [5]a
United States [6]b
MEAN
All data was from Arcand J et al. Nutrients (2019) and represents 2015 data, unless otherwise indicated; Data presented as mean ± standard deviation. a Canadian data was calculated as the weighted average of snack foods subcategories (excluding pudding); b US data was calculated as the weighted average of savory snacks subcategories (excluding crackers).
Brazil [9]United States [6]MEAN
Pretzels and snack mixesCanada [5]
United States [6]b
Nuts, seeds, and kernels, seasoned and candied
Canada [5]MEAN
Chips, popcorn, and/or extruded snacksa
Canada [5]Mexico [12]
MEAN
Data presented as mean ± standard deviation.a Individual country data calculated as the weighted average of chips, popcorn, and/or extruded snacks subcategories; b Hard pretzels; c Data presented as standard error of the mean.

V. February 19, 2021
Min 25th 50th 75th Max2018 137 1.1 ± 0.4 0.1 0.9 1.2 1.4 2.62018 357 1.2 ± 0.9 0.0 0.5 1.0 1.6 52018 382 3.7 ± 6.5 0.0 0.9 1.3 3.1 462018 39 1.5 ± 1.9 0.0 0.4 1.0 1.8 11.22017 747 1.1 ± 0.7 0.0 0.6 1.0 1.5 4.5
1.7 0.0 0.7 1.1 1.9 13.9
Min 25th 50th 75th Max
2018 43 1.8 ± 0.6 0.0 1.6 1.8 1.9 3.72018 40 1.0 ± 0.9 0.0 0.2 0.7 1.8 2.92018 33 1.2 ± 0.9 0.0 0.1 1.4 2.0 2.62018 7 0.7 ± 0.8 0.0 0.0 0.4 1.6 1.7
1.2 0.0 0.5 1.1 1.8 2.7
2018 67 1.8 ± 0.5 0.4 1.5 1.8 1.9 3.92018 60 1.5 ± 0.6 0.0 1.2 1.5 1.9 2.92018 41 1.4 ± 0.7 0.0 1.0 1.7 2.0 2.22018 17 1.1 ± 0.6 0.0 1.1 1.4 1.6 2.0
1.5 0.1 1.2 1.6 1.9 2.8
2017 62 1.7 ± 0.6 0.0 1.7 1.8 2.0 3.21.7 ± 0.6 0.0 1.7 1.8 2.0 3.2
Table 5.5 Sodium content for snacks (overall) – mg/kcal
Year nAverage Sodium
(mg/kcal)
Sodium Percentiles (mg/kcal)Proportion below PAHO Nutrient Profile Model
threshold a
Peru 100%
Canada 48.3%
MEAN N/A
Argentina 43.1%
Costa Rica 49%
Paraguay 31.6%
Nuts, seeds, and kernels, seasoned and candiedArgentinaCosta RicaParaguayPeruMEAN
All data acquired from the Food Label Information Program (FLIP) database for packaged food and beverage items for the corresponding country; Data presented as mean ± standard deviation. a Products evaluated against the 2016 PAHO Nutrient Profile Model threshold for excess sodium (1 mg/kcal) included only products classified as processed or ultra-processed.
Table 5.6 Sodium content for proposed savory snacks subcategories – mg/kcal
Year n Average Sodium
Sodium Percentiles (mg/kcal)
Pretzels and snack mixesCanadaMEANAll data acquired from the Food Label Information Program (FLIP) database for packaged food and beverage items for the corresponding country; Data presented as mean ± standard deviation.
Chips, popcorn, and/or extruded snacksArgentinaCosta RicaParaguayPeruMEAN

V. February 19, 2021
Table 6.1 Cheese – Updated food subcategories and sodium reduction targets
US–FDA
Proposed 10-year Targets
(2026)[2]2024 [3] 2017 [3]
UK 2017 Targets met [4]
Min Median Max
6a- - Maximum - - - - 425 466 512 300 400 500
- - Target - - - - 496 523 558
480 400 1.1 0.9
6b
- - Maximum 575 720 720 37% f 387 571 600 300 400 500
- - Target 485 620 650 N/A 350 405 600
420 380 0.7 0.6
6c
- - Maximum 736 760 800 100% f,g - 770 - 300 400 500
- - Target 589 642 680 N/A 542 613 670
650 590 1.7 1.5
6d- - Maximum 1690 - - - - 2530 - 300 400 500
- - Target 1320 - - - 1300 1510 1720
1300 1200 2.0 1.6
6e- - Maximum 1310 800 800 50% f - 1670 - 300 400 500
- - Target 1000 650 680 N/A 1040 1140 1240
1000 900 5.4 4.5
Average Sodium
(mg/100g) Min 10th 25th 50th 75th Max
2016 35 - 498 ± 209 14 - 363 568 615 970- 498 ± 209 14 - 363 568 615 970
2013 25 131 ± 30 450 ± 106 267 283 367 467 536 6072013 62 123 ± 72 474 ± 137 167 333 383 450 533 867
87 125 467 196 319 378 455 534 792
2013 249 188 472 152 473 594 659 701 8852017 28 - 517 ± 132 87 - - 527 - 797
Mexico [12] 2016 17 - 490 ± 34 417 - - - - 526
188 472 219 473 594 593 701 736
2013 33 306 ± 93 1652 ± 739 643 667 1067 1536 2200 3000306 ± 93 1652 ± 739 643 667 1067 1536 2200 3000
2016 60 - 863 ± 421 210 - 600 780 1149 26672013 56 383 ± 122 1525 ± 313 788 1000 1390 1619 1758 1905
383 ± 122 1194 499 1000 995 1200 1454 2286
Min 25th 50th 75th Max
2018 1 1.4 ± 0.0 1.4 1.4 1.4 1.4 1.42017 45 0.9 ± 0.7 0.0 0.4 0.9 1.5 2.32018 30 1.7 ± 0.9 0.0 1.2 1.7 2.1 4.12018 1 1.4 ± 0.0 1.4 1.4 1.4 1.4 1.4
MEAN 0.7 1.1 1.4 1.6 2.3
2017 97 1.9 ± 0.9 0.7 0.7 0.7 0.7 0.7
MEAN 0.7 0.7 0.7 0.7 0.7
2017 353 2.1 ± 0.9 0.6 1.7 1.8 2.1 10
MEAN 0.6 1.7 1.8 2.1 10
2017 57 2.9 ± 1.8 0.7 1.6 2.3 3.5 8.8
MEAN 0.7 1.6 2.3 3.5 8.8
2017 37 6.3 ± 1.7 3.1 5.4 5.9 6.7 10.4MEAN 3.1 5.4 5.9 6.7 10.4
Min25th Percentile Median 75th Percentile 2022 2025
National Sodium Reduction Targets (mg/100 g)c FOPL Thresholds (mg/100 g)e
25th Percentile Median 75th Percentile 2022 2025 MaxMedian
Member State Targetsd
Countries with Targets
Current Regional Targets
United Kingdom
mg/100 g
190
Mean Sodium Content of Foods in the Americas (mg/100 g)b Sodium Targets (mg/100 g)
Mean Sodium Content of Foods in the Americas (mg/kcal)b Sodium Targets (mg/kcal) WHO
Updated Targets
1.1 1.4 1.6 1.1 0.9Regional Target
363 568 615
2015 PAHO Targets (mg/100
g)
2015 Targets met [1] a
(Cheese spread)
Regional Target378 455 534 387 0.5
(Data from 2017, 2018)
483 398
Argentina, Canada, USALower Target
Argentina, Colombia
Fresh cheese (fresh mozzarella and others) (Data from 2016)
Lower Target
Semi-hard cheese (mozzarella, cheddar, and others) (Data from 2013, 2016, 2017) (Data from 2017)
190Brazil, Canada, Colombia,
USALower Target
Updated Targets
318 0.7 0.7 0.7 0.6
Soft cheese (unripened goat cheese, cream cheese) (Data from 2013) (Data from 2017)
1.7 1.8 2.1 1.5 1.3520-625
Hard cheese, grated and ungrated (Data from 2013) (Data from 2017)
Regional Target594 593 701 504 415
Canada, USALower Target
Updated Targets
1.6 2.3 3.5 2.0 1.6
Updated Targets
Processed cheese (Data from 2013, 2015) (Data from 2017)
N/A
Regional Target995 1200 1454 1020 840
Regional Target1067 1536 2200 1306 1075
Canada, USALower Target
Updated Targets
5.4 5.9 6.7 5.0 4.1N/A
Fresh cheese (fresh mozzarella and others)Mexico [12]MEAN
Soft cheese (unripened goat cheese and cream cheese) Canada [5]a
Canada [5]b
Table 6.2 Sodium content for proposed cheese subcategories and overall mean – mg/100 g
Year nAverage Sodium
(mg/serving)
Sodium Percentiles (mg/100g)
Processed cheeseMexico [12]Canada [5]MEAN
WEIGHTED MEAN
Semi-hard cheese (mozzarella, cheddar, and others) Canada [5]c
Brazil [9]
MEAN
Hard cheese, grated and ungrated
Canada
All data acquired from the Food Label Information Program (FLIP) database for packaged food and beverage items for the corresponding country; Data presented as mean ± standard deviation. a Mozzarella mg/kcal data was included in either fresh cheese data, or cheddar, Colby, etc. data rather than its own category.
a Proportion of products in 14-country study [1] meeting PAHO Regional Sodium Reduction Targets; b Mean sodium content calculated from available national sodium monitoring data (Tables 6.2 and 6.3); c Calculated as the average of relevant subcategories; d Data extracted from latest approved national sodium targets in Appendix 3a and may illustrate distinct subcategory targets. Maximum value may exceed target, as many countries only possess maximum sodium values; e Data extracted from final (proposed, accepted or implemented) national front-of-package "high in" or "excess" sodium thresholds for prepackaged foods in Appendix 3b; f Proportion of products at or below maximum; g Cheddar and other "hard pressed" cheeses.
Canada
Semi-hard cheese (mozzarella, cheddar and others) Canada
Hard cheese, grated and ungrated Canada
Processed cheese
Fresh cheese (fresh mozzarella and others)ArgentinaCanadaCosta RicaParaguay
Soft cheese (unripened goat cheese and cream cheese)
Data presented as mean ± standard deviation. a Goat cheese; b Cream cheese; c Canadian data was calculated as the weighted average of Brie and camembert and natural cheeses subcategories.
Table 6.3 Sodium content for proposed cheese subcategories – mg/kcal
Year nAverage Sodium
(mg/kcal)
Sodium Percentiles (mg/kcal)
Canada [5]MEAN

V. February 19, 2021
Table 7.1 Processed vegetables, beans, and legumes – Updated food subcategories and sodium reduction targets
US–FDA
Proposed 10-year Targets
(2026)[2]2024 [3] 2017 [3]
UK 2017 Targets met
[4]Min Median Max
7a- - Maximum - - - - 572 706 840 300 400 500- - Target - - - - - 470 -
400 320 3.3 2.7
7b- - Maximum 320 50 50 62% f 310 310 310 300 400 500
- - Target 250 - - - 100 140 240
150 100 4.0 3.3
7c- - Maximum 350 - - - 310 310 310 300 400 500- - Target 220 - - - 100 170 240
220 190 2.5 2.2
7d- - Maximum 320 250 258 74% f 370 370 370 300 400 500- - Target 250 240 270 N/A 250 280 310
280 250 2.6 2.4
7e- - Maximum 470 260 275 80% f 380 380 380 300 400 500- - Target 323 155 185 N/A 170 240 380
170 140 N/A N/A
7f
- - Maximum 295 60 60 N/A 440 440 440 300 400 500- - Target 180 - - - 290 750 1210
290 270 N/A N/A
7g- - Maximum 550 - - - 700 870 1040 300 400 500- - Target 410 - - - 400 520 640
680 560 30.1 24.8
7h- - Maximum - - - - - 2000 - 300 400 500- - Target - - - - - 1600 -
900 790 7.8 6.4
7i- - Maximum 1375 - - - 1800 1900 2000 300 400 500- - Target 1030 - - - 880 1240 1600
1300 1100 9.9 8.1
7j- - Maximum 200c - - - - 330 - 300 400 500- - Target 150c - - - - 180 -
175 160 4.5 3.7
Average Sodium
(mg/100g) Min 10th 25th 50th 75th Max
2013 4 155 ± 156 484 ± 488 63 63 63 469 906 938155 ± 156 484 ± 488 63 63 63 469 906 938
2018 147 - 252 0 - 63 197 262 47602013 300 193 ± 131 211 ± 202 0 - 104 211 292 21432017 30 - 190 107 - - - - 242
193 ± 131 218 36 - 84 204 277 2382
2013 83 311 ± 202 228 ± 179 0 - 128 194 322 12002018 25 371 ± 288 367 ± 282 98 - 220 300 347 10782018 20 301 ± 140 238 ± 105 12 - 180 243 315 4622018 6 375 ± 157 279 ± 100 120 - 227 298 320 414
284 267 58 - 189 259 326 789
2013 37 552 ± 174 316 ± 94 199 213 243 303 384 6042017 18 - 373 ± 28 298 - - - - 4112018 46 425 ± 183 373 ± 119 12 - 315 368 441 754
489 353 170 213 279 336 413 590
2013 67 193 ± 128 232 ± 154 15 24 76 200 365 5952013 6 - 370 ± 7e 115 - - - - 676
193 ± 128 301 65 24 76 200 365 636
2013 38 476 ± 111 311 ± 68 134 223 275 310 351 449476 ± 111 311 ± 68 134 223 275 310 351 449
2013 153 248 ± 150 869 ± 499 17 357 567 800 1069 35002017 - - 506 - - - - - -
248 ± 150 688 17 357 567 800 1069 3500
FOPL Thresholds (mg/100 g)e
2015 PAHO Targets (mg/100
g)
2015 Targets met [1] a
Current Regional TargetsMean Sodium Content of Foods in the
Americas (mg/100 g)b Sodium Targets (mg/100 g)Mean Sodium Content of Foods in the
Americas (mg/kcal)b Sodium Targets (mg/kcal) WHO
mg/100 g
National Sodium Reduction Targets (mg/100 g)c
2022 2025 Median MaxCountries with Targets
Min25th Percentile Median 75th Percentile 2022 2025
Tomato paste with additions (Data from 2013) (Data from 2017)
United Kingdom Member State Targetsd
Lower Target
Updated Targets
1.0 3.9 5.0 3.3 2.7Regional Target
63 469 906 399 328 Canada, Costa Rica330
25th Percentile Median 75th Percentile
Canned vegetables (Data from 2013, 2017, 2018) (Data from 2017)
Regional Target84 204 277 173 143 Canada, USA
Lower Target
Updated Targets
0.9 4.7 8.2 4.0 3.3
Canned beans, chickpeas, and lentils (Data from 2013, 2018) (Data from 2017, 2018)
50
Regional Target189 259 326 220 181 Canada, USA
Lower Target
Updated Targets
2.2 2.8 3.7 2.3 1.950
Baked and refried beans (mashed) (Data from 2013, 2017, 2018) (Data from 2017, 2018)
Regional Target279 336 413 285 235
Updated Targets180
Canada, USALower Target
Updated Targets
2.4 2.8 3.6 2.3 1.9510
- - - -Regional Target
76 200 365 170 140 -
Frozen potatoes and similar products (Data from 2013)
Canada, USALower Target
Regional Target275 310 351 264 217 - Canada, USA
Lower Target
Dry mashed or scalloped potatoes (as consumed)
(Data from 2013)
Pickled vegetables (Data from 2013) (Data from 2017)
- - - -260
Updated Targets
CanadaLower Target
Updated Targets
15.8 35.4 51.9 30.1 24.8Regional Target
567 800 1069 680 560550
Sundried tomatoes (Data from 2013) (Data from 2017)
Regional Target789 1081 1550 919 757 Canada
Lower Target
Updated Targets
6.0 9.2 13.0 7.8 6.4
Olives (Data from 2013) (Data from 2017)
780
Regional Target1067 1567 1813 1332 1097 Canada
Lower Target
Updated Targets
10.0 11.6 13.0 9.9 8.1780
Vegetable juice (Data from 2013) (Data from 2017)
Regional Target160 187 241 159 131
Table 7.2 Sodium content for proposed processed vegetables, beans, and legumes subcategories – mg/100 g
Year nAverage Sodium
(mg/serving)
Sodium Percentiles (mg/100g)
CanadaLower Target
Updated Targets
1.3 5.3 9.6 4.5 3.7200
United States (SWA) [11]c
MEAN
Canned beans, chickpeas, and lentilsb
CanadaCosta RicaArgentina
Tomato paste with additionsCanada [5]MEAN
Canned vegetables
Argentina [13]a
Canadab
MEAN
Frozen potatoes and similar productsCanada [5]United States [6]MEAN
Dry mashed or scalloped potatoes (as consumed)
ParaguayMEAN
Baked and refried beans (mashed)Canada [5]
United States (SWA) [11]d
Costa Ricab
Sundried tomatoes
Canada [5]MEAN
Pickled vegetablesCanada [5]f
Canada (SWA) [14]g
MEAN
a Proportion of products in 14-country study [1] meeting PAHO Regional sodium reduction targets; b Mean sodium content calculated from available national sodium monitoring data (Tables 7.2 and 7.3); c Calculated as the average of relevant subcategories; d Data extracted from latest approved national sodium targets in Appendix 3a and may illustrate distinct subcategory targets; e Data extracted from final (proposed, accepted or implemented) national Front-of-Package "high in" or "excess" sodium thresholds for prepackaged foods in Appendix 3b; f Proportion of products at or below maximum.

V. February 19, 2021
2013 4 265 ± 244 1170 ± 522 650 650 789 1081 1550 1867265 ± 244 1170 ± 522 650 650 789 1081 1550 1867
2013 90 223 ± 77 1461 ± 477 556 758 1067 1567 1813 2667223 ± 77 1461 ± 477 556 758 1067 1567 1813 2667
2013 41 - 184 ± 81 53 54 160 187 241 327- 184 ± 81 53 54 160 187 241 327
Min 25th 50th 75th Max
2017 6 3.3 ± 1.9 1.0 1.0 3.9 5.0 5.23.3 ± 1.9 1.0 1.0 3.9 5.0 5.2
2017 212 5.4 ± 4.4 0.0 1.1 4.8 8.0 21.02017 45 6.6 ± 7.9 0.0 0.0 4.0 9.0 38.0
257 5.6 0.0 0.9 4.7 8.2 24.0
2017 83 1.5 ± 1.8 0.0 0.5 1.1 2.3 14.32018 25 3.9 ± 1.9 1.0 2.4 3.5 4.6 7.62018 20 2.9 ± 1.3 0.2 2.4 2.8 3.9 5.92018 6 4.3 ± 3.0 1.2 3.3 3.6 3.9 10.2
3.0 0.6 2.2 2.8 3.7 9.5
2017 45 2.7 ± 1.1 0.1 2.1 2.4 3.4 5.92018 46 3.3 ± 1.6 0.1 2.6 3.1 3.8 8.9
3.0 0.1 2.4 2.8 3.6 7.4
- - - - - - - -
- - - - - -
- - - - - - - -- - - - - -
2017 125 48.7 ± 34.7 0.0 20.0 46.0 67.5 188.02017 43 9.9 ± 24.1 1.1 3.7 4.5 6.7 160.0
168 38.8 0.3 15.8 35.4 51.9 180.8
2017 19 11.7 ± 3.2 6.7 10.0 11.6 13.0 20.711.7 ± 3.2 6.7 10.0 11.6 13.0 20.7
2017 59 9.8 ± 5.5 2.4 6.0 9.2 13.0 38.09.8 ± 5.5 2.4 6.0 9.2 13.0 38.0
2017 60 5.5 ± 4.3 0.0 1.3 5.3 9.6 13.85.5 ± 4.3 0.0 1.3 5.3 9.6 13.8
Canada [5]MEAN
OlivesCanada [5]h
MEAN
Vegetable juiceCanada [5]MEAN
Data presented as mean ± standard deviation. Sales weighted average (SWA). a May include beans; b Data acquired from the Food Label Information Program (FLIP) database for packaged food and beverage items for the corresponding country (unpublished); c US data was calculated as the weighted average of canned green beans and canned tomatoes subcategories; d Refried beans, canned; e Presented as standard error of the mean; f Sour pickled vegetables; g Sweet pickled vegetables; h Stuffed olives.
Table 7.3 Sodium content for proposed processed vegetables, beans, and legumes subcategories – mg/kcal
Year nAverage Sodium
(mg/kcal)
Sodium Percentiles (mg/kcal)
MEAN
Frozen potatoes and similar products
WEIGHTED MEAN
Canned beans, chickpeas and lentilsCanadaCosta Rica
ArgentinaParaguay
Tomato paste with additionsCanadaMEAN
Canned vegetablesCanadaa
Canadab
All data acquired from the Food Label Information Program (FLIP) database for packaged food and beverage items for the corresponding country; Data presented as mean ± standard deviation. a Canned and bottles vegetables without sauce; b Other canned vegetables; c Sour pickled vegetables; d Sweet pickled vegetables; e Stuffed olives; f Data includes both sundried tomatoes and olives (not stuffed).
Sundried tomatoesCanadaf
MEAN
Vegetable juiceCanadaMEAN
Canadac
Canadad
WEIGHTED MEAN
OlivesCanadae
MEAN
N/AMEAN
Dry mashed or scalloped potatoes (as consumed)N/AMEAN
Pickled vegetables
MEAN
Baked and refried beans (mashed)Canada
Costa Ricac

V. February 19, 2021
Table 8.1 Processed meat and poultry – Updated food subcategories and sodium reduction targets
US–FDA
Proposed 10-year Targets
(2026)[2]2024 [3] 2017 [3] UK 2017 Targets
met [4]Min Median Max
8a- - Maximum 1095 - - - 862 1180 1350 300 400 500- - Target 798 - - - 810 850 910
900 800 6.6 5.7
8b
- - Maximum 1730 - - - 1140 1400 2000 300 400 500- - Target 1300 - - - 1080 1455 1900
1350 1200 3.6 3.5
8c- - Maximum 680 638 650 56% g 660 665 670 300 400 500- - Target 550 515 525 No f 690 903 970
600 500 2.5 2.4
8d- - Maximum 975 655 690 96% g 853 1355 1425 300 400 500- - Target 740 520 550 - 720 830 850
840 770 3.0 2.7
8e
- - Maximum 600 - - N/A - 610 - 300 400 500- - Target 450 1035 1150 No f - 580 -
700 590 1.4 1.2
8f
- - Maximum 590 335 350 61% g 470 675 808 300 400 500- - Target 420 270 300 - 450 510 570
540 500 2.0 1.7
8g
- - Maximum 1455 - - N/A 470 1160 3000 300 400 500- - Target 1100 650 650 - 340 815 1800
915 790 4.1 3.4
8h- - Maximum - - - - - 600 - 300 400 500- - Target - - - - - 570 -
720 600 2.4 2.1
Average Sodium
(mg/100g) Min 10th 25th 50th 75th Max
2018 172 - 1079 115 - 785 993 1282 3623
2013 147 545 ± 206 919 ± 205 394 667 800 891 1055 14362017 36 - 921 625 - - 921 - 12352018 622 - 622 ± 75 569 - - 623 - 675
545 ± 206 885 426 667 793 857 1169 1742
2017 13 - 1712 ± 182 1320 - - 1712 - 1950
2013 118 548 1502 572 893 1216 1455 1829 2464
548 3046 946 893 1216 1583 1829 2207
2017 - - 691 - - - 691 - -
- 691 - - - 691 - -
2018 20 - 1741 418 - - 996 - 3772
2016 82 - 884 ± 204 70 - 807 897 982 1500
2017 30 - 910 717 - - 910 - 1036
2013 141 589 ± 216 814 ± 195 254 571 730 827 921 1436
589 ± 216 1087 365 571 769 908 952 1936
2016 21 - 1027 ± 585 90 - 600 1000 1318 2133
2013 35 344 ± 136 649 ± 173 298 389 575 640 760 1038
344 ± 136 838 194 389 588 820 1039 1586
2013 234 569 497 97 325 388 471 585 1080
2018 59 - 684 294 - 651 718 771 866
2017 15 - 529 ± 47 449 - - 529 - 679
2018 20 - 732 ± 240 375 - 543 740 904 1139
2018 1 - 668 668 - 668 668 668 668
2018 39 - 340 ± 159 1 - 241 360 446 630
569 575 314 325 498 581 675 844
2018 40 - 1634 ± 655 115 - 1373 1504 1740 3623
2018 57 - 1160 318 - 536 1054 2093 2376
2018 30 - 1045 ± 555 295 - 658 904 1256 2423
2013 9 - 1112 ± 21h 606 - - 1112 - 2020
2013 12 566 ± 277 818 ± 176 500 560 731 835 925 1107
2016 43 - 1255 ± 738 500 - 745 995 1580 2900
2013 23 492 ± 173 836 ± 240 280 558 692 867 960 1404
425 1266 373 559 789 1039 1426 2265
FOPL Thresholds (mg/100 g)e
2015 PAHO Targets (mg/100 g)
2015 Targets met [1] a
Current Regional TargetsMean Sodium Content of Foods in the
Americas (mg/100 g)b Sodium Targets (mg/100 g)Mean Sodium Content of Foods in the
Americas (mg/kcal)b Sodium Targets (mg/kcal) WHO
mg/100 g
National Sodium Reduction Targets (mg/100 g)c
2022 2025 Median MaxCountries with Targets
Min25th Percentile Median 75th Percentile 2022 2025
Packaged deli meats – fully cooked (Data from 2013, 2017, 2018) (Data from 2017)
United Kingdom Member State Targetsd
Lower Target
Updated Targets
5.7 7.5 8.3 6.4 5.3Regional Target
793 857 1169 728 600 Brazil, Canada, Colombia, Costa Rica, USAN/A
25th Percentile Median 75th Percentile
Packaged dry-cured deli meats – dry cured, fermented, no thermal process
(Data from 2013, 2017, 2018) (Data from 2017)
Regional Target1216 1583 1829 1346 1108 Argentina, Canada, USA
Lower Target
Updated Targets
3.5 3.8 4.5 3.2 2.6
Sausages – uncooked (Data from 2017) (Data from 2017, 2018)
950
Regional Target- 691 - 587 484 Argentina, Brazil, Canada, USA
Lower Target
Updated Targets
2.4 2.6 3.6 2.2 1.8230
Sausages – cooked (Data from 2013, 2016, 2017, 2018) (Data from 2017, 2018)
Regional Target769 908 952 771 635
Updated Targets
N/A
Argentina, Brazil, Canada, Colombia, Costa Rica, USALower Target
Updated Targets
2.7 3.2 4.0 2.7 2.2540
1.7 1.9 1.4 1.2Regional Target
588 820 1039 697 574 1.2
Uncooked bacon – belly (Data from 2013, 2016)Includes all types of injection cured bacon, eg sliced back, streaky, smoked
and unsmoked bacon, bacon joints.
CanadaLower Target
Regional Target498 581 675 494 407 1.6 Argentina, Brazil, Canada,
Lower Target
Burgers, meatballs, meatloaf, and breaded meat and poultry (Data from 2013, 2017, 2018)
Ham, canned meat and poultry, and uncooked, pickled, cured, and smoked meats that are not deli meats
(Data from 2013, 2016, 2017, 2018) (Data from 2017)
2.4 2.9 2.0 1.7N/A
Updated Targets
Brazil, Canada, Colombia, Costa Rica, USALower Target
Updated Targets
3.4 4.9 6.0 4.1 3.4Regional Target
789 1039 1426 883 727900
Patés and meat spreads (Data from 2013, 2018) (Data from 2017)
Regional Target717 759 875 645 531 Canada
Lower Target
Updated Targets
2.1 2.7 2.9 2.3 1.9
Packaged deli meats – fully cooked
N/A
Argentina [13]Canada [5]
United States (SWA) [11]a
Costa Rica [8]MEAN
Table 8.2 Sodium content for proposed processed meat and poultry subcategories – mg/100 g
Year nAverage Sodium
(mg/serving)
Sodium Percentiles (mg/100g)
MEAN
Sausages – cooked
Costa Rica [8]c
Mexico [12]
United States (SWA) [11]d
Canada [5]
Packaged dry-cured deli meats – dry cured, fermented, no thermal process
United States (SWA) [11]
Canada [5]b
MEAN
Sausages – uncooked
Canada (SWA) [14]
Canada [5]e
Argentina [7, 13]f
United States (SWA) [11
Costa Rica [7]
Paraguay [7]
Peru [7]
MEAN
Uncooked bacon – belly
Mexico [12]
Canada [5]
MEAN
Burgers, meatballs, meatloaf, and breaded meat and poultry
Canada [5]
Mexico [12]
Canada [5]
MEAN
MEAN
Ham, canned meat and poultry, and uncooked, pickled, cured, and smoked meats that are not deli meats
Argentina [7]
Costa Rica [7, 8]g
Paraguay [7]
United States [6]
a Proportion of products in 14-country study [1] meeting PAHO Regional Sodium Reduction Targets; b Mean sodium content calculated from available national sodium monitoring data (Tables 8.2 and 8.3); c Calculated as the average of relevant subcategories; d Data extracted from latest approved national sodium targets in Appendix 3a and may illustrate distinct subcategory targets; e Data extracted from final (proposed, accepted or implemented) national front-of-package "high in" or "excess" sodium thresholds for prepackaged foods in Appendix 3b; f Is proportion of products in 2018 at or below maximum within 5% of average sodium target ("target"); g Proportion of products at or below maximum.

V. February 19, 2021
2018 15 - 760 260 - 700 750 950 1050
2013 13 223 ± 32 751 ± 65 615 - 733 767 800 829
223 ± 32 756 438 - 717 759 875 940
Min 25th 50th 75th Max
2017 123 7.0 ± 2.0 2.3 5.7 7.5 8.3 11.66.0 2.3 5.7 7.5 8.3 11.6
2017 33 3.6 ± 0.9 2.3 3.3 3.5 4 72017 15 5.0 ± 1.6 3.5 4 4.3 5.7 9.8
48 4.0 2.7 3.5 3.8 4.5 7.9
2017 39 3.1 ± 1.1 1.6 2.4 2.6 3.6 5.53.1 ± 1.1 1.6 2.4 2.6 3.6 5.5
2017 98 3.5 ± 1.2 1.5 2.7 3.2 4 9.73.5 ± 1.2 1.5 2.7 3.2 4.0 9.7
2017 38 1.7 ± 0.8 0.7 1.2 1.7 1.9 5.61.7 ± 0.8 0.7 1.2 1.7 1.9 5.6
2018 17 1.8 ± 0.6 0.3 1.7 2.0 2.2 2.52018 20 3.5 ± 1.2 1.5 2.7 3.6 4.2 5.72018 33 2.2 ± 1.6 0.3 0.5 2.1 3.0 6.42018 39 2.2 ± 1.3 0.0 1.4 2.4 2.9 5.62017 185 2.0 0.3 1.5 1.8 2.3 5.6
2.3 0.5 1.6 2.4 2.9 5.2
2018 40 5.8 ± 6.9 0.3 3.8 4.2 4.8 42.32017 106 5.1 ± 1.6 2.5 4 4.7 5.8 9.52018 8 5.6 ± 2.6 2.3 2.8 6.5 7.5 9.12018 67 4.8 ± 2.7 0.4 2.9 4.1 5.9 11.8
5.3 1.4 3.4 4.9 6.0 18.2
2017 25 2.6 ± 0.8 0.8 2.1 2.7 2.9 4.12.6 ± 0.8 0.8 2.1 2.7 2.9 4.1
Patés and meat spreads
Argentina [13]
Canadai
MEAN
Data presented as mean ± standard deviation. Sales weighted average (SWA). Data calculated as weighted average of: a Ham deli meat and turkey deli meat, b Packaged deli meats – dry cured, fermented, no thermal process, and meat sticks and jerky, c Sausages and salchichon, d Beef hotdogs and pork sausages, e Burgers, meatballs, and meat loaf, breaded meat and poultry, and chicken wings, f Hamburger, and breaded meat and poultry, g Cured and preserved meats, and ham; h Data presented as standard error of the mean; i Data acquired from the Food Label Information Program (FLIP) database for packaged food and beverage items for the corresponding country (unpublished).
Table 8.3 Sodium content for proposed Processed meat and poultry subcategories – mg/kcal
Year nAverage Sodium
(mg/kcal)
Sodium Percentiles (mg/kcal)
CanadaMEAN
Sausages – cookedCanada
Packaged deli meats – fully cookedCanadaMEAN
Packaged dry-cured deli meats – dry cured, fermented, no thermal process CanadaCanada
CanadaMEANAll data acquired from the Food Label Information Program (FLIP) database for packaged food and beverage items for the corresponding country; Data presented as mean ± standard deviation.
ArgentinaCanadaCosta RicaParaguayMEAN
Patés and meat spreads
Costa RicaParaguayPeruCanadaMEAN
Ham, canned meat and poultry, and uncooked, pickled, cured, and smoked meats that are not deli meats
MEAN
Uncooked bacon – bellyCanadaMEAN
Burgers, meatballs, meatloaf, and breaded meat and poultryArgentina
WEIGHTED MEAN
Sausages – uncooked

V. February 19, 2021
Table 9.1 Processed fish and seafood – Updated food subcategories and sodium reduction targets
US–FDA
Proposed 10-year Targets
(2026)[2]2024 [3] 2017 [3]
UK 2017 Targets met [4]
Min Median Max
9a- - Maximum 390 570 600 - 400 465 530 300 400 500- - Target 260 328 340 - 250 320 330
320 280 2.2 1.9
9b
- - Maximum 370 - - - - 570 - 300 400 500- - Target 310 - - - - 220 -
350 300 3.1 2.5
9c
- - Maximum 530 360 380 88% f 560 560 560 300 400 500- - Target 370 240 250 N/A 330 445 560
310 280 1.7 1.5
9d- - Maximum - - - - 1000 1015 1030 300 400 500- - Target - - - - 540 575 610
540 440 2.6 2.1
Average Sodium
(mg/100g) Min 10th 25th 50th 75th Max
2018 44 - 358 195 - 250 340 439 6492013 167 291 482 40 209 306 371 478 45112017 18 - 194 ± 35 112 - - - - 242
164 ± 61 289 116 117 278 355 458 1801
2013 30 459 ± 208 408 ± 168 125 224 247 420 528 690459 ± 208 408 ± 168 125 224 247 420 528 690
2013 12 425 ± 130 355 ± 113 248 248 290 323 368 5882013 50 763 ± 1906 740 ± 1679 100 199 259 343 472 8796
62 594 548 174 224 275 333 420 4692
2013, 2017 38 486 760 280 - 601 772 937 1218
2018 7 399 ± 197 562 ± 305 235 - 340 601 650 11522018 7 401 ± 186 777 ± 260 307 - 649 833 1000 10002018 2 288 ± 407 576 ± 814 1 - 1 576 1152 11522018 20 343 ± 298 491 ± 409 80 - 200 387 691 1786
383 633 181 - 358 634 886 1262
Min 25th 50th 75th Max
2017 53 2.4 ± 0.9 0.7 1.9 2.4 3.0 5.32.4 ± 0.9 0.7 1.9 2.4 3.0 5.3
2017 51 4.2 ± 2.7 0.4 2.3 3.6 5.8 12.8
4.2 ± 2.7 0.4 2.3 3.6 5.8 12.8
2017 143 3.6 ± 8.9 0.4 1.5 1.9 3.1 76.53.6 ± 8.9 0.4 1.5 1.9 3.1 76.5
2017 48 4.0 1.1 2.2 2.9 5.1 27.1
2018 7 3.7 ± 1.6 2.2 2.2 3.6 5.8 5.9
2018 7 4.7 ± 2.6 1.8 3.8 4.0 5.6 10.0
2018 2 2.9 ± 4.1 0.0 0.0 2.9 5.8 5.8
2018 20 2.4 ± 1.9 0.6 1.1 1.9 3.2 7.7
3.5 1.1 1.9 3.1 5.1 11.3
ArgentinaPeruCosta RicaMEAN
All data acquired from the Food Label Information Program (FLIP) database for packaged food and beverage items for the corresponding country; Data presented as mean ± standard deviation. a Canned tuna; b Calculated as weighted average of kippered fish and smoked fish subcategories.
a Proportion of products in 14-country study [1] meeting PAHO Regional Sodium Reduction Targets; b Mean sodium content calculated from available national sodium monitoring data (Tables 9.2 and 9.3); c Calculated as the average of relevant subcategories; d Data extracted from latest approved national sodium targets in Appendix 3a and may illustrate distinct subcategory targets; e Data extracted from final (proposed, accepted or implemented) national front-of-package "high in" or "excess" sodium thresholds for prepackaged foods in Appendix 3b; f Proportion of products at or below maximum.
Fish and seafood cakes, fingers or burgers, seasoned, and breaded or battered or with saucesCanada MEAN
Smoked, salted, pickled, and kippered fishCanadab
Paraguay
Canned fishCanadaa
MEAN
Frozen plain fish and seafood with added sodium phosphateCanada MEAN
MEAN
Data presented as mean ± standard deviation. Sales weighted average (SWA). a Calculated as weighted average of canned tuna, canned mackerel, and canned sardines subcategories; b Calculated as weighted average of canned tuna and other canned fish and seafood subcategories; c Canned tuna; d Seafood with sodium phosphate, e Fish or seafood cake or burger; f Seasoned or stuffed fish and seafood; g Data acquired from the Food Label Information Program (FLIP) database for packaged food and beverage items for the corresponding country (unpublished); h Calculated as weighted average of kippered fish and smoked fish subcategories.
Table 9.3 Sodium content for proposed processed fish and seafood subcategories – mg/kcal
Year nAverage Sodium
(mg/kcal)
Sodium Percentiles (mg/kcal)
Smoked, salted, pickled and kippered fishg
Canada [5]h
ParaguayArgentinaPeruCosta Rica
Canada [5]d
MEAN
Fish and seafood cakes, fingers or burgers, seasoned, and breaded or battered or with saucesCanada [5]e
Canada [5]f
WEIGHTED MEAN
Argentina [13]a
Canada [5]b
United States (SWA) [11]c
MEAN
Frozen plain fish and seafood with added sodium phosphate
Table 9.2 Sodium content for proposed processed fish and seafood subcategories – mg/100 g
Year nAverage Sodium
(mg/serving)
Sodium Percentiles (mg/100g)
CanadaLower Target
Updated Targets
1.9 3.1 5.1 2.6 2.1
Canned fish
Smoked, salted, pickled, and kippered fish (Data from 2013, 2017, 2018) (Data from 2017, 2018)
Regional Target358 634 886 539 444
800
Regional Target275 333 420 283 1.3 Canada, USA
Lower Target
Updated Targets
233 1.5 1.9 3.1 1.6270
CanadaLower Target
Updated Targets
2.3 3.6 5.8 3.1 2.5
Fish and seafood cakes, fingers or burgers, seasoned, and breaded or battered or with sauces
(Data from 2013) (Data from 2017)Ready meals and meal centres (includes
breaded fish)
Frozen plain fish and seafood with added sodium phosphate
(Data from 2013) (Data from 2017)
Regional Target247 420 528 357 294
N/A
Canned fish (Data from 2013, 2017, 2018) (Data from 2017)
United Kingdom Member State Targetsd
Lower Target
Updated Targets
1.9 2.4 3.0 2.0 1.7Regional Target
278 355 458 302 249 Canada, USA360
Median75th
Percentile 2022
Current Regional TargetsMean Sodium Content of Foods in the
Americas (mg/100 g)bSodium Targets (mg/100
g)Mean Sodium Content of Foods in the
Americas (mg/kcal)b Sodium Targets (mg/kcal) WHO National Sodium Reduction Targets (mg/100 g)c FOPL Thresholds (mg/100 g)e
2015 PAHO Targets
(mg/100 g)
2015 Targets met [1] a
25th Percentile 2025 Max
Countries with TargetsMedianmg/100 g Min25th Percentile Median
75th Percentile 2022 2025

V. February 19, 2021
Table 10.1 Soy products and meat alternatives – Updated food subcategories and sodium reduction targets
US–FDA
Proposed 10-year Targets
(2026)[2]2024 [3] 2017 [3]
UK 2017 Targets met [4]
Min Median Max
10a- - Maximum 320 475 500 68% f - 530 - 300 400 500- - Target 240 340 360 N/A - 100 -
350 320 2.0 1.7
10b- - Maximum 320 593 625 68% f 580 580 580 300 400 500- - Target 240 340 360 N/A 380 410 440
410 370 2.5 2.2
Average Sodium
(mg/100g) Min 10th 25th 50th 75th Max
2013 3 297 ± 51 340 ± 59 282 282 282 337 400 400297 ± 51 340 ± 59 282 117 282 337 400 400
2013 70 409 ± 132 524 ± 177 290 332 409 473 565 1020409 ± 132 524 ± 177 290 332 409 473 565 1020
Min 25th 50th 75th Max
2017 4 2.8 ± 1.4 1.7 1.7 2.4 3.8 4.62.8 ± 1.4 1.7 1.7 2.4 3.8 4.6
2017 68 3.2 ± 1.4 1.4 2.2 2.8 4.0 7.1
3.2 ± 1.4 1.4 2.2 2.8 4.0 7.1All data acquired from the Food Label Information Program (FLIP) database for packaged food and beverage items for the corresponding country; Data presented as mean ± standard deviation.
a Proportion of products in 14-country study [1] meeting PAHO Regional Sodium Reduction Targets; b Mean sodium content calculated from available national sodium monitoring data (Tables 10.2 and 10.3); c Calculated as the average of relevant subcategories; d Data extracted from latest approved national sodium targets in Appendix 3a and may illustrate distinct subcategory targets; e Data extracted from final (proposed, accepted or implemented) national front-of-package "high in" or "excess" sodium thresholds for prepackaged foods in Appendix 3b; f Proportion of products at or below maximum.
Seasoned tofu and tempehCanadaMEAN
Meat analogues and other meat alternativesCanada
MEAN
Data presented as mean ± standard deviation.
Table 10.3 Sodium content for proposed soy products and meat alternatives subcategories – mg/kcal
Year nAverage Sodium
(mg/kcal)
Sodium Percentiles (mg/kcal)
Seasoned tofu and tempehCanada [5]MEAN
Meat analogues and other meat alternativesCanada [5]MEAN
Table 10.2 Sodium content for proposed soy products and meat alternatives subcategories – mg/100 g
Year nAverage Sodium
(mg/serving
Sodium Percentiles (mg/100g)
Canada, USALower Target
Updated Targets
2.2 2.8 4.0 2.4 2.0
Meat analogues and other meat alternatives (Data from 2013) (Data from 2017)
Regional Target409 473 565 402 331
250
Min
CanadaLower Target
Updated Targets
1.7 2.4 3.8 2.0 1.7Regional Target
282 337 400 286 236280
Seasoned tofu and tempeh (Data from 2013) (Data from 2017)
Current Regional Targets
Mean Sodium Contents of foods in the Americas (mg/100 g)b
Sodium Targets (mg/100 g)
Mean Sodium Contents of foods in the Americas (mg/kcal)b WHO
mg/100 g25th Percentile Median75th
Percentile 2022
National Sodium Reduction Targets (mg/100 g)c FOPL Thresholds (mg/100 g)e
2015 PAHO Targets
(mg/100 g)
2015 Targets met [1] a
25th Percentile
Median75th
Percentile 2022 2025 2025
Sodium Targets (mg/kcal)
MaxCountries with Targets
United Kingdom
Median
Member State Targetsd

V. February 19, 2021
Table 11.1 Soups – Updated sodium reduction targets
US–FDA
Proposed 10-year Targets
(2026)[2]2024 [3] 2017 [3]
UK 2017 Targets met [4]
Min Median Max
11a360 59% Maximum 283 235 250 87% f 290 330 360 300 400 500306 43% Target 217 200 210 Yes g 230 235 240
260 230 9.2 7.7
11b430 82% Maximum 283 235 250 87% f 290 330 360 300 400 500360 55% Target 217 200 210 Yes g 230 235 240
330 275 5.2 4.9
Table 11.2 Sodium content for soups (overall) – mg/100 gAverage Sodium
(mg/100g) Min 10th 25th 50th 75th Max2015 79 204 ± 341 884 ± 1417 2 25 247 327 964 5900
2015 80 110 ± 86 310 ± 203 1 71 119 309 421 794
2015 81 101 ± 85 244 ± 125 35 71 154 205 366 439
2015 84 178 ± 144 417 ± 206 17 170 276 370 640 737
2015 17 35 ± 36 150 ± 139 15 30 86 94 124 460
2015 60 184 ± 169 548 ± 260 3 274 387 533 760 1368
2015 79 240 ± 195 422 ± 157 90 264 314 370 538 754
2015 90 190 ± 122 420 ± 407 0 181 251 329 421 3467
2015 80 129 ± 111 268 ± 230 12 19 35 193 412 796
2015 71 137 ± 112 341 ± 109 54 195 293 317 391 607
2015 31 95 ± 91 333 ± 143 205 230 257 295 306 766
2015 94 164 ± 110 339 ± 114 18 245 280 330 382 885
2015 98 203 ± 130 403 ± 176 43 189 281 372 527 771
2015 80 162 ± 128 355 ± 204 13 165 238 285 429 1053
2013 183 670 250 46 135 204 247 301 4812013 83 772 ± 14.5b 756 ± 8.2b 248 - - - - 2300
223 403 50 151 228 305 465 1349
Average Sodium
(mg/100g) Min 10th 25th 50th 75th Max
2013 77 647 ± 151 250 ± 57 128 186 194 248 298 399
2013 147 579 ± 204 228 ± 83 8 137 188 234 256 536
2013 54 675 ± 163 268 ± 81 5 168 243 260 310 463616 242 41 157 200 243 278 484
Average Sodium
(mg/100g) Min 10th 25th 50th 75th Max2018 9 - 488 ± 113 330 - 385 550 570 6252018 13 - 408 ± 67 308 - 351 406 448 5282018 4 - 299 ± 8 288 - 298 302 304 3062018 20 - 328 ± 157 173 - 238 305 342 9002017 93 - 233 ± 110 6 - - - - 6322017 44 - 1874 ± 124 1560 - - - - 2130
- 605 444 - 318 391 416 854
Min 25th 50th 75th Max2018 49 14.3 ± 9.6 1.6 10.0 12.4 15.3 70.6
2018 80 15.6 ± 14.4 2.7 6.6 12.1 17.1 84.0
2018 22 14.1 ± 5.6 5.2 10.2 13.0 15.6 26.3
2018 - - - - - - -
2017 253 6.9 ± 7.1 0.2 4.1 5.7 7.3 89.012.7 2.4 7.7 10.8 13.8 67.5
a Proportion of products in 14-country study [1] meeting PAHO Regional Sodium Reduction Targets; b Mean sodium content calculated from available national sodium monitoring data (Tables 11.2 to 11.6); c Calculated as the average of as consumed soup overall; d Data extracted from latest approved national sodium targets in Appendix 3a and may illustrate distinct subcategory targets; e Data extracted from final (proposed, accepted or implemented) front-of-package "high in" or "excess" sodium thresholds for prepackaged foods in Appendix 3b; f Proportion of products in 2018 at or below maximum; g Is proportion of products at or below maximum within 5% of average sodium target ("target").
Peru -
Canada 0.8%
MEAN N/A
Argentina 0%
Costa Rica 0%
Paraguay 0%
MEANData presented as mean ± standard deviation. Sales weighted average (SWA).
Table 11.5 Sodium content for wet and dry soups (as consumed) – mg/kcal
Year nAverage Sodium
(mg/kcal)
Sodium Percentiles (mg/kcal)Proportion below PAHO Nutrient Profile Model
threshold a
Argentina [7]Costa Rica [7]Paraguay [7]Peru [7]Canada [10]United States (SWA) [11]
WEIGHTED MEANData presented as mean ± standard deviation.
Table 11.4 Sodium content for noodles in broth (as consumed) – mg/100 g
Year nAverage Sodium
(mg/serving)
Sodium Percentiles (mg/100g)
Canned condensed soup (as consumed)Canada [5]Ready to serve soup (as consumed)Canada [5]Dry soup mixes (as consumed)Canada [5]
Table 11.3 Sodium content for wet and dry soups (as consumed) – mg/100 g
Year nAverage Sodium
(mg/serving)
Sodium Percentiles (mg/100g)
Trinidad and TobagoBarbados
Canada [5]a
United States [6]MEAN
All data was from Arcand J et al. Nutrients (2019) and represents 2015 data, unless otherwise indicated; Data presented as mean ± standard deviation. a Canadian data was calculated as the weighted average of as consumed soup subcategories; b Data presented as standard error of the mean.
GuatemalaJamaicaMexicoPanamaParaguayPeru
ArgentinaBrazilChileCosta RicaCubaEcuador
Year nAverage Sodium
(mg/serving)
Sodium Percentiles (mg/100g)
Argentina, Brazil, Canada, USALower Target
Updated Targets
4.9 5.5 6.6 4.7 3.9
Noodles in broth (as consumed) (Data from 2017, 2018) (Data from 2017, 2018)
Regional Target318 391 416 332 274
230
Argentina, Brazil, Canada, USALower Target
Updated Targets
7.7 10.8 13.8 9.2 7.6Regional Target
228 305 465 259 214253
Wet and dry soups (as consumed) (Data from 2013, 2015)c (Data from 2017, 2018)
2022 2025
United Kingdom
WHO National Sodium Reduction Targets (mg/100 g)c FOPL Thresholds (mg/100 g)e
2015 PAHO Targets (mg/100
g)
2015 Targets met [1] a 25th Percentile Median 75th Percentile 2022 2025
Current Regional TargetsMean Sodium Contents of foods in the
Americas (mg/100 g)b Sodium Targets (mg/100 g)Mean Sodium Contents of foods in the
Americas (mg/kcal)b Sodium Targets (mg/kcal)
25th Percentile Median75th
Percentile
Member State Targetsd
Min Median MaxCountries with Targets
mg/100 g
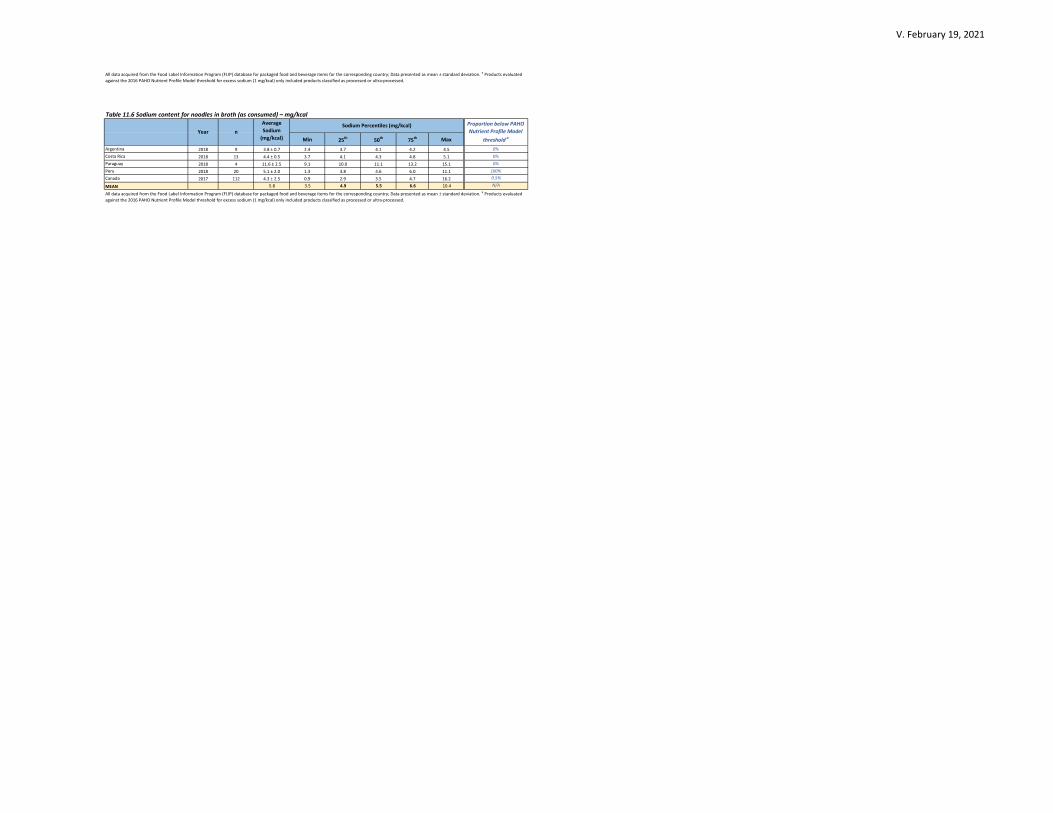
V. February 19, 2021
Min 25th 50th 75th Max
2018 9 3.8 ± 0.7 2.4 3.7 4.1 4.2 4.52018 13 4.4 ± 0.5 3.7 4.1 4.3 4.8 5.12018 4 11.6 ± 2.5 9.1 10.0 11.1 13.2 15.12018 20 5.1 ± 2.0 1.3 3.8 4.6 6.0 11.12017 112 4.3 ± 2.5 0.9 2.9 3.5 4.7 16.2
5.8 3.5 4.9 5.5 6.6 10.4
All data acquired from the Food Label Information Program (FLIP) database for packaged food and beverage items for the corresponding country; Data presented as mean ± standard deviation. a Products evaluated against the 2016 PAHO Nutrient Profile Model threshold for excess sodium (1 mg/kcal) only included products classified as processed or ultra-processed.
Peru 100%Canada 0.5%
MEAN N/A
Argentina 0%Costa Rica 0%Paraguay 0%
All data acquired from the Food Label Information Program (FLIP) database for packaged food and beverage items for the corresponding country; Data presented as mean ± standard deviation. a Products evaluated against the 2016 PAHO Nutrient Profile Model threshold for excess sodium (1 mg/kcal) only included products classified as processed or ultra-processed.
Table 11.6 Sodium content for noodles in broth (as consumed) – mg/kcal
Year nAverage Sodium
(mg/kcal)
Sodium Percentiles (mg/kcal) Proportion below PAHO Nutrient Profile Model
threshold a

V. February 19, 2021
Table 12.1 Ready-made foods, convenience foods, and mixed dishes – Updated food subcategories and sodium reduction targets
US–FDA
Proposed 10-year Targets
(2026)[2]2024 [3] 2017 [3]
UK 2017 Targets met [4]
Min Median Max
12a- - Maximum 350 - - - 330 330 330 300 400 500
- - Target 220 - - - 220 250 280
260 250 2.5 2.4
12b- - Maximum 350 - - - - 630 - 300 400 500
- - Target 220 - - - - 410 -
470 440 3.2 2.7
12c
Regional Target 640 92% Maximum350f 253 320 84% g,h 440 1140 1840 (instant
pasta/noodles, Brazil)300 400 500
Lower Target 440 88% Target220f 205 235 N/A 270 415 560
Updated Targets 330 300 1.9 1.7
12d
Regional Target 1921 98% Maximum 770 - - - - - - 300 400 500Lower Target 1333 88% Target 490 - - - - - -
Updated Targets 870 800 2.6 2.5
12e- - Maximum - - - - - 630 - 300 400 500
- - Target - - - - - 500 -
470 430 N/A N/A
12f
- - Maximum 450 475 500 87% g 610 610 610 300 400 500
- - Target 285 380 400 N/A 390 400 450
500 470 1.9 1.8
12g- - Maximum 517 450 475 N/A 610 610 610 300 400 500
- - Target 327 298 315 N/A 390 400 450
500 470 1.9 1.8
12h
- - Maximum 290 355 380 88% g 340 420 500 300 400 500
- - Target 180 258 250 No 220 300 400
575 480 1.7 1.5
Average Sodium
(mg/100g) Min 10th 25th 50th 75th Max
2013 21 737 ± 130 293 ± 75 177 196 252 272 316 437737 ± 130 293 ± 75 177 196 252 272 316 437
2013 7 940 ± 283 519 ± 94 439 439 439 500 580 700940 ± 283 519 ± 94 439 439 439 500 580 700
2013 293 540 293 80 - 243 279 335 7122018 19 - 360 ± 82 233 - 286 359 440 4642018 120 497 ± 422 545 ± 513 0 513 513 513 513 2035
519 399 104 513 347 384 429 1070
2017 108 438 ± 171 968 ± 379 320 - 702 900 1163 23502018 7 - 1453 ± 777 841 - 899 969 1981 2599
- 1210 581 - 801 935 1572 2475
2013 16 574 ± 276 488 ± 126 151 350 433 496 600 756574 ± 276 488 ± 126 151 350 433 496 600 756
2018 21 - 709 178 - 562 611 844 1332
2016 51 - 483 ± 119 272 - 407 473 547 934
2013 54 571 ± 135 488 ± 89 338 376 430 481 542 716
2013 5 - 574 ± 6.9d - - - - - -
571 ± 135 564 263 376 466 522 644 994
2018 140 - 1040 21 - 732 1044 1445 2222
2013 779 554 ± 261 348 ± 168 18 189 231 317 421 12142016 424 - 2246 ± 4314 - - - - - -
- 1205 20 - 482 681 933 1718
Min 25th 50th 75th Max
2017 13 3.0 ± 1.1 2.0 2.4 2.7 3.0 6.43.0 ± 1.1 2.0 2.4 2.7 3.0 6.4
2017 20 3.7 ± 1.1 1.9 2.7 3.8 4.4 6.0
Canned chiliCanadaMEAN
Canned stew and meatballs Canada
Table 12.3 Sodium content for proposed ready-made foods, convenience foods, and mixed dishes subcategories – mg/kcal
Year nAverage Sodium
(mg/kcal)
Sodium Percentiles (mg/kcal)
Refrigerated or frozen appetizers, sides, and entrées
Argentina [13]e
Canada [5]
Colombia [15]f
MEAN
Data presented as mean ± standard deviation. Sales weighted average (SWA). a Calculated as weighted average of pasta and noodles with sauce, and seasoned rice and grains subcategories; b Data acquired from the Food Label Information Program (FLIP) database for packaged food and beverage items for the corresponding country (unpublished); c Data available only as combined category; d
Presented as standard error of the mean; e Calculated as weighted average of appetizers, ready-made meals, and pre-cooked meals categories; f Convenience foods (e.g., ready to eat foods, which may also include pizza).
Pizza, pizza snacks, and frozen sandwichesc
Argentina [13]
Mexico [12]
Canada [5]
United States [6]
MEAN
Canadab
Argentina [7]MEAN
Stuffing mixes (as consumed)Canada [5]MEAN
Pasta, noodles, and rice or grains with sauce or seasonings (as consumed)
Canada [5]a
Costa Rica [7]Paraguay [7]MEAN
Pasta, noodles, rice or grains with sauce or seasonings (dry mix, as sold)
Canned chiliCanada [5]MEAN
Canned stew and meatballs Canada [5]MEAN
Table 12.2 Sodium content for proposed ready-made foods, convenience foods, and mixed dishes subcategories – mg/100 g
Year nAverage Sodium
(mg/serving)
Sodium Percentiles (mg/100g)
a Proportion of butter products in 14-country study [1] meeting PAHO Regional Sodium Reduction Targets; b Mean sodium content calculated from available national sodium monitoring data (Tables 12.2 and 12.3); c Targets calculated as the average of relevant subcategories; d Data extracted from latest approved national sodium targets in Appendix 3a and may illustrate distinct subcategory targets; e Data extracted from final (proposed, accepted or implemented) national front-of-package "high in" or "excess" sodium thresholds for prepackaged foods in Appendix 3b; f Targets for shelf stable canned meals, e.g. pasta in sauce with or without meat, chili, and baked beans with or without meat; g Proportion of products at or below maximum; h Average of flavored rice, as consumed and pasta and noodles, plain and flavored.
Canada, USALower Target
Updated Targets
1.5 1.9 2.5 1.6 1.3
Refrigerated or frozen appetizers, sides, and entrées (Data from 2017)
Regional Target482 681 933 578 476
320
Regional Target466 522 644 443 365 Canada, USA
Lower Target
Updated Targets
1.8 2.1 2.5 1.8 1.5430
Canada, USALower Target
Updated Targets
1.8 2.1 2.5 1.8 1.5
Sandwiches (Data from 2013, 2016, 2018) (Data from 2017)
Pizza and pizza snacks (Data from 2013, 2016, 2018) (Data from 2017)
Regional Target466 522 644 443 365
450
CanadaLower Target
Updated Targets
- - - - -Regional Target
433 496 600 422 347N/A
N/A
Stuffing mixes (as consumed) (Data from 2013)
2.5 2.8 5.5 2.4 2.02015 pasta and noodles (dry, uncooked) PAHO target
801 935 1572 794 654770
Brazil, Canada
Pasta, noodles, and rice or grains with sauce or seasonings (dry mix, as sold)
(Data from 2017, 2018) (Data from 2018)
1.7 2.1 2.8 1.8 1.4
Pasta, noodles, and rice or grains with sauce or seasonings (as consumed)
(Data from 2013, 2018) (Data from 2017, 2018)
2015 pasta and noodles (as consumed) PAHO target
347 384 429 326 269230
Regional Target439 500 580 425 350 Canada
Lower Target
Updated Targets
2.7 3.8 4.4 3.2 2.7225
Canada, USALower Target
Updated Targets
2.4 2.7 3.0 2.3 1.9
Canned stew and meatballs (Data from 2013) (Data from 2017)
2022 2025
Canned chili (Data from 2013) (Data from 2017)
Regional Target252 272 316 231 190
N/A
mg/100 g
Current Regional Targets
Mean Sodium Content of Foods in the Americas (mg/100 g)b Sodium Targets (mg/100 g)
Mean Sodium Content of Foods in the Americas (mg/kcal)b
Sodium Targets (mg/kcal)
WHO National Sodium Reduction Targets (mg/100 g)c FOPL Thresholds (mg/100 g)e
2015 PAHO Targets
(mg/100 g)
2015 Targets met [1] a
25th Percentile Median 75th Percentile 2022 2025 25th Percentile
United Kingdom Member State Targetsd
Min Median MaxCountries with Targets
Median 75th Percentile

V. February 19, 2021
3.7 ± 1.1 1.9 2.7 3.8 4.4 6.0
2017 148 2.4 ± 0.8 0.0 1.8 2.2 2.7 5.22018 18 2.1 ± 0.7 1.2 1.7 1.9 2.7 3.42018 201 2.2 ± 1.4 0.0 1.5 2.1 2.9 7.2
2.2 0.4 1.7 2.1 2.8 5.3
2018 7 3.8 ± 1.5 2.4 2.5 2.8 5.5 5.93.8 ± 1.5 2.4 2.5 2.8 5.5 5.9
- - - - - - - -
- - - - - -
2017 204 2.1 ± 0.5 1.1 1.8 2.1 2.5 4.32.1 ± 0.5 1.1 1.8 2.1 2.5 4.3
2017 553 2.1 0.2 1.5 1.9 2.5 8.82.1 0.2 1.5 1.9 2.5 8.8
CanadaMEAN
Refrigerated or frozen appetizers, sides and entrées
Canadaa
MEAN
All data acquired from the Food Label Information Program (FLIP) database for packaged food and beverage items for the corresponding country; Data presented as mean ± standard deviation. a Calculated as weighted average of Refrigerated or frozen appetizers/sides/entrees with a serving size greater than 170g, and less than 170g.
Argentina [7]MEAN
Stuffing mixes (as consumed)N/A
MEAN
Pizza, pizza snacks, and frozen sandwiches
Pasta, noodles, and rice or grains with sauce or seasonings (as consumed) Canada
Costa RicaParaguayMEAN
Pasta, noodles, and rice or grains with sauce or seasonings (dry mix, as sold)
MEAN

V. February 19, 2021
Table 13.1 Fresh or dried plain pasta and noodles – Updated sodium reduction targets
US–FDA
Proposed 10-year Targets
(2026)[2]2024 [3] 2017 [3]
UK 2017 Targets met [4]
Min Median Max
13a
- - Maximum - 230 350 94% f - - - 300 400 500- - Target - 170 200 N/A - - -
0 0 0.0 0.0
Average Sodium
(mg/100g) Min 10th 25th 50th 75th Max2018 168 - 78 ± 266 0 - 0 0 3 20402018 432 - 140 ± 416 0 - 0 10 35 26662013 432 22 ± 80 23 ± 83 0 - 0 1 6 912
22 ± 80 80 0 - 0 4 15 1873
Min 25th 50th 75th Max2018 166 0.2 ± 0.8 0.0 0.0 0.0 0.0 5.12018 433 0.4 ± 1.1 0.0 0.0 0.0 0.1 6.12017 437 0.1 ± 0.4 0.0 0.0 0.0 0.0 5.3
0.2 0.0 0.0 0.0 0.0 5.5MEAN N/A
All data acquired from the Food Label Information Program (FLIP) database for packaged food and beverage items for the corresponding country; Data presented as mean ± standard deviation. a Products evaluated against the 2016 PAHO Nutrient Profile Model threshold for excess sodium (1 mg/kcal) included only products classified as processed or ultra-processed.
a Proportion of butter products in 14-country study [1] meeting PAHO Regional Sodium Reduction Targets; b Mean sodium content calculated from available national sodium monitoring data (Tables 13.2 and 13.3); b Data extracted from latest approved national sodium targets in Appendix 3a and may illustrate distinct subcategory targets; c Data extracted from final (proposed, accepted or implemented) national Front-of-Package "high in" or "excess" sodium thresholds for prepackaged foods in Appendix 3b; f Proportion of products at or below maximum.
Costa Rica 92.8%
Paraguay 88.7%
Canada 96.8%
Year nAverage Sodium
(mg/kcal)
Sodium Percentiles (mg/kcal)Proportion below PAHO Nutrient Profile Model
threshold a
Table 13.3 Sodium content for plain pasta and noodles (as consumed or dry, uncooked) – mg/kcal
Table 13.2 Sodium content for p lain pasta and noodles (as consumed or dry, uncooked) – mg/100 g
Year nAverage Sodium
(mg/servin
Sodium Percentiles (mg/100g)
Costa Rica [7]Paraguay [7]
Canadaa
MEAN
Data presented as mean ± standard deviation. a Data acquired from the Food Label Information Program (FLIP) database for packaged food and beverage items for the corresponding country (unpublished).
N/ALower Target
Updated Targets
0.0 0.0 0.0 0.0 0.0Regional Target
0 4 15 3 3N/A
(Pasta and noodles, plain and flavoured)
Member State Targetsd
Min Median MaxCountries with
Targets
National Sodium Reduction Targets (mg/100 g)c FOPL Thresholds (mg/100 g)e
2015 PAHO Targets
(mg/100 g)
2015 Targets met [1] a
25th Percentile
Median75th
Percentile 2022 2025
Sodium Targets (mg/kcal)
2022 2025
United Kingdom
mg/100 g
WHO
Plain pasta and noodles (as consumed or dry, uncooked)
(Data from 2013, 2018) (Data from 2017, 2018)
Current Regional TargetsMean Sodium Content of Foods in
the Americas (mg/100 g)b Sodium Targets (mg/100 g)Mean Sodium Content of Foods in
the Americas (mg/kcal)b
25th Percentile
Median75th
Percentile

V. February 19, 2021
US - FDA
Proposed 10-year Targets
(2026)[2]2024 [3] 2017 [3]
UK 2017 Targets met [4]
Min Median Max
14a- - Maximum 310 - - - - 340 - 300 400 500- - Target 190 - - - - 180 -
170 150 0.5 0.4
14b- - Maximum 430 - - - - 430 - 300 400 500- - Target 300 - - - 300 320 340
330 300 0.3 0.2
Table 14.2 Sodium content for proposed granola and energy bars, and nut butters/spreads subcategories – mg/100 gAverage Sodium
(mg/100g) Min 10th 25th 50th 75th Max
2018 40 - 160 0 - 105 159 194 604
2013 200 83 ± 36 254 ± 99 16 150 187 243 304 5532017 - - 407 - - - - - -
83 ± 36 274 8 150 146 201 249 579
2013 35 54 ± 17 343 ± 114 109 188 300 357 433 66754 ± 17 343 ± 114 109 188 300 357 433 667
Table 14.3 Sodium content for proposed granola and energy bars, and nut butters/spreads subcategories – mg/kcal
Min 25th 50th 75th Max
2017 400 0.6 ± 0.3 0.0 0.3 0.6 0.8 1.90.6 ± 0.3 0.0 0.3 0.6 0.8 1.9
2017 101 0.4 ± 0.5 0.0 0.0 0.3 0.6 4.0
0.4 ± 0.5 0.0 0.0 0.3 0.6 4.0All data acquired from the Food Label Information Program (FLIP) database for packaged food and beverage items for the corresponding country; Data presented as mean ± standard deviation.
a Proportion of butter products in 14-country study [1] meeting PAHO Regional Sodium Reduction Targets; b Mean sodium content calculated from available national sodium monitoring data (Tables 14.2 and 14.3); c Calculated as the average of relevant subcategories; d Data extracted from latest approved national sodium targets in Appendix 3a and may illustrate distinct subcategory targets; e Data extracted from final (proposed, accepted or implemented) national front-of-package "high in" or "excess" sodium thresholds for prepackaged foods in Appendix 3b.
Granola, cereal, and energy barsCanadaMEAN
Nut butters and nut spreadsCanada MEAN
Canada [5] MEAN
Data presented as mean ± standard deviation. Sales weighted average (SWA). a Cereal bars; b Sweet and salty bars.
Year nAverage Sodium
(mg/kcal)
Sodium Percentiles (mg/kcal)
Nut butters and nut spreads
Year nAverage Sodium
(mg/serving)
Sodium Percentiles (mg/100g)
Granola, cereal, and energy barsArgentina [13]a
Canada [5]
Canada (SWA) [14]b
MEAN
Canada, USALower Target
Updated Targets
0.0 0.3 0.6 0.3 0.2
Nut butters and nut spreads (Data from 2013) (Data from 2017)
Regional Target300 357 433 303 250
0.4Regional Target
146 201 249 171
Updated Targets
0.3 0.6 0.8 0.5
MaxCountries with Targets
Granola, cereal, and energy bars (Data from 2013, 2017, 2018) (Data from 2017)
FOPL Thresholds (mg/100 g)e
2015 PAHO Targets
(mg/100 g)
2015 Targets met [1] a
25th Percentile
Median75th
Percentile 2022 2025 25th Percentile75th
Percentile 2022 2025
United Kingdom Member State Targetsd
Min Median
N/A
N/A
Table 14.1 Granola and energy bars, and nut butters/spreads – Updated food subcategories and sodium reduction targetsCurrent Regional
TargetsMean Sodium Content of Foods in the
Americas (mg/100 g)bSodium Targets (mg/100
g)Mean Sodium Content of Foods in the
Americas (mg/kcal)bSodium Targets
(mg/kcal)WHO National Sodium Reduction Targets (mg/100 g)c
Median mg/100 g
141 CanadaLower Target

V. February 19, 2021
Table 15.1 Fats and oils – Updated food subcategories and sodium reduction targets
US–FDA
Proposed 10-year Targets
(2026)[2]2024 [3] 2017 [3]
UK 2017 Targets met [4]
Min Median Max Countries with Targets
15a800 84% Maximum 655 568 610 76% g 800 800 800 300 400 500
500 37% Target 480 445 488 - 480 510 570
510 460 0.8 0.7
15b1050 94% Maximum 610 500 500 67% g 833 840 1051 300 400 500
670 38% Target 450 - - - 530 550 570
670 600 2.3 1.9
15c- - Maximum 920 570 600 77% g 1130 1130 1130 300 400 500- - Target 590 - - - 690 725 760
800 730 2.3 1.9
Average Sodium
(mg/100g) Min 10th 25th 50th 75th Max
2015 23 21 ± 23 199 ± 228 0 20 45 120 230 7202015 50 71 ± 27 710 ± 267 170 396 563 705 853 17502015 50 39 ± 18 545 ± 221 9 280 415 571 617 11712015 43 125 ± 302 553 ± 362 0 86 368 600 679 20002015 1 36 ± 0 511 ± 0 511 511 511 511 511 5112015 32 103 ± 186 732 ± 1330 0 0 27 500 946 76362015 68 84 ± 66 672 ± 681 0 14 428 705 785 42002015 30 79 ± 42 595 ± 251 0 348 525 625 714 10002015 46 30 ± 72 297 ± 259 0 10 159 200 495 10202015 51 84 ± 37 594 ± 258 0 0 595 640 750 9302015 17 48 ± 34 484 ± 339 96 132 200 470 670 11102015 18 141 ± 179 1079 ± 1238 20 120 413 786 1173 50002015 28 281 ± 366 781 ± 400 0 459 573 714 841 17332015 50 82 ± 53 564 ± 286 0 200 473 620 710 17902013 19 67 ± 18 664 ± 188 71 550 600 600 800 950
86 599 58 208 393 558 718 2101
2017 46 - 544 ± 207 10 - - 600 - 10702016 22 - 586 ± 182 400 - 440 530 735 9202013 49 65 ± 9 653 ± 93 300 600 600 650 700 850
65 ± 9 594 237 600 520 593 718 947
OVERALL MEAN 76 597 148 404 457 576 718 1524
Average Sodium
(mg/100g) Min 10th 25th 50th 75th Max2015 18 107 ± 26 856 ± 145 558 622 786 903 948 10672015 33 107 ± 24 881 ± 208 375 545 792 975 1025 11002015 30 96 ± 25 759 ± 187 400 547 627 769 921 10312015 34 114 ± 26 754 ± 162 373 493 617 833 867 9332015 6 80 ± 33 525 ± 140 354 374 413 531 633 6962015 26 106 ± 142 559 ± 206 11 393 438 539 643 11332015 29 101 ± 37 702 ± 272 36 469 533 733 867 12502015 11 84 ± 27 571 ± 165 333 393 393 633 706 7672015 37 176 ± 182 763 ± 186 505 551 600 733 867 5052015 25 105 ± 25 745 ± 213 370 490 627 770 870 14002015 18 109 ± 16 915 ± 120 610 741 883 942 988 10752015 20 107 ± 58 789 ± 388 96 344 598 733 1000 20002015 20 88 ± 43 594 ± 298 0 303 400 647 713 14002015 30 105 ± 30 826 ± 626 500 518 600 670 800 40002013 124 129 ± 38 834 ± 225 267 533 656 833 1000 14672013 4 - 779 ± 4b 518 - - - - 1060
108 741 332 488 598 750 857 1305
BarbadosCanada[5]
United States[6]a
MEAN
All data was from Arcand J et al. Nutrients (2019) and represents 2015 data, unless otherwise indicated; Data presented as mean ± standard deviation. a Mayonnaise and salad dressing; b
Data presented as standard error of the mean.
JamaicaMexicoPanamaParaguayPeruTrinidad and Tobago
BrazilChileCosta RicaCubaEcuadorGuatemala
Year nAverage Sodium
(mg/servin)
Sodium Percentiles (mg/100g)
Argentina
Brazil [9]Mexico [12]Canada [5]MEAN
Data presented as mean ± standard deviation. a Data from Arcand J et al. Nutrients (2019)[1] unless otherwise indicated.
Table 15.3 Sodium content for mayonnaise – mg/100 g
PeruTrinidad and TobagoBarbadosCanada [5]MEANSalted margarine
EcuadorGuatemalaJamaicaMexicoPanamaParaguay
Salted buttera
ArgentinaBrazilChileCosta RicaCuba
Table 15.2 Sodium content for salted butter, margarine, and butter blends – mg/100 g
Year nAverage Sodium
(mg/servin)
Sodium Percentiles (mg/100g)
Regional Target736 909 1280 772 636
a Proportion of butter products in 14-country study [1] meeting PAHO Regional Sodium Reduction Targets; b Mean sodium content calculated from available national sodium monitoring data (Tables 15.2 to 15.9); c Calculated as the average of relevant subcategories; d Data extracted from latest approved national sodium targets in Appendix 3a and may illustrate distinct subcategory targets; e Data extracted from final (proposed, accepted or implemented) national front-of-package "high in" or "excess" sodium thresholds for prepackaged foods in Appendix 3b; f Calculated as the average of butter and margarine/other spreads subcategories (See Table 15.2); g Proportion of products at or below maximum.
Canada, USALower Target
Updated Targets
0.6 2.7 5.1 2.3 1.9500
Argentina, Brazil, Canada, USALower Target
Updated Targets
1.8 2.7 3.6 2.3 1.9
Salad dressing and vinaigrette (Data from 2017, 2018) (Data from 2017, 2018)
Mayonnaise (Data from 2013, 2015) (Data from 2017, 2018)
Regional Target598 750 857 637 525
500
Brazil, Canada, USALower Target
Updated Targets
0.5 1.0 1.5 0.8 0.7Regional Target
457 576 718 490 403400
Salted butter, margarine, and butter blends (Data from 2013, 2015)f (Data from 2017, 2018)
2022 2025
United Kingdom
WHO National Sodium Reduction Targets (mg/100 g)c FOPL Thresholds (mg/100 g)e
2015 PAHO Targets
(mg/100 g)
2015 Targets met [1] a
25th Percentile Median
75th Percentile 2022 2025
Current Regional TargetsMean Sodium Content of Foods in
the Americas (mg/100 g)bSodium Targets
(mg/100 g)Mean Sodium Content of Foods in
the Americas (mg/kcal)bSodium Targets
(mg/kcal)
25th Percentile Median
75th Percentile
Member State Targetsd
Min Median Maxmg/100 g

V. February 19, 2021
Average Sodium
(mg/100g) Min 10th 25th 50th 75th Max
2013 167 146 ± 67 864 ± 381 12 406 688 867 1000 26002018 168 - 1493 0 - 783 950 1559 7333
146 ± 67 1179 6 406 736 909 1280 4967
Min 25th 50th 75th Max2018 38 0.5 ± 0.5 0.0 0.1 0.4 0.9 2.0
2018 44 1.2 ± 0.7 0.0 0.8 1.2 1.7 2.82018 40 1.6 ± 2.1 0.0 0.2 0.8 1.6 6.12018 18 1.6 ± 1.4 0.0 0.7 1.5 2.0 5.72017 61 1.0 ± 0.3 0.5 0.9 1.0 1.1 2.0
1.2 0.1 0.5 1.0 1.5 3.7
Min 25th 50th 75th Max2018 19 0.2 ± 0.3 0.0 0.1 0.1 0.2 1.22018 13 0.7 ± 0.6 0.0 0.1 0.7 1.0 1.82018 14 0.2 ± 0.2 0.0 0.0 0.1 0.2 0.82018 9 0.8 ± 0.9 0.0 0.0 0.7 1.7 2.12017 28 1.0 ± 0.2 0.6 0.8 1.0 1.1 1.7
0.6 0.1 0.2 0.5 0.8 1.5
Min 25th 50th 75th Max2018 19 0.9 ± 0.5 0.0 0.4 0.8 1.3 2.02018 31 1.5 ± 0.6 0.4 1.1 1.3 2.0 2.82018 26 2.4 ± 2.3 0.0 0.8 1.2 5.4 6.12018 9 2.3 ± 1.5 1.3 1.4 1.6 2.0 5.72017 33 1.1 ± 0.4 0.5 0.9 1.0 1.1 2.0
1.6 0.4 0.9 1.2 2.4 3.7
Min 25th 50th 75th Max2018 35 3.4 ± 1.2 1.6 2.7 3.2 4.1 7.8
2018 32 3.0 ± 3.0 0.8 1.3 2.3 3.4 17.7
2018 55 3.8 ± 1.5 0.6 2.7 4.0 4.1 7.2
2018 13 2.7 ± 2.6 0.0 0.8 1.8 3.4 8.5
2017 188 2.3 ± 1.4 0.2 1.3 2.0 2.9 9.53.0 0.6 1.8 2.7 3.6 10.1
Min 25th 50th 75th Max
2018 115 5.0 ± 10.8 0.0 0.1 2.5 4.2 94.22018 35 4.4 ± 4.0 0.0 1.6 3.4 7.5 20.02017 235 3.2 ± 5.9 0.0 0.1 2.1 3.5 41.7
4.2 0.0 0.6 2.7 5.1 52.0
Salad dressing and vinaigretteCosta RicaParaguayCanadaMEANAll data acquired from the Food Label Information Program (FLIP) database for packaged food and beverage items for the corresponding country; Data presented as mean ± standard deviation. a Includes tomato-based pasta/pizza sauce; b Cream sauce; c Tomato sauce and puree; d Dips and salsa; e Hummus and legume-based dips; f Gravy and cooking sauces; g Data for condiments subcategory (may include mustard).
All data acquired from the Food Label Information Program (FLIP) database for packaged food and beverage items for the corresponding country; Data presented as mean ± standard deviation. a Products evaluated against the 2016 PAHO Nutrient Profile Model threshold for excess sodium (1 mg/kcal) included only products classified as processed or ultra-processed.
Table 15.9 Sodium contents for salad dressing and vinaigrette – mg/kcal
Year nAverage Sodium
(mg/kcal)
Sodium Percentiles (mg/kcal)
Peru 100%
Canada 19.1%
MEAN N/A
Argentina 0%
Costa Rica 12.5%
Paraguay 1.8%
All data acquired from the Food Label Information Program (FLIP) database for packaged food and beverage items for the corresponding country; Data presented as mean ± standard deviation. a Salted margarine.
Table 15.8 Sodium content for mayonnaise – mg/kcal
Year nAverage Sodium
(mg/kcal)
Sodium Percentiles (mg/kcal) Proportion below PAHO Nutrient Profile Model
ArgentinaCosta RicaParaguayPeru
Canadaa
MEAN
All data acquired from the Food Label Information Program (FLIP) database for packaged food and beverage items for the corresponding country; Data presented as mean ± standard deviation. a Salted butter and butter blends.
Table 15.7 Sodium content for salted margarine – mg/kcal
Year nAverage Sodium
(mg/kcal)
Sodium Percentiles (mg/kcal)
ArgentinaCosta RicaParaguayPeru
Canadaa
MEAN
All data acquired from the Food Label Information Program (FLIP) database for packaged food and beverage items for the corresponding country; Data presented as mean ± standard deviation. a Products evaluated against the 2016 PAHO Nutrient Profile Model threshold for excess sodium (1 mg/kcal) included only products classified as processed or ultra-processed.
Table 15.6 Sodium content for salted butter – mg/kcal
Year nAverage Sodium
(mg/kcal)
Sodium Percentiles (mg/kcal)
Peru 88.9%
Canada 59%
MEAN N/A
Proportion below PAHO Nutrient Profile Model
Argentina 78.9%
Costa Rica 38.6%
Paraguay 95%
Canada [5]Argentina [13]MEAN
Data presented as mean ± standard deviation. Sales weighted average (SWA). a Includes tomato-based pasta/pizza sauce, cream sauce, and pesto subcategories; d Canadian data was calculated as the weighted average of dips and salsa, hummus, and legume-based dips, and gravy and cooking sauces subcategories; e Sauces, dressings, and spreads; f Data for condiments subcategory (includes mustard).
Table 15.5 Sodium content for salted butter and margarine (overall) – mg/kcal
Year nAverage Sodium
(mg/kcal)
Sodium Percentiles (mg/kcal)
Year nAverage Sodium
(mg/servin
Sodium Percentiles (mg/100g)
Salad dressing and vinaigrette
Table 15.4 Sodium content for salad dressing and vinaigrette – mg/100 g

V. February 19, 2021
Table 16.1 Sauces, dips, gravy, and condiments – Updated food subcategories and sodium reduction targets
US–FDA
Proposed 10-year Targets
(2026)[2]2024 [3] 2017 [3]
UK 2017 targets met
[4]Min Median Max
16a20500 62% Maximumf 390 360 380 89% g 360 635 1025 (20500 - dry mix) 300 400 500
18000 37% Targetf 280 285 300 No h 240 250 260
18000 16000 68.0 56.0
16b- - Maximum 500 330 370 83% g 520 568 616 300 400 500
- - Target 305 270 300 Yes h 320 365 410
330 300 4.5 4.0
16c- - Maximum 640 620 650 68% g - 1160 - 300 400 500
- - Target 450 520 550 N/A - 770 -
800 640 1.9 1.5
16d- - Maximum 570 - - - 490 490 490 300 400 500
- - Target 370 - - - 250 290 330
300 240 5.7 4.7
16e
- - Maximum 1050b 650 680 62% g 980 990 1400 300 400 500
- - Target 760b - - - 660 770 860
800 780 7.1 6.8
16f- - Maximum 1050 720 - - 1400 1400 1400 300 400 500
- - Target 760 - - - 660 760 860
1000 890 10.2 8.6
16g Condiments
- - Maximum 1050 1288 1500 - - 3300 - 300 400 500
- - Target 760 1235 1300 - - 1300 -
1100 900 21.4 17.7
16h
- - Maximum 627 365 410 87% g 670 670 670 300 400 500
- - Target 446 303 340 N/A 400 465 530
350 300 3.5 2.8
16i- - Maximum 1690 1150 - - - 350 - 300 400 500
- - Target 700 - - - - 100 -
220 180 1.3 1.1
16j- - Maximum 5870 - - - - 4300 - 300 400 500
- - Target 4250 - - - - 2300 -
2900 2400 9.9 8.1
16k- - Maximum - - - - - 3000 - 300 400 500
- - Target - - - - - 1800 -
1800 1500 14.2 11.7
16l33100 96% Maximum 19800 - - - 9100 26926 33100 300 400 500
9100 73% Target 9800 - - - - 5100 -
10000 8000 13.1 10.8
16m23000 89% Maximum 19800 - - - 23000 23000 23000 300 400 500
21775 88% Target 9800 - - - - 12700 -
10000 8000 27.9 23.0
Average Sodium
(mg/100g) Min 10th 25th 50th 75th Max
2013 228 413 ± 141 430 ± 292 70 248 292 372 468 3600413 ± 141 430 ± 292 70 248 292 372 468 3600
2013 15 369 ± 223 916 ± 377 267 283 570 956 1267 1400369 ± 223 916 ± 377 267 283 570 956 1267 1400
2013 17 272 ± 193 297 ± 177 15 23 231 308 385 7362018 93 - 462 ± 265 0 - - 393 - 1857
272 ± 193 380 8 23 231 351 385 1297
2013 20 132 ± 36 877 ± 237 300 533 783 933 1000 14002018 19 - 685 ± 337 140 - - 627 - 11872017 18 - 897 ± 28 860 - - 897 - 981
132 ± 36 820 433 533 783 819 1000 1189
2013 446 289 537 28 286 368 490 640 20462018 46 - 348 0 - 214 335 400 13202016 636 - 1108 ± 1491 - - - - - -
289 664 14 286 291 413 520 1683
2013 29 163 ± 114 429 ± 350 90 100 181 250 560 1421163 ± 114 429 ± 350 90 100 181 250 560 1421
FOPL Thresholds (mg/100 g)e
2015 PAHO Targets
(mg/100 g)
2015 Targets met [1] a 25th Percentile Median
75th Percentile 2022 2025
Current Regional TargetsMean Sodium Content of Foods in the
Americas (mg/100 g)bSodium Targets (mg/100
g)Mean Sodium Content of Foods
in the Americas (mg/kcal)b Sodium Targets (mg/kcal)
25th Percentile
Median75th
Percentile 2022 Median MaxCountries with Targets
Min
Bouillon cubes and powders (as sold) (Data from 2017, 2018) (Data from 2017, 2018) (as consumed)
2025
United Kingdom Member State Targetsd
WHO National Sodium Reduction Targets (mg/100 g)c
mg/100 g
Argentina, Brazil, Canada, Costa Rica (dry-mix), USALower Target
Updated TargetsPasta sauce (Data from 2013) (Data from 2017)
34.8 80.0 97.0 68.0 56.0Regional Target
15869 14679 22237 12477 1027515000
Canada, Costa Rica, USALower Target
Updated TargetsPesto (Data from 2013) (Data from 2017)
4.0 5.1 6.1 4.3 3.6Regional Target
292 372 468 316 260330
CanadaLower Target
Updated TargetsTomato sauce (Data from 2013, 2018) (Data from 2017)
1.2 2.2 3.9 1.9 1.5Regional Target
570 956 1267 813 669650
Canada, USALower Target
Updated TargetsKetchup and similar tomato-type condiments (as consumed)
(Data from 2013, 2017, 2018) (Data from 2017)
3.5 6.7 10.0 5.7 4.7Regional Target
231 351 385 298 245230
Argentina, Canada, Costa Rica, USA Lower Target
Updated TargetsMustard (Data from 2017, 2018) (Data from 2017, 2018)
6.8 7.5 11.0 6.4 5.3Regional Target
783 819 1000 696 573650
Canada, USALower Target
Updated TargetsSpicy sauce (Data from 2017, 2018) (Data from 2017, 2018) Chilli sauce, Thick pastes Curry paste
8.6 11.8 16.7 10.0 8.3Regional Target
886 1150 1634 978 805650
CanadaLower Target
Updated Targets
Gravy, cooking sauces, dips, and salsa (as consumed) (Data from 2013, 2016, 2018) (Data from 2017)
5.3 25.2 40.9 21.4 17.7Regional Target
652 1315 2116 1118 920N/A
Canada, USALower Target
Updated TargetsSweet oriental sauces (Data from 2013) (Data from 2017)
2.4 4.1 9.1 3.5 2.8Regional Target
291 413 520 351 289350
CanadaLower Target
Updated TargetsSoya and other salty oriental sauces (Data from 2013) (Data from 2017)
0.8 1.5 3.8 1.3 1.1Regional Target
181 250 560 213 175360
CanadaLower Target
Updated TargetsMarinades (as consumed) (Data from 2013) (Data from 2017)
5.6 11.6 49.2 9.9 8.1Regional Target
1919 3433 5800 2918 2403N/A
CanadaLower Target
Updated TargetsDry seasoning mixes for rice and side dishes (Data from 2017, 2018) (Data from 2017, 2018)
5.5 16.7 22.7 14.2 11.7Regional Target
1067 2133 2867 1813 1493N/A
Brazil, Canada, Costa Rica, USA* (*per serving)Lower Target
Updated TargetsDry seasoning mixes for meat and fish (Data from 2017, 2018) (Data from 2017, 2018)
9.4 15.4 29.8 13.1 10.8Regional Target
8000 17698 25350 15043 12389N/A
Year nAverage Sodium
(mg/serving)
Sodium Percentiles (mg/100g)
Pasta sauce
Canada, Costa RicaLower Target
Updated Targets
Table 16.2 Sodium content for proposed Sauces, dips, gravy, and condiments subcategories – mg/100 g
15.6 32.8 50.4 27.9 23.0Regional Target
5745 12007 15658 10206 8405
a Proportion of butter products in 14-country study [1] meeting PAHO Regional Sodium Reduction Targets; b Mean sodium content calculated from available national sodium monitoring data (Tables 16.2 to 16.9); c Calculated as the average of relevant subcategories; d Data extracted from latest approved national sodium targets in Appendix 3a and may illustrate distinct subcategory targets; e Data extracted from final (proposed, accepted or implemented) national front-of-package "high in" or "excess" sodium thresholds for prepackaged foods in Appendix 3b; f Targets for prepared bouillon, broth and stocks (as consumed) unless otherwise specified; g Proportion of products at or below maximum; h Is proportion of products in 2018 at or below maximum within 5% of average sodium target ("target").
N/A
Canada[5]
Costa Rica [8]b
MEAN
KetchupCanada [5]Costa Rica [8]
Canada [5]a
MEAN
PestoCanada[5]MEAN
Tomato sauce
MEAN
Sweet oriental saucesCanada [5]
MEAN
United States (SWA) [11]c
MEAN
Gravy, cooking sauces, dips, and salsa (as consumed)
Canada [5]d
Argentina [13]
Colombia [15]e

V. February 19, 2021
2013 62 689 ± 350 3783 ± 2443 283 700 1919 3433 5800 9600689 ± 350 3783 ± 2443 283 700 1919 3433 5800 9600
2013 59 368 ± 235 2022 ± 1101 12 633 1067 2133 2867 4867368 ± 235 2022 ± 1101 12 633 1067 2133 2867 4867
2017 62 78 ± 36 1436 ± 707 0 - 943 1226 2200 28302018 4 168 ± 102 1460 ± 567 1000 - 1095 1280 1825 22802018 20 212 ± 473 927 ± 531 80 - 583 829 1150 22002018 9 113 ± 50 940 ± 419 542 - 750 750 833 16672018 19 380 ± 580 1562 ±800 79 - 1061 1667 2161 2700
190 1265 340 - 886 1150 1634 2335
2017 69 269 ± 219 1993 ± 1059 40 - 1175 1921 2604 45832018 13 303 ± 807 1401 ± 1270 9 - 365 1400 1680 42002018 7 299 ± 302 2943 ± 4468 100 - 750 1530 3120 160602018 41 189 ± 334 1805 ± 3267 0 - 370 923 1667 189672017 301 - 1224 ± 1197 1 233 600 800 1507 8570
265 1873 30 233 652 1315 2116 10476
Average Sodium
(mg/100g) Min 10th 25th 50th 75th Max2018 22 - 20309 ± 7964 2000 - 13968 20387 25140 338132017 35 - 952 ± 88 668 - - 967 - 10572018 31 - 18553 1000 - 19200 20302 21200 258522018 6 - 17201 ± 3491 3491 - 14440 17060 20370 20760
- 14254 1790 - 15869 14679 22237 20371
2013 110 608 ± 284 264 ± 114 16 61 213 264 350 494
Average Sodium
(mg/100g) Min 10th 25th 50th 75th Max2017 5 - 28505 ± 5238 20340 - - 31260 - 32700
2018 8 - 16269 ± 9755 6000 - 8000 14622 25350 28000
2017 189 - 7212 ± 5638 0 - - 7212 - 24000
- 13148 8780 - 8000 17698 25350 28233
Average Sodium
(mg/100g) Min 10th 25th 50th 75th Max2018 19 - 14095 ± 446 7829 - 10156 13250 17030 23493
2018 45 - 8577 ± 9320 4 - 1333 5517 14286 33636
2017 - - 17255 - - - 17255 - -
- 10809 3917 - 5745 12007 15658 28565
Table 16.6 Sodium content for proposed sauces, dips, gravy, and condiments subcategories – mg/kcal
Min 25th 50th 75th Max
2017 158 6.1 ± 2.2 1.5 4.9 6.0 7.1 16.0
Canadab 2017 56 4.5 ± 1.8 1.4 3.1 4.2 5.1 10.95.3 1.5 4.0 5.1 6.1 13.5
2017 15 2.7 ± 1.8 0.6 1.2 2.2 3.9 6.12.7 ± 1.8 0.6 1.2 2.2 3.9 6.1
2017 33 6.6 ± 4.6 0.3 3.5 6.7 10.0 16.76.6 ± 4.6 0.3 3.5 6.7 10.0 16.7
2017 23 8.9 ± 5.4 1.8 6.8 7.5 11.0 21.08.9 ± 5.4 1.8 6.8 7.5 11.0 21.0
2017 198 7.2 ± 6.8 0.0 2.4 4.0 10.7 31.02017 65 1.8 ± 0.4 0.8 1.6 1.8 2.0 3.02017 154 9.2 ± 7.6 1.0 3.1 6.4 14.5 47.0
6.1 0.6 2.4 4.1 9.1 27.0
2017 24 3.3 ± 4.6 0.0 0.8 1.5 3.8 17.83.3 ± 4.6 0.0 0.8 1.5 3.8 17.8
2017 108 34.0 ± 42.5 1.7 5.6 11.6 49.2 180.034.0 ± 42.5 1.7 5.6 11.6 49.2 180.0
2017 53 16.8 ± 12.5 0.1 5.5 16.7 22.7 58.016.8 ± 12.5 0.1 5.5 16.7 22.7 58.0
Soya and other salty oriental saucesCanada [5]
PeruParaguayArgentinaCosta Rica
MEAN
Spicy saucef
MEAN
Marinades (as consumed)Canada [5]
MEAN
Mustardf
Canada
Data presented as mean ± standard deviation. Sales weighted average (SWA). a Includes tomato-based pasta/pizza sauce, cream sauce, and pesto subcategories; d Canadian data was calculated as the weighted average of dips and salsa, hummus, and legume-based dips, and gravy and cooking sauces subcategories; e Sauces, dressings, and spreads; f Data acquired from the Food Label Information Program (FLIP) database for packaged food and beverage items for the corresponding country (unpublished).
Table 16.3 Sodium content for bouillon cubes and powders a – mg/100 g
Year nAverage Sodium
(mg/serving
Sodium Percentiles (mg/100g)
CanadaPeruArgentinaCosta RicaMexico [16]MEAN
Canada [5]
All data was from Arcand J et al. Nutrients (2019) and represents 2015 data, unless otherwise indicated; Data presented as mean ± standard deviation. a Data are shown for both dry and as consumed bouillon cubes and/or powders. In Canada, bouillon cubes are categorized as soups but in many countries they are used as condiments; b Data calculated as weighted average of published data.
Table 16.4 Sodium content for dry seasoning mixes for rice and side dishes – mg/100 g
Year nAverage Sodium
(mg/serving
Sodium Percentiles (mg/100g)
Argentina [7]Brazil [9]
Costa Rica [7, 8]b
Paraguay [7]MEAN
Broth, as consumed
Table 16.5 Sodium content for dry seasoning mixes for meat and fish – mg/100 g
Year nAverage Sodium
(mg/serving)
Sodium Percentiles (mg/100g)
Brazil [9]a
Costa Rica [8]
Canada [10]b
MEANData presented as mean ± standard deviation. a Rice condiments; b Seasoning.
Year nAverage Sodium
( /k l)
Sodium Percentiles (mg/kcal)
Argentina [7]
Costa Rica [7]Canada (SWA) [14]
MEANData presented as mean ± standard deviation.
Tomato sauceCanadac
MEAN
KetchupCanada
MEAN
Pasta sauce
Canadaa
WEIGHTED MEAN
PestoCanadaMEAN
CanadaMEAN
Soya and other salty oriental saucesCanadaMEAN
Marinades (as consumed)
Gravy, cooking sauces, dips, and salsa (as consumed)Canadad
Canadae
Canadaf
WEIGHTED MEAN
Sweet oriental sauces
CanadaMEAN

V. February 19, 2021
2018 9 12.4 ± 4.6 4.3 12.9 12.9 12.9 18.22018 16 12.8 ± 7.8 0.4 8.5 12.0 17.3 26.02018 18 11.3 ± 8.4 0.4 3.9 9.0 18.2 25.2
Peru 2018 4 15.4 ± 4.0 10.0 12.6 16.1 18.3 19.62017 53 11.2 ± 8.5 0.0 5.0 9.0 17.0 30.0
12.6 3.0 8.6 11.8 16.7 23.8
2017 46 19.9 ± 23.1 0.1 5.4 10.1 27.6 115.02018 8 13.7 ± 18.3 0.1 2.6 8.1 16.0 56.02018 7 66.4 ± 37.7 12.9 12.9 79.0 98.5 102.02018 27 13.0 ± 19.1 0.0 0.1 3.7 21.3 83.7
28.3 3.3 5.3 25.2 40.9 89.2
Min 25th 50th 75th Max2018 17 135.5 ± 136.8 7.5 39.8 96.6 135.7 475.02018 7 75.2 ± 51.5 1.4 1.4 98.0 103.0 127.02018 25 71.6 ± 19.3 38.6 62.5 72.2 84.4 114.42018 - - - - - - -2017 54 54.2 ± 27.2 0.2 35.3 53.2 64.7 162.0
11.9 34.8 80.0 97.0 219.6
Min 25th 50th 75th Max2018 13 25.6 ± 35.5 0.0 4.2 7.8 37.5 98.52018 4 18.0 ± 10.1 4.0 10.6 21.2 25.3 25.32018 - - - - - - -2017 49 19.5 ± 8.9 6.0 13.5 17.2 26.5 40.0
21.0 3.3 9.4 15.4 29.8 54.6
Min 25th 50th 75th Max2018 19 68.6 ± 35.5 27.1 33.9 61.2 85.5 150.7
2018 33 29.7 ± 64.8 0.0 1.5 8.2 19.6 269.22018 - - - - - - -2017 43 36.8 ± 36.4 0.0 11.3 29.0 46.0 170.0
45.0 9.0 15.6 32.8 50.4 196.6
CanadaMEAN
Spicy sauceCanadaPeruArgentina
Mustard sauceArgentinaCosta RicaParaguay
Costa Rica
MEANAll data acquired from the Food Label Information Program (FLIP) database for packaged food and beverage items for the corresponding country; Data presented as mean ± standard deviation. a Includes tomato-based pasta/pizza sauce; b Cream sauce; c Tomato sauce and puree; d Dips and salsa; e Hummus and legume-based dips; f Gravy and cooking sauces.
Table 16.7 Sodium content for bouillon cubes and powders a – mg/kcal
Year nAverage Sodium
(mg/kcal)
Sodium Percentiles (mg/kcal)Proportion below
PAHO Nutrient Profile Model
threshold b
Costa Rica 0%
Peru -
Canada 3.7%
MEAN N/A
Argentina 0%
Costa Rica 0%
Paraguay 0%
All data acquired from the Food Label Information Program (FLIP) database for packaged food and beverage items for the corresponding country; Data presented as mean ± standard deviation. a Data are shown for both dry and as consumed bouillon cubes and/or powders. In Canada, bouillon cubes are categorized as soups but in many countries they are used as condiments; b Products evaluated against the 2016 PAHO Nutrient Profile Model threshold for excess sodium (1 mg/kcal) only included products classified as processed or ultra-processed.
Table 16.8 Sodium content for dry seasoning mixes for rice and side dishes – mg/kcal
Year nAverage Sodium
(mg/kcal)
Sodium Percentiles (mg/kcal)Proportion below
PAHO Nutrient Profile Model
threshold a
Argentina 15.4%
All data acquired from the Food Label Information Program (FLIP) database for packaged food and beverage items for the corresponding country; Data presented as mean ± standard deviation. a
Products evaluated against the 2016 PAHO Nutrient Profile Model threshold for excess sodium (1 mg/kcal) only included products classified as processed or ultra-processed.
Peru -Canada 60.8%
MEAN N/A
Argentina 0%
Costa Rica 15.2%
All data acquired from the Food Label Information Program (FLIP) database for packaged food and beverage items for the corresponding country; Data presented as mean ± standard deviation. a
Products evaluated against the 2016 PAHO Nutrient Profile Model threshold for excess sodium (1 mg/kcal) only included products classified as processed or ultra-processed.
Table 16.9 Sodium content for dry seasoning mixes for meat and fish – mg/kcal
Year nAverage Sodium
(mg/kcal)
Sodium Percentiles (mg/kcal) Proportion below PAHO Nutrient Profile Model
Peru -
Canada 2.0%
MEAN N/A