Detailed Economic and Financial Analysis - Asian … · DETAILED ECONOMIC AND FINANCIAL ANALYSIS I....
40
Uplands Irrigation and Water Resources Management Sector Project (RRP CAM 44328) DETAILED ECONOMIC AND FINANCIAL ANALYSIS I. PREK CHIK SUBPROJECT A. Introduction 1. The Uplands Irrigation and Water Resources Management Sector Project will enhance agricultural and rural economic productivity through increased efficiency of irrigation systems and improved management of water resources in uplands, areas away from the Tonle Sap Lake, in Battambang provinces. 2. Water is the key input to agricultural production, productivity increase and economic growth. Rainfall distribution and river discharges have significant seasonal variability in Cambodia thus adversely affecting sustained agriculture production and increasing vulnerability. Climate change is likely to further exacerbate the situation. Timely availability of water and its efficient management is of prime importance to agriculture productivity and for diversifying agriculture and rural economy. Improving agricultural productivity, diversification, and managing irrigation systems and water resources are among major thrusts of the Government's National Strategy: Rectangular Strategy on Growth, Employment, Equity and Efficiency, Phase III. The ADB's Country Partnership Strategy also focuses on inclusive economic growth through physical infrastructure, agriculture and irrigation, among others. B. Methodology 3. This report presents the economic analysis undertaken for the subproject. The economic analysis of the subproject investment was undertaken in accordance with the principles and procedures set out in the ADB guidelines. 1 All benefits and costs are examined in order to assess the viability of the subproject as well as to identify its expected impact on various sectors of the local society, including the poor. For this analysis the costs and benefits within the Prek Chik irrigation command area are calculated for two alternative situations: “with” the project and “without” the project. In the “without” project scenario part of the command area is not irrigated. The analysis took account of what may be grown on the land “without” the i rrigation system. The intent is to identify the incremental value of production attributable to the project (over its expected useful life) and compare this value to the incremental cost of implementing the project and of operating and maintaining the rehabilitated and new infrastructure over time. 4. To develop a model for the analysis, certain assumptions were made regarding future practice (both “with” and “without” the project) and about the valuation of inputs and outputs. These include: (i) Project life is assumed at 25 years. Assuming adequate maintenance, the irrigation system should be able to maintain its expected benefits for 25 years before another major renovation may be required. (ii) “Without” the project assumes present cultivation patterns and technology are expected to continue for the life of the project. 1 Include the Cost-Benefit Analysis for Development – A Practical Guide (2013); Guidelines for the Economic Analysis of Projects (1997); ADB Handbook for the Economic Analysis of Water Supply Projects (1999); and Framework for the Economic and Financial Appraisal of Urban Development Sector Projects (1994).
Transcript of Detailed Economic and Financial Analysis - Asian … · DETAILED ECONOMIC AND FINANCIAL ANALYSIS I....

Uplands Irrigation and Water Resources Management Sector Project (RRP CAM 44328)
DETAILED ECONOMIC AND FINANCIAL ANALYSIS
I. PREK CHIK SUBPROJECT
A. Introduction 1. The Uplands Irrigation and Water Resources Management Sector Project will enhance agricultural and rural economic productivity through increased efficiency of irrigation systems and improved management of water resources in uplands, areas away from the Tonle Sap Lake, in Battambang provinces. 2. Water is the key input to agricultural production, productivity increase and economic growth. Rainfall distribution and river discharges have significant seasonal variability in Cambodia thus adversely affecting sustained agriculture production and increasing vulnerability. Climate change is likely to further exacerbate the situation. Timely availability of water and its efficient management is of prime importance to agriculture productivity and for diversifying agriculture and rural economy. Improving agricultural productivity, diversification, and managing irrigation systems and water resources are among major thrusts of the Government's National Strategy: Rectangular Strategy on Growth, Employment, Equity and Efficiency, Phase III. The ADB's Country Partnership Strategy also focuses on inclusive economic growth through physical infrastructure, agriculture and irrigation, among others. B. Methodology 3. This report presents the economic analysis undertaken for the subproject. The economic analysis of the subproject investment was undertaken in accordance with the principles and procedures set out in the ADB guidelines.1 All benefits and costs are examined in order to assess the viability of the subproject as well as to identify its expected impact on various sectors of the local society, including the poor. For this analysis the costs and benefits within the Prek Chik irrigation command area are calculated for two alternative situations: “with” the project and “without” the project. In the “without” project scenario part of the command area is not irrigated. The analysis took account of what may be grown on the land “without” the irrigation system. The intent is to identify the incremental value of production attributable to the project (over its expected useful life) and compare this value to the incremental cost of implementing the project and of operating and maintaining the rehabilitated and new infrastructure over time. 4. To develop a model for the analysis, certain assumptions were made regarding future practice (both “with” and “without” the project) and about the valuation of inputs and outputs. These include:
(i) Project life is assumed at 25 years. Assuming adequate maintenance, the irrigation system should be able to maintain its expected benefits for 25 years before another major renovation may be required.
(ii) “Without” the project assumes present cultivation patterns and technology are expected to continue for the life of the project.
1 Include the Cost-Benefit Analysis for Development – A Practical Guide (2013); Guidelines for the Economic
Analysis of Projects (1997); ADB Handbook for the Economic Analysis of Water Supply Projects (1999); and Framework for the Economic and Financial Appraisal of Urban Development Sector Projects (1994).
2
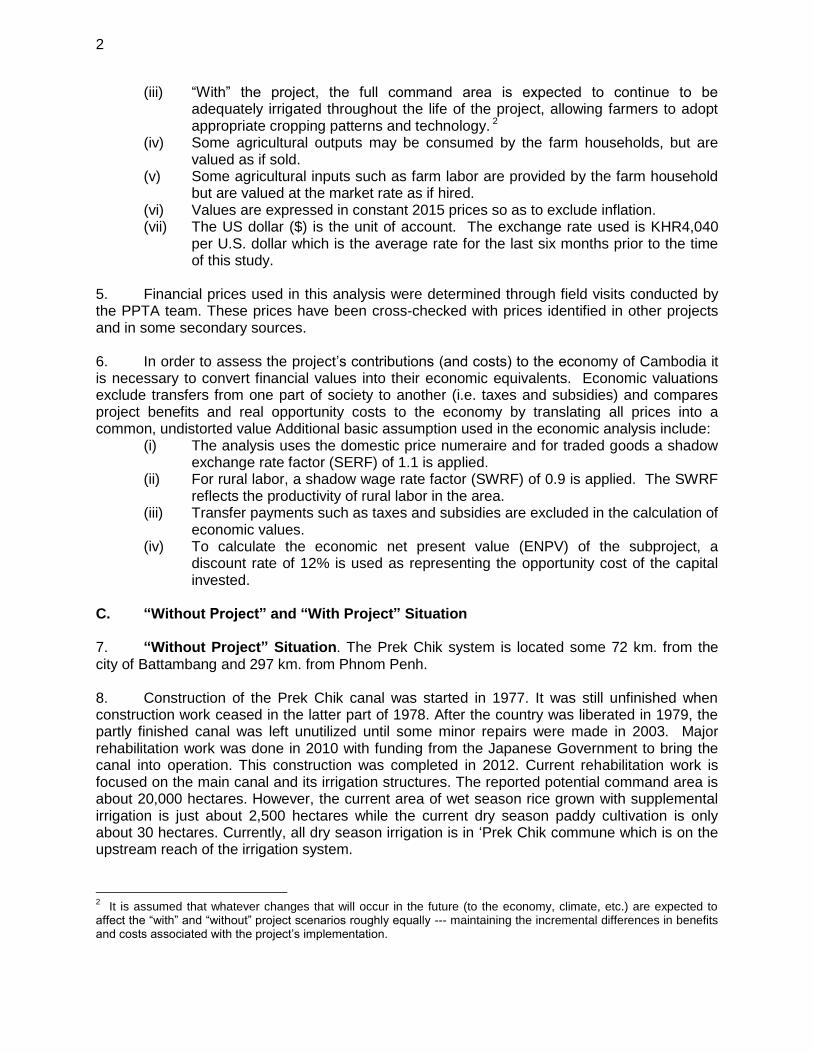
(iii) “With” the project, the full command area is expected to continue to be adequately irrigated throughout the life of the project, allowing farmers to adopt appropriate cropping patterns and technology. 2
(iv) Some agricultural outputs may be consumed by the farm households, but are valued as if sold.
(v) Some agricultural inputs such as farm labor are provided by the farm household but are valued at the market rate as if hired.
(vi) Values are expressed in constant 2015 prices so as to exclude inflation. (vii) The US dollar ($) is the unit of account. The exchange rate used is KHR4,040
per U.S. dollar which is the average rate for the last six months prior to the time of this study.
5. Financial prices used in this analysis were determined through field visits conducted by the PPTA team. These prices have been cross-checked with prices identified in other projects and in some secondary sources. 6. In order to assess the project’s contributions (and costs) to the economy of Cambodia it is necessary to convert financial values into their economic equivalents. Economic valuations exclude transfers from one part of society to another (i.e. taxes and subsidies) and compares project benefits and real opportunity costs to the economy by translating all prices into a common, undistorted value Additional basic assumption used in the economic analysis include:
(i) The analysis uses the domestic price numeraire and for traded goods a shadow exchange rate factor (SERF) of 1.1 is applied.
(ii) For rural labor, a shadow wage rate factor (SWRF) of 0.9 is applied. The SWRF reflects the productivity of rural labor in the area.
(iii) Transfer payments such as taxes and subsidies are excluded in the calculation of economic values.
(iv) To calculate the economic net present value (ENPV) of the subproject, a discount rate of 12% is used as representing the opportunity cost of the capital invested.
C. “Without Project” and “With Project” Situation 7. “Without Project” Situation. The Prek Chik system is located some 72 km. from the city of Battambang and 297 km. from Phnom Penh. 8. Construction of the Prek Chik canal was started in 1977. It was still unfinished when construction work ceased in the latter part of 1978. After the country was liberated in 1979, the partly finished canal was left unutilized until some minor repairs were made in 2003. Major rehabilitation work was done in 2010 with funding from the Japanese Government to bring the canal into operation. This construction was completed in 2012. Current rehabilitation work is focused on the main canal and its irrigation structures. The reported potential command area is about 20,000 hectares. However, the current area of wet season rice grown with supplemental irrigation is just about 2,500 hectares while the current dry season paddy cultivation is only about 30 hectares. Currently, all dry season irrigation is in ‘Prek Chik commune which is on the upstream reach of the irrigation system.
2 It is assumed that whatever changes that will occur in the future (to the economy, climate, etc.) are expected to
affect the “with” and “without” project scenarios roughly equally --- maintaining the incremental differences in benefits and costs associated with the project’s implementation.

3
9. Water availability from Bassac Reservoir which has been undergoing gate repairs is a major issue. Flood problems from local run-off require cross-drainage solution. Over the whole right side of the main canal, the lack of drainage facilities passing under the canal has resulted to the main canal being used as drainage through inlets constructed specifically to allow flood and drainage waters during medium to high intensity storms to enter the canal. The main canal becomes in fat the major relief drain to discharge flood waters downstream through off-takes. 10. The system has no water measuring device, inflow records, cropping season duration and no budget allocation from the Government. 11. “With Project” Situation. The proposed improvement is expected to provide water to four communes covering a total area of 10,432 ha. Command area includes the following communes:
Table 1: Prek Chik Subproject Command Area Commune Land
Ownership Total Area
(hectare)
Prey Svay Farmer land 2,766 Kear Farmer land 4,418 Preak Chik Farmer land 1,048 Prey Trolach Farmer land 2,200 Total 10,432
Source: PPTA Consultant.
12. Proposed physical improvements to the system are as follows: (i) Rehabilitation of headworks (including raising of spillway by 1.5 meters) (ii) Rehabilitation of 28 km Main Canal and installation of all structures for water
control and distribution, and provision of all drainage works (iii) Secondary and Tertiary Canals for a length of 70.2 km, to be able to cover
10,400 ha of net irrigated lands. 13. Other components of the subproject include the following:
(i) Installation of Hydro-Met stations in the watersheds for water resources monitoring (to be installed with collaboration of ongoing ADB funded Flood and Drought Risk Management and Mitigation Project).
(ii) Provision of training to the PDWRAMs, farmer water user communes (FWUCs) and the appropriate government agencies.
(iii) Organization, mobilization and training of FWUCs in the command area. (iv) Involving FWUCs in the subprojects design and supervision of works, and
operation and maintenance as per their role and responsibilities defined in the recently approved law – Sub-decree on the Procedures for the Establishment, Dissolution, Role and Duties of FWUC, Royal Government of Cambodia, 12 March 2015.
(v) Design joint reservoir operations for Dauntri and Bassac reservoirs in Battambang province.
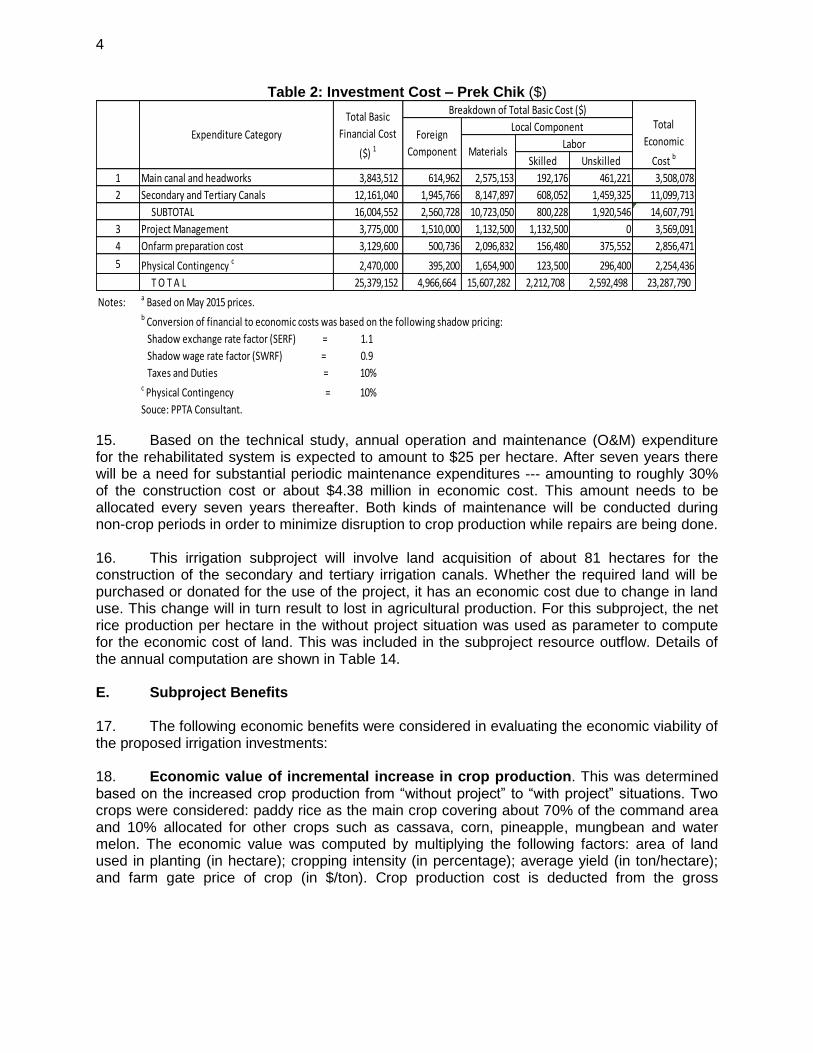
D. Subproject Cost 14. It is estimated that the civil works will cost $16.0 million. Total cost including project management, construction supervision and design, on-farm preparation and physical contingency will amount to $25.4 million. In economic prices the total cost is $23.3 million. Details are shown in the following table:
4
Table 2: Investment Cost – Prek Chik ($)
Skilled Unskilled
1 Main canal and headworks 3,843,512 614,962 2,575,153 192,176 461,221 3,508,078
2 Secondary and Tertiary Canals 12,161,040 1,945,766 8,147,897 608,052 1,459,325 11,099,713
SUBTOTAL 16,004,552 2,560,728 10,723,050 800,228 1,920,546 14,607,791
3 Project Management 3,775,000 1,510,000 1,132,500 1,132,500 0 3,569,091
4 Onfarm preparation cost 3,129,600 500,736 2,096,832 156,480 375,552 2,856,471
5 Physical Contingency c 2,470,000 395,200 1,654,900 123,500 296,400 2,254,436
T O T A L 25,379,152 4,966,664 15,607,282 2,212,708 2,592,498 23,287,790
Notes: a Based on May 2015 prices.b Conversion of financial to economic costs was based on the following shadow pricing:
Shadow exchange rate factor (SERF) = 1.1
Shadow wage rate factor (SWRF) = 0.9
Taxes and Duties = 10%c Physical Contingency = 10%
Souce: PPTA Consultant.
Foreign
Component
Local Component
MaterialsLabor
Expenditure Category
Total Basic
Financial Cost
($) 1
Breakdown of Total Basic Cost ($)Total
Economic
Cost b
15. Based on the technical study, annual operation and maintenance (O&M) expenditure for the rehabilitated system is expected to amount to $25 per hectare. After seven years there will be a need for substantial periodic maintenance expenditures --- amounting to roughly 30% of the construction cost or about $4.38 million in economic cost. This amount needs to be allocated every seven years thereafter. Both kinds of maintenance will be conducted during non-crop periods in order to minimize disruption to crop production while repairs are being done. 16. This irrigation subproject will involve land acquisition of about 81 hectares for the construction of the secondary and tertiary irrigation canals. Whether the required land will be purchased or donated for the use of the project, it has an economic cost due to change in land use. This change will in turn result to lost in agricultural production. For this subproject, the net rice production per hectare in the without project situation was used as parameter to compute for the economic cost of land. This was included in the subproject resource outflow. Details of the annual computation are shown in Table 14. E. Subproject Benefits 17. The following economic benefits were considered in evaluating the economic viability of the proposed irrigation investments: 18. Economic value of incremental increase in crop production. This was determined based on the increased crop production from “without project” to “with project” situations. Two crops were considered: paddy rice as the main crop covering about 70% of the command area and 10% allocated for other crops such as cassava, corn, pineapple, mungbean and water melon. The economic value was computed by multiplying the following factors: area of land used in planting (in hectare); cropping intensity (in percentage); average yield (in ton/hectare); and farm gate price of crop (in $/ton). Crop production cost is deducted from the gross

5
production value to derive the net benefit.3 Incremental benefit is then calculated by deducting the without project situation from the “with project” situation.
19. As discussed, the main economic incremental benefit is the producer surplus. As such, the farmers’ willingness to pay (WTP) serves as an enabling condition for the producer surplus to materialize. The WTP was established based on a series of focus group discussions conducted during the PPTA study. Because there is not yet functional farmer’s water user community in both proposed subproject sites, the PPTA team interviewed the farmers’ groups in another functional irrigation scheme, Stung Chinit,4 financed by ADB, with similar pre-project situation to that of the proposed subprojects. The focus group discussions observed that the current irrigation service fee in Stung Chinit is currently KHR60,000 per hectare per crop. This service fee level can be assumed to be the WTP of irrigation water users since the actual collection having reportedly been 90%. Based on ADB’s experienced in irrigation sector in Cambodia, this fee level together with 90% collection efficiency, operation and maintenance can be carried out reasonably to support the producer surplus to be achieved.
20. Avoided flood crop damages. As reported by the farmers and recorded by the District Agriculture Office, severe flood occurrences happen in the area at least once in five years affecting about 70% of crops in 256 hectares. Avoided crop damages due to flooding were computed by multiplying the total area affected by flood (in hectare); average rice production (in ton/hectare); economic price of rice ($/ton); number of flooding incidence in five years (number); percentage of crops damaged during flooding incidence (in percentage). 21. Other benefits that were not quantified and valued in the analysis include the following: improved health and nutrition of project beneficiaries; increased water availability for agricultural activities; training of PDWRAMs, FWUC members and other relevant agencies; and more efficient management and monitoring of water resources. Furthermore, the design of a joint reservoir operation for Dauntri and Bassac reservoirs will further provide reliable supply of water in the command area. 22. Summary of data and parameters used in the valuation of economic benefits are shown in the following table while detailed annual computation of benefits is presented in Tables 7 to 13.
Table 3: Summary of Factors and Parameters Used Parameter Value
Total Command Area 10,432 ha Without project (2015) Cultivated land in wet season (rice) 7,302 ha Cultivated land in dry season (other crops) 522 ha Areas affected by severe flooding 256 ha With project (year 7 - 2022) Cultivated land in wet season (rice) 7,302 ha Cultivated land in dry season (other crops) 1,043 ha
Incremental Subproject Output – Rice
3 This cash flow stream of benefits does change over time in line with the World Bank commodity price projections for
rice and major inputs such as fertilizer. 4 Stung Chinit Irrigation System (SCIS FWUC) is located at Kampong Thom province with coverage area of 2,803 ha.
It was established in 2002 and received financial and technical support from ADB and Agence Française de Developpement (AFD). The Stung Chinit project was completed in 2008. Thereafter, it received the strong support from the Irrigation Service Center (ISC), a non-government organization.

6
Parameter Value
Without project (2015) Yield 1.8 t/ha Cropping intensity 70% Farm gate price $300/t Production cost $122/t With project (year 7 - 2022) Yield 5 t/ha Cropping intensity 70% Farm gate price $395/t Production cost $132/t
Incremental Subproject Output – Other Crops Without project (2015) Yield 15 t/ha Cropping intensity 10% Farm gate price $324/t Production cost $130/t With project (year 7 - 2022) Yield 21 t/ha
Cropping intensity 10% Farm gate price $324/t Production cost $127/t Sources: UIWRMSP PPTA, Engineering and Irrigation Report (Supplementary Appendix No. 1) and Agriculture
Report (Supplementary Appendix No. 3).
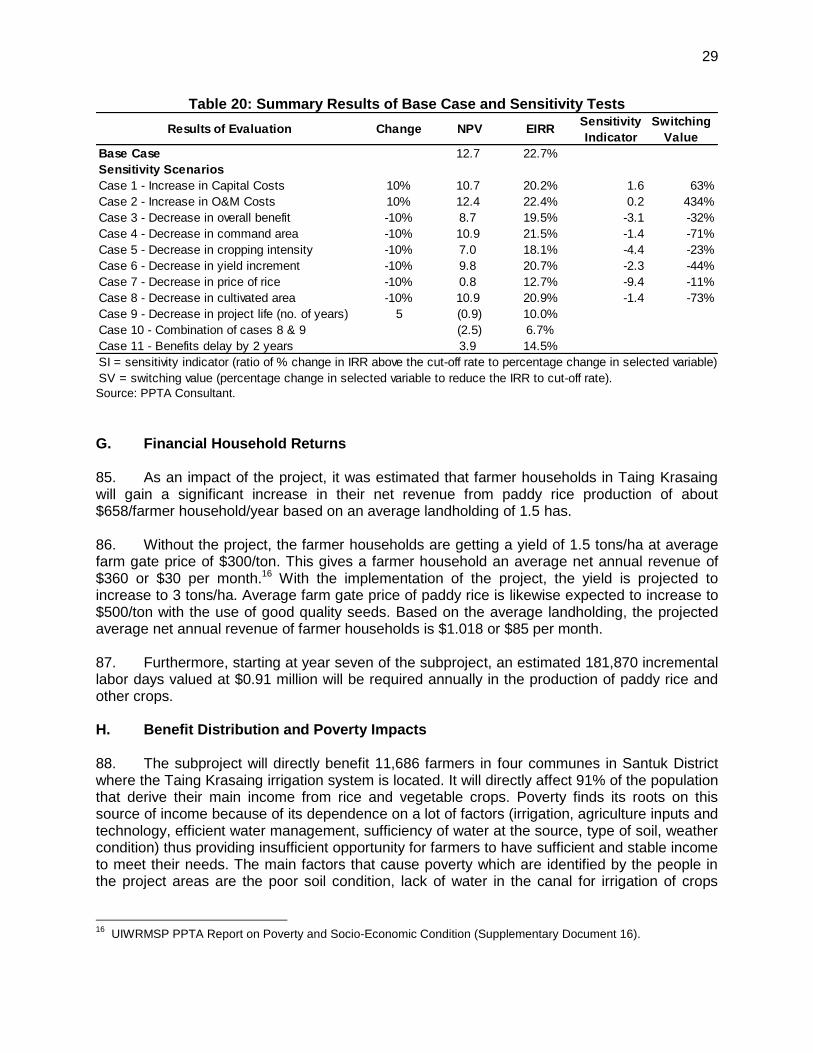
F. Economic Analysis 23. Economic Returns. The main quantifiable benefit of the subproject is the net incremental value of crop production and avoided crop damages due to flooding. Annual cost stream is determined to calculate the economic returns of the subproject. Costs are similarly projected with investment costs falling in the first three years followed by annual maintenance expenditures in each subsequent year and periodic maintenance cost every eighth year of operation. To calculate the cash flow of net project economic benefits, the cost cash flow is subtracted from the benefit cash flow. 24. The Prek Chik irrigation subproject is expected to be economically viable in that the calculated economic internal rate of return (EIRR) is 24% and the economic net present value (ENPV) of the investment is $9.5 million (when applying a discount rate of 12%). These strong economic results are due to the substantial size of the economic benefit stream relative to the economic basic construction cost of $14.6 million or $2,000 per hectare of planted area. 25. Sensitivity Analysis. The reported economic returns of the subproject are based upon the assumption that costs and benefits over the life of the project will be as calculated. The future, of course, may be affected by a number of unforeseen events which can adversely change the expected result. It is useful to examine particular risks and check the impact they may make to the economic returns of the project. Some of these risks include the following: 26. Increase in Investment Cost: Care has been taken to accurately estimate the cost of the Prek Chik irrigation system. One of the sensitivity tests undertaken involves the possibility of actual cost being higher than the estimated cost. To determine the vulnerability of economic returns to higher construction costs, a 10% increase in costs was included in the estimation. This cost increase causes the EIRR to decline to 21.2%, lower by 2.8% from the base EIRR. The sensitivity indicator for this level of cost increase is 1.5, indicating that the returns are

7
sensitive to this variable. The level of increase at which the EIRR would fall below the acceptable 12% level (the switching value)5 is at a 65% increase in cost. 27. Increased O&M cost: Similar to investment costs, the possibility of O&M costs increasing than what was estimated may occur in the future. A test of the impact of a 10% increase in costs was done to determine how vulnerable the resulting EIRR to such an increase. The cost increase causes very insignificant change in EIRR at 23.8%. 28. Decrease in Overall Benefits: An overall decline in total benefits by 10% was also tested defining no particular factor. With this general assumption, EIRR would fall to 20.4% and the sensitivity factor is -3.0 and switching value is -33%. 29. Decrease in Command Area: If the benefitted area of the Prek Chik system were not to reach its anticipated level of 7,302 ha the economic returns can be expected to decrease from the base-case level. A 10% decrease in the command area drops the EIRR to 23.2%. The sensitivity factor is at -0.7 while the switching value is at -144% of the incremental command area improvement. 30. Decrease in Cropping Intensity: With available irrigation water, cropping intensity is expected to increase in the “with project” situation. However, in case this decreases by 10%, EIRR would decrease to 19.7%, the sensitivity factor is -3.5 and switching value is -28%. 31. Decrease in Yield Increment: The yield increment when moving from rainfed to irrigation water has been assumed to average about 5 tons per ha. If this increment were to decrease by 10%, the EIRR would drop to 18.5%. The sensitivity factor is only -5.1 and the switching value is at -19%. 32. Decrease in Price of Rice: Rice prices are assumed to change over time along the lines predicted by the World Bank commodity price projections. Any drop in prices can affect future cash flow and project returns can be expected to fall. A 10% drop in rice prices causes the EIRR to fall to 18.8%. The sensitivity factor is -4.5 and the switching value is at -22%. 33. Decrease in cultivated area: If the cultivated area were to decrease by 10% from the base-case level, EIRR will decrease to 20.4%. The sensitivity factor is at -3.0 while the switching value is at -34%. 34. Decrease in project life: The project is originally assumed at 25 years but if this will decrease to say 5 years, then EIRR drops to 11.4%. 35. Decrease in cultivated area and project life: A simultaneous change in cultivated area and project life will adversely affect the result, dropping the EIRR to 5.4% which is below the assumed opportunity cost of 12%. 36. Benefits delayed by 2 years: Any delay in implementation schedule can impact on the benefits materializing for target beneficiaries. An assumed two-year delay will decrease EIRR and ENPV to 14.9% and $3.2 million, respectively.
5 The switching value is the percent change in the risk variable that will make the EIRR fall to the level of the
opportunity cost of capital (which is assumed to be 12%).

8
37. The level of economic returns, along with the results of the sensitivity analysis of various risks, indicates that the Prek Chik subproject investment is likely to pay for itself but is highly sensitive to a decrease in assumed project life. This particular risk puts the EIRR of falling below 12%, more especially if combined with other risks.
Table 4: Summary Results of Base Case and Sensitivity Tests
Results of Evaluation Change NPV EIRRSensitivity
Indicator
Switching
Value
Base Case 9.5 24.0%
Sensitivity Scenarios
Case 1 - Increase in Capital Costs 10% 8.0 21.2% 1.5 65%
Case 2 - Increase in O&M Costs 10% 9.3 23.8% 0.2 586%
Case 3 - Decrease in overall benefit -10% 6.6 20.4% -3.0 -33%
Case 4 - Decrease in command area -10% 8.8 23.2% -0.7 -144%
Case 5 - Decrease in cropping intensity -10% 6.1 19.7% -3.5 -28%
Case 6 - Decrease in yield increment -10% 4.6 18.5% -5.1 -19%
Case 7 - Decrease in price of rice -10% 5.3 18.8% -4.5 -22%
Case 8 - Decrease in cultivated area -10% 6.6 20.4% -3.0 -34%
Case 9 - Decrease in project life (no. of years) 5 (0.2) 11.4%
Case 10 - Combination of cases 8 & 9 (1.9) 5.4%
Case 11 - Benefits delay by 2 years 3.2 14.9%
SI = sensitivity indicator (ratio of percentage change in IRR above 12% to percentage change in selected variable).
SV = switching value (percentage change in selected variable to reduce the IRR to cut-off rate).
Source: PPTA Consultant.
G. Financial Household Returns 38. As an impact of the project, it was estimated that farmer households in Prek Chik will gain a significant increase in their net revenue from paddy rice production of about $2,812/farmer household/year based on an average landholding of 2 hectares. 39. Without the project, the farmer households are getting a yield of 1.8 tons/hectare at average farm gate price of $300/ton. This gives a farmer household an average net annual revenue of $610 or $51 per month.6 With the implementation of the project, the yield is projected to increase to 5 tons/ha. Average farm gate price of paddy rice is likewise expected to increase to $500/ton with the use of good quality seeds. Based on the average landholding, the projected average net annual revenue of farmer households is $3,422 or $285 per month. 40. Furthermore, starting at year seven of the subproject, an estimated 116,525 incremental labor days valued at $0.58 million will be required annually in the production of paddy rice and other crops.
H. Benefit Distribution and Poverty Impact 41. In Prek Chik, around 80% of the total population of the four Communes are farmers. Main source of income is derived from agriculture (91%). Poverty finds its roots on this source of income because of its dependence on a lot of factors (irrigation, agriculture inputs and technology, efficient water management, sufficiency of water at the source, type of soil, weather condition) thus providing insufficient opportunity for farmers to have sufficient and stable income
6 UIWRMSP PPTA Report on Poverty and Socioeconomic Condition (Supplementary Appendix 16).

9
to meet their needs. The main factors that cause poverty which are identified by the people in the project areas are the poor soil condition, lack of water in the canal for irrigation of crops during the dry season, people do not use the appropriate agriculture technologies, and lack of job opportunities in the locality.7 42. The implementation of the project will try to tackle these factors that cause poverty by enhancing agricultural and rural economic productivity through increased efficiency of irrigation systems and improved management of water resources. When completed, the project will directly benefit the 6,663 farmers in Prek Chik and the total population in the four communes. The project will help decrease the poverty rates in the four communes covered within the project area which ranges from 23.5% to 34.5% in Prek Chik. 43. Project sustainability is strongly affected by who benefits, and by how much, relative to who pays. Main beneficiary groups or stakeholders for this subproject are identified as the government, local economy, labor sector and the farmers. The distribution of the economic benefits and costs over and above financial revenues and expenses are estimated to determine the extent to which public investment policy can affect the share that the various sectors derive from the project. The following table on Benefit Distribution shows the result of this analysis:
Table 5: Distribution of Economic Benefits
Total Project Benefits 0.47 31.40 30.93 30.93
Project Costs
Traded 2.28 2.00 (0.28) 0.28
Unskilled labor 2.21 1.07 (1.14) 1.14
Non-traded 13.91 6.59 (7.32) 7.32
Total Project Costs 18.40 9.66
Net Benefits (Losses) (17.93) 21.74 39.66 (17.93)
Benefits (Losses) (17.93) 7.60 1.14 30.93
FarmersFinancial
Present Value
Economic
Present
Value
Economic
minus
Financial
Government Economy Labor
44. Another analysis was undertaken to determine the distribution of net benefits among beneficiary groups according to income level. The particular focus on net benefits that go to the poor is pertinent in this agricultural project. Computed poverty impact ratio (PIR) for this subproject is 30.8%. Details are presented in the following table:
Table 6: Poverty Impact
Gov't. /
Particulars Economy Labor Community Total
Benefits (Losses) 7.60 1.14 30.93 39.66
Financial Return to Government (17.93) (17.93)
Total Benefits (Losses) (10.33) 1.14 30.93 21.74
Proportion of Poor (%) 0.29 0.67 0.29
Benefits to Poor (2.98) 0.76 8.92 6.70
Poverty Impact Ratio (%) 30.8%
7 Focus Group Discussion (FGD) conducted in Taing Krasaing and Prek Chik.

10
I. Conclusion 45. The proposed Prek Chik irrigation system is expected to make important contributions to the local economy, increasing paddy production and household income significantly. The scheme is economically viable. It will also play a role in the commercialization of rice production. Its expected 19,508 tons per year of incremental paddy production will almost certainly all be marketed given that the local population already has more than enough for its own consumption. Similarly, crop diversification has high potentials for other crops such as cassava, corn, mungbean, pineapple and watermelon have high potentials and will provide good production value to the farmers.
11
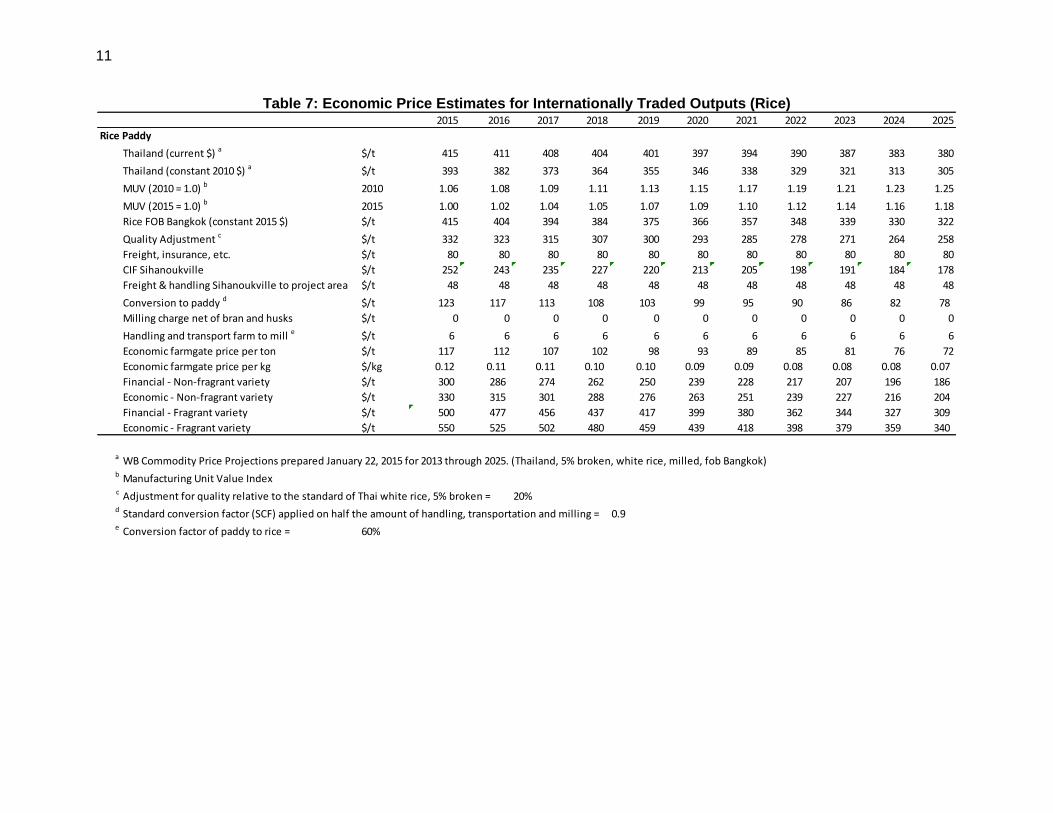
Table 7: Economic Price Estimates for Internationally Traded Outputs (Rice) 2015 2016 2017 2018 2019 2020 2021 2022 2023 2024 2025
Rice Paddy
Thailand (current $) a $/t 415 411 408 404 401 397 394 390 387 383 380
Thailand (constant 2010 $) a $/t 393 382 373 364 355 346 338 329 321 313 305
MUV (2010 = 1.0) b 2010 1.06 1.08 1.09 1.11 1.13 1.15 1.17 1.19 1.21 1.23 1.25
MUV (2015 = 1.0) b 2015 1.00 1.02 1.04 1.05 1.07 1.09 1.10 1.12 1.14 1.16 1.18
Rice FOB Bangkok (constant 2015 $) $/t 415 404 394 384 375 366 357 348 339 330 322
Quality Adjustment c $/t 332 323 315 307 300 293 285 278 271 264 258
Freight, insurance, etc. $/t 80 80 80 80 80 80 80 80 80 80 80
CIF Sihanoukville $/t 252 243 235 227 220 213 205 198 191 184 178
Freight & handling Sihanoukville to project area $/t 48 48 48 48 48 48 48 48 48 48 48
Conversion to paddy d $/t 123 117 113 108 103 99 95 90 86 82 78
Milling charge net of bran and husks $/t 0 0 0 0 0 0 0 0 0 0 0
Handling and transport farm to mill e $/t 6 6 6 6 6 6 6 6 6 6 6
Economic farmgate price per ton $/t 117 112 107 102 98 93 89 85 81 76 72
Economic farmgate price per kg $/kg 0.12 0.11 0.11 0.10 0.10 0.09 0.09 0.08 0.08 0.08 0.07
Financial - Non-fragrant variety $/t 300 286 274 262 250 239 228 217 207 196 186
Economic - Non-fragrant variety $/t 330 315 301 288 276 263 251 239 227 216 204
Financial - Fragrant variety $/t 500 477 456 437 417 399 380 362 344 327 309
Economic - Fragrant variety $/t 550 525 502 480 459 439 418 398 379 359 340
a WB Commodity Price Projections prepared January 22, 2015 for 2013 through 2025. (Thailand, 5% broken, white rice, milled, fob Bangkok)b Manufacturing Unit Value Indexc Adjustment for quality relative to the standard of Thai white rice, 5% broken = 20%d Standard conversion factor (SCF) applied on half the amount of handling, transportation and milling = 0.9e Conversion factor of paddy to rice = 60%

12
Table 8a: Economic Price Estimates for Internationally Traded Inputs (Urea) 2015 2016 2017 2018 2019 2020 2021 2022 2023 2024 2025
Urea
Eastern Europe (current $) a $/t 300 298 296 294 292 290 288 286 284 282 280
Eastern Europe (constant 2010 $) a $/t 284 277 270 264 258 253 247 241 236 230 225
MUV (2010 = 1.0) b 2010 1.06 1.08 1.09 1.11 1.13 1.15 1.17 1.19 1.21 1.23 1.25
MUV (2015 = 1.0) b 2015 1.00 1.02 1.04 1.05 1.07 1.09 1.10 1.12 1.14 1.16 1.18
Urea FOB Eastern Europe (constant 2015 $) $/t 300 292 286 279 273 267 261 255 249 243 237
Freight, insurance, etc. $/t 80 80 80 80 80 80 80 80 80 80 80
CIF Sihanoukville $/t 380 372 366 359 353 347 341 335 329 323 317
Freight & handling Sihanoukville to project area $/t 48 48 48 48 48 48 48 48 48 48 48
Handling and transport to farmgate c $/t 6 6 6 6 6 6 6 6 6 6 6
Economic farmgate price per ton $/t 433 426 419 412 406 400 394 388 382 376 370
Economic farmgate price per kg $/t 0.43 0.43 0.42 0.41 0.41 0.40 0.39 0.39 0.38 0.38 0.37
a WB Commodity Price Projections prepared January 22, 2015 for 2013 through 2025. (Bagged, f.o.b. Eastern Europe (varying origins)b Manufacturing Unit Value Indexc Standard conversion factor (SCF) applied on half the amount of handling & transportation = 0.9

13
Table 8b: Economic Price Estimates for Internationally Traded Inputs (DAP) 2015 2016 2017 2018 2019 2020 2021 2022 2023 2024 2025
DAP (diammonium phosphate)
US (current $) a $/t 450 449 448 447 446 445 444 443 442 441 440
US (constant 2010 $) a $/t 426 417 409 402 395 388 381 374 367 360 353
MUV (2010 = 1.0) b 2010 1.06 1.08 1.09 1.11 1.13 1.15 1.17 1.19 1.21 1.23 1.25
MUV (2015 = 1.0) b 2015 1.00 1.02 1.04 1.05 1.07 1.09 1.10 1.12 1.14 1.16 1.18
DAP FOB US Gulf (constant 2015 $) $/t 450 441 433 425 417 410 402 395 388 380 373
Freight, insurance, etc. $/t 80 80 80 80 80 80 80 80 80 80 80
CIF Sihanoukville $/t 530 521 513 505 497 490 482 475 468 460 453
Freight & handling Sihanoukville to project area $/t 48 48 48 48 48 48 48 48 48 48 48
Handling and transport to farmgate c $/t 6 6 6 6 6 6 6 6 6 6 6
Economic farmgate price per ton $/t 583 574 566 558 550 543 536 528 521 513 506
Economic farmgate price per kg $/t 0.58 0.57 0.57 0.56 0.55 0.54 0.54 0.53 0.52 0.51 0.51
a WB Commodity Price Projections prepared January 22, 2015 for 2013 through 2025. (Standard size, bulk, spot, f.o.b. US Gulf)b Manufacturing Unit Value Indexc Standard conversion factor (SCF) applied on half the amount of handling & transportation = 0.9
14
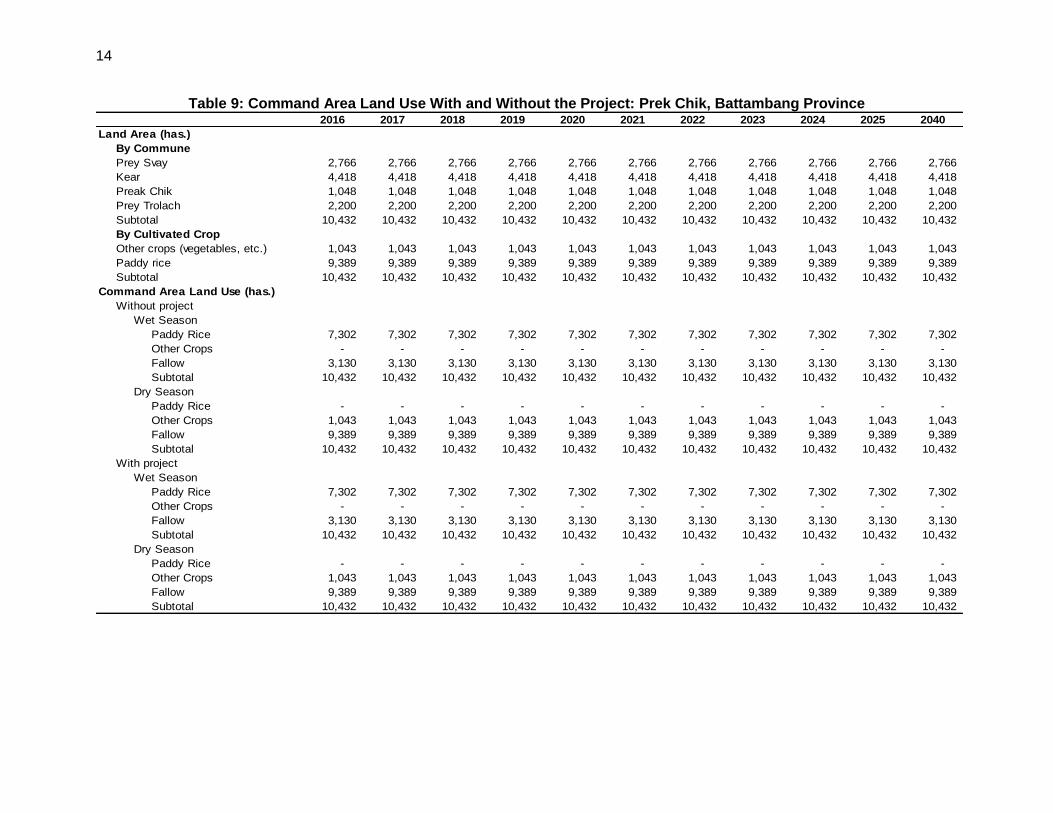
Table 9: Command Area Land Use With and Without the Project: Prek Chik, Battambang Province 2016 2017 2018 2019 2020 2021 2022 2023 2024 2025 2040
Land Area (has.)
By Commune
Prey Svay 2,766 2,766 2,766 2,766 2,766 2,766 2,766 2,766 2,766 2,766 2,766
Kear 4,418 4,418 4,418 4,418 4,418 4,418 4,418 4,418 4,418 4,418 4,418
Preak Chik 1,048 1,048 1,048 1,048 1,048 1,048 1,048 1,048 1,048 1,048 1,048
Prey Trolach 2,200 2,200 2,200 2,200 2,200 2,200 2,200 2,200 2,200 2,200 2,200
Subtotal 10,432 10,432 10,432 10,432 10,432 10,432 10,432 10,432 10,432 10,432 10,432
By Cultivated Crop
Other crops (vegetables, etc.) 1,043 1,043 1,043 1,043 1,043 1,043 1,043 1,043 1,043 1,043 1,043
Paddy rice 9,389 9,389 9,389 9,389 9,389 9,389 9,389 9,389 9,389 9,389 9,389
Subtotal 10,432 10,432 10,432 10,432 10,432 10,432 10,432 10,432 10,432 10,432 10,432
Command Area Land Use (has.)
Without project
Wet Season
Paddy Rice 7,302 7,302 7,302 7,302 7,302 7,302 7,302 7,302 7,302 7,302 7,302
Other Crops - - - - - - - - - - -
Fallow 3,130 3,130 3,130 3,130 3,130 3,130 3,130 3,130 3,130 3,130 3,130
Subtotal 10,432 10,432 10,432 10,432 10,432 10,432 10,432 10,432 10,432 10,432 10,432
Dry Season
Paddy Rice - - - - - - - - - - -
Other Crops 1,043 1,043 1,043 1,043 1,043 1,043 1,043 1,043 1,043 1,043 1,043
Fallow 9,389 9,389 9,389 9,389 9,389 9,389 9,389 9,389 9,389 9,389 9,389
Subtotal 10,432 10,432 10,432 10,432 10,432 10,432 10,432 10,432 10,432 10,432 10,432
With project
Wet Season
Paddy Rice 7,302 7,302 7,302 7,302 7,302 7,302 7,302 7,302 7,302 7,302 7,302
Other Crops - - - - - - - - - - -
Fallow 3,130 3,130 3,130 3,130 3,130 3,130 3,130 3,130 3,130 3,130 3,130
Subtotal 10,432 10,432 10,432 10,432 10,432 10,432 10,432 10,432 10,432 10,432 10,432
Dry Season
Paddy Rice - - - - - - - - - - -
Other Crops 1,043 1,043 1,043 1,043 1,043 1,043 1,043 1,043 1,043 1,043 1,043
Fallow 9,389 9,389 9,389 9,389 9,389 9,389 9,389 9,389 9,389 9,389 9,389
Subtotal 10,432 10,432 10,432 10,432 10,432 10,432 10,432 10,432 10,432 10,432 10,432

15
Table 10: Crop Yield and Intensity – With and Without the Project: Prek Chik, Battambang Province 2016 2017 2018 2019 2020 2021 2022 2023 2024 2025 2040
Crop Yield (t/ha)
Without project
Wet Season
Paddy Rice 1.8 1.8 1.8 1.8 1.8 1.8 1.8 1.8 1.8 1.8 1.8
Other Crops - - - - - - - - - - -
Dry Season
Paddy Rice - - - - - - - - - - -
Other Crops 14.9 14.9 14.9 14.9 14.9 14.9 14.9 14.9 14.9 14.9 14.9
With project
Wet Season
Paddy Rice 1.8 1.8 2.0 2.5 3.0 3.5 5.0 5.0 5.0 5.0 5.0
Other Crops - - - - - - - - - - -
Dry Season
Paddy Rice - - 2.0 2.5 3.0 3.5 5.0 5.0 5.0 5.0 5.0
Other Crops 14.9 14.9 14.9 20.5 20.5 20.5 20.5 20.5 20.5 20.5 20.5
Cropping Intensity (%)
Without project
Wet Season
Paddy Rice 70% 70% 70% 70% 70% 70% 70% 70% 70% 70% 70%
Dry Season
Paddy Rice 0% 0% 0% 0% 0% 0% 0% 0% 0% 0% 0%
Other Crops 100% 100% 100% 100% 100% 100% 100% 100% 100% 100% 100%
With project
Wet Season
Paddy Rice 70% 70% 70% 70% 70% 70% 70% 70% 70% 70% 70%
Dry Season
Paddy Rice 0% 0% 0% 0% 0% 0% 0% 0%
Other Crops 100% 100% 100% 100% 100% 100% 100% 100% 100% 100% 100%

16
Table 11: Crop Production Volume (in ton) and Value ($ million) With and Without Project: Prek Chik, Battambang Province 2016 2017 2018 2019 2020 2021 2022 2023 2024 2025 2040
Total Crop Production (tons)
Without project
Wet Season
Paddy Rice 9,201 9,201 9,201 9,201 9,201 9,201 9,201 9,201 9,201 9,201 9,201
Dry Season
Paddy Rice - - - - - - - - - - -
Other Crops 15,502 15,502 15,502 15,502 15,502 15,502 15,502 15,502 15,502 15,502 15,502
With project
Wet Season
Paddy Rice 9,201 9,201 10,223 12,779 15,335 17,891 25,558 25,558 25,558 25,558 25,558
Dry Season
Paddy Rice - - - - - - - - - - -
Other Crops 15,502 15,502 15,502 21,386 21,386 21,386 21,386 21,386 21,386 21,386 21,386
Economic Farmgate Price ($/ton)
Rice
Without project 286 274 262 250 239 228 217 207 196 186 186
With project 477 456 437 417 399 380 362 344 327 309 309
Other crops 324 324 324 324 324 324 324 324 324 324 324
Gross Crop Production ($ mil)
Without project
Wet Season
Paddy Rice 2.63 2.52 2.41 2.30 2.20 2.10 2.00 1.90 1.80 1.71 1.71
Dry Season
Paddy Rice - - - - - - - - - - -
Other Crops 5.02 5.02 5.02 5.02 5.02 5.02 5.02 5.02 5.02 5.02 5.02
With project
Wet Season
Paddy Rice 2.63 2.52 4.46 5.33 6.12 6.81 9.26 8.80 8.35 7.90 7.90
Dry Season
Paddy Rice - - - - - - - - - - -
Other Crops 5.02 5.02 5.02 6.93 6.93 6.93 6.93 6.93 6.93 6.93 6.93
17
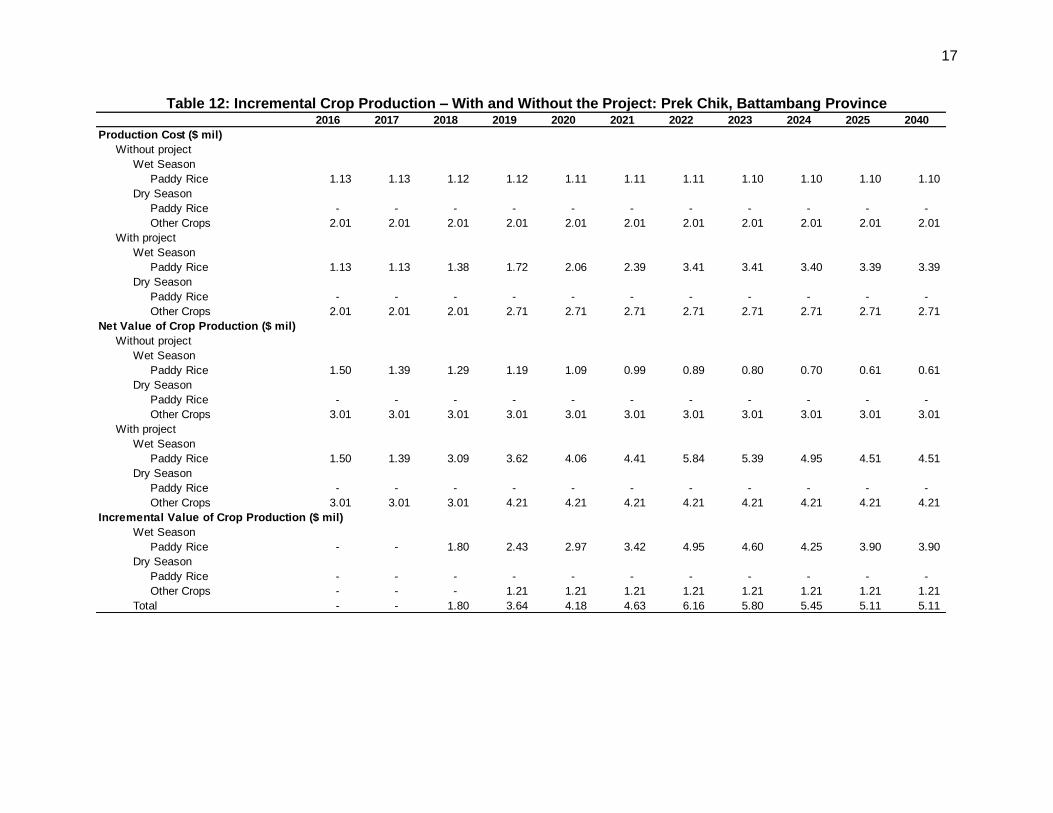
Table 12: Incremental Crop Production – With and Without the Project: Prek Chik, Battambang Province 2016 2017 2018 2019 2020 2021 2022 2023 2024 2025 2040
Production Cost ($ mil)
Without project
Wet Season
Paddy Rice 1.13 1.13 1.12 1.12 1.11 1.11 1.11 1.10 1.10 1.10 1.10
Dry Season
Paddy Rice - - - - - - - - - - -
Other Crops 2.01 2.01 2.01 2.01 2.01 2.01 2.01 2.01 2.01 2.01 2.01
With project
Wet Season
Paddy Rice 1.13 1.13 1.38 1.72 2.06 2.39 3.41 3.41 3.40 3.39 3.39
Dry Season
Paddy Rice - - - - - - - - - - -
Other Crops 2.01 2.01 2.01 2.71 2.71 2.71 2.71 2.71 2.71 2.71 2.71
Net Value of Crop Production ($ mil)
Without project
Wet Season
Paddy Rice 1.50 1.39 1.29 1.19 1.09 0.99 0.89 0.80 0.70 0.61 0.61
Dry Season
Paddy Rice - - - - - - - - - - -
Other Crops 3.01 3.01 3.01 3.01 3.01 3.01 3.01 3.01 3.01 3.01 3.01
With project
Wet Season
Paddy Rice 1.50 1.39 3.09 3.62 4.06 4.41 5.84 5.39 4.95 4.51 4.51
Dry Season
Paddy Rice - - - - - - - - - - -
Other Crops 3.01 3.01 3.01 4.21 4.21 4.21 4.21 4.21 4.21 4.21 4.21
Incremental Value of Crop Production ($ mil)
Wet Season
Paddy Rice - - 1.80 2.43 2.97 3.42 4.95 4.60 4.25 3.90 3.90
Dry Season
Paddy Rice - - - - - - - - - - -
Other Crops - - - 1.21 1.21 1.21 1.21 1.21 1.21 1.21 1.21
Total - - 1.80 3.64 4.18 4.63 6.16 5.80 5.45 5.11 5.11
18
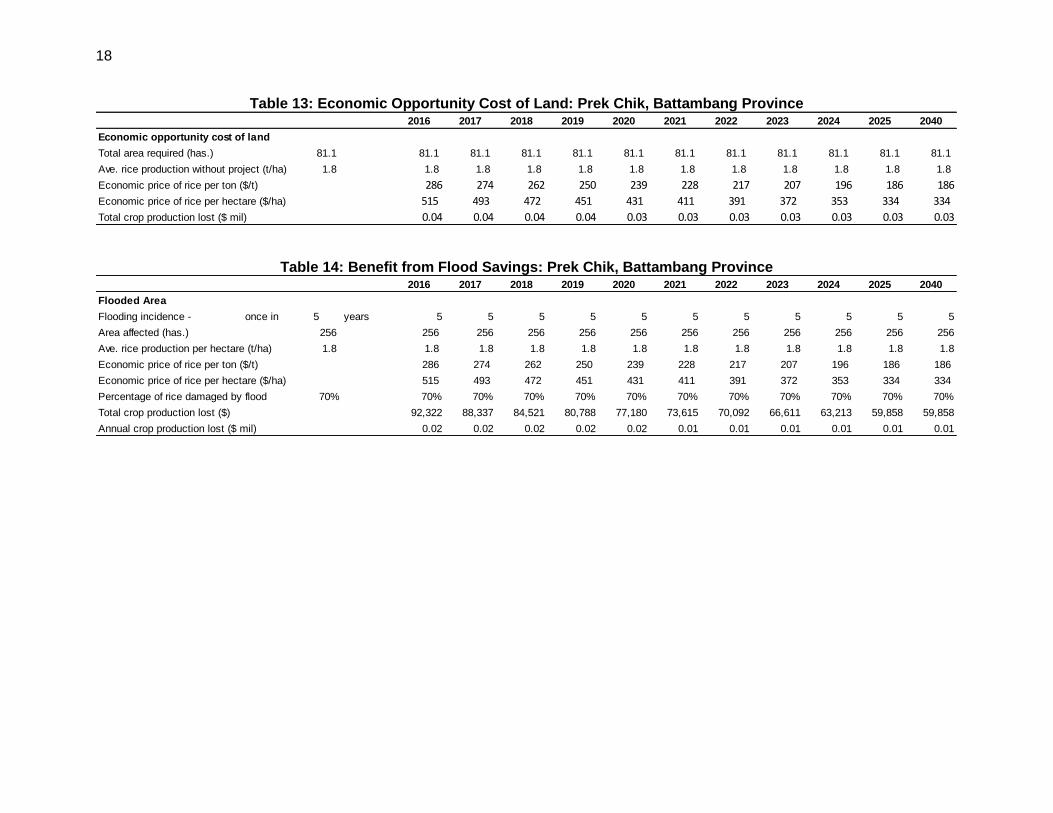
Table 13: Economic Opportunity Cost of Land: Prek Chik, Battambang Province 2016 2017 2018 2019 2020 2021 2022 2023 2024 2025 2040
Economic opportunity cost of land
Total area required (has.) 81.1 81.1 81.1 81.1 81.1 81.1 81.1 81.1 81.1 81.1 81.1 81.1
Ave. rice production without project (t/ha) 1.8 1.8 1.8 1.8 1.8 1.8 1.8 1.8 1.8 1.8 1.8 1.8
Economic price of rice per ton ($/t) 286 274 262 250 239 228 217 207 196 186 186
Economic price of rice per hectare ($/ha) 515 493 472 451 431 411 391 372 353 334 334
Total crop production lost ($ mil) 0.04 0.04 0.04 0.04 0.03 0.03 0.03 0.03 0.03 0.03 0.03
Table 14: Benefit from Flood Savings: Prek Chik, Battambang Province
2016 2017 2018 2019 2020 2021 2022 2023 2024 2025 2040
Flooded Area
Flooding incidence - once in 5 years 5 5 5 5 5 5 5 5 5 5 5
Area affected (has.) 256 256 256 256 256 256 256 256 256 256 256 256
Ave. rice production per hectare (t/ha) 1.8 1.8 1.8 1.8 1.8 1.8 1.8 1.8 1.8 1.8 1.8 1.8
Economic price of rice per ton ($/t) 286 274 262 250 239 228 217 207 196 186 186
Economic price of rice per hectare ($/ha) 515 493 472 451 431 411 391 372 353 334 334
Percentage of rice damaged by flood 70% 70% 70% 70% 70% 70% 70% 70% 70% 70% 70% 70%
Total crop production lost ($) 92,322 88,337 84,521 80,788 77,180 73,615 70,092 66,611 63,213 59,858 59,858
Annual crop production lost ($ mil) 0.02 0.02 0.02 0.02 0.02 0.01 0.01 0.01 0.01 0.01 0.01

19
Table 15: Result of Economic Evaluation: Prek Chik, Battambang Province 2016 2017 2018 2019 2020 2021 2022 2023 2024 2025 2030 2040
Costs
Investment Costs 1.16 2.33 2.33 5.82 8.15 3.49 - - - - - -
O&M Costs - - 0.26 0.26 0.26 0.26 0.26 0.26 0.26 0.26 0.26 0.26
Periodic Maintenance - - - - - - - - - 4.38 - -
Opportunity cost of land 0.04 0.04 0.04 0.04 0.03 0.03 0.03 0.03 0.03 0.03 0.03 0.03
Total Costs 1.21 2.37 2.63 6.12 8.45 3.79 0.29 0.29 0.29 4.67 0.29 0.29
Benefits
Increased production from farmlands - - 1.80 3.64 4.18 4.63 6.16 5.80 5.45 5.11 5.11 5.11
Savings from flood damages - - 0.02 0.02 0.02 0.01 0.01 0.01 0.01 0.01 0.01 0.01
Total Benefits - - 1.82 3.65 4.19 4.64 6.17 5.81 5.47 5.12 5.12 5.12
Net Cash Flow (Base Case) (1.21) (2.37) (0.81) (2.47) (4.25) 0.85 5.88 5.52 5.17 0.45 4.83 4.83
Sensitivity Tests:
Case 1 - Increase in Capital Costs (1.32) (2.60) (1.05) (3.05) (5.07) 0.51 5.88 5.52 5.17 0.45 4.83 4.83
Case 2 - Increase in O&M Costs (1.21) (2.37) (0.84) (2.49) (4.28) 0.83 5.85 5.50 5.15 0.42 4.80 4.80
Case 3 - Decrease in overall benefit (1.21) (2.37) (0.99) (2.83) (4.67) 0.39 5.26 4.94 4.63 (0.06) 4.32 4.32
Case 4 - Decrease in command area (1.21) (2.37) (0.81) (2.59) (4.37) 0.73 5.76 5.40 5.05 0.33 4.71 4.71
Case 5 - Decrease in cropping intensity (1.21) (2.37) (1.12) (2.95) (4.78) 0.29 5.17 4.86 4.56 (0.12) 4.26 4.26
Case 6 - Decrease in yield increment (1.21) (2.37) (0.81) (2.89) (4.68) 0.43 4.87 4.56 4.26 (0.42) 3.55 3.55
Case 7 - Decrease in price of rice (1.20) (2.36) (1.02) (2.96) (4.83) 0.20 4.96 4.64 4.33 (0.36) 4.02 4.02
Case 8 - Decrease in cultivated area (1.21) (2.37) (0.99) (2.83) (4.67) 0.39 5.26 4.94 4.63 (0.06) 4.32 4.32
Case 9 - Decrease in project life (no. of years) (1.21) (2.37) (0.81) (2.47) (4.25) 0.85 5.88 5.52 5.17 0.45
Case 10 - Combination of cases 8 & 9 (1.21) (2.37) (0.99) (2.83) (4.67) 0.39 5.26 4.94 4.63 (0.06)
Case 11 - Benefits delay by 2 years (1.21) (2.37) (2.63) (6.12) (6.63) (0.14) 3.90 4.35 5.88 1.14 4.83 4.83
Results of Evaluation Change NPV EIRRSensitivity
Indicator
Switching
Value
Base Case 9.5 24.0%
Sensitivity Scenarios
Case 1 - Increase in Capital Costs 10% 8.0 21.2% 1.5 65%
Case 2 - Increase in O&M Costs 10% 9.3 23.8% 0.2 586%
Case 3 - Decrease in overall benefit -10% 6.6 20.4% -3.0 -33%
Case 4 - Decrease in command area -10% 8.8 23.2% -0.7 -144%
Case 5 - Decrease in cropping intensity -10% 6.1 19.7% -3.5 -28%
Case 6 - Decrease in yield increment -10% 4.6 18.5% -5.1 -19%
Case 7 - Decrease in price of rice -10% 5.3 18.8% -4.5 -22%
Case 8 - Decrease in cultivated area -10% 6.6 20.4% -3.0 -34%
Case 9 - Decrease in project life (no. of years) 5 (0.2) 11.4%
Case 10 - Combination of cases 8 & 9 (1.9) 5.4%
Case 11 - Benefits delay by 2 years 3.2 14.9%
SI = sensitivity indicator (ratio of percentage change in IRR above 12% to percentage change in selected variable).
SV = switching value (percentage change in selected variable to reduce the IRR to cut-off rate).
Source: PPTA Consultant.

20
II. TAING KRASAING SUBPROJECT
A. Introduction 46. The Uplands Irrigation and Water Resources Management Sector Project will enhance agricultural and rural economic productivity through increased efficiency of irrigation systems and improved management of water resources in uplands, areas away from the Tonle Sap Lake, including Kampong Thom province. 47. Water is the key input to agricultural production, productivity increase and economic growth. Rainfall distribution and river discharges have significant seasonal variability in Cambodia thus adversely affecting sustained agriculture production and increasing vulnerability. Climate change is likely to further exacerbate the situation. Timely availability of water and its efficient management is of prime importance to agriculture productivity and for diversifying agriculture and rural economy. Improving agricultural productivity, diversification, and managing irrigation systems and water resources are among major thrusts of the Government's National Strategy: Rectangular Strategy on Growth, Employment, Equity and Efficiency.8 The ADB's Country Partnership Strategy also focuses on inclusive economic growth through physical infrastructure, agriculture and irrigation, among others.9 B. Methodology 48. This report presents the economic analysis undertaken for the subproject. The economic analysis of the subproject investment was undertaken in accordance with the principles and procedures set out in the ADB guidelines.10 All benefits and costs are examined in order to assess the viability of the subproject as well as to identify its expected impact on various sectors of the local society, including the poor. 49. For this analysis, the costs and benefits within the Taing Krasaing irrigation command area are calculated for two alternative situations: “with the project” and “without the project”. In the “without project’ scenario, most parts of the command area are not irrigated. The analysis took account of what may be grown on the land without the irrigation system. The intent is to identify the incremental value of production attributable to the project (over its expected useful life) and compare this value to the incremental cost of implementing the subproject and of operating and maintaining the rehabilitated and new infrastructure over time. 50. To develop a model for the analysis, certain assumptions were made regarding future practice (both “with” and “without” the project) and about the valuation of inputs and outputs. These include:
(i) Project life is assumed at 25 years. Assuming adequate maintenance, the irrigation system should be able to maintain its expected benefits for 25 years before another major renovation may be required.
(ii) “Without” the project assumes present cultivation patterns and technology are expected to continue for the life of the project.
8 Royal Government of Cambodia Ministry of Planning. 2014. National Strategic Development Plan 2014-2018.
Phnom Penh. 9 Asian Development Bank. 2013. Country Partnership Strategy for Cambodia, 2014-2018. Manila.
10 Include the Cost-Benefit Analysis for Development – A Practical Guide (2013); Guidelines for the Economic Analysis of Projects (1997); ADB Handbook for the Economic Analysis of Water Supply Projects (1999); and Framework for the Economic and Financial Appraisal of Urban Development Sector Projects (1994).

21
(iii) “With” the project, the full command area is expected to continue to be adequately irrigated throughout the life of the project, allowing farmers to adopt appropriate cropping patterns and technology. 11
(iv) Some agricultural outputs may be consumed by the farm households, but are valued as if sold.
(v) Some agricultural inputs such as farm labor are provided by the farm household but are valued at the market rate as if hired.
(vi) Values are expressed in constant 2015 prices so as to exclude inflation. (vii) The US dollar ($) is the unit of account. The exchange rate used is KR4,040 per
US dollar which is the average rate for the last six months prior to the time of this study.
51. Financial prices used in this analysis were determined through field visits conducted by the PPTA team. These prices have been cross-checked with prices identified in other projects and in some secondary sources. 52. In order to assess the project’s contributions (and costs) to the economy of Cambodia it is necessary to convert financial values into their economic equivalents. Economic valuations exclude transfers from one part of society to another (i.e. taxes and subsidies) and compares project benefits and real opportunity costs to the economy by translating all prices into a common, undistorted value. Additional basic assumptions12 used in the economic analysis include:
(i) The analysis uses the domestic price numeraire and for traded goods a shadow exchange rate factor (SERF) of 1.1 is applied.
(ii) For rural labor, a shadow wage rate factor (SWRF) of 0.9 is applied. The SWRF reflects the productivity of rural labor in the area.
(iii) Transfer payments such as taxes and subsidies are excluded in the calculation of economic values.
(iv) To calculate the economic net present value (ENPV) of the subproject, a discount rate of 12% is used as representing the opportunity cost of the capital invested.
C. “Without Project” and “With Project” Situation 53. “Without Project” Situation. The Taing Krasaing system is located some 25 km southeast of the city of Kampong Thom and 185 km from Phnom Penh. It was constructed during the period 1975–1978, underwent rehabilitation in 2000 and had some sections improved and modernized in 2005 and 2012. The irrigation system is supplied by a single reservoir from the Taing Krasaing river with levee-type protection on one side only and with non-functional outlet-control gates. The watershed upstream is estimated at some 1,100 km2. It is linked through a 7-km canal to another system called Stung Chinit located south of the Taing Krasaing system. Stung Chinit, which has a proportionately larger watershed, has more water and thus can be used as supplementary source of water for Taing Krasaing. 54. The main canal of Taing Krasaing runs alongside a wide maintenance road which is relatively in good condition. The road/canal combination runs for some 3 km then makes a 90°
11
It is assumed that whatever changes that will occur in the future (to the economy, climate, etc.) are expected to affect both the “with” and “without” project scenarios equally and maintaining the incremental differences in benefits and costs associated with the project’s implementation.
12 ADB. 2013. Report and Recommendation of the President to the Board of Directors: Cambodia Climate-Resilient Rice Commercialization Sector Development Program, Linked Document on Economic Analysis. Manila.

22
left turn (at a tri-furcation), and runs for another 17 km in a straight line. There are 12 gates/regulators constructed on the main canal, however, no secondary canals are attached to these. 55. Further downstream at approximately 9 km from headworks, there are three primary left off-take gates constructed in 2012, with fully constructed secondary canals attached including flow control structures and tertiary outlets to fields in level condition. Thus, after a considerable stretch of apparent non-irrigation and undeveloped lands, irrigation actually commences and covers about 10,000 ha. 56. Technical verification confirms that the Taing Krasaing system has never really functioned as an irrigation system much served the adjacent communes. Only Taing Krasaing, Kokaoh and part of Chrob are currently planted with paddy rice during wet season. During dry season, only about 400 hectares are planted with other crops such as cassava, corn, water melon, mungbean and pineapple. Flooding problems are experienced in the area caused by local run-off floods and requires cross drainage solutions. Two major breaches with lengths of about 1 to 2 km located on the right embankment need to be resolved. Furthermore, the system has no water-measuring device, no inflow and cropping season records and no budget for operations and maintenance (O&M). 57. “With Project” Situation. The proposed improvement is expected to provide water to four communes covering a total area of 9,869 ha. Command area includes the following communes:
Table 26: Taing Krasaing Subproject Command Area Commune Land Ownership Total Area (hectare)
Tipo (Section 1) Private companies 2,664 Tipo (Section 2) Farmer land 2,989 Taing Krasaing Farmer land 1,370 Chrob Farmer land 855 Korkoah Farmer land 1,991 Total 9,869 Source: PPTA Consultant
58. Proposed physical improvements to the system are as follows: (i) Rehabilitation of headworks (including undersluice and spillway); (ii) Rehabilitation of 22 km main canal and installation of all structures for water
control and distribution; (iii) Provision of all drainage works to resolve flooding and existing breaches in right
embankment of 3 km; (iv) Construction of 48 km secondary and tertiary canals; (v) Installation of a pump system and associated distribution channels to lift water by
a maximum of 3 meters for area of 2,960 ha of developed rain-fed land. (vi) Laser land levelling of 2,000 ha land (from ADB financed Rice Commercialization
Program).
59. Other components of the subproject includes the following: (i) Installation of Hydro-Met stations in the watersheds for water resources
monitoring (to be installed with collaboration of ongoing ADB funded Flood and Drought Risk Management and Mitigation Project)
(ii) Provision of training to the PDWRAMs, FWUCs and the appropriate government agencies.

23
(iii) Organization, mobilization and training of FWUCs in the command area. (iv) Involving FWUCs in the subprojects design and supervision of works, and
operation and maintenance as per their role and responsibilities defined in the recently approved law – Sub-decree on the Procedures for the Establishment, Dissolution, Role and Duties of FWUC, Royal Government of Cambodia, 12 March 2015.
(v) Design joint reservoir operations for Stung Chinit and Taing Krasang Reservoir. D. Economic Costs
60. It is estimated that these civil works will have a base cost of $25.5 million. Total cost including project management, construction supervision and detailed engineering design, on-farm preparation and physical contingency will reach $34.6 million. In economic prices the total cost is $31.7 million. Details are shown in the following table:
Table 17: Investment Cost – Taing Krasaing ($)
Skilled Unskilled
1 Main canal and headworks 10,800,172 1,728,028 7,236,115 540,009 1,296,021 9,857,612
2 Section 1 - Tipou 1 - 0 0 0 0 0
3 Section 2 - Tipou 2 5,000,000 800,000 3,350,000 250,000 600,000 4,563,636
4 Section 3 - Cavac TK - 0 0 0 0 0
5 Section 4 - Chroab 1,297,547 207,608 869,356 64,877 155,706 1,184,307
6 Section 5 - Karkoah 8,372,332 1,339,573 5,609,462 418,617 1,004,680 7,641,656
SUBTOTAL 25,470,051 4,075,208 17,064,934 1,273,503 3,056,406 23,247,210
7 Project Management/Consulting Services 3,775,000 1,510,000 1,132,500 1,132,500 0 3,569,091
8 Onfarm preparation cost 2,917,500 466,800 1,954,725 145,875 350,100 2,662,882
9 Physical Contingency c2,470,000 395,200 1,654,900 123,500 296,400 2,254,436
T O T A L 34,632,551 6,447,208 21,807,059 2,675,378 3,702,906 31,733,619
Notes:a Based on May 2015 prices.
b Conversion of financial to economic costs was based on the following shadow pricing:
Shadow exchange rate factor (SERF) = 1.1
Shadow wage rate factor (SWRF) = 0.9
Taxes and Duties = 10%c Physical Contingency = 10%
Source: PPTA Consultant. 19% 63% 8% 11% 100%
Total
Economic
Cost b
Foreign
Component
Local Component
MaterialsLabor
Expenditure Category
Total Basic
Financial Cost
($) a
Breakdown of Total Basic Cost ($)
61. Based on the technical study, annual routine operation and maintenance (O&M) expenditure for the rehabilitated system is expected to amount to $25 per hectare plus an additional $75 per hectare for the Tipou areas that need pumping. After seven years there will be a need for substantial periodic maintenance expenditures amounting to roughly 30% of the construction cost or about $6.97 million in economic cost. This amount needs to be allocated every seven years thereafter. Both routine and periodic maintenance will be conducted during non-crop periods in order to minimize disruption to crop production while repairs are being done. 62. This irrigation subproject will involve land acquisition of about 34.2 has for the construction of the secondary and tertiary irrigation canals. Whether the required land will be purchased or donated for the use of the project, it has an economic cost due to change in land use. This change is expected to result to loss in agricultural production. For this subproject, the

24
net rice production per hectare for the next 25 years in the without project situation was used as parameter to compute for the economic cost of land. This was included in the subproject resource outflow. E. Economic Benefits 63. The following economic benefits were considered in evaluating the economic viability of the proposed irrigation investments: 64. Economic value of incremental increase in crop production. This was determined based on the increased crop production from “without project” to “with project” situations. Two crops were considered: paddy rice as the main crop covering about 90% of the command area and the other 10% allocated for other crops such as cassava, corn, pineapple, mungbean and water melon. The economic value was computed by multiplying the following factors: area of land used in planting (in hectare); cropping intensity (in percentage); average yield (in ton/hectare); and farm gate price of crop (in $/ton). Crop production cost is deducted from the gross production value to derive the net benefit.13 Incremental benefit is then calculated by deducting the without project situation from the “with project” situation. 65. As discussed, the main economic incremental benefit is the producer surplus. As such, the farmers’ willingness to pay (WTP) serves as an enabling condition for the producer surplus to materialize. The WTP was established based on a series of focus group discussions conducted during the PPTA study. Because there is not yet functional farmer’s water user community in both proposed subproject sites, the PPTA team interviewed the farmers’ groups in another functional irrigation scheme, Stung Chinit14, financed by ADB, with similar pre-project situation to that of the proposed subprojects. The focus group discussions observed that the current irrigation service fee in Stung Chinit is currently KHR60,000 per hectare per crop. This service fee level can be assumed to be the WTP of irrigation water users since the actual collection having reportedly been 90%. Based on ADB’s experienced in irrigation sector in Cambodia, this fee level together with 90% collection efficiency, operation and maintenance can be carried out reasonably to support the producer surplus to be achieved. 66. Avoided crop damages due to flooding. As reported by the farmers and recorded by the District Agriculture Office, severe flood occurrences happen in the area at least once in five years affecting about 70% of crops in 1,590 has. Avoided crop damages due to flooding were computed by multiplying the total area affected by flood (in hectares); average rice production (in ton/hectare); economic price of rice ($/ton); number of flooding incidence in 5 years (number); percentage of crops damaged during flooding incidence (in percentage). 67. Other benefits that were not quantified and valued in the analysis include the following: improved health and nutrition of project beneficiaries; increased water availability for agricultural activities; training of PDWRAMs, FWUC members and other relevant agencies; and more efficient management and monitoring of water resources. Furthermore, the design of a joint
13
This cash flow stream of benefits does change over time in line with the World Bank commodity price projections for rice and major inputs such as fertilizer.
14 Stung Chinit Irrigation System (SCIS FWUC) is located at Kampong Thom province with coverage area of 2,803 ha. It was established in 2002 and received financial and technical support from ADB and Agence Française de Developpement (AFD). The Stung Chinit project was completed in 2008. Thereafter, it received the strong support from the Irrigation Service Center (ISC), a non-government organization.

25
reservoir operation for Taing Krasaing and Stung Chinit reservoirs will further provide sustainable supply of water in the command area. 68. Summary of data and parameters used in the valuation of economic benefits are shown in the following table while detailed annual estimates are shown in Tables 23 to 29.
Table 18: Summary of Factors and Parameters Used
Parameter Value
Command Area 9.869 ha Without project (2015) Cultivated land in wet season (paddy rice) 3,618 ha Cultivated land in dry season (other crops) 493 ha Areas affected by severe flooding 1,590 ha With project, Year 7 (2022) Cultivated land in wet season (paddy rice) 9.869 ha Cultivated land in dry season (rice & other crops) 9.869 ha
Incremental Subproject Output – Paddy Rice Without project (2015) Yield 1.5 t/ha Cropping intensity 100% Farm gate price $300/t Production cost $122/t With project, Year 7 (2022) Yield 3 – 4 t/ha Cropping intensity 200% Farm gate price $387/t Production cost $261/t
Incremental Subproject Output – Other Crops Without project (2015) Yield 14.9 t/ha Cropping intensity 100% Farm gate price $324/t Production cost $130/t With project (year 7 - 2022) Yield 20.5 t/ha Cropping intensity 100% Farm gate price $324/t Production cost $127/t
Sources: UIWRMSP PPTA, Engineering and Irrigation Report (Supplementary Appendix No. 1) and Agriculture Report (Supplementary Appendix No. 3).
F. Results of Economic Analysis 69. Economic Returns. The main quantifiable benefits of the subproject are the net incremental value of crop production and avoided crop damages due to flooding. Costs are similarly projected with investment costs falling in the first three years followed by annual maintenance expenditures in each subsequent year and periodic maintenance cost every seventh year of operation. To calculate the cash flow of net project economic benefits, the cost cash flow is subtracted from the benefit cash flow. This annual cost and benefit stream is determined to calculate the economic returns of the subproject. 70. The Taing Krasaing irrigation subproject is expected to be economically viable in that the calculated economic internal rate of return (EIRR) is 24.7% and the economic net present value (ENPV) of the investment is $16.4 million (when applying a discount rate of 12%). These strong

26
economic results are due to the substantial size of the economic benefit stream relative to the economic construction cost of $34.6 million or $3,215 per hectare of command area. 71. Variations in the base case scenario were likewise tested to determine the best possible project package and how changes in the technical scope will affect the economic returns. The results indicate that the exclusion of Tipou 1 and Tipou 2 will give a lower EIRR which means that more benefits will be given up with the non-implementation of these two sections. Significantly, the exclusion of Kokaoh shows a higher EIRR indicating that the possible exclusion of this section is actually more beneficial to the area in general. The reasons for the possible variation in technical scope are based on the following circumstances that may possibly happen during implementation:

27
Table 19: Possible Variations to the Technical Scope of the Base Scenario Variation Possible Issues in Implementation EIRR NPV
Base Case – inclusion of all sections
22.7% 12.7
Variation 1 – exclusion of Tipou 1
The land in this section is owned by private companies so the Government might decide to bypass this area and prioritize the farmer lands.
13.7% 1.9
Variation 2 – exclusion of Tipou 2
The elevation of this section is higher ranging from 2.5 to 5 meters. There is a need to pump the water to a reservoir in order to bring water to the farmers by gravity. Annual O&M costs are expected to be higher due to pumping costs.
14.3% 2.36
Variation 3 – exclusion of Kokaoh
There is a resettlement issue in the area. However, the technical proposal is to construct an underground freeflow piped canal to avoid the existing structures in the canal alignment.
24.4% 10.9
Variation 4 – exclusion of Tipou 2 and Kokaoh
Refer to variations 2 and 3. 12.8% 0.5
EIRR = economic internal rate of return, NPV = net present value
Source: PPTA Consultant.
72. Sensitivity Analysis. The reported economic returns of the subproject are based upon the assumption that costs and benefits over the life of the project will be as calculated. The future, of course, may be affected by a number of unforeseen events which can adversely change the expected result. It is useful to examine particular risks and check the impact they may make to the economic returns of the project. Some of these risks include the following: 73. Increase in Investment Cost: Care has been taken to accurately estimate the cost of the Taing Krasaing irrigation system. One of the sensitivity tests undertaken involves the possibility of actual cost being higher than the estimated cost. To determine the vulnerability of economic returns to higher construction costs, a 10% increase in costs was included in the estimation. This cost increase causes the EIRR to fall to 20.2%, a decline of 2.5% from the base EIRR. The sensitivity indicator for this level of cost increase is 1.58, while the level of increase at which the EIRR would fall below the acceptable 12% level (the switching value)15 is at 63%. 74. Increase in O&M cost: Similar to investment costs, the possibility of O&M costs increasing than what was estimated may occur in the future. A test of the impact of a 10% increase in costs was done to determine how vulnerable the resulting EIRR to such an increase. The cost increase causes a very insignificant change in EIRR with a sensitivity factor of 0.23 and switching value of 434%.
15
The switching value is the percent change in the risk variable that will make the EIRR fall to the level of the opportunity cost of capital (which is assumed to be 12%).

28
75. Decrease in Overall Benefits: An overall decline in total benefits by 10% was also tested defining no particular factor. With this general assumption, EIRR would fall to 19.5%, still above the required 12% threshold level. Sensitivity factor is -3.11 and switching value is -32%. 76. Decrease in Command Area: If the benefitted area of the Taing Krasaing system were not to reach its anticipated level of 9,869 ha, the economic returns can be expected to decrease from the base-case level. A 10% decrease in the command area drops the EIRR to 21.5% and ENPV to $10.9 million. 77. Decrease in Cropping Intensity: With available irrigation water, cropping intensity is expected to increase in the “with project” situation. However, in case this decreases by 10%, EIRR would decrease to 18.1% and ENPV to $7.0 million. 78. Decrease in Yield Increment: The average paddy rice yield when progressing from rainfed to irrigation water has been assumed to increase from 1.5 t/ha to 4 t/ha. If this increment were to decrease by 10%, the EIRR would drop to 20.7% and ENPV to $9.8 million. 79. Increase in Price of Crops: Rice prices are assumed to change over time along the lines predicted by the World Bank commodity price projections. Any drop in prices can affect future cash flow and project returns can be expected to fall. A 10% drop in price of paddy rice and other crops causes the EIRR to fall to 12.7% and ENPV to $0.8 million. 80. Benefits delayed by two years: Any delay in implementation schedule can impact on the benefits materializing for target beneficiaries. An assumed two-year delay will decrease EIRR and ENPV to 14.5% and $3.9 million, respectively. 81. Decrease in cultivated area: If the cultivated area were to decrease by 10% from the base-case level, EIRR will decrease to 20.9%. The sensitivity factor is at -1.4 while the switching value is at -73%. 82. Decrease in project life: The project is originally assumed at 25 years but if this will decrease to say 5 years, then EIRR drops to 10.0% which is below the assumed opportunity cost of 12%.. 83. Decrease in cultivated area and project life: A simultaneous change in cultivated area and project life will adversely affect the result, dropping the EIRR to 6.7% which is below the assumed opportunity cost of 12%. 84. The level of economic returns, along with the results of the sensitivity analysis of various risks, indicates that the Taing Krasaing subproject investment is likely to pay for itself. However, a decrease in the project life puts EIRR below 12%, more so if this will be combined with other risks mentioned above.
29
Table 20: Summary Results of Base Case and Sensitivity Tests
Results of Evaluation Change NPV EIRRSensitivity
Indicator
Switching
Value
Base Case 12.7 22.7%
Sensitivity Scenarios
Case 1 - Increase in Capital Costs 10% 10.7 20.2% 1.6 63%
Case 2 - Increase in O&M Costs 10% 12.4 22.4% 0.2 434%
Case 3 - Decrease in overall benefit -10% 8.7 19.5% -3.1 -32%
Case 4 - Decrease in command area -10% 10.9 21.5% -1.4 -71%
Case 5 - Decrease in cropping intensity -10% 7.0 18.1% -4.4 -23%
Case 6 - Decrease in yield increment -10% 9.8 20.7% -2.3 -44%
Case 7 - Decrease in price of rice -10% 0.8 12.7% -9.4 -11%
Case 8 - Decrease in cultivated area -10% 10.9 20.9% -1.4 -73%
Case 9 - Decrease in project life (no. of years) 5 (0.9) 10.0%
Case 10 - Combination of cases 8 & 9 (2.5) 6.7%
Case 11 - Benefits delay by 2 years 3.9 14.5%
SI = sensitivity indicator (ratio of % change in IRR above the cut-off rate to percentage change in selected variable).
SV = switching value (percentage change in selected variable to reduce the IRR to cut-off rate). Source: PPTA Consultant.
G. Financial Household Returns 85. As an impact of the project, it was estimated that farmer households in Taing Krasaing will gain a significant increase in their net revenue from paddy rice production of about $658/farmer household/year based on an average landholding of 1.5 has. 86. Without the project, the farmer households are getting a yield of 1.5 tons/ha at average farm gate price of $300/ton. This gives a farmer household an average net annual revenue of $360 or $30 per month.16 With the implementation of the project, the yield is projected to increase to 3 tons/ha. Average farm gate price of paddy rice is likewise expected to increase to $500/ton with the use of good quality seeds. Based on the average landholding, the projected average net annual revenue of farmer households is $1.018 or $85 per month. 87. Furthermore, starting at year seven of the subproject, an estimated 181,870 incremental labor days valued at $0.91 million will be required annually in the production of paddy rice and other crops. H. Benefit Distribution and Poverty Impacts 88. The subproject will directly benefit 11,686 farmers in four communes in Santuk District where the Taing Krasaing irrigation system is located. It will directly affect 91% of the population that derive their main income from rice and vegetable crops. Poverty finds its roots on this source of income because of its dependence on a lot of factors (irrigation, agriculture inputs and technology, efficient water management, sufficiency of water at the source, type of soil, weather condition) thus providing insufficient opportunity for farmers to have sufficient and stable income to meet their needs. The main factors that cause poverty which are identified by the people in the project areas are the poor soil condition, lack of water in the canal for irrigation of crops
16
UIWRMSP PPTA Report on Poverty and Socio-Economic Condition (Supplementary Document 16).

30
during the dry season, people do not use the appropriate agriculture technologies, and lack of job opportunities in the locality.17 89. The implementation of the project will try to tackle these factors that cause poverty by enhancing agricultural and rural economic productivity through increased efficiency of irrigation systems and improved management of water resources. The subproject will help decrease the poverty rates in the four communes which range from 24% to 39%.18 90. Project sustainability is strongly affected by who benefits, and by how much, relative to who pays. Main beneficiary groups or stakeholders for this subproject are identified as the government, local economy, labor sector and the farmers. The distribution of the economic benefits and costs over and above financial revenues and expenses are estimated to determine the extent to which public investment policy can affect the share that the various sectors derive from the project. The following table on benefit distribution shows the result of this analysis:
17
Focus Group Discussion (FGD) conducted in Taining Krasaing and Prek Chik. 18
Ministry of Planning. 2012. Poverty Reduction by Capital, Provinces, Municipalities, Districts, Khans and Communes, Sangkat. Phnom Penh.

31
Table 21: Distribution of Economic Benefits
Total Project Benefits 1.5 43.6 42.1 42.1
Project Costs
Traded 2.0 2.7 0.8 (0.8)
Unskilled labor 1.8 1.6 (0.2) 0.2
Non-traded 11.5 9.5 (1.9) 1.9
Total Project Costs 15.2 13.9
Net Benefits (Losses) (13.7) 29.7 43.4 (13.7)
Benefits (Losses) (13.7) 1.1 0.2 42.1
Financial
Present
Value
Economic
Present
Value
Economic
minus
Financial
Government Economy Labor Farmers
Source: PPTA Consultant.
91. Another analysis was undertaken to determine the impact of the subproject to the poor sector of the community. The particular focus on net benefits that go to the poor is pertinent in this agricultural project. Computed poverty impact ratio (PIR) for this subproject is 30%. Details are presented in the following table:
Table 22: Poverty Impact
Gov't. /
Particulars Economy Labor Community Total
Benefits (Losses) 1.13 0.24 42.06 43.43
Financial Return to Government (13.72) (13.72)
Total Benefits (Losses) (12.58) 0.24 42.06 29.71
Proportion of Poor (%) 0.30 0.67 0.30
Benefits to Poor (3.73) 0.16 12.48 8.90
Poverty Impact Ratio (%) 30.0%
I. Conclusion 92. The proposed Taing Krasaing irrigation system is expected to make important contributions to the local economy, increasing paddy production and household income significantly. The scheme is economically viable. It will also play a role in the commercialization of rice production. Its expected 52,166 tons per year of incremental paddy production will almost certainly all be marketed given that the local population already has more than enough for its own consumption. Similarly, crop diversification has high potentials for other crops such as cassava, corn, mungbean, pineapple and watermelon have high potentials and will provide good production value to the farmers.
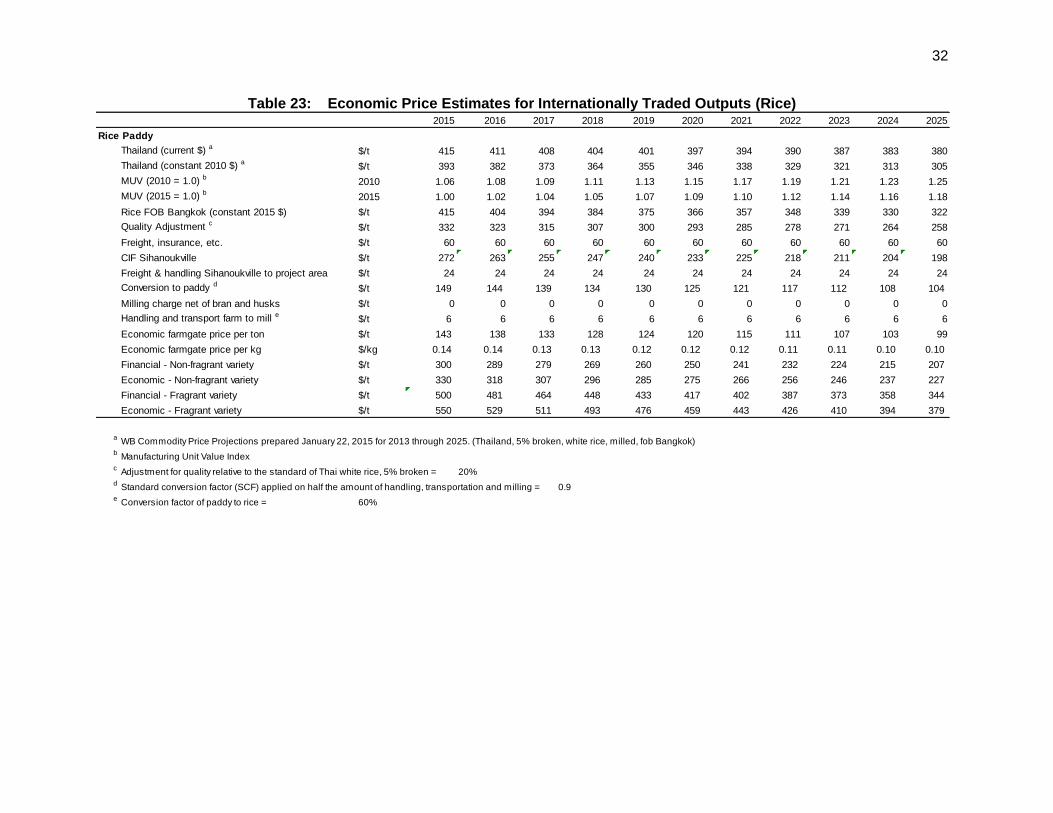
32
Table 23: Economic Price Estimates for Internationally Traded Outputs (Rice) 2015 2016 2017 2018 2019 2020 2021 2022 2023 2024 2025
Rice Paddy
Thailand (current $) a$/t 415 411 408 404 401 397 394 390 387 383 380
Thailand (constant 2010 $) a$/t 393 382 373 364 355 346 338 329 321 313 305
MUV (2010 = 1.0) b2010 1.06 1.08 1.09 1.11 1.13 1.15 1.17 1.19 1.21 1.23 1.25
MUV (2015 = 1.0) b2015 1.00 1.02 1.04 1.05 1.07 1.09 1.10 1.12 1.14 1.16 1.18
Rice FOB Bangkok (constant 2015 $) $/t 415 404 394 384 375 366 357 348 339 330 322
Quality Adjustment c$/t 332 323 315 307 300 293 285 278 271 264 258
Freight, insurance, etc. $/t 60 60 60 60 60 60 60 60 60 60 60
CIF Sihanoukville $/t 272 263 255 247 240 233 225 218 211 204 198
Freight & handling Sihanoukville to project area $/t 24 24 24 24 24 24 24 24 24 24 24
Conversion to paddy d$/t 149 144 139 134 130 125 121 117 112 108 104
Milling charge net of bran and husks $/t 0 0 0 0 0 0 0 0 0 0 0
Handling and transport farm to mill e$/t 6 6 6 6 6 6 6 6 6 6 6
Economic farmgate price per ton $/t 143 138 133 128 124 120 115 111 107 103 99
Economic farmgate price per kg $/kg 0.14 0.14 0.13 0.13 0.12 0.12 0.12 0.11 0.11 0.10 0.10
Financial - Non-fragrant variety $/t 300 289 279 269 260 250 241 232 224 215 207
Economic - Non-fragrant variety $/t 330 318 307 296 285 275 266 256 246 237 227
Financial - Fragrant variety $/t 500 481 464 448 433 417 402 387 373 358 344
Economic - Fragrant variety $/t 550 529 511 493 476 459 443 426 410 394 379
aWB Commodity Price Projections prepared January 22, 2015 for 2013 through 2025. (Thailand, 5% broken, white rice, milled, fob Bangkok)
bManufacturing Unit Value Index
cAdjustment for quality relative to the standard of Thai white rice, 5% broken = 20%
dStandard conversion factor (SCF) applied on half the amount of handling, transportation and milling = 0.9
eConversion factor of paddy to rice = 60%

33
Table 24a: Economic Price Estimates for Internationally Traded Inputs (Urea) 2015 2016 2017 2018 2019 2020 2021 2022 2023 2024 2025
Urea
Eastern Europe (current $) a$/t 300 298 296 294 292 290 288 286 284 282 280
Eastern Europe (constant 2010 $) a$/t 284 277 270 264 258 253 247 241 236 230 225
MUV (2010 = 1.0) b2010 1.06 1.08 1.09 1.11 1.13 1.15 1.17 1.19 1.21 1.23 1.25
MUV (2015 = 1.0) b2015 1.00 1.02 1.04 1.05 1.07 1.09 1.10 1.12 1.14 1.16 1.18
Urea FOB Eastern Europe (constant 2015 $) $/t 300 292 286 279 273 267 261 255 249 243 237
Freight, insurance, etc. $/t 60 60 60 60 60 60 60 60 60 60 60
CIF Sihanoukville $/t 360 352 346 339 333 327 321 315 309 303 297
Freight & handling Sihanoukville to project area $/t 24 24 24 24 24 24 24 24 24 24 24
Handling and transport to farmgate c$/t 6 6 6 6 6 6 6 6 6 6 6
Economic farmgate price per ton $/t 389 382 375 369 362 356 350 344 338 332 327
Economic farmgate price per kg $/t 0.39 0.38 0.38 0.37 0.36 0.36 0.35 0.34 0.34 0.33 0.33
aWB Commodity Price Projections prepared January 22, 2015 for 2013 through 2025. (Bagged, f.o.b. Eastern Europe (varying origins)
bManufacturing Unit Value Index
cStandard conversion factor (SCF) applied on half of handling and transportation cost = 0.9

34
Table 24b: Economic Price Estimates for Internationally Traded Inputs (DAP) 2015 2016 2017 2018 2019 2020 2021 2022 2023 2024 2025
DAP (diammonium phosphate)
US (current $) a$/t 450 449 448 447 446 445 444 443 442 441 440
US (constant 2010 $) a$/t 426 417 409 402 395 388 381 374 367 360 353
MUV (2010 = 1.0) b2010 1.06 1.08 1.09 1.11 1.13 1.15 1.17 1.19 1.21 1.23 1.25
MUV (2015 = 1.0) b2015 1.00 1.02 1.04 1.05 1.07 1.09 1.10 1.12 1.14 1.16 1.18
DAP FOB US Gulf (constant 2015 $) $/t 450 441 433 425 417 410 402 395 388 380 373
Freight, insurance, etc. $/t 60 60 60 60 60 60 60 60 60 60 60
CIF Sihanoukville $/t 510 501 493 485 477 470 462 455 448 440 433
Freight & handling Sihanoukville to project area $/t 24 24 24 24 24 24 24 24 24 24 24
Handling and transport to farmgate c$/t 6 6 6 6 6 6 6 6 6 6 6
Economic farmgate price per ton $/t 539 530 522 514 507 499 492 484 477 470 462
Economic farmgate price per kg $/t 0.54 0.53 0.52 0.51 0.51 0.50 0.49 0.48 0.48 0.47 0.46
aWB Commodity Price Projections prepared January 22, 2015 for 2013 through 2025. (Standard size, bulk, spot, f.o.b. US Gulf)
bManufacturing Unit Value Index
cStandard conversion factor (SCF) applied on half the amount of handling & transportation = 0.9

35
Table 25: Command Area Land Use With and Without the Project: Taing Krasaing, Kampong Thom Province 2016 2017 2018 2019 2020 2021 2022 2023 2024 2025 2030 2040
Land Area (has.)
By Commune
Tipou 1 2,664 2,664 2,664 2,664 2,664 2,664 2,664 2,664 2,664 2,664 2,664 2,664
Tipou 2 2,989 2,989 2,989 2,989 2,989 2,989 2,989 2,989 2,989 2,989 2,989 2,989
Cavac Taing Krasaing 1,370 1,370 1,370 1,370 1,370 1,370 1,370 1,370 1,370 1,370 1,370 1,370
Chroab 855 855 855 855 855 855 855 855 855 855 855 855
Korkoah 1,991 1,991 1,991 1,991 1,991 1,991 1,991 1,991 1,991 1,991 1,991 1,991
Subtotal 9,869 9,869 9,869 9,869 9,869 9,869 9,869 9,869 9,869 9,869 9,869 9,869
By Cultivated Crop
Paddy Rice 8,882 8,882 8,882 8,882 8,882 8,882 8,882 8,882 8,882 8,882 8,882 8,882
Other Crops 987 987 987 987 987 987 987 987 987 987 987 987
Subtotal 9,869 9,869 9,869 9,869 9,869 9,869 9,869 9,869 9,869 9,869 9,869 9,869
Command Area Land Use (has.)
Without project
Wet Season
Paddy Rice 3,618 3,618 3,618 3,618 3,618 3,618 3,618 3,618 3,618 3,618 3,618 3,618
Fallow 6,252 6,252 6,252 6,252 6,252 6,252 6,252 6,252 6,252 6,252 6,252 6,252
Subtotal 9,869 9,869 9,869 9,869 9,869 9,869 9,869 9,869 9,869 9,869 9,869 9,869
Dry Season
Paddy Rice - - - - - - - - - - - -
Other Crops 493 493 493 493 493 493 493 493 493 493 493 493
Fallow 9,376 9,376 9,376 9,376 9,376 9,376 9,376 9,376 9,376 9,376 9,376 9,376
Subtotal 9,869 9,869 9,869 9,869 9,869 9,869 9,869 9,869 9,869 9,869 9,869 9,869
With project
Wet Season
Paddy Rice 3,618 3,618 3,618 8,882 8,882 8,882 8,882 8,882 8,882 8,882 8,882 8,882
Fallow 6,252 6,252 6,252 987 987 987 987 987 987 987 987 987
Subtotal 9,869 9,869 9,869 9,869 9,869 9,869 9,869 9,869 9,869 9,869 9,869 9,869
Dry Season
Paddy Rice - - - 1,962 5,651 6,899 8,403 8,882 8,882 8,882 8,882 8,882
Other Crops 493 493 493 395 592 790 987 987 987 987 987 987
Fallow 9,376 9,376 9,376 7,513 3,626 2,181 480 - - - - -
Subtotal 9,869 9,869 9,869 9,869 9,869 9,869 9,869 9,869 9,869 9,869 9,869 9,869

36
Table 26: Crop Yield and Intensity – With and Without the Project: Taing Krasaing, Kampong Thom Province 2016 2017 2018 2019 2020 2021 2022 2023 2024 2025 2030 2040
Crop Yield (t/ha)
Without project
Wet Season
Paddy Rice 1.5 1.5 1.5 1.5 1.5 1.5 1.5 1.5 1.5 1.5 1.5 1.5
Dry Season
Paddy Rice - - - - - - - - - - - -
Other Crops 14.9 14.9 14.9 14.9 14.9 14.9 14.9 14.9 14.9 14.9 14.9 14.9
With project
Wet Season
Paddy Rice 1.5 1.5 1.8 2.1 2.4 2.4 2.7 3.0 3.0 3.0 3.0 3.0
Dry Season
Paddy Rice - - 2.5 2.5 3.2 3.2 4.0 4.0 4.0 4.0 4.0 4.0
Other Crops 14.9 14.9 14.9 20.5 20.5 20.5 20.5 20.5 20.5 20.5 20.5 20.5
Cropping Intensity (%)
Without project
Wet Season
Paddy Rice 100% 100% 100% 100% 100% 100% 100% 100% 100% 100% 100% 100%
Dry Season
Paddy Rice 0% 0% 0% 0% 0% 0% 0% 0% 0% 0% 0% 0%
Other Crops 100% 100% 100% 100% 100% 100% 100% 100% 100% 100% 100% 100%
With project
Wet Season
Paddy Rice 100% 100% 100% 100% 100% 100% 100% 100% 100% 100% 100% 100%
Dry Season
Paddy Rice 100% 100% 100% 100% 100% 100% 100% 100% 100% 100%
Other Crops 100% 100% 100% 100% 100% 100% 100% 100% 100% 100% 100% 100%

37
Table 27: Crop Production Volume (in tons) and Value ($ million) Without and With Project: Taing Krasaing, Kampong Thom Province
2016 2017 2018 2019 2020 2021 2022 2023 2024 2025 2030 2040
Total Crop Production (tons)
Without project
Wet Season
Paddy Rice 5,426 5,426 5,426 5,426 5,426 5,426 5,426 5,426 5,426 5,426 5,426 5,426
Dry Season
Paddy Rice - - - - - - - - - - - -
Other Crops 7,333 7,333 7,333 7,333 7,333 7,333 7,333 7,333 7,333 7,333 7,333 7,333
With project
Wet Season
Paddy Rice 5,426 5,426 6,512 18,652 21,317 21,317 23,982 26,646 26,646 26,646 26,646 26,646
Dry Season
Paddy Rice - - - 4,904 18,082 22,075 33,610 35,528 35,528 35,528 35,528 35,528
Other Crops 7,333 7,333 7,333 8,093 12,139 16,185 20,231 20,231 20,231 20,231 20,231 20,231
Economic Farmgate Price ($/ton)
Rice
Without project 289 279 269 260 250 241 232 224 215 207 207 207
With project 481 464 448 433 417 402 387 373 358 344 344 344
Other crops 324 324 324 324 324 324 324 324 324 324 324 324
Gross Crop Production ($ mil)
Without project
Wet Season
Paddy Rice 1.57 1.51 1.46 1.41 1.36 1.31 1.26 1.21 1.17 1.12 1.12 1.12
Dry Season
Paddy Rice - - - - - - - - - - - -
Other Crops 2.38 2.38 2.38 2.38 2.38 2.38 2.38 2.38 2.38 2.38 2.38 2.38
With project
Wet Season
Paddy Rice 1.57 1.51 2.92 8.07 8.90 8.58 9.29 9.93 9.55 9.17 9.17 9.17
Dry Season
Paddy Rice - - - 2.12 7.55 8.88 13.02 13.24 12.73 12.23 12.23 12.23
Other Crops 2.38 2.38 2.38 2.62 3.93 5.24 6.55 6.55 6.55 6.55 6.55 6.55

38
Table 28: Incremental Crop Production – With and Without the Project: Taing Krasaing, Kampong Thom Province 2016 2017 2018 2019 2020 2021 2022 2023 2024 2025 2030 2040
Production Cost ($ mil)
Without project
Wet Season
Paddy Rice 0.68 0.68 0.68 0.67 0.67 0.67 0.67 0.66 0.66 0.66 0.66 0.66
Dry Season
Paddy Rice - - - - - - - - - - - -
Other Crops 0.95 0.95 0.95 0.95 0.95 0.95 0.95 0.95 0.95 0.95 0.95 0.95
With project
Wet Season
Paddy Rice 0.68 0.68 1.71 4.89 5.58 5.58 6.27 6.96 6.95 6.95 6.95 6.95
Dry Season
Paddy Rice - - - 1.29 4.74 5.78 8.79 9.28 9.27 9.26 9.26 9.26
Other Crops 0.93 0.93 0.93 1.03 1.54 2.05 2.57 2.57 2.57 2.57 2.57 2.57
Net Value of Crop Production ($ mil)
Without project
Wet Season
Paddy Rice 0.89 0.83 0.78 0.74 0.69 0.64 0.60 0.55 0.51 0.46 0.46 0.46
Dry Season
Paddy Rice - - - - - - - - - - - -
Other Crops 1.42 1.42 1.42 1.42 1.42 1.42 1.42 1.42 1.42 1.42 1.42 1.42
With project
Wet Season
Paddy Rice 0.89 0.83 1.21 3.18 3.31 3.00 3.02 2.97 2.60 2.22 2.22 2.22
Dry Season
Paddy Rice - - - 0.84 2.81 3.10 4.23 3.96 3.46 2.97 2.97 2.97
Other Crops 1.45 1.45 1.45 1.59 2.39 3.19 3.99 3.99 3.99 3.99 3.99 3.99
Incremental Value of Net Crop Production ($ mil)
Wet Season
Paddy Rice - - 0.43 2.44 2.62 2.35 2.42 2.42 2.09 1.76 1.76 1.76
Dry Season
Paddy Rice - - - 0.84 2.81 3.10 4.23 3.96 3.46 2.97 2.97 2.97
Other Crops 0.02 0.02 0.02 0.17 0.97 1.77 2.56 2.56 2.56 2.56 2.56 2.56
Total 0.02 0.02 0.45 3.45 6.40 7.23 9.22 8.95 8.11 7.29 7.29 7.29

39
Table 29: Benefit Savings from Avoided Flood Damages: Taing Krasaing, Kampong Thom Province 2016 2017 2018 2019 2020 2021 2022 2023 2024 2025 2040
Flooded Area
Flooding incidence - once in 5 years 5 5 5 5 5 5 5 5 5 5 5
Area affected (has.) 1,590 1,590 1590 1590 1590 1590 1590 1590 1590 1590 1590 1590
Ave. rice production per hectare (t/ha) 1.5 1.5 1.5 1.5 1.5 1.5 1.5 1.5 1.5 1.5 1.5 1.5
Economic price of rice per ton ($/t) 289 279 269 260 250 241 232 224 215 207 207
Economic price of rice per hectare ($/ha) 433 418 403 389 376 362 349 335 323 310 310
Percentage of rice damaged by flood 70% 70% 70% 70% 70% 70% 70% 70% 70% 70% 70% 70%
Total crop production lost ($) 482,055 465,211 449,076 433,295 418,047 402,975 388,081 373,365 359,003 344,818 344,818
Annual crop production lost ($ mil) 0.10 0.09 0.09 0.09 0.08 0.08 0.08 0.07 0.07 0.07 0.07
Table 30: Economic Opportunity Cost of Land: Taing Krasaing, Kampong Thom Province
2016 2017 2018 2019 2020 2021 2022 2023 2024 2025 2040
Economic opportunity cost of land
Total area required (has.) 34.2 14.3 34.2 34.2 34.2 34.2 34.2 34.2 34.2 34.2 34.2 34.2
Ave. rice production without project (t/ha) 1.5 1.5 1.5 1.5 1.5 1.5 1.5 1.5 1.5 1.5 1.5 1.5
Economic price of rice per ton ($/t) 289 279 269 260 250 241 232 224 215 207 207
Economic price of rice per hectare ($/ha) 433 418 403 389 376 362 349 335 323 310 310
Total crop production lost ($ mil) 0.01 0.01 0.01 0.01 0.01 0.01 0.01 0.01 0.01 0.01 0.01

40
Table 31: Result of Economic Evaluation: Taing Krasaing, Kampong Thom Province ($ million) 2016 2017 2018 2019 2020 2021 2022 2023 2024 2025 2030 2040
Costs
Investment cost 1.59 3.17 3.17 7.93 11.11 4.76 - - - - - -
Regular O&M cost - - 0.47 0.47 0.47 0.47 0.47 0.47 0.47 0.47 0.47 0.47
Periodic maintenance cost - - - - - - - - - 6.97 - -
Opportunity cost of land 0.01 0.01 0.01 0.01 0.01 0.01 0.01 0.01 0.01 0.01 0.01 0.01
Total Costs 1.59 3.19 3.66 8.42 11.59 5.25 0.49 0.49 0.49 7.46 0.49 0.49
Benefits
Increased production from farmlands 0.02 0.02 0.45 3.45 6.40 7.23 9.22 8.95 8.11 7.29 7.29 7.29
Savings from flood damages - - 0.09 0.09 0.08 0.08 0.08 0.07 0.07 0.07 0.07 0.07
Total Benefits 0.02 0.02 0.54 3.54 6.49 7.31 9.30 9.02 8.19 7.36 7.36 7.36
Net Cash Flow (Base Case) (1.57) (3.17) (3.12) (4.89) (5.11) 2.06 8.81 8.54 7.70 (0.10) 6.88 6.88
Sensitivity Tests:
Case 1 - Increase in Capital Costs (1.73) (3.48) (3.44) (5.68) (6.22) 1.58 8.81 8.54 7.70 (0.10) 6.88 6.88
Case 2 - Increase in O&M Costs (1.57) (3.17) (3.17) (4.93) (5.16) 2.01 8.77 8.49 7.65 (0.15) 6.83 6.83
Case 3 - Decrease in overall benefit (1.57) (3.17) (3.18) (5.24) (5.76) 1.33 7.88 7.63 6.88 (0.83) 6.14 6.14
Case 4 - Decrease in command area (1.57) (3.17) (3.05) (4.83) (5.14) 1.95 8.62 7.94 7.15 (0.60) 6.37 6.37
Case 5 - Decrease in cropping intensity (1.57) (3.17) (3.39) (5.45) (5.96) 1.13 7.69 7.44 6.70 (1.02) 5.69 5.69
Case 6 - Decrease in yield increment (1.57) (3.17) (3.12) (5.04) (5.35) 1.74 8.41 8.14 7.30 (0.50) 5.96 5.96
Case 7 - Decrease in price of rice (1.57) (3.16) (3.28) (5.80) (6.78) 0.15 6.28 5.91 5.16 (2.55) 4.42 4.42
Case 8 - Decrease in cultivated area (1.57) (3.17) (3.25) (5.30) (5.82) 1.27 8.23 8.38 7.58 (0.18) 6.80 6.80
Case 9 - Decrease in project life (no. of years) (1.57) (3.17) (3.12) (4.89) (5.11) 2.06 8.81 8.54 7.70 (0.10)
Case 10 - Combination of cases 8 & 9 (1.57) (3.17) (3.25) (5.30) (5.82) 1.27 8.23 8.38 7.58 (0.18)
Case 11 - Benefits delay by 2 years (1.59) (3.19) (3.66) (8.42) (11.06) (1.71) 6.00 6.82 8.81 1.56 6.88 6.88
Results of Evaluation Change NPV EIRRSensitivity
Indicator
Switching
Value
Base Case 12.7 22.7%
Sensitivity Scenarios
Case 1 - Increase in Capital Costs 10% 10.7 20.2% 1.6 63%
Case 2 - Increase in O&M Costs 10% 12.4 22.4% 0.2 434%
Case 3 - Decrease in overall benefit -10% 8.7 19.5% -3.1 -32%
Case 4 - Decrease in command area -10% 10.9 21.5% -1.4 -71%
Case 5 - Decrease in cropping intensity -10% 7.0 18.1% -4.4 -23%
Case 6 - Decrease in yield increment -10% 9.8 20.7% -2.3 -44%
Case 7 - Decrease in price of rice -10% 0.8 12.7% -9.4 -11%
Case 8 - Decrease in cultivated area -10% 10.9 20.9% -1.4 -73%
Case 9 - Decrease in project life (no. of years) 5 (0.9) 10.0%
Case 10 - Combination of cases 8 & 9 (2.5) 6.7%
Case 11 - Benefits delay by 2 years 3.9 14.5%
SI = sensitivity indicator (ratio of % change in IRR above the cut-off rate to percentage change in selected variable).
SV = switching value (percentage change in selected variable to reduce the IRR to cut-off rate).